ports as actors in industrial networks - imp group · ports as actors in industrial networks by...
TRANSCRIPT

Ports as Actors in Industrial Networks
by
Carl J. Hatteland
A dissertation submitted to BI Norwegian School of Management for the degree of Dr.Oecon
Series of Dissertations 6/2010
BI Norwegian School of Management Department of Strategy and Logistics

2
Carl J. Hatteland Ports as Actors in Industrial Networks © Carl J. Hatteland, 2010 Series of Dissertations 6/2010 ISBN: 978-82-8247-020-0 ISSN: 1502-2099 BI Norwegian School of Management N-0442 Oslo Phone: +47 4641 0000 www.bi.no Printing: Nordberg Trykk The dissertation may be ordered from our website www.bi.no (Research – Research Publications)

3
Abstract The purpose of this thesis is to consider how port authorities can be characterized as actors in industrial contexts. The thesis uses the Industrial Network Approach to avoid bringing in typical views of what a port is and hence to allow for alternative views and ideas about the port as an actor. Four case studies are used to assess and discuss how port authorities can be considered actors in industrial networks through the use of the Actor-Resource-Activity model. The Industrial Network Approach is empirical in nature, which facilitates the consideration of port authorities as actors in industrial contexts via assessing actual interactions. The first three cases are from the Norwegian ports of Karmsund, Aalesund and Grenland. The three examples combined suggest there are three overlapping dimensions through which port authorities can be characterized in industrial settings: the administrative, political and commercial dimensions respectively. Each of the three Norwegian cases emphasizes one of these dimensions. The fourth case, the Swedish Port of Gothenburg, complements the others by providing an example of the three dimensions operating simultaneously. The thesis argues that there is no automatic link between these dimensions and stating that a port authority is an actor in relation to companies in the industrial context of a port, however. This requires actual interaction between organisations to take place. Interaction is described in terms of the efforts of a port authority to engage with particular industrial counterparts in order to pool activities, combine resources and mobilise actors around utilisation of resources for the purpose of loading and unloading vessels in each particular port. This is referred to as bundling and wedging in the thesis. Overall, the main findings of the thesis are that (i) the industrial network Actor-Resource-Activity model can be used to investigate non-business actors in industrial settings and (ii) it is problematic for a port authority to as a non-business actor to actively intervene in an industrial context without creating wedges to interaction that leads to discrimination across users.
4
Acknowledgements Whereas the responsibility for the contents of this dissertation is mine, it would not have reached a final without the direct and indirect support of many to whom I can only offer my humblest and deepest felt gratitude. The NETLOG project awarded me the opportunity to pursue my research interest as well as offering an inspiring and also critical setting for this pursuit. To everyone associated with NETLOG and the logistics group at BI Norwegian School of Management; in particular Marianne Jahre, Håkan Håkansson, Debbie Harrison, Lars-Erik Gadde, Lars Huemer, Göran Persson and my fellow students in NETLOG; Per Engelseth, Lena E. Bygballe, Fahad Awaleh, Andreas Brekke, Ingunn Elvekrok and Bente Flygansvær- Thanks! Thanks also to Ivan Snehota and Dag Bjørnland for useful comments at the predoc. To Håkan and Marianne, my supervisor and co-supervisor/project leader respectively, in addition to your guidance, your outstanding generosity both at a professional, social and personal level represents some of the finest virtues of academia. I would also like to thank the wider IMP community for support and encouragement, in particular colleagues at NTNU, Chalmers and Uppsala. Thanks also to Arild Tjeldvoll and Anne Welle-Strand for your support and inspiration through discussions and allowing me in on BOSHMAN and SAMM, which furthermore introduced me to a great network of people in the Balkans, in particular Dijana Tiplic (Stanford University) and Damir Hodzic (University of Sarajevo). I also wish to thank BI and in particular the Department for Strategy and Logistics for its financial and social support over a long time. All the respondents across the 4 empirical cases in the thesis – thank you for your time and energy. Family and friends in Karmøy and elsewhere, which I had to leave for the purpose of this undertaking also deserves my sincerest gratitude. Lastly, thanks to Debbie, for practical and theoretical guidance, discussion and insurmountable amounts of patience and support. I managed to create a wedge of my own!

5
Table of contents ABSTRACT ................................................................................................... 3 ACKNOWLEDGEMENTS ............................................................................... 4 TABLE OF CONTENTS................................................................................... 5 LIST OF FIGURES AND TABLES ..................................................................... 8 1. PORTS .................................................................................................. 9
1.1 Prologue: Ports and port development in the Isle of K ............ 10 1.2 What ports exemplify or what is a port? ................................... 13
1.2.1 Quay, harbour and port ......................................................... 14 1.2.2 Seaways and shipping ........................................................... 15 1.2.3 Landside and industry ........................................................... 16 1.2.4 Notions of user ...................................................................... 17 1.2.5 Trade and exchange .............................................................. 18 1.2.6 Handling and services ........................................................... 20 1.2.7 Port Authority ....................................................................... 20 1.2.8 Government .......................................................................... 21
1.3 The port as an actor .................................................................. 22 1.4 The purpose of the thesis .......................................................... 24 1.5 Structure of the thesis ............................................................... 26
2. APPROACHING PORTS ....................................................................... 29
2.1 Motivation or axiology .............................................................. 29 2.1.1 Netlog, ports and actors ........................................................ 30
2.2 The choice of analytical approach ............................................ 31 2.2.1 The Industrial Network Approach and the ARA model ....... 32 2.2.2 Industrial networks, infrastructures and ports ....................... 34
2.3 A Case Study Research Design ................................................. 35 2.3.1 Case selection ....................................................................... 36 2.3.2 Data collection ...................................................................... 38 2.3.3 Data analysis ......................................................................... 39 2.3.4 Bias and Validity in Case Study Research ............................ 39
3. PORT LITERATURE AND THE ACTOR DIMENSION ............................. 41
3.1 Port literature: an introduction ................................................ 41 3.2 Port classification ..................................................................... 42
3.2.1 Functional port classifications .............................................. 42 3.2.2 Administrative port classifications ....................................... 43 3.2.3 Operative port classifications ................................................ 44
3.3 Ports in logistics systems .......................................................... 45 3.3.1 Port operations ...................................................................... 45

6
3.3.2 Port flows .............................................................................. 47 3.4 Actor ambivalence and agency ................................................. 49
4. PORTS AS INFRASTRUCTURE ............................................................. 51
4.1 The optimal allocation of given resources ................................ 51 4.1.1 Imperfect competition ........................................................... 52 4.1.2 Externalities .......................................................................... 52 4.1.3 Public goods .......................................................................... 52 4.1.4 Ports are actually public ........................................................ 53
4.2 Infrastructure and ports ............................................................ 53 4.2.1 Market failure and monopoly in ports .................................. 54 4.2.2 From provision to regulation and deregulation ..................... 55
4.3 Governing the leftovers and crossovers .................................... 56 4.4 The Actor Dimension ................................................................ 58
5. INDUSTRIAL NETWORKS: A TOOL FOR PORT ANALYSIS ................... 61
5.1 The industrial network approach: some background ............... 61 5.2 Actors, resources and activities - the layers of substance ........ 63
5.2.1 Joining layers of substance with functions ........................... 64 5.3 Industrial networks and ports ................................................... 65
5.3.1 Activity patterns, links and structures ................................... 65 5.3.2 Resource constellations, ties and collections ........................ 67
5.4 The port actor: pooling, combining and mobilising ................. 68 5.5 Summary ................................................................................... 70
6. THREE CASES OF PORTS .................................................................... 71
6.1 Norwegian ports ....................................................................... 71 6.1.1 Principles of port finance ...................................................... 72
6.2 Aalesund port ............................................................................ 74 6.2.1 Aalesund port authority ........................................................ 76 6.2.2 Activity patterns, links and structures ................................... 78 6.2.3 The port as an activity structure ............................................ 83 6.2.4 Resource collections, ties and constellations ........................ 86 6.2.5 The port actor ........................................................................ 90
6.3 Karmsund Port .......................................................................... 93 6.3.1 Activity patterns, links and structures ................................... 95 6.3.2 Resource constellations, ties and collections ........................ 99 6.3.3 The port actor and the port plan .......................................... 101
6.4 Grenland Port ......................................................................... 105 6.4.1 Two Grenland Port issues ................................................... 106 6.4.2 Activity patterns, links and structures ................................. 111 6.4.3 Resource constellations, ties and collections ...................... 112 6.4.4 Grenland Port Authority ..................................................... 113

7
7. DIMENSIONS OF THE PORT AUTHORITY AS AN ACTOR ................... 115 7.1 What activities shape port authorities? .................................. 115
7.1.1 Charging and maintenance .................................................. 115 7.1.2 Handling and renting .......................................................... 117
7.2 What resources shape port authorities? ................................. 119 7.3 What actor concerns shape port authorities? ......................... 120
7.3.1 Investing .............................................................................. 120 7.4 Three dimensions of the port authority ................................... 121 7.5 Features of the port authority as an actor .............................. 122
8. THREE OVERLAPPING DIMENSIONS: THE PORT OF GOTHENBURG CASE ........................................................................................................ 125
8.1 Port of Gothenburg: Some background .................................. 125 8.1.1 The need for bigger cranes .................................................. 127 8.1.2 The use-context of cranes ................................................... 128 8.1.3 Cranes and crane operations ............................................... 129 8.1.4 The bigger program: Fairways and dredging ...................... 129 8.1.5 The Maersk AE1-service .................................................... 130
8.2 The port organisation ............................................................. 131 8.2.1 Port authority ...................................................................... 132 8.2.2 Terminal operations ............................................................ 133
8.3 The port authority as an actor? .............................................. 136 8.3.1 The “non-discriminatory”, “non-actor” port authority ....... 138 8.3.2 Mobilising but not discriminating amongst users ............... 140 8.3.3 Bundling and wedging ........................................................ 141
9. IMPLICATIONS AND CONCLUSIONS .................................................. 143
9.1 Implications for ports .............................................................. 143 9.1.1 Pooling, combining and mobilising .................................... 144 9.1.2 Bundling and wedging ........................................................ 145 9.1.3 The port (as) actor – a summary ......................................... 147
9.2 Implications for the Industrial Networks Approach ............... 147 9.2.1 The importance and trouble with big users ......................... 149 9.2.2 The non-business actor in industrial networks .................... 151
9.3 Suggestions for future research .............................................. 151 REFERENCES ........................................................................................... 153 APPENDICES ............................................................................................ 163
Sources/interviews .............................................................................. 163 Aalesund Port .................................................................................. 163 Karmsund Port ................................................................................ 164 Grenland Port .................................................................................. 164 Gothenburg Port .............................................................................. 165
The outline used for all four types of NETLOG cases ........................ 166 Example of NETLOG case in Aalesund .............................................. 178 Example of NETLOG case in Grenland .............................................. 187

8
List of figures and tables
Figure 5-1: The interaction model
Figure 5-2: The Actor – Resource – Activity framework from Håkansson and Snehota (1995)
Figure 6-1: The Main Ports along the Norwegian Coastline
Figure 6-2: The movement of fish across quays in Aalesund Port District, 2001.
Table 6-3: Cargo/fish registered across 8 private quays (1,000 tonnes)
Figure 6-4: The Global Fish – Tsujino activity chain
Figure 6-5: The Global Fish activity pattern
Figure 6-6: An activity chain depicted in a diagram of nine Aalesund quays.
Table 6-7: Registered across Aalesund quays
Table 6-8: Value/volume fractions for landing of cod/pelagic fish species in four counties. (Fiskeristatistikk 2002-2003, SSB)
Figure 6-9: Karmsund Port District
Figure 7-1: The ARA model with the three dimensions illustrated
Figure 8-1: Swedish territories 1617-1660 (WHKLMA 2005)
Figure 8-2: A bundle as a reflection of interaction imposed on the port authority
Figure 8-3: The port authority as a non-actor in terms of the ARA model
Figure 9-1: Wedges having a relational basis

9
1. Ports In 165 B.C, the Roman Senate punished Rhodes – then the major trading centre in the eastern Mediterranean - for its ambivalent support in the third Macedon war (171-167 BC) by awarding Athens supervision of a harbour on the island of Delos. The senate’s condition that there were to be no port charges at Delos devastated Rhodes’ economy as revenues from trade plunged (Holland, 2003:79). Moreover, following extensive isolationist policies and withdrawal from further naval and commercial expeditions in the 16th century, China awarded Portugal exclusive access to harbour and trade in Macao as a window and border to further European cultural and economic expansion in the region (Villiers, 1980:69; Barreto 1998:22). In 1997, a port in Hudson Bay, Canada, was bought from the Canadian government by a private entrepreneur. The latter speculated that maritime passages across the Arctic will become ice-free in the foreseeable future. Significantly shortened maritime transport times between Asia, Europe and America in the future may yet again change the face of global transportation (Krauss et al., 2008). Ports connect geographical locations to flows of passengers and goods, and thereby to companies facilitating such flows. As such, they represent valuable resources that are made available to companies which directly underpin and facilitate flows of goods. Indeed, the geographical connection to flows is seen as a great potential for direct and indirect revenues and benefits to the general society surrounding a port. Society seeks control of ports in order to put in place adequate institutional and organisational arrangements to regulate and develop connections to it, and the related costs and benefits from flows of goods moved through ports. The port authority embodies one arrangement, which has emerged as an almost universal organisational model for managing ports and connections to flows of goods passing through ports (see for example Douglas, 1990:4-7). It is difficult to grasp what truly characterizes the port authority, both in general and as an actor in relation to companies that connect a geographical location to flows of goods, however. Why is this organisational arrangement so particularly suited for port management? Indeed, as Goss (1990b) asks: “Are port authorities necessary?” One important reason for this way of organising ports relates to a historical emphasis on the understanding of ports as a collective good. This understanding enables and constrains the port authority as an actor in relation to the companies that underpin flows of goods in some important dimensions. It has subsequently been moulded into the political, administrative and linguistic fabric of society to an extent that
10
makes it difficult to consider ports as a phenomenon in its own right, without simultaneously adopting a specific historical and theoretical construction. The port authority as an actor in relation to the companies that underpin flows of goods is the theme of this thesis. I use the industrial networks approach (INA) in order to gain a different perspective and insight into the characteristics of ports as actors. This first chapter considers what ports are in a general sense as well as some of the contexts within which ports appear. Section 1.1 below provides an empirical illustration of a particular port and its development.
1.1 Prologue: Ports and port development in the Isle of K
The Isle of K is characterized by the sea surrounding it and how the lives of those living locally are affected by it. It has been blessed with the sea providing opportunities for its inhabitants related to harvesting of marine species, transport and trade, oil and gas and related services. The maritime element has been an important driver for prosperity on the Isle of K throughout history. What the sea provides and how it is transformed into social and economic prosperity is paramount to any such society. The Isle of K example focuses on some aspects of this transformation, starting out from one important interface between sea and land; a port. The Isle of K has many harbours with quays where vessels load and unload, and where industries engage in various processes transforming what is loaded and unloaded into a large variety of outputs. The landing and processing of marine species has been and still is characteristic for some of these harbours. Vessels might furthermore come to seek shelter from the weather, for repair, for bunkers and supplies, re-crewing, etc., requiring related on-shore services. People and authorities in the Isle of K have worked from the assumption that there are two villages with harbours primarily based around fisheries. In addition, there are three or four other locations with harbours serving a mix of purposes. There are also several harbours with private and dedicated quay facilities, some of them large and of great importance to Isle of K and the wider region. In the beginning of the 1990s there were concrete plans to apply for status as national fishery port. This was based on an inter-municipal collaboration between the two Isle of K fishery harbours and a harbour area in a nearby town. Due to a set of circumstances it became clear that the cornerstone fishmeal factory in one of the harbours had major constraints in terms of justifying necessary investments for the future. Environmental challenges and technical seaward entrance difficulties in the harbour were two major

11
issues. Indeed, closing down the factory was an explicit option, in particular against the background of over-production in the industry. The serious implications closure would have for the future of local fisheries and community were evident. Hence, existing plans for an inter-municipal national fishery port were put aside. Instead, from 1994-1996 a new regional fishing industry structure appeared. Many of the most important fishing industry firms had re-located, and established production and trade from an industrial site on the opposite side of the island; the Isle of K Fishery Port. This was later awarded status as national fishery port. This was a big shift for the regional industry; for fisheries in particular, but also for local and regional authorities taking interest in the development of the local community and economy. An apparent unanimous focus was placed upon the development and utilisation of one particular entity, the Isle of K Fishery Port. Many political and administrative bodies saw a different role open up to them. The on- and offshore fishing industries were struggling with an array of new and partly different challenges than before. Many of the related industries had to adapt to a radically altered idea of an industry, a port and its industrial set up. The shift to the Isle of K Fishery Port required and inspired rethinking in a systematic and co-ordinated way. Prior to the establishment of the Isle of K Fishery Port, the possibilities to influence the local mode of maritime economic transformation were severely constrained. At this time, the role of local authorities was to attempt to align the interests of different agendas. The Isle of K Fishery Port came with a momentum for planning and organising, along what was perceived as a different development trajectory. In particular, local authorities saw the opportunity to take on a more co-ordinating role in encouraging and facilitating co-operative efforts to organise further development. Local authorities jointly devoted resources into developing the greater industrial area within which Isle of K Fishery Port was important. This corresponded with the needs of particular industries and actors that in a new location were less constrained by existing locally vested interests. The shift also mobilised other important local and regional industrial and financial actors. Furthermore, processes to involve and commit key national and industry level actors were initiated, developed and pursued. At first glance the port itself may not reveal much about the magnitude of the shift. Indeed, the move concerned only few companies at the start in 1995. The privately-owned fishmeal company initiating the process and a closely connected producer of white fish fillets moved. A promising marine biotech company established there, in order to benefit from easy access to
12
waste material from fishmeal production. So too did an international company using fishmeal as a main ingredient in the production of fodder for farmed fish. In addition, suppliers of services were established and links to existing industries were made more explicit. This meant that it was possible to market the port as a total entity to the (supplying) industrial fishing fleet. The fishmeal factory was soon merged with a consortium consisting of three other fishmeal factories on the west coast of Norway. The umbrella company was also heavily involved on the supply side of fisheries through its more institutional and regulative owner. The white fish fillet company consolidated via local ownership. The fishmeal consortium located production facilities for a subsidiary producing a more high value fishmeal for human consumption to Isle of K Fishery Port. An Icelandic firm bought the small marine biotech firm and took the name, patent and equipment back to Iceland. The fish fodder producer continued as before, but was for long periods supplied from other factories than its neighbour due to the supply policies of the fishmeal consortium. These policies changed and eventually long-term supply contracts were signed. The fishmeal consortium then encountered financial difficulties. A merger with another consortium was planned, but the merger failed and the consortium went bankrupt. Meanwhile, however, a series of events had made the white fish fillet producer a stronghold in the Isle of K Fishery Port, from which key actors were able to mobilise local forces that brought the fishmeal factory back into local hands. Alongside this business storyline, there are several parallel processes with regard to the change to natural gas as a primary energy source, changes related to supply of raw material and disagreements over the structure of the fishing fleet. Natural gas had from the start been replacing oil as energy source for process industry in Isle of K Fishery Port. Now this was used in a strategy to link up more industry and facilities in order to give rise to scale economies in the building of a natural gas transmission infrastructure in the region. The implications related to the competition for raw material between buyers in different locations along the west coast of Norway were also important, as part of a drive for building strong alliances within and between industries across counties. Plans to further develop available areas connected to Isle of K Fishery Port, and extensions related to a move of other passenger and goods transport quay and related facilities, were designed, discussed and agreed upon. A central regional port idea was forming. For local authorities this was only a first successful milestone in an agenda now turning towards the challenge of extending the port development process. Making the Isle of K Fishery Port a central node in a regional port network was now seen as key. This implied

13
attracting new businesses, establishing links to related industries, and connecting different industrial and political agendas. However, companies were reluctant to actively engage in processes demanding resources for a long-term political agenda of industrial and regional development. In sum, I have mentioned only a very few aspects involved in a story about the mode of economic transformation in the Isle of K starting out in the Isle of K Fishery Port. All of the aspects are related in some ways to port development and transformation of what is provided by the sea. As the story unfolds many actors and companies have been hooked off and on and off again. Some have not been granted dedicated space within the account, such as the inter-municipal port authority. In the end the account concerns national transport plans and arguments of an inter-regional political character. Throughout this account actors, resources and activities have been brought together, shaping a notion or idea of an organisational entity – a port, presented as if bestowed with an own agenda and the capacity to pursue it. There are strong indications of vigorous interaction amongst companies that underpin flows of goods passing through the port, attempts to co-ordinate activities and resources in ever-new constellations. There is little evidence, however, of any organisational core or central co-ordinating actor in this interaction. Indeed, the account develops without mention of a port authority in relation to the actors whose continuous interaction moulds the idea of a port. Does the port authority have a role as an actor in relation to this interaction and these actors at all, and if so, what characterizes this role?
1.2 What ports exemplify or what is a port?
A comprehensive understanding of ports and what phenomena ports exemplify is important for many reasons and from many perspectives. Ports are intuitively important for similar reasons to roads being important for vehicles and to tracks being important for trains. It is inconceivable in the foreseeable future that contemporary needs for transport would be served without the appropriate ports, roads or tracks. Society has an interest in and even a general responsibility for their provision, maintenance and development. There are several alternative ways to institutionalise this societal interest and responsibility, however. It is a mistake to consider government – in whatever available organisational arrangement - a natural, necessary or best organiser of such services. What makes the provision, maintenance and development of ports and other conventional public works a governmental

14
concern is an unresolved issue. What disrupts governmental concern, as for example through privatising conventional public services, is also an open question. One can reasonably ask why certain forms of provision, maintenance, development and organising of ports are opted for at certain times and conditions. The common answer usually touches upon the issue as to what ports shall be and to whom, and the general reason and argument is that ports constitute an important infrastructure or part thereof (Kessides, 1993: ix). For most purposes ports resemble a general idea of interfaces where the sea meets the land, and where vessels may load and unload passengers and cargo. It is distinct from any coastline by features facilitating loading and unloading, which is the basis for services rendered upon or by ports. In everyday language, ports are conceived of as anything from simple mooring devices in bays that provide shelter from rough sea and weather, to installations built for serving ships deployed in all kinds of traffic and industry. Indeed, the port concept is imbued with so many meanings that it has been considered unsuitable as basis for legislation (Norwegian Ministry of Fisheries, 2002b:21). Ports may, for simplicity, be considered present where vessels load, unload or seek shelter. It is common, nevertheless, to expect the presence of installations that facilitate loading and unloading of vessels. Of 1,116 ports handling goods and passengers in Europe, 324 handle more than 1 million tonnes of cargo (Notteboom et al., 2004:269). Clearly, the interaction amongst actors that moulds the character of these ports differs widely, which an understanding of ports need to reflect. As such, I propose a provisional working definition of ports that I consider reflects this variation: a port is defined by the constellation of elements that affect the utilisation of resources for the purpose of loading and unloading vessels. Below, eight general features of ports in general are considered. They illustrate some elements that affect the utilisation of resources for the purpose of loading and unloading vessels, and they give some indications as to what may characterize ports as actors.
1.2.1 Quay, harbour and port
The first general feature of a port to be considered is that of quays and harbours. A quay refers to “a landing-place usually built of stone or iron alongside which ships can be tied up for loading and unloading” (Oxford University Press, 1985). There are 7,000 to 9,000 quays along the

15
Norwegian coastline alone (Norwegian Ministry of Fisheries, 1996-97:ch. 5; 2002:12). Quays are usually located in a way that shelters or protects them and their users from rough sea and weather. Such locations are referred to as harbours. A harbour may be a natural “inlet from the sea” (Oxford University Press, 1985), or it may be “any sheltered body of water where boats or ships may moor or anchor”(Britannica Student Encyclopaedia, 2002). A harbour may also be “any part of a body of water and the manmade structures surrounding it that sufficiently shelters a vessel from wind, waves, and currents, enabling safe anchorage or the discharge and loading of cargo and passengers” (Encyclopaedia Britannica Online, 2002). The latter does not differentiate between structures that provide vessels with shelter and structures enabling loading and unloading. This distinction is implied in the understanding of ports as installations “built around a harbour with facilities for loading and unloading [such] vessels” (Britannica Student Encyclopaedia, 2002). Ports can also be understood in terms of demography, e.g. sites, villages or towns that host a harbour where vessels load and unload (Penguin, 2002:685). Ports are thus associated with settlements that connect landside and seaside installations and elements beyond the immediate quay area. Entities involved in the operation of installations that enable the loading and unloading of vessels are thereby important elements in defining ports. Furthermore, the port concept can refer to a wider territorial collection of quays and harbours. Such a territory may be referred to as a port district, but it may also refer to a port region or hinterland from which demand for port services is derived. Whereas the notion of a port district typically entails a specific organisational reference (e.g. a port authority with a legal mandate), port regions and hinterlands normally appear more diffuse in terms of organisational reference, authority and mandate. The important issue that is missing here is that ports are fairly meaningless if disconnected from quays and harbours. Ports are inherently connected to need for transport to and from somewhere and someone, and the connections to quays and harbours can clearly be affected by a port authority.
1.2.2 Seaways and shipping
Secondly, the seaways that connect and lead into ports are essential for what a port is. Seaways may be characterized by weather, current, geological, safety and territorial conditions. These have the potential to override all other aspects relating to ports. Some of these conditions appear beyond what

16
is normally thought of as under human control. All conditions may be temporarily or permanently dealt with, however. For example, channels are dredged to provide sufficient depth and width for passage, or buoys and navigation marks facilitate access to a port, both of which are traditionally associated with the responsibility of port authorities. Two closely connected aspects in seaways and shipping deserve special mention. One relates to vessels, the other to shipping. Vessels are getting bigger, in terms of length, width and depth. Increasing vessel sizes have crowded out many ports from sailing schedules. The typical example is container vessels, but the general trend applies across many types of vessels and their use. Indeed, the Isle of K example originated in constraints with regard to serving the industrial fishing fleet in a particular harbour. Bigger vessels require more space, not only at sea and in entering a port, but also at and beyond berth on each landside. They also tend to entail and also require more specialized and adapted installations on and beyond the quayside. Moreover, they require tailored connections to port hinterlands and forelands to deal with the flows of goods and passengers in order to justify and operate the deployed capital. These are tasks that would normally involve the port authority to a greater or lesser extent. Although it is still common to refer to a hinterland as if attached to a port, this is no longer as easy to accept as it once may have been. One reason relates to developments in the shipping industry. Vessels are part of distribution channels that connect and integrate forelands and hinterlands, with the shipping industry operating at both sides of the port. Whereas ports have been seen as an interface between sea and land (behind which was the port hinterland), ports may now be seen as an interface between sea and land beyond and behind which is the shipping industry and those involved in integrating and co-ordinating flows of goods and passengers. The extent to which shipping companies co-ordinate and integrate the need for transport across forelands and hinterlands is decisive for the use of seaways and ports. The growth of intermodal transportations solutions, and the increasing focus on door-to-door transport rather than port-to-port transport, has contributed to alter the position of and activities undertaken by ports in the transportation chain. The extent to which it is believed that ports can exert influence on this varies (see 3.2.4).
1.2.3 Landside and industry
The above implies that what goes on beyond and behind the immediate quay interface does not necessarily correspond to geography. Rather, the focus is on whether geography corresponds to what is required from industry to co-

17
ordinate and integrate channels for transport and trade. The use of a port for certain transport purposes may reflect such correspondence, but it would be spurious to assume that it had much to do with the particular port, although, and importantly, it may relate to technical qualities of a harbour, such as depth of fairways, and therefore to e.g. investments that can be undertaken in and by ports. To the extent shipping companies succeed in co-ordinating and integrating transport solutions with the needs of the landside industry, a port may benefit by being used. However, cargo loaded in one port destined for another port may be unloaded in a third port where it is re-loaded and transported by road, rail or another vessel to a final destination. Technical and organisational development, in particular with regard to intermodal transport solutions and the development of integrated transport chains change ports’ position in transport chains, and have an impact on e.g. employment, the breaking up of cargoes, which may take place outside the port itself, or at private terminals inside the port (e.g. UNCTAD, 2004). Ports can be characterized as being blind to both the commodities and their owners from which port activities derive. Styhre (2005: A-16) reports her findings from interviews with two port officials thus: “We do not have the bill of lading because the shipping lines wish to control flows and customers”, and “the size of our hinterland is hard to estimate, because the information is held by the shipping lines”. This is similar to what one port official stated during an interview for this thesis: “We have no connections to owners of goods”. The above indicates that concepts such as landside, hinterland and foreland, with industries and flows of goods that actually underpin ports, have become increasingly diffuse and complex. This makes it far more difficult, but even more important, for ports to become a party in relation to the interaction amongst actors that characterizes ports.
1.2.4 Notions of user
The fourth general feature of a port is that of the user. Which are the users of a port? In Norway the present notion of user dates back to 1738, when it was enshrined in law that port finances were to be kept separate from the finances of its state or municipal owners. This principle was established with the first port fee, the dredging fee, which was earmarked for port purposes. (Ministry of Fisheries, 2002:17) Port fees and revenues have, reinforced by a statue in 1894 (ibid), been separated from state or municipal

18
revenues. The port is supposedly a financially autonomous entity. Revenue generated upon ports can only be used for port purposes. Users may be considered as those which bring passengers or goods to and from port from the seaside, i.e. actors in sea transport. It is those users who pay fees and thereby finance port operations. The interpretation of the law is rather strict, implying that port revenue can only be justifiably used for purposes directly beneficial to users, i.e. actors involved in the operations of vessels. A practical implication is that facilities such as sheds cannot be financed by port revenue unless this is justified by the interests of vessels and the actors involved in their operation. If a shed is built, however, surplus revenue will go into the port piggy bank that is dedicated solely to port purposes. The port is thus constrained from expanding its operations to embrace also other user notions and their interests. There are numerous alternative candidates for the users of a port. Owners and operators of quays under the jurisdiction of a port authority do not qualify as port users, nor do any customers / suppliers of actors operating vessels. The port owner (state or municipality) supposedly represents all the interests of these ‘others’. The general idea is that those who are directly and indirectly affected in the territory represented by the owner have legitimate interests in the port, but only those that incur port fees are users. However, it is common as a practical alternative to think of users in terms of a community of actors that provide services to vessels. This notion is particularly prevalent when considering the importance of ports in terms of trade and exchange, especially for relevant local industries. One consequence of this is that the port may define important users itself. This is one aspect of being an actor: to identify counterparts towards whom to orient oneself. Whereas strictly regulated with regard to possibilities to act upon such users, this is an aspect where the reduced transparency of a more diffuse context offers port authorities a potential outlet for its acting capacity, but also challenges it in terms of becoming part of the information flow.
1.2.5 Trade and exchange
Fifthly, trade in general, and more specifically most international and inter-continental trade, relies on seaborne transport. Ports are essential for the continued internationalisation of trading patterns, especially as alternative transport faces various constrains. But ports are also important for the communities that directly or indirectly are affected by or affect them.

19
The general economic importance of ports is commonly expressed by referring to the share of a country’s trade, i.e. the imports and exports that pass through ports. For example, the EU Commission (2006:7-8) asserts, “90% of the EU’s external trade and over 40% of its internal trade” is transported by sea; “3.5 billion tonnes of cargo per year and 350 million passengers pass through European ports”. Ports and related services generate “an added value of about € 20 billion”. To take one country in particular, cargo movements passing through UK ports accounted for 95 % of the UK’s international freight tonnage and 75 % of the value in 1999. Therefore, according to Modern Ports: A UK Policy (Department of Environment, 2000:4), “ports serve the national interest, supporting the competitiveness of national and regional economies”. Furthermore, in Norway seaborne transport accounts for 95 % of all transport leaving or arriving in Norwegian territory (in tonne-kilometres) (Ministry of Fisheries, 2002b:87). The Committee for the Revision of the Port and Seaways Act (2002b:87) referred to port impact studies claiming that 10,000 employees are vulnerable to the fortunes of Larvik Port (10-15 % of the employment in that county). Disrupting port operations has the capacity to disrupt trade and economic activity in general. For example, a ten-day shutdown of port facilities on the US West Coast in the autumn of 2002 was estimated to “cost the US economy $ 1.94 billion a day” (Hall, 2004). It is fair to assume that disrupting port operations has far-reaching and widely dispersed effects, in particular in the short term. Just-in-time production does not easily lend itself to sudden and temporary shifts in nationwide stocking policies due to the disruption of port operations. A ten-day disruption does not imply that fewer cars or computers are sold, however. Port impact studies commonly make claims about how ports impact on local, regional and national economies through job creation and underpinning of economic activity, both directly and indirectly. However, ports also impact on local environment through pollution, congestion and tying up the use of property and resources for alternative use. This aspect has gained increased attention as opportunity costs and benefits from alternative use of traditional port sites have been emphasized. For example, Rotterdam, one of the largest ports in the world as measured by tonne-throughput, is claimed to be “responsible for nearly 20 % of the direct gross regional product in the port of Rotterdam region and is of considerable influence in the urban and regional economy” (Manshanden, Rutten and Kuipers, 2005). However, for both the port and city of Rotterdam, the relative contributions to the national economy have been declining. Combined with an increasing

20
focus on how negative aspects stick to host communities, problems in apprehending the beneficial aspects supposedly accruing from ports increases the socio-political conflict potential (ibid). Ports, as airports, have in this way become inter-regional and international actors. Ports are also actors in that they may represent or mediate between alternative notions of users.
1.2.6 Handling and services
The sixth feature of ports is that of handling and services. It is often thought that ports offer services to vessels, and that there may be many actors involved in offering such services. But ports offer services to vessels first and foremost by being accessible. Thereafter it is an issue of organising whether vessels handle themselves by loading and unloading goods or whether other actors provide such services. At least at the bigger ports, it is traditional for the port organisation to provide and organise the offering of services, often by leasing port facilities to private operators. A proposal to introduce a right to self-handling for vessels in the EU port directive has lately met substantial opposition, and failed being ratified twice. The provision of services to vessels does not necessarily have to come from landside actors like private operators or ports. A large proportion of the essential services are provided by vessels themselves and their operating companies, and also by host companies at an individual location. For example, in Norway most quays are private and the port itself offers a very limited set of services. In contrast, at the Port of Gothenburg in Sweden the port organisation is itself the dominant service provider. From being seen as an actor to which users were captive, ports can be seen as “pawns in the game” (Slack, 1993), depending on ports’ capacity to engage in interaction with actors whose activities and resources characterise the use of ports.
1.2.7 Port Authority
The roots to a modern concept of a distinct port authority can be traced to the Port of Liverpool (Mersey Docks and Harbour Board was created in the 1840s) and Port of London Authority (1908) in the UK. The first independent US agency with the word ‘authority’ in its title was the Port Authority of New York and Jersey (1921). Many of the patterns that later came to be associated with this kind of public authority were first seen in the Port Authority of New York and Jersey (Doig, 1993). The port authority is at present a dominant organisational design for port governance and management worldwide, but there are many variations within this design.

21
The Port Authority was envisaged as a body “guided only by principles of efficiency and the public interest” (ibid). It was further supposed to be strong and authoritative. Over time, the Port Authority became an inter-regional public body that could not issue taxes and that had no regulatory powers. It remained, in accordance with its initial ideas, insulated from direct involvement by politics. The idea was built on the belief that government power should be used to meet important social problems, and that co-operative planning rather than competition in the marketplace was vital. The Port Authority is a special case, both in terms of policy and business. It operates insulated from both and yet is heavily involved in both. Although the port authority design seems extremely resilient when applied to ports, its application in many other industries has withered away through deregulation. Remnants, in terms of historical limitations to the actor dimension, can usually be found in those industries where the design has faltered, due to the necessity to offer other companies (competitors) access to assets on equal terms, e.g. incumbent postal and telecommunication services.
1.2.8 Government
Lastly, ‘government’ can be considered as a feature of ports. Goss (1990:208) argues that ports “may generally be regarded as acting as a gateway through which goods and passengers are transferred between ships and the shore”. It implies that whatever is carried by sea, and whoever is involved in such carriage, can be addressed at or through ports. Therefore, it is interesting to consider who addresses what calls or passes through ports. The most prominent pursuer of such interests has been and remains government, both local and national. Attention to various governmental interests in ports cannot be avoided. Polanyi (1963) argues that trade in ancient societies took place at ports of trade where regulation or treaties determined prices rather than supply and demand. ‘Ports of trade’ is a well-documented economic institution and empirical phenomenon, which Polanyi exemplifies by the Babylonian kar. North (1977:709) argues Polanyi’s ports of trade exemplify the range of “substitutes for price-making markets of which families, firms, guilds, manors, trade unions, cooperatives, etc., are organizing institutions which allocate resources in place of markets”. Government is the principal institution of this kind with which policy (and also economic theory) has been occupied.

22
Furthermore, the purpose of the British exchequer Port Books from the 16th-17th century was to “prevent the evasion of customs duty”. (Andrews, 1956:119, 122) What was classified as port depended upon the types of goods and trades that were subject to taxation at any given time period. Often changes in the classification and definition of ports were made for the convenience of customs administration. (ibid) By being appointed by the king for fiscal purposes, the port concept denoted a “constitutional and administrative characteristic” that required delimitation that did not apply to the concepts of havens and creeks (Jarvis, 1959:455-457). The above accounts state that governments take an interest in ports for varying purposes and in various ways. This testifies that ports are present not only as a feature of economic interests attached to the actual loading and unloading, but also as a feature of governmentally-administered interests at the local, regional and national levels. In a local government perspective, interests are frequently expressed in terms of what makes ports attractive in a particular setting. The actual loading and unloading generates activities and corresponding revenue. Furthermore, ports provide local authorities with an outlet for industrial and economic policy. Hence a port may be used for indirect fiscal purposes as well as an instrument through which support to business in general may be channelled. This is often seen to result in competition between public authorities to attract industry and trade, the regulation of which result in organisational limitations that constrain the possibilities for port authorities to engage in substantive interaction with users.
1.3 The port as an actor
Section 1.2 discusses various dimensions by which ports can be considered as actors. What are the challenges that call for an alternative perspective on ports as actors, and what is required of an alternative perspective to provide further insight into ports and their conditions as actors amongst other actors in an industrial context? There are some forces that have reinforced the role of ports in safeguarding societal interests. For example, there is growing attention to environmental aspects and increased opportunity costs in terms of alternative and sustainable use of traditional port areas. However, several aspects point in a different direction. Not least there is increasing unitisation and integration of transport chains, which has challenged the societal and industrial position of the port over the latter part of the 20th century. Political and regulatory landscapes, both at a national and international level, have furthermore

23
changed in favour of privatising many traditional public sectors in this time period. The implication is that it is no longer necessarily appropriate to consider ports in the traditional sense as first and foremost an example of public infrastructure. Ports are as a consequence under scrutiny to separate resources and activities for which societal concern and public provision is required, from those that may be left to private companies. This presumably affects what kind of - and how much of an actor - a port is and can be, in relation to whom, when and under what conditions. It also impacts on which activities ports perform, and which technical and organisational resources ports may possess or access for the purpose of performing those activities. In other words, it questions what ports are and what they exemplify, how much ports are of something and to whom. In short, it challenges the historical and theoretical limitations imposed on ports as actors in relation to other actors, and it gives cause to ask what characterizes ports as actors at present and in the future. Against this background, it is necessary to approach ports as an empirical phenomenon where port authorities operate under a public mandate, but without adopting the corresponding historical and theoretical justification for that public mandate. It is necessary to consider ports in a non-traditional way in terms of both the character of the port as an actor and its relations to multiple contexts. As this thesis is specifically concerned with industrial actors – companies that underpin and facilitate flows of goods passing through ports – the character of the port as an actor in relation to other actors needs to derive from this particular context. It is a multi-layered challenge at a practical and political level, but also at a theoretical level, to grasp the implications of changing the perspective on ports. Ports represent convention as much as function. Nevertheless, several approaches address this challenge in various ways. They entail different possibilities and limitations with regard to the study of ports as actors in relation to other industrial actors. However, as I argue in chapter three, they maintain or do not deal with the existing assumptions about the character of the port as an actor in relation to other actors in an industrial context. The port actor - the port authority in this thesis - is typically ascribed a role corresponding to that of the function of a port. The port authority is responsible for providing, maintaining, developing and organising a port. The port is defined by the constellation of elements that affect the utilisation of resources for the purpose of loading and unloading vessels. The context of the port as an actor consists of actors with which the port actor interacts in order to provide, maintain, develop and organise a port. In this thesis, these

24
are companies – business actors that affect the utilisation of resources for the purpose of loading and unloading vessels as part of their own business purposes. The port authority is an actor in relation to companies when the provision, maintenance, development and organisation of port services involve interaction with companies. This is not always necessarily the case, as in the Isle of K example. What is central for the port as an actor is the interplay between the actors that defines and leaves it with an operational space within which interaction with other actors can take place and evolve. Hence, port development concerns more than change as a reaction to changes in the port context; it concerns changes in the operational space of the port and what the port may itself do to act in that space. A key issue that results from the above text is the existence of an ambiguity relating to port authorities. That is, they are simultaneously supposed to be actors yet are not to be actors in their relevant contexts (insulated from and at the same time part of their contexts). In other words, port authorities handle various activities and resources in relation to the industrial actor context that make ports actors. Yet on the other hand these activities and resources shall not be handled in ways that discriminate between users (i.e. to be directed towards specific users), which suggests that port authorities resemble non-actors. Ports are as a consequence in a difficult or impossible position as actors.
1.4 The purpose of the thesis
The text above has considered what ports are in a general sense and raised some questions about what characterizes ports as actors. Some challenges that call for an alternative perspective on ports, and what is required of an alternative perspective, have been raised and discussed. A particular issue, the ambiguous role of ports as actors in relation to other actors has been emphasized. This issue is also a challenge in a more analytical or theoretical sense. In this section the perspective and approach adopted for studying ports as actors in this thesis is outlined. Three general takes on ports can be discerned from the discussions above, which focus on (i) the loading and unloading of vessels, (ii) the societal interests in what calls at or passes through ports, and (iii) on the port (as an actor) in its own right. By emphasizing loading and unloading, ports are seen as one out of several intermediaries between buyers and sellers of goods. Ports affect the flows of goods and economic interests in various ways. Secondly, an emphasis on societal interests means that ports are seen

25
as an instrument for society/government to safeguard a wide array of economic- and other interests attached to flows of goods. Lastly, viewing the port as an actor in its own right considers that ports are enterprises that, within a specific and temporarily given context, seek to attain the objectives set by the owners in the best possible way. This is the primary perspective assumed in this study, for which an INA is adopted. Moreover, an issue to be pursued throughout this thesis is the ambiguity of the port authority as an actor/non-actor. To this end the ARA model is used, as it differentiates between actors, resources and activities. It may therefore be a useful tool in order to reveal more about how this port authority ‘actor’ ambiguity is produced and maintained. The overall purpose of this thesis is then to consider what characterizes the port authority as an actor is in a context of industrial actors whose interaction moulds the port context. A second purpose is to do so without bringing in the prevailing set of theoretical glasses that define ports, thereby allowing space for alternative views and ideas about the port as an actor. A third purpose is to use an alternative approach, the INA, to describe and explore what characterizes port authorities as actors in an industrial context. The research question for this thesis is therefore ‘how can port authorities be characterized as actors in industrial networks?’ This question is designed to explore one alternative way in which port authorities can be conceived of as interacting with business organisations. Through the use of four case studies the thesis will discuss how port authorities can be considered actors in industrial networks through the use of the Actor-Resource-Activity (ARA) model. There are many things that influence on the utilisation of port resources for the purpose of loading and unloading vessels, but not all things that carry such influence are actors. The INA, and by implication the ARA model, is an empirical approach that does not entail assumptions about actors that do not derive from interaction amongst actors. This allows me to study characteristics of ports as actors in an industrial context by focusing on actual interaction rather than starting out from the limitations to interaction that follows the traditional way of looking at ports. One challenge is to find a way to empirically study this interaction, and another one is to find a way to analyse the interaction. These challenges, it is argued, are met by using the ARA model. There are a number of methodological and analytical limitations that apply to this approach and model (see Chapter Two for more details). The possible outcomes I look for are alternative ways to understand ports and

26
port management, and to open up for new ideas and possibilities to study and assess ports and their role in relation to industry.
1.5 Structure of the thesis
The structure of the thesis is as follows. Chapter Two below discusses the research design and analytical approach to be used in the thesis. Chapters Three, Four and Five outline and discuss the literatures concerned with ports and the port as an actor. More specifically, Chapter Three addresses what is referred to as the port literature, which has its primary focus on ports in relation to loading and unloading of vessels. Chapter Four discusses the infrastructure literature and is a compilation of various theoretical approaches. They are grouped together based on their focus on societal interests and justification of government intervention in ports due to market failure and the deregulation of public infrastructure. Chapter Five outlines the Industrial Networks literature. In particular, the choice and use of the ARA model as the analytical tool in this study is discussed. In Chapter Six I address the research question by presenting three of the four cases that underpin the thesis. They describe three cases of Norwegian ports, following a structure based on the ARA model. The three Norwegian ports of Karmsund, Aalesund and Grenland respectively are detailed in sequence. Chapter Seven, by reference to cases presented in Chapter Six, argues that each port authority is characterized by one out of three different but overlapping dimensions. A dimension is a way of expressing a port authority’s organisational set-up with regard to the activities and resources directed towards the industrial context. The dimensions are those of administration, policy and commerce respectively, and they are indicative of the kind of interaction a port authority is set up for. There is a differing emphasis on the three dimensions in each of the three cases. That a port authority acts out these dimensions towards users is not equivalent to stating that a port authority is an actor in relation to companies in the industrial context of a port, however. This requires actual interaction between organisations to take place. Interaction is described in terms of the efforts of a port authority to engage with particular industrial counterparts in order to pool activities, combine resources and mobilise actors around utilisation of resources for the purpose of loading and unloading vessels in each particular port. By engaging in interaction with companies, the port authority reinforces or deviates from the dimension that is characteristic for it, which in turn becomes a feature of the port authority as an actor in relation to industrial actors.

27
The fourth case study, of Gothenburg Port, is the empirical study contained in Chapter Eight. This case illustrates the simultaneous existence of all three dimensions in a particular application of investment in three large cranes. It further shows how tensions between dimensions arise as the port authority efforts to engage with and influence the pooling, combining and mobilising around resources for the purpose of loading and unloading vessels. The discussion following on from the Port of Gothenburg case draws on the three previous cases as described in Chapter Six. Two concepts, those of bundles and wedges are central here. A bundle refers to a context of pooled interdependencies, combined resources and mobilised actors that in effect are imposed on a port by its users. Wedges refer to activities or resources which a port authority may impose on port users. Wedges cut across bundles, altering the conditions for interaction amongst actors involved in the bundle. Lastly, Chapter Nine discusses the implications from the thesis for the ports and industrial networks literatures. The main findings of the thesis are that (i) the industrial network ARA model can be used to investigate non-business actors in industrial settings and (ii) it is problematic for a port authority to as a non-business actor to actively intervene in an industrial context without creating wedges to interaction that leads to discrimination across users.

28

29
2. Approaching Ports This chapter proposes the use of the INA in order to obtain an alternative approach for understanding and assessing port authorities. The motivation of the study is discussed in section 2.1 below. The chapter continues by justifying the choice of analytical approach, before turning to the choices involved in case selection, data collection and data analysis.
2.1 Motivation or axiology
A central reason for investigating what characterizes ports as actors relates to my ongoing interest in the role of ports and other infrastructures in the economy. Both originated in my MSc study about how the role of education in the economy would be influenced by changes in how economic growth was explained in mainstream economics. So-called endogenous growth theories shared an emphasis on knowledge, ideas and innovation as the main drivers for long term economic growth, which they set out to explain. Existing models did not ignore these factors of growth, but limitations in the ways in which to assess their contribution to economic growth had left them accounted for as a residual contribution coined technological progress. A basic infrastructure providing services for transportation, education and health was seen as essential to underpin technological progress. Infrastructure was viewed as something to be publicly provided for by governments due to an assumption that there was a lack of private incentives to invest in basic infrastructures. Standard inputs into economic processes are assumed to operate under certain conditions. Although it was recognised that factors conducive to technological progress differed from the standard factors in some important respects, they were still largely subjected to the same conditions that in essence precluded the possibility for economic growth in the long run. By contrast, endogenous growth theory advocated that investment in factors conducive to technological progress could explain and drive long-term economic growth. This could give direction to making changes at institutions involved in the production of such factors, such as education. My interest in the MSc study concerned how the view on education was challenged by the evolving endogenous theory of economic growth. (Hatteland, 1995) One ongoing issue is the limited knowledge about how infrastructures work in the economy, and how theoretical assumptions about infrastructure limit

30
institutions involved in the provision, maintenance and development of services rendered from infrastructure. Indeed, the tools that can capture the kind of processes by which infrastructure and similar productive factors are produced and used in the economy remain limited. Ports, I thought, were for several reasons promising objects of study in order to capture the kind of processes by which infrastructure is produced and used in the economy.
2.1.1 Netlog, ports and actors
In 2001 I was awarded the chance to participate in a large research project at BI Norwegian School of Management – The Netlog project (Networks and Logistics), which offered the opportunity to pursue my research interests. Netlog, along with the people involved in it, has influenced this study in many important ways. The project was a collection of researchers in industrial marketing and logistics at BI Norwegian School of Management. The research group set out to study logistics networks in Norway and borrowed the INA in order to do so. The focus was on resource development and utilisation in logistics activities. A large number of case studies about logistics resources in networks were developed. A number of intensive data collection rounds took place. The first was in Grenland and a second in Aalesund. Alongside funding from the Norwegian Research Council, Netlog was financed by seven major Norwegian companies (Unitor, BAMA, Kitron, Norway Post, Norsk Hydro, Tine and Tomra). Data collection was also conducted within each of the companies on an ongoing basis. A particular framework for the study of resources were applied and adapted for Netlog (see Jahre et al, 2006). It was based on Håkansson and Waluszewski’s (2002b) approach to capture resource interaction and analyse technological development processes. The framework extends the INA in the resource dimension. It has contributed to this study through theory, case-work and data, but is not at the centre of the dissertation. Many traditional infrastructure industries could be studied against a background in Netlog, which raises two key issues. First, why are ports rather than railways, roads, schools or health systems better suited as an object of study in this thesis? Secondly, why the emphasis on ports in terms of their capacity as actors rather than, for example, in terms of the functions they fill as e.g. physical resources? Apart from my initial interests and a project proposal that concerned ports, Netlog was also fairly instrumental with regard to the first issue. Ports are

31
traditionally viewed as essential resources in a logistics context. Moreover, ports were central in both Grenland and Aalesund, where the intensive data collection rounds took place. Netlog also aimed at covering maritime industries and fisheries, both of which are important in the Norwegian economy. As to the second issue, there are further reasons for studying ports rather than other infrastructures for this thesis. First, my focus is on how port authorities contribute to and work in an industrial context. Whereas port authorities play a role in many contexts, the primary use context is industrial, and here ports resemble traditional industries in terms of activities and resources. Ports are also relatively clearly defined and delimited in terms of their industrial context as compared to many other infrastructures, and have a limited number of primary users. Secondly, I focus on the capacity of port authorities to engage in and take part in shaping industrial contexts. Port authorities connect with identifiable industrial actors, and interaction between these actors more or less defines the port. Port authorities relate to industrial actors in order to influence the interaction that defines the port. The thesis provides an empirical underpinning of interactions between industrial actors that include port authorities. As a result, differences may be revealed in terms of the ways in which those port authorities engage and interact with industrial contexts.
2.2 The choice of analytical approach
The INA that I shall outline and use in this thesis is detached from the applied theory of ports as an example of infrastructure. The use of the INA allows me to approach ports from a different angle in order to come up with new ideas about ports as actors in relation to the interaction amongst other industrial actors that shape ports. The everyday meaning of port is heavily shaped and influenced by an applied theory of ports as an example of infrastructure. This applied theory emphasizes the reasons for public involvement in the governance and management of infrastructures. The theory accordingly describes infrastructures using terminology that entails a certain view on organising the provision, maintenance and development of infrastructure. The theory reconciles with the observation that ports and other goods considered as infrastructure have been and indeed are publicly governed and managed. It is thus a theoretical justification of an observed pattern that carries implications for ports and port management, influences what is expected of ports and impacts on how ports are understood and related to.

32
However, since the 1980s the theory has also been used to emphasize and advocate reasons for the participation of private actors in the provision, maintenance and development of infrastructure. Indeed, many ‘infrastructure industries’ that historically have been in the public domain have been heavily deregulated in this period, e.g. postal services, railways. With commercial purposes and mandates made increasingly explicit for infrastructures, the idea of ports as publicly governed and managed infrastructure is increasingly debateable. Ports have proven quite resilient to this trend, however. Only ports in the UK appear to be detached from the public sector (see for example Baird 1999:117-118), but even here there is concern for ports’ role in society and economy (Department of Environment, 2000). The deregulation and privatisation of infrastructure industries impacts on what to expect of ports and how to relate to them. This encourages theory to attempt to reconcile the idea of a commercial firm with the idea of ports as public infrastructure, as if ports can embody both. Such approaches cannot escape dealing with an ambiguous object of study that is simultaneously public and private. An extreme version is to ignore altogether the fact that ports are public, which ascribes ports with agency they are constrained from using under a public mandate. Whereas loosening some of the assumptions from the applied theory of ports as infrastructure, these approaches maintain the theoretical essence and many of the practical implications of the theory. Chapters Three and Four review some of these approaches. The idea of the port authority as an actor when considering ports as an example of infrastructure differs from that of the traditional commercial firm in several respects. Two specific examples are as follows: (i) profit or maximum revenue is not an objective for the port; the interests and welfare of the public are, and (ii) ports are not permitted to discriminate between (similar) users. The commercial firm, in contrast, is expected both to profit and to discriminate/differentiate between (also similar) users. An analytical approach that aims at understanding the role of port authorities in an industrial context has to consider these aspects and their implications. As mentioned above, the INA is fundamentally an empirical tradition. Section 2.2.1 below outlines the INA, and section 2.2.2 links the approach to infrastructures and ports.
2.2.1 The Industrial Network Approach and the ARA model
The industrial network tradition to be used in the study is explicit regarding some of the conditions adhering to ports, implicit about others, and lacking

33
with regard to yet others. There are good and intuitive reasons to apply an INA, however. This section provides a very brief outline of the INA and the ARA model, which is to be used as a tool to analyse the port authority. The discussion proper takes place in Chapter Five. The INA is empirically based and places its primary emphasis on the empirical substance of networks rather than assuming a macro perspective to the understanding of networks. It starts out from the interaction between business actors, hence defining actors from the interaction. That is, exchange transactions indicate interaction between business actors. Rather than making the general notion of markets the arena for exchange transactions, industrial networks proposes business relationships as the empirical context within which exchange transactions take place. If the market is an aggregate metaphor for discrete exchange transactions amongst buyers and sellers of economic goods, industrial networks may be seen as a corresponding metaphor for continuous exchange transactions amongst economic actors operating within relatively stable webs of interconnected business relationships (e.g. Mattson, 1987). The industrial network approach ascribes agency to actors in an industrial context. Actors are defined in terms of their identity in relation to other actors, which is acquired through interaction (Håkansson and Snehota, 1995). Interaction is not a random process. Over time, actors become mutually oriented, directing their respective activities and resources towards the corresponding features of the counterpart. This is the basis for the dyad or business relationship. These are considered as observable, empirical phenomena: the industrial network approach advocates no presumptions on issues beyond what can be derived from observable interaction within business relationships. There are two key assumptions in the INA; interaction and connectedness. In the ARA model three important concepts follow from these two assumptions. These are; the interdependency of activities, the heterogeneity of resources and the identity of actors. In other words, activities are interdependent, resources are heterogeneous and actors have an identity (Håkansson and Snehota, 1995: 51, 134-135, 195). Conceptualising and analysing ports within an INA therefore needs to reflect on how port activities are interdependent, how port resources are heterogeneous and how port actors acquire identity. Ports emerge as a phenomenon by virtue of flows of goods calling at and passing through them. Exchange transactions are embedded in these flows. What is necessary is to consider whether ports are distinguished from any other shop-like entity that - artificially or by nature - is endowed with
34
qualities that makes flows of goods meet. When a vessel is loaded or unloaded, this event is underpinned by actors, resources and activities. Furthermore, in the INA events represent episodes in the history of a business relationship (see Snehota, 1990 for an extensive treatment of the subject). Several frameworks originating in the industrial network approach could be applied to analyse ports. I have chosen the ARA model as an analytical tool with which to study the characteristics of ports as actors in industrial networks. The next section of the chapter considers the relationship between industrial networks and infrastructure.
2.2.2 Industrial networks, infrastructures and ports
The notion of infrastructure is often “used as a kind of shorthand reference for a wide range of framework conditions, institutional set-ups, collective inputs, public utilities, and so on” (Smith, 1997:86). This rather everyday notion is no doubt familiar to researchers within the INA. However, it is far from straightforwardly adopted as part of industrial network research. One important reason is that intrinsic economic value is not ascribed to any phenomenon or entity in an industrial network study. Actors, resources and activities acquire economic features and value through interaction and use within a firm, relationship and network context. Therefore as a phenomenon, infrastructure should be no exception; it is interacted upon and used, and may as a result acquire economic features and value in the context of firms, relationships and networks. In other words, there is no intrinsic value associated with the notion of infrastructure, and nor are there any major theoretical differences between actors based in the infrastructure compared to other actors. Studying infrastructures and thereby ports presents some difficulties, both empirically and analytically, however, and they have not been at the core of the INA. It is typically concerned with the study of interaction between business firms and how interaction connects the resources and activities of those firms, in dyadic relationships and in networks. Public enterprises are not excluded from this, but nor are there any specific adaptations made to compensate for eventual differences between private and public enterprises. As the duality between ports as public infrastructure and ports as ‘ordinary’ commercial activity is polarised and challenged, however, the boundary between what differentiates ‘public enterprises’ from ‘private enterprises’ is increasingly blurred. As a result, the logic in not undertaking industrial network inquiry into what used to be at the fringes of industrial network research is also challenged.
35
The INA does not place intrinsic value with any entity. Ports are nothing but the result of interaction between actors, and since the approach is concerned with firms, it is in the interaction between firms that a port acquires value. The INA lends itself to mapping and analysing the interaction through which ports acquire value without bringing in the applied theory of ports as infrastructure. Furthermore, it has been used extensively to study situations where industrial actors meet, and port authorities both meet other industrial actors and are industrial actors in the sense that they manage resources that are utilised and activities that are performed in an industrial context. The main difference between port authorities and other industrial actors are the kind of limitations they operate under as actors, not the kinds of resources and activities ports manage. By using the ARA model as a tool to analyse the interaction which characterizes port authorities, an alternative understanding and new ideas about ports as actors in relation to other actors may result. A case study research design is the most commonly used approach to undertake the analysis of interaction and relationships within the INA.
2.3 A Case Study Research Design
In this section of the chapter the methodological choices that have been made are discussed. Yin (2003) suggests three criteria to use in order to differentiate the most suitable approach for a research study. These are; the type of research question, the degree of researcher control over events and the temporal focus of the research respectively. The type of research question – “how”, “how many”, “what”, “when”, “why”, and “who” – is the first criterion. Yin proposes histories, case studies and experiments as the appropriate research strategies to be used when a thesis is investigating “how”-based questions. The second and third criteria separate when case studies should be used rather than histories or experiments. The necessity for control over events in experiments is infeasible when investigating empirical phenomena in context. A research strategy based on the use of histories is the most suitable approach when investigating what Yin refers to as the “dead” past. If case studies are the most appropriate research methodology, one obvious question to ask is what is a case study? Yin’s (2003:10) classic definition is: “...an empirical inquiry that investigates a contemporary phenomenon within its real-life context, especially when the boundaries between phenomenon and context are not clearly evident...it relies on multiple sources of evidence.” Other researchers provide definitions that are complementary.

36
For example, Hakim (1987:61) argues that “...case studies take as their subject one or more selected examples of a social entity...” In sum, the use of case studies facilitates the study of an object in context, and allows for depth, detail, and richness of data (Easton, 1998). In addition multiple sources of data can be combined (Yin, 2003). In the next section, the selection of the four cases used in the thesis is justified. This is followed by a discussion of the data collection and analysis approach.
2.3.1 Case selection
Dubois and Araujo (2007) argue that the selection of cases is the most important choice when conducting research within a case study research design. The empirical part of this study refers to four ports, three Norwegian and one Swedish. All the ports are owned by one or more municipalities, and they are managed accordingly by public port authorities. The laws governing ports are somewhat different in Sweden and Norway as Swedish ports are not regulated by distinct port legislation, but similar regulations apply to the port owner. Legislation and conventions to regulate public involvement or state support to industry through ownership of e.g. ports exist both at the domestic and international level. Ports are consequently comparable entities in terms of their legal status across nations. The first case I selected for this thesis was that of Karmsund Port. Karmsund Port, the setting for the Isle of K example earlier in the thesis, refers to a fishery port on the Norwegian Southwest coast. The island of Karmøy hosts the fishery port. It is divided from the mainland by Karmsundet, a narrow strait that gave its name to the port. Personal contacts and secondary materials suggested there was to be a major change at Karmsund from being three fishery ports in a region to becoming a centralised fishery port area. This change has been described in detail in Chapter One. The first case reflected my ongoing interest in how the Norwegian fishing industry is organised. In particular, I was curious about how the relationships across firms in the Port would be affected and how the port authority could influence those relationships. A second reason was that Karmsund Port made public a rather extensive and ambitious port plan (Karmsund Havn IKS, 2002). The port plan document itself gives a rather detailed insight into how the port perceives and defines itself, and it is very interesting reading in terms of contents, structure and discussions about the port authority’s connections to its user contexts.

37
The subsequent case selection process was based on a mixture of sequential and theoretical sampling of research sites (Yin, 2003; Patton, 1990). The second case to be selected was Aalesund Port. It is the port associated with the town and municipality of Aalesund on the Northwest coast of Norway. Aalesund was chosen for several reasons. It is in fact related to Karmsund Port because it is very much focused on fish as an important part of the product base. One crucial source of variation was that Aalesund primarily consists of private operator quays. I expected that this would constrain the possibilities for the port authority to influence and be influenced by business relationships within the port. Furthermore, many of the companies at Karmsund and Aalesund are either competitors or part of a network along the west coast of Norway that is serviced by Maersk vessels (see Chapter Six for more details). Lastly, as mentioned in the section about Netlog above, one of the data collection rounds within the project was held in Aalesund, which was a useful way to supplement my own data collection activities. The third case to be selected was that of Grenland Port. Grenland is a name for the coastal parts of the county Telemark on the Southeast coast of Norway, which is where Grenland Port is situated. This port is underpinned by several important process industries, which are of course quite different from fish. I was interested to see how the port authority’s role was affected by a differing industrial make-up. In other words, this research site varied from the first two in terms of industry types and the size of the companies involved. Furthermore, in contrast to the first two ports, Grenland Port also introduced the idea of a port operator, or the port authority as one of several operators of terminals. Lastly, as for the Aalesund case study, one of the Netlog project data collection rounds took place in Grenland, which again aided my data collection. The fourth case, Gothenburg port, was also chosen by me. Gothenburg Port is what is referred to as a monopoly port. In other words, it is the only port operator in the whole port district of Gothenburg. The Port is situated in the city and municipality of Gothenburg on the West coast of Sweden. It was deliberately selected as an extension of the Grenland Port case. Gothenburg is in some ways an extreme case (Patton, 1990), because it represents a monopoly situation as to whom the port operator is. One last element that is introduced in this fourth case is the investigation of the port authority actor in terms of a specific application (a major investment in three cranes). In sum, the case selection strategy has been to produce four case studies, which when combined form one large embedded case study (Yin, 2003) of what characterizes the port authority as an actor in industrial contexts. The unit of analysis is the port authority in each of the cases. The four cases provide multiple descriptions of ports and port authorities. The cases are not

38
compared as such; although that does not mean that they do not demonstrate any similarities. Instead, the four ports have been chosen to illustrate and emphasize aspects of the same phenomenon.
2.3.2 Data collection
The appropriate methods to be used for data collection depend upon factors such as the research question at hand and the level of access possible. The four cases in this thesis have been constructed from two main sources; in-depth, semi-structured interviews and secondary materials. The purpose of an interview for this research is as a means of gaining an account of how a port authority acts in relation to users in a port context. The individual managers selected for interview were those most closely involved in the process. An example of the interview guide – the Netlog case framework - can be found in the appendices. Yin (2003) states it is necessary to make interview procedures explicit: what he terms as 'Field Procedures'. The interview guide can be defined as “…a list of questions or issues that are to be explored in the course of an interview” (Patton, 1990:283). It can be a way to increase data reliability when collecting data from both multiple respondents and from multiple research locations. The interview guide acted as a written focus for issues to be covered regarding the roles of the port authority and the features of the port context. The data collection process began in 2001 and continued until 2005. Access to data collection sources was enabled by existing personal links and the Netlog data collection process. 7 primary data interviews were conducted by me across the four cases (see appendices for details of who was interviewed for each of the four cases). Each of the interviews lasted between 1 to 3 hours in duration. The Interview Guide and background information was always prepared in advance of meeting a respondent. Several interviewees were used for each of the four cases. Furthermore, interviewees were also consulted more than once, either in person or over the telephone As suggested by the relatively low number of face-to-face interviews above, secondary material was crucial for the construction of the case studies. The main sources of secondary data are port strategy documents, Netlog cases and newspaper articles. The case of Karmsund Port draws extensively on a public port strategy document as the main data source. In the Aalesund Port case, the main data sources are official port documents and Netlog cases of resource interfaces that impact on Aalesund Port. These cases have been written up following a certain format by the respective members of the project that conducted the interviews upon which a given case is based. This

39
format corresponds to a design developed and described in Jahre et al (2006). An example of a Netlog case for the cases for which this is relevant can be found in the appendices. The Aalesund case also draws upon information from statistical data and various articles from newspapers. For the Grenland Port study the main sources of data information are news articles and Netlog cases. Lastly, the Port of Gothenburg case relies primarily on interview material and public port documents (see appendices for details).
2.3.3 Data analysis
Description and analysis are often very difficult to separate in case study research (e.g. Miles and Huberman, 1994; Easton, 1995; Dubois and Araujo, 2007). The first step of the case analysis was to follow Eisenhardt's (1989) advice in forming detailed write-ups for each case. The four cases were written up following a format based on the ARA framework. From this the features of the port context became familiar. The next part of the process was to discuss the basic cases with colleagues in the Netlog project. This lead me to ask ‘what surprises me’ about my cases. One interesting observation that became evident with regard to how port authorities relate to their industrial users was the apparent lack of interaction. Such interaction appeared to take place between users, but only to a very limited extent did this include port authorities. From the analysis of data and cases three distinct but overlapping dimensions of port authorities were derived. Each of the three Norwegian port authorities was used to exemplify an emphasis on one of the dimensions. The emphasised dimension was then used to illustrate what kind of interaction with users each of the port authorities was set up for or inclined towards. The Gothenburg Port case differed from the other cases as it is focused on a single application, a decision to invest in three cranes. Based on this discussion I conceptualised the port authority as an actor in an industrial context in relation to other actors in terms of bundles and wedges.
2.3.4 Bias and Validity in Case Study Research
The typical criticisms of a case study research methodology are can be summarised in a statement from Larsson (1993:1519): "...why one should bother about case studies at all, given their questionable scientific value". The two main problems being raised here are those of researcher bias and lack of generalisability. To take researcher bias or ‘lack of rigour' first, this is hardly a new problem. Dubois and Gadde (2003) defend the case study research design by claiming that the requirement for pure induction – the
40
implied solution to researcher bias - is impossible. Furthermore, Sayer (2000) posits that bias exists in quantitative research strategies, e.g. by structuring categories or imposing terminology upon respondents. In other words, all research strategies contain ‘bias’: it is not unique to case studies (Yin, 2003; Easton, 1998; Dubois and Gadde, 2003; Dubois and Araujo, 2007). The second problem within Larsson’s quote is the issue of generalisability (or external validity). The logic underpinning generalisability from cases is not the same as that required for quantitative research. This is because case studies are not designed to investigate empirical regularities that are to be generalised to a wider population (e.g. Tsoukas, 1989). In other words, they are not representative. It is fair to say that it would be impossible to obtain the requisite numbers of cases in order to satisfy statistical requirements because of time, resource and research capacity constraints. If each case study is an example of a phenomenon, a case is selected for “…its explanatory power rather than for its typicality" (Mitchell, 1983:203-4). The implication of what is termed theoretical generalisation (ibid, p.197) is that a knowledge contribution is to generalise to theory, rather than forming statements that represent a larger population (Bonoma, 1985, Yin, 2003). It is possible to try to actively increase the level of confidence in these theoretical generalisations by increasing internal validity. Measures used in this thesis in attempting to do so include maintaining a case study database (also an issue of reliability) and the triangulation of data (Yin, 2003; Bonoma, 1985; Easton, 1998). In sum, the analytical approach and case study research design adopted in the thesis should allow me to obtain rich, empirical accounts of how port authorities can be characterized as actors in an industrial network perspective.

41
3. Port Literature and the Actor Dimension The origins and assumptions underpinning the port literature are diverse, and not always explicitly accounted for. Nevertheless, the port literature appears to largely share view on some aspects of what characterizes ports. One such aspect, the explicit or implicit understanding of ports as infrastructure with fairly strong elements of public provision, has particular implications with regard to the actor dimension of ports. This chapter addresses some of the ways in which ports are analysed, in particular on how the actor dimension appears in the analysis. It is argued that the port literature is ambivalent with regard to the actor dimension in terms of how ports are treated and referred to.
3.1 Port literature: an introduction
It is typical in the port literature to express the object of study in terms of the need to understand various dimensions of ports, and not the contexts ports may be seen as being part of. Nonetheless, the criteria used to define and analyse ports are very differentiated (see Weigend, 1958 for an old but still excellent review). Whereas many early accounts analysed ports in a geographical context, ports are most commonly analysed with regard to the economies they are seen as part of. The geographical dimension remains powerful however, for example in terms of agglomeration economies, clusters or industrial districts (e.g. Feldman, 1999; Fujita and Mori, 1996; Gordon and McCann, 2000). Both the general dimensions of both economy and geography tend to get explicitly or implicitly carried along in a port analysis. Some research starts out in geographical land-sea interfaces, their primary and secondary users, or the large port operating groups for which these interfaces are important (Airriess, 2001; Song, 2003; Steenken, Voss and Stahlbock, 2004). It is also worth mentioning here the body of literature that analyses land-sea interfaces by concentrating on the public administration that ports are a part of (e.g. Everett, 2005). A second general theme is of ports as embedded in supply chains, networks, clusters, nations and regions (e.g. de Langen, 2002; Fujita et al., 1996; Notteboom et al., 2004; Todd, 1993). Thirdly, still others focus on the regions/hinterlands of ports (e.g. Hoare, 1986; McCalla, 1999; van Cleef, 1945; van Klink and van den Berg, 1998). The internal technical, operative and administrative processes of port operations is the fourth general way in which ports can be investigated (see below in section 3.2).

42
Each of these perspectives emphasizes different dimension of ports and the role or function that ports shall play within a particular context. For example, whereas efficient port operations may be important in all four perspectives, explanations as to why and for whom efficiency is important may differ substantially.
3.2 Port classification
Since it appears to be impossible “to assign a fixed order of importance to the various criteria employed” [in analysing ports], Weigend (1958:190) argues there is no universal classification of ports. Classifications are constantly proposed and used, however, such as in a preliminary report for the revision of a Norwegian Port and Seaways Act (Ministry of Fisheries, 2002a). In the report, distinctions are made between classifications based on administrative and functional characteristics. The former is based on port ownership, and the latter on port purpose. A classification that combines port ownership and port purpose is based on operative responsibilities (ibid., p61-62). Nevertheless, different classifications emphasize particular dimensions that result in a variety of implications with regard to the actor dimension in ports. The following text considers functional, administrative and operational port classifications in turn.
3.2.1 Functional port classifications
The Britannica Student Encyclopaedia (2002) defines a port specializing in bulk cargo as an ‘industrial port’, one handling general cargo (passengers, packaged and manufactured goods) as a ‘commercial port’, and one dealing with both bulk and general cargo in large volumes as a ‘comprehensive port’. The United Nations Committee on Trade and Development (UNCTAD) defines the roles of a modern port as the “interfaces between several modes of transport”, “centres for combined transport” and “multi-functional markets and industrial areas where goods are not only in transit, but [where they] also are sorted, manufactured and distributed”(cited in Trujillo and Nombela, 1999:4). Trujillo and Nombela further propose that the general objective of ports is to minimise costs for passengers and shippers through the provision of fast and safe transit via port facilities. Large ports are also “hubs for connection and transhipment, allowing cargoes on different long-haul routes to be served more efficiently by several ships”(ibid.).

43
The Norwegian Ministry of Fisheries (2002:63-70) makes a three-part distinction based on purpose: Traffic ports, special ports and private ports. Traffic ports are those for regular cargo and passenger traffic. They have become a link in the flows of goods and passengers, and as such ports can be seen as the interface between different modes of transport. Traffic ports have unrestricted access, but not necessarily for the handling of cargo. Special ports are those for specialised traffic purposes, built to serve a particular industry, such as military, fisheries, oil industry and so on. Private ports, which are those for servicing private traffic, are based around one particular actor. All three of these purposes may be served within the same port district and under the jurisdiction of the same port authority, however. The above definitions exemplify a classification of ports based on function, irrespective of ownership. The focus on what the purposes of ports and port operations are for everyone but the port itself is noticeable. Arguably, this rests on the view that the purposes of port operations for ports are already specified in law. This suggests that an administrative classification underpins a functional classification.
3.2.2 Administrative port classifications
Administrative port classifications are based on port ownership and criteria underpinning the division of responsibilities in ports (Kessides, 1993). The World Bank (2001:16-17) identifies four main categories of ports: Service, tool, landlord and private respectively. These can be distinguished in terms of responsibility for the provision of service, function, ownership to superstructure and labour- and management mode. Tovar et al (2004:2) argue that ports in general are not entities producing a single service, but instead that diverse activities are carried out within port boundaries. Therefore, some services are assumed to be best produced under conditions of competition, and other under monopoly conditions. In the words of Tovar et al, “it is important to analyze the ways and means of inducing coordination and to identify the role of port authorities as institutions in charge of the regulation of all facilities and activities that take place within the port”. In the landlord port model, the port authority acts as a landlord, leaving as many activities as possible to be produced in a competitive environment by private companies. Comprehensive ports provide a good contrast, as here the port authority operates most or all activities in the port. In other words, this is the monopoly model. Between these management models exist many combinations of public – private solutions. The boundaries between public

44
and private sectors involved in port operations have been studied (Goss, 1992), and reveals that such a boundary is rather fuzzy. Indeed, Moe (1987:456-457) describes organisations such as port authorities as “crypto-quasi-pseudo” entities “living a precarious existence in the twilight zone between the public and private sectors”, and representing a “third-party government” phenomenon. A dominant issue with regard to administrative classifications is how to organise port operations in ways that are not detrimental to trade and the workings of the market mechanism. This shall be further discussed in Chapter Four. This, in direct contrast to the last section, suggests that a functional classification underpins an administrative classification. It becomes a challenge to establish criteria that distribute responsibility for various functions to actors when ownership is the main mechanism through which agency is exercised. As the functions and purposes of ports are scrutinised, the existing division of responsibility for various functions needs to be questioned.
3.2.3 Operative port classifications
Operative port classifications draw on the two former kinds of classification. They tend to start out from the observation that vessels are loaded and unloaded in a context of multiple ownerships and purposes. Activities may be performed by different actors with ownership and agency to various parts of the processes going into the loading and unloading of a vessel. The port may very well carry out all or some of the activities and own all or some of the resources. Operative classifications tend to focus more on what ports appear as, rather than to understand what has formed and shaped them. First and foremost, operative classifications are aimed at making analysis possible that avoids some of the intrinsic issues faced by the other classifications. Ports have a purpose, they are owned and they are operated; ports are factual entities. One problem in this is that multiple ownerships and purposes are difficult to reconcile with the agenda most of the analytical approaches starting out with this observation assume. Logistics is one example of how ports are understood and described in terms of operative responsibilities. Section 3.3 below discusses how ports can be analysed within various logistics approaches.

45
3.3 Ports in logistics systems
Logistics is concerned with the flows of goods, services, related information, and (at least implicitly) finance. From the perspective of logistics, ports may thus be characterized and defined in terms of flows of goods, services, related information and finance that cross any particular port interface. In some instances, the flows crossing a particular port interface may be very specific, such as in an oil terminal, at other times flows are less transparent. For example, containerisation contributes to black-boxing flows, making ports blind to what commodities actually move across quays (Hall, 2002:218-219). A fishery port may thus become a container port when fish is containerised. Similarly, a containerised fishery port may be associated with fisheries long after other flows of goods have started to dominate. It is indeed striking how something understood as a spatial system of economic transformation related to a particular industry may end up being described in terms of the type of load carrier used in transportation. There are various logistics approaches and applications that, despite some differences, share a concern for managing the interfaces and flows. The context in which flow and interface management takes place is typically various levels within the firm, but also across firm boundaries in supply chains, distribution channels and networks.
3.3.1 Port operations
The loading and unloading of vessels usually includes references to physical and fixed installations (quays, cranes, etc.). It may also refer to elements in the immediate sea and landward context that constrain or facilitate loading and unloading capacity, e.g. sheds and storage. Hence, the qualifying criterion for port interfaces is their connectedness to the physical loading and unloading of vessels. Such connectedness can be interpreted in various ways. Logistics tends to focus on the efficient use and operations that are related within ‘logistics systems’, a concept used rather loosely to capture a variety of traditional logistics elements. The connectedness between elements within it can in principle be optimised with regard to their efficient use and operation. The port authority is seen to represent a co-ordinating organiser of the logistics system, or an autonomous firm within it. In general, it is fair to say the operations approach concentrates on certain aspects of ports, especially container terminal operations (see Steenken et al

46
(2004) and Vis and de Koster (2003) for comprehensive reviews). The operations literature focuses on optimisation problems in separate parts of the transport chain with regard to quay and landside interfaces. Approaches aiming at optimising integrated phases in the (internal) transport chain including multiple agents are limited. Ports are seen as an organisational entity covering the whole ‘in-port’ process. It is argued that the level of operations cost and the increasingly capital-intensive production related to containerisation, demands a reduction in the unproductive time in port. This view supports the automation of in-yard operations in order to increase terminal throughput and decrease ship turnaround time. The material flow refers to containers, not the goods within containers. Steenken et al (2004) provide an extensive review of container terminal operations and operations research. Container terminals are defined in terms of systems of material flows at quay and landside where ships and trucks/trains are loaded and unloaded. Differences in the specific container handling equipment and stacking facilities characterize container terminals. The authors argue that there are two principally different container terminal systems. These refer to the alternative use of straddle carriers versus gantry cranes in container storage. Others have analysed how largely administrative process reengineering enables ports to lower costs and increase customer service (Paik and Bagchi, 2000). Port operations are here seen mainly as carrying out government directives, but why government is involved is unclear. Improving port efficiency, in particular governmental controlled activities such as customs, reduces shipping costs (Clark, Dollar and Micco, 2001, 2004; ibid). Overall, neither functional nor administrative modes are questioned. Laine and Vepsäläinen (1994) proposed that investment in cargo handling operations yields the higher returns when the objective is to improve economies of speed in sea transportation. Resistance (typically institutional) to change in ports’ and shipping companies’ bargaining power in port development are proposed as reasons to why improvements do not happen. Slack (1993:580-583) provides a more general approach addressing the connectedness of port interfaces within logistics systems. It is argued “ports are becoming pawns in a game of commerce that is global in scale and on a board where the major players are private corporations whose interests rarely coincide with the local concerns of the port administrations”. Containerisation has changed the traditional spatial monopoly situation as ports are no longer certain to cater for any particular hinterland, either for imports or exports. Ports are also no longer the most important interruption in cargo flows, instead becoming marginal in the routing of container flows.

47
Nevertheless, ports are required to invest in increasingly capital-intensive equipment and facilities to attract carriers, whereas no one is required to commit to the use of the equipment and facilities. As ports become more efficient, the direct economic benefits for their local communities diminish, unless competitive strategies are developed to occupy key positions in physical distribution systems. The operations approach basically takes for granted that port equipment and facilities are there to be optimised. The co-ordination of this task is given to the port authority. It is rarely discussed what and in whose interests port operations should be optimised with regard to. It is generally not for the profits of ports, however. Hence ports are not seen as equivalent to the traditional firm. Nor is it with regard to direct fiscal revenues of port owners, i.e. a state or local administration. Slack’s response is to put value-adding services at the centre of port operations. However, it is not given whether port owners can justify investments under conditions of increasing uncertainty when the extent to which the eventual returns will benefit entities incurring the costs of port operations is unknown.
3.3.2 Port flows
Ports facilitate the flows of goods and services, perhaps over-emphasizing the pro-activeness of a port authority in doing so. Ports may be described as being utilised by firms engaged in the management of flows of goods. This assumes that the interests of port users and port owners coincide, at least to some extent. The port set-up presumably affects how well various flows are facilitated, thereby contributing to the total costs between flows. Paixao and Marlow (2003) apply a variety of concepts to frame port flows: “Ports are points of the logistics chain and part of the transportation chain”, “ports are logistics systems along the supply chain”, “port networks”, etc. The point is that for ports become more competitive requires management strategies that ensure port leanness and agility. The authors argue that this can be attained by following a two-stage strategy. The first stage concerns ‘getting lean’ with regard to internal efficiency. The second stage requires ‘getting agile’ in adapting internal operations to external conditions. Ports are therefore given the role as a distribution centre. Paixao and Marlow assert that the entire “port network” can then be maximised with regard to value rather than focusing exclusively on cost minimisation. The idea of port network optimisation seems underdeveloped, however, in particular as no centralised governance is assumed to be exercised.

48
Robinson (2002) argues that ports are embedded in supply chains. Therefore, restructuring of these chains alters the functions of ports and port authorities. A port must be seen as elements capturing value for itself and for the value-driven chain systems it is a part of. Robinson reviews existing research that views ports as places, operating systems, economic and administrative units, before defining a port as: “Third party service providers intervening in the supply chains of individual firms; elements or firms among many firms in import/export supply chains between producers and consumers; offering superior value deliveries to shippers comprising markets segmented on basis of value propositions aligned to value propositions of the port; and competitive firms/entities embedded in chains/supply chains focused on the port where value delivery is a function of the level of integration of chain systems”. Ascribing a third party service provider as central and proactive as Robinson does is not straightforward. Indeed, the mental leap from Slack’s (1993) “pawn in the game” to Robinson’s (2002) proactive third party service provider is a long one. Carbone and De Martino (2003) also study the changing role of ports in supply chain management. They argue a “customer’s service network reorganization and its entry into new partnerships with logistics services providers, which may be using a different hub”, is as important a factor behind the loss of key customers as operational inefficiencies. Port competitiveness is therefore increasingly reliant upon the external co-ordination of the supply chain. For Carbone and De Martino, a port is a member of a supply chain. They focus on “the ability of logistics and transport operators [as a port community] to contribute to the value creation and to accomplish also the qualitative attributes of demand” leaving aside the role of port authorities. The works of Lee et al (2003) and Bichou and Gray (2004) directs the logistics and supply chain management debate with regard to ports to a measurement approach. Lee et al (2003) attempt to model a supply chain with multiple objectives by using a simulation approach. They argue that manufacturing supply chains and port supply chains differ, particularly if port supply chains are marked by conflict between the objectives of the actors involved. A shift to port networks can be seen in the work of Notteboom and Winkelman (2001) and Van Klink (1998). Notteboom and Winkelman’s concept of port networks is built around how ports many counter the ‘pawn role’ through building networks that minimise total costs along the total transport chain. This is in particular when large port clients are involved, but also in order to reduce subsidisation and distortions in European inter-port competition. This rests on the assumption that such networks are not already

49
at work, or that ports are in a favourable position to orchestrate port networks. Van Klink’s (1998) port network concept distinguishes three port network types in terms of their related interdependencies. These are ‘chain networks’ (based on sequential interdependence), ‘complex networks’ (based on reciprocal interdependence) and ‘formation networks’ (based on pooled interdependence). Van Klink asserts: “given its position as a branch of government, the port authority aims at a combined improvement in the port’s attractiveness for port users and the welfare of citizens”. The achievement of these objectives requires every port-related activity to be at optimal places within the network. The role of the port authority is (again) thought of as a network manager. In summary, logistics tends to place ports as central actors in chains, channels or networks. There are many good and straightforward reasons for doing so, but there are also various problems. One main problem arises when ascribing agency to a port actor. It is difficult to observe the assumed pro-active agency being exercised. Secondly, albeit recognising ports as governmental agencies, they appear to describe ports as a provider of business service rather than public service.
3.4 Actor ambivalence and agency
This chapter started out by asserting that the port literature is ambivalent with regard to the actor dimension in how ports are treated and referred to. Various sections of the literature have been assessed that have ports as the focal object of study. One main finding is that the port literature is prone to give ports agency they are constrained from pursuing, or where pursuit may be sustained only under a certain set of conditions. One explanation for this may be found in insufficient cross-referencing between port analyses (e.g. as in logistics) and the mode of port classification used as a background to an analysis. For example, a port management model that is more consistent with unilateral optimisation of in-port operations will most likely be that of tool- or service (comprehensive) port. These management models are associated with the idea of ports as monopolies. On the other hand, a port management model that describes a context that appears largely consistent with that of supply chains with multiple agents is that of landlord ports. However, the landlord port management model describes a port authority that is detached from the port operations and port flows that logistics approaches address.

50
Research concerning ports as entities other than private firms tends to retreat into redefining the challenges of ports to fit models of standard firm agency. Slack’s (1993:580-583) proposition, “as ports become more efficient the direct economic benefits for their local communities diminish”, can be re-phrased into one of creating or supporting value-adding functions aside existing port functions. The need to re-conceptualize ports results in a plethora of flow and operations metaphors within which ports acquire a focal role. This role is rarely analysed as acted out via standard business procedures, or via close interaction with anyone carrying out standard business procedures. Hence, the port is largely detached from the day-to-day operations that constitute the flows and operations that are central to their definition. The above suggests that the port actor exercises agency elsewhere than towards actors that constitute the flows and operations ports are defined by in the port literature. In other words, the port authority may be a focal actor in the port, but not primarily with respect to actors, flows and operations. In conclusion, it appears that the port authority is a very weak or distant actor in the context used to describe ports in the port literature. However, the port literature can be used to clarify the present research question in the sense that the port can be seen as an actor in different contexts and that this is a challenge for ports. They can be seen more or less as a ‘resource’ actor in the supply chain model, compared to a ‘political’ and ‘public administration’ actor in the public context. The latter has been the historical focus in the port literature, and is partly explained or justified by theory. Ports also have a very special role in one theoretical context – as an infrastructure actor with very clear limitations. However, it could also be seen as ‘industrial network actor’, where it is put on the same level as all other organisations having control over activities and resources. In the following two chapters the role of the port authority as an actor is more fully related to the two chosen theoretical contexts. In the next chapter, we elaborate further on the prevalent view and applied theory of ports as infrastructure.

51
4. Ports as Infrastructure This chapter provides an account as to why port authorities appear weak in actor terms. The chapter is based on the assumption that the analysis of ports typically places these into the broader category of economic goods referred to as infrastructure. As infrastructure, ports are conceived of as a basic foundation that facilitates trade and transport. In other words, ports underpin the competitiveness of industry generally by reducing transportation costs. This also extends access to markets, thus underpinning economic activity and social welfare at large. In short, a view of ports as infrastructure asserts that the market mechanism provides an optimal allocation of resources. However, markets are not always perfect, which highlights the need to correct for situations of market failure in optimal resource allocation. The main instrument to correct market failure is government. This actor has the multiple roles of facilitating efficiency, the fair distribution of income and promoting economic growth and stability (Samuelson and Nordhaus, 2001:35). From this perspective, ports are a governmental interventionist response to market failure in the market for port services. The primary and formal mandate of the port authority is to facilitate the best possible allocation of resources given its intervention in the market mechanism. This chapter proceeds as follows. First, some general reasons for market failure are outlined. This is followed by a discussion of the link to ports and infrastructure in sections 4.2 onwards.
4.1 The optimal allocation of given resources
In its most crude form the argument can be considered as follows. A market “is a mechanism through which buyers and sellers interact to set prices and exchange goods and services”, and where the decisions of producers and consumers are co-ordinated by price (Samuelson et al., 2001:27). Under ideal circumstances, the market mechanism determines a Pareto-optimal allocation of resources. A set of conditions is required to apply for the market mechanism to work in an ideal state. Only under perfect competition can these conditions apply. Perfect competition requires atomistic producers and consumers. In other words, that no actor is large enough to affect the market price, which implies large numbers of buyers and sellers, along with homogenous products. Imperfect competition, externalities and public goods are three major causes of market failure (ibid., p36). It is important to bear in mind that none of these causes

52
implies that markets for port services do not work, just that their workings deviate from an ideal standard in certain respects. The three main causes of market failure have all been linked to ports, and each calls for intervention of some sort. The three main causes are outlined in turn below.
4.1.1 Imperfect competition
Imperfect competition refers to a situation whereby a buyer or seller can affect the market price. Monopoly is the extreme example of imperfect competition. It results from features such as economies of scale, scope or contiguity that make average costs fall over the entire range of output. (Kessides, 1993:5) As a consequence, one producer may serve the entire market for a service at a lower cost and price than multiple providers are able to. If monopoly conditions are present, there is an inevitable drive towards a monopoly situation. It can be argued that what maximises profits in this situation is for the monopoly power to charge a higher price than could be charged under perfect competition, thereby producing less of the good. Ports are frequently described in terms of monopoly conditions being present. Therefore, there is a case for governments to intervene.
4.1.2 Externalities
Externalities occur when costs or benefits are imposed on actors outside the market as a result of market transactions not being accompanied by an economic payment. Externalities are frequently argued with regard to ports, both negatively and positively. For example, with regard to congestion and pollution, but also with regard to the extended access to markets that may result from pooling demands for transportation. Whereas the latter is a major incentive for in particular local governments to engage in ports, from a national perspective regulating the sources of negative externalities may appear more urgent. Hence, the local government perspective is concerned with facilitating as many positive spillovers as possible.
4.1.3 Public goods
Public goods are an extreme version of positive externalities. The argument is that for some goods there are no costs associated with extending the service to an additional user (non-rivalry). Furthermore, additional users cannot be prevented from enjoying the service (non-excludability). Public goods are characterised by the benefits being so widely dispersed that private providers lack incentives to provide a service and capture the returns. The service will therefore not be provided by private means. This is primarily
53
argued with regard to basic services such as national defence, police, health and education. Kessides (1993:6) asserts that although they are not thought of as strongly marked by non-rivalry nor non-excludability, ports and port services are described in terms of public goods. In particular, this applies with regard to seaside facilities, to charging and financing of navigation marks, lighthouses, dredged channels, etc.
4.1.4 Ports are actually public
Apart from the fact that (with some exceptions) ports are actually public across the world, the three causes of market failure apply to ports both as a matter of reality and as a matter of argument. For when local or national government own and sometimes operate ports, they do so because of a legitimate mandate. The causes of market failure (whether actually occurring or not) form a political justification for this legal mandate that is generally accepted internationally. This is because ports belong to a category of economic goods that is referred to as infrastructure. This is a categorization that appears politically useful but fairly hazy theoretically.
4.2 Infrastructure and ports
The term infrastructure can be understood “as a kind of shorthand reference for a wide range of framework conditions, institutional set-ups, collective inputs, public utilities, and so on” (Smith, 1997:86). Infrastructure is often interpreted as “collectively used economic resources provided under natural or created monopolies” (Hauknes, 1999:4), or as "the complex of non-natural resources that are collectively used by industry in the production and distribution of products” (Smith, 1997:90). It is therefore generally thought of as services from public utilities, public works and other transport sectors, of which the port sector is one (Kessides, 1993:23; World Bank, 1994:2). Infrastructure is hence referred to as social overhead capital upon which other sectors’ functioning and production depend (Cole, 1960; Hirschman, 1957; Serageldin and Grootaert, 1998; World Bank, 1994). Infrastructure may be government policies, regulations and the institutions that enforce them (Hall et al., 1999; Jones, 1998:144). It increases the productivity of private factors by offering “the possibility of simultaneous use of such goods by a large number of agents”. This makes them “public goods in the traditional sense” (Amable, 1994:22). Smith (1997:94) argues that infrastructure “consists of large-scale indivisible capital goods producing products or services that enter on a multi-user basis as inputs into most or all economic activities”. Overall, infrastructure concerns co-

54
ordinated and uncoordinated social and political influence on individuals and firms. Mainstream economic theory has produced seminal works on how many kinds of socio-political processes and institutions influence allocation of resources. Nevertheless, economic inquiry has had co-ordinated political influence through government as its main focus. Implications for public policy and government action are, as a result, a primary aim of economic inquiry as far as infrastructure is concerned. Such implications materialise in terms of what characterizes the organising entities of infrastructures. In other words, organising entities are significantly influenced by public policy and government views of what, for example, a port as an infrastructure is. A port authority in this view is more a political and governmental instrument than a business actor. There are several reasons why a port as infrastructure view is attractive with respect to the organisation and governance of ports. One reason is that an understanding of ports as infrastructure addresses all the affected parties of ports and port services. Secondly, it addresses the observation that ports are publicly owned and governed. Lastly, it has for some time appeared to provide an acceptable basis for the management of ports.
4.2.1 Market failure and monopoly in ports
In the sections above, port authorities were explained as resulting from market failure in the provision, maintenance and development of port infrastructure. It was argued that there may be a co-ordination problem regarding port services if left to the market alone. But avoiding ‘government failure’, i.e. not extending government intervention beyond what is required to correct market failure, is another equally relevant issue. Therefore, what is required is to identify and compensate for when markets fail by creating conditions for the supply and demand of infrastructure and related services. Secondly, the market-distorting effects of governance structures that substitute or complement markets in creating such conditions need to be delimited and constrained. Deciding where and in what respects markets fail and how to confine the agency compensating for the failure is a governmental function in society. The port authority is for a large part delegated the responsibility to exercise judgement and agency to balance these tasks. This responsibility, confined to the matter and area for which the port authority exercises governmental jurisdiction, may be thought of in terms of local or spatial monopoly.

55
Clearly the range of considerations in this task is vast, and varies from port to port, from area to area, and from country to country. Not only do local port markets vary, but so do traditions and practices with regard to making judgements as to the extent of intervention. In some ports, the port authority performs all port services, whereas in others the port authority is constrained in its role. Where governmental jurisdiction and operational responsibilities overlap, one may think in terms of a de facto monopoly on part of the port authority. It is then easy, for analytical purposes, to think of ‘port’ and ‘port authority’ as the same object. There tend to be overtones of this line of thinking across many approaches mentioned in Chapter Three. By adopting this conflation, ‘the port’ can then be analysed in terms of the measures used to describe ports, such as cost and physical structures that make ports appear and important in terms of bulky investments, time, complexity, etc. It is less common to focus on the presence of local cost structures that intuitively calls for notions such as economies of scale and scope, which may make average costs fall over the entire range of output. Nevertheless, in particular in smaller ports, variable costs may be relatively unaffected by the level and scope of their use. One may therefore consider agreeing to a description whereby variable costs are low relative to fixed costs and that the challenge is to spread fixed costs over as much produce as the capacity technically allows for. Services provided for one market segment then reach their minimum unit cost when provided by one facility or by one provider. In bigger ports the case is somewhat different. It is usually in and across large national and international ports that market failure (and also monopoly) issues are pushed to their extremes. Here, the context is not one of under-provision of port services, but a fierce competition between ports, countries and regions for trade and cargo. The issue becomes more one of governments channelling resources and privileges into (their) ports in order to attract trade and cargo at the expense of competing ports. The debate is one of ports as a source of unfair competition and institutionalised inefficiencies in national and international allocation of resources, for which a sound regulative regime is sought.
4.2.2 From provision to regulation and deregulation
A problem with arguing for government solutions to correct for market failure is that knowledge as to how and why markets fail with regard to infrastructure does not automatically result in governmental solutions being infallible. In fact, some argue this has resulted in the misallocation of

56
resources and failure to meet demand for infrastructure goods (Cornes and Sandler, 1996:11; Graham and Marvin, 2001:94-99; World Bank, 1994:24-25). The co-ordination of the provision, maintenance and development of infrastructure is increasingly based on a view that neither the market nor government have ‘got it right’, and that the solution lies in combinations of both. Research and debate concerning infrastructure has focused on aspects of public goods in infrastructure that is used to justify a role for government (e.g. Bartzokas and Teubal, 2002). The focus is increasingly shifting towards assessing various roles of private actors, however. With regard to already publicly provided infrastructure and infrastructure services, this implies looking at the prospects for unbundling (splitting up) activities and resources to be developed and provided by both public as well as private actors (Cullinane and Song, 2002; Estache, 2001; Estache and de Rus, 2000; Graham et al., 2001). Unbundling rarely eliminates the arguments for government intervention, however. This is because scale and incentives related to infrastructure are still seen to be beyond what is feasible or desirable for private actors to undertake and reclaim costs from (e.g. Baird, 1999; van Ham et al., 2001). The argument is that business alone will crowd out the socially desirable aspects of infrastructure (e.g. Cullinane et al., 2002 referring to De Monie, 1996). The implication for the port is that the port authority takes on a regulatory role with the purpose of safeguarding public interest from being crowded out in the interplay amongst service providers in a port. This leaves an impression of the port as an administrative entity whose role it is to monitor a deregulated market for port services.
4.3 Governing the leftovers and crossovers
Two rather distinct lines of economic literature have evolved that analyse the role of infrastructure (Smith, 1997:90-91). One links total factor productivity growth with changes in the infrastructure capital stock (e.g. Gramlich, 1994; Munnell, 1992). The other focuses partly on technological infrastructures, and partly on socially constructed infrastructures upon which the use of a given technology depends (e.g. Day, 1994; Justman, 1995; Teubal, Foray, Justman and Zuscovitch, 1996). Both look for structural and economic justification as to how to intervene in the provision of economic goods they contend markets fail to sufficiently provide. Although direct government intervention remains a central theme, it is less dominant.

57
Foray and Teubal (1999) emphasize how and through what kind of policy processes the production of industry-specific public goods may be supported and facilitated. Industry-specific public goods are “resources which are both public in the sense that they are shared by a community of agents, and industry specific” (Foray et al., 1999:2-3). Examples revolve around skills and training requirements, certain capital goods, applied fields in basic research, particular technical standards and services, as well as supporting the provision of information about the advantages of a generic product. Whereas government may deal with co-ordination problems involved in the provision of public goods at a generic level, industrial associations are proposed as a means to manage this at the industry level (de Langen and Visser, 2004). A fundamental issue with regard to industry-specific public goods concerns how to approach opportunities to benefit from collective action, while at the same time avoiding the pitfalls of implementing collective action through existing institutions (Foray et al., 1999:4; Romer et al., 1993:347). Foray et al (1999:9) argue that Romer’s proposal for self-organising industry investment boards represents a neo-classical version of Technology Infrastructure Policy (TIP), as described by Teubal et al (1996). The interventionist argument is less explicit in Teubal and Andersen (2000:88). The authors emphasize that “an exclusive emphasis on supply has dangerous linear model of innovation overtones”. Approaching the demand side requires collective and cumulative learning in an interactive context, “within supplier – manufacturer and manufacturer – user networks”(Ibid, p.92). Attention to the co-ordination of supply and demand for infrastructure has been at the periphery of a debate around the governance of public goods. This focuses on giving guidance as to how public authorities should deal with the issue of infrastructure. Coleman (2000) argues infrastructure, as far as it adheres in the structure of relations between actors and among actors, cannot be contained within an organisational entity, but rests on the interaction from which it derives. There is a long but sidelined tradition in economic theory concerned about this issue. Kapp argued that the supply and demand of infrastructure was part of a social process occurring “within a network of interrelationships from which they derive their pattern” (cited in Heidenreich, 1998:975). The notion of infrastructure as a network of relationships is also argued for by Weiss and Birnbaum (1989). A technological infrastructure for invention and innovation, they argue, is provided by networks of relationships. An interesting question is how networks of relationships are the appropriate entities to internalise features that otherwise call for government

58
intervention, or whether they in fact are the cause of such features. A large and diverse body of literature argues for the salient features of networks as the breeding ground for (mainly positive) externalities, based on a variety of explanations for alleged market failure. There is reason to question, however, whether and when network externalities (unexploited gains from trade regarding network participation) are present, or whether they are network effects (when the value of an action is affected by agents engaged in equivalent action) that are offset and internalised within a market context (Liebowitz and Margolis, 1994). To me notions of infrastructure that derive their pattern from networks of interrelationships resemble technological trajectories as envisaged by Dosi (1988:225). This raises a number of issues. What kind of government intervention is called for and why? Should governments engage in providing or co-ordinating networks of relationships? If so, what governmental mechanisms are available for this task, and through what kind of agency can such mechanisms be implemented, co-ordinated and monitored?
4.4 The Actor Dimension
Advocates for the term infrastructure are not primarily concerned with the management of the individual facility or entity. They have rather concerned themselves with efficiency in the allocation of resources, national and social welfare, etc. Various implications for the management of infrastructure have been derived and developed against this backdrop, however. The non-discriminate actor arises as a compromise between issues applying to infrastructure, and in particular to ports as an example of infrastructure. It is an actor that can span a huge variation of appearances, ranging from the monopolistic provider of all activities to the impartial monitor of the same activities. Furthermore, the organisational form might be a technology centre or self-organising industry board. The fashion with regard to what shape managing bodies of infrastructures should take varies over time and space. Hence, what qualifies as infrastructure, and on what basis, differs. Over the last decades many services that were once provided by infrastructures are no longer dealt with in this manner. The term itself has proved very resistant, however, and one can still argue for many resources in terms of infrastructure that requires societal concern, although many of them are in the hands of private operators. The (re)turn to viewing infrastructure more in terms of a social capital inhering in the structure of relations between actors and among actors

59
(Coleman, 2000), deriving its pattern from a social process occurring “within a network of interrelationships” (Kapp in Heidenreich, 1998:975) is interesting, however. For it implies that a given allocation (and governance) of resources at any point in time is an enacted and interactive process. The agency with responsibility for infrastructure can withhold its active intervention. It can choose not to become an actor in the structure of relations that it is defined by. To some extent the agent responsible, rather than intervening in a market, replaces that market as the mechanism through which buyers and sellers interact to set prices and exchange goods and services. This turn is also interesting for another reason. In order to understand ports better, or as more than just as an example of infrastructure, it is necessary to re-assess and re-examine the structures of relationships defining ports, rather than viewing a port as a given allocation of resources that can or even should be managed in a particular way. There are alternative ways to assess the structures of relationships that so far have resulted in ports being viewed as an example of infrastructure. And, no doubt, the present way of accounting for these structures relevantly addresses issues that have been experienced and observed as critical. However, it is difficult to see how an approach that is set up to assess whether structures of relationships meet the criteria of being an infrastructure or not, is particularly suited to break loose from the constraints of a given theory and methodology to see anything else. Chapter Five elaborates further on one approach to do just this task, the INA, and explains why this approach is particularly suited for the purpose at hand.

60

61
5. Industrial Networks: a Tool for Port Analysis In this chapter the Industrial Network ARA model is proposed and outlined as a tool for identifying, capturing and analysing structures of inter-relationships in ports. In particular, an actor analysis is emphasized, by featuring actors against a background of activities and resources. Both activities and resources were also central to how ports were featured as actors in Chapters Three and Four. Logistics was predominantly focused on the activity dimension and infrastructure on the resource dimension. The framework to be discussed in this chapter differs in that actors do not appear as an a priori, confined set of collective goals and purposes to which all constituent elements are subordinate. Instead, actors acquire identity as actors in interaction with others (Håkansson and Snehota, 1995:195). In this respect only certain interpretations and perceptions of any particular actor are relevant. Actors are therefore defined by being perceived by others for whom the performing of activities and utilisation of resources are important. The next section of the chapter provides an historical overview and background details of the IMP tradition. This is followed by a discussion of the ARA model (Håkansson and Johanson, 1989; Håkansson and Snehota, 1995). Afterwards, section 5.3 makes links between ports and the ARA model for the purpose of port analysis.
5.1 The industrial network approach: some background
The INA has its origins in industrial marketing and purchasing. The initial IMP study was a pan-European investigation of the nature of dyadic relationships between industrial buyers and suppliers. The crucial finding that there is stability in the exchanges between buyer-supplier relationships was published in ‘International Industrial Marketing and Purchasing: An Interaction Approach’ (Håkansson, 1982). This resulted in the first central assumption within IMP; that of interaction. This seminar work challenged the common assumptions in industrial marketing and purchasing analysis by emphasizing: (i) the importance of relationships between buyers and sellers in industrial markets; (ii) active interaction between buyers and sellers involved in a transaction; (iii) the stability of industrial market structures where buyers and sellers are mutually aware and alert of each other; and (iv) the need for simultaneous analysis of both the buying and selling sides (Ibid., p.1). The Interaction Model is illustrated in Figure 5-1 below (Ibid., p24)

62
Figure 5-1: The interaction model
Whereas the Interaction Model connected dyads of buyers and sellers into long lasting business relationships, the second large empirical project (IMP 2) emphasized a larger structure as enveloping multiple interconnected business relationships; the industrial network. The project moved the unit of analysis from the study of dyadic relationships to focus on relationships in their network context. The INA views industrial markets as “…networks of relationships between firms” (Mattson, 1987:249). An industrial network is therefore a web of exchange relationships when one actor is connected to others through interaction (e.g. Håkansson and Johanson, 1988; Johanson and Mattson, 1985). The second IMP assumption of connectedness or interdependency originates from the IMP 2 project. Key examples of publications from this project are Axelsson and Easton (1992), Ford (1998) and Håkansson and Snehota (1995). The framework developed for studying industrial networks as a form of organisation is commonly known as the ARA model. It was developed by Håkansson and Johanson (1984) and further refined in Håkansson (1987) and Håkansson and Snehota (1995). The basis of connections amongst organisations is the exchange of resources and the inter-relationships between activity structures. Thus relationships between actors can be termed as exchange relationships. This means that “the industrial network is a specific structure which binds together actors, activities and resources in a certain pattern” (Håkansson and Johanson 1988: 375). An elaborate version of the initial framework, which serves as my basic reference to the INA, is
63
presented in Håkansson and Snehota (1995). This is discussed in more depth below as the basis for the analysis of ports in industrial networks. One of the main streams of industrial networks research has been in analysing technical development when starting out from the assumption of resource heterogeneity (e.g. Waluszewski, 1990; Wedin, 2001; Holmen, 2001; Gressetvold 2004; Baraldi, 2003). It draws on the seminal works of Penrose (1959) and Alchian and Demsetz (1972). What can be termed the third Industrial Networks model has been subsequently been developed in Håkansson and Waluszewski (2002b). These authors focus on the resource dimension of industrial networks in order to analyse technological development processes as requiring the interaction across four resource items; products, facilities, business units and business relationships.
5.2 Actors, resources and activities - the layers of substance
The framework for analysis that this study rests on contains three variables; actors performing activities and controlling resources; activities performed upon certain resources by actors in order to use or change other resources; and resources utilised as means for actors to perform activities respectively. There are three basic assumptions which underpin these three variables. First, the actor dimension within the ARA model primarily relates to the issue of identity. This is not a given feature, however. Instead, it is continuously shaped and moulded in ongoing interaction processes amongst multiple actors (Håkansson and Snehota, 1995; Huemer, 2004; Huemer, Becerra and Lunnan, 2004). A second assumption is that activities are interdependent. Any specific activity is interdependent on other activities to be performed in an activity chain across two or more actors. As the activities performed by one actor take place in response to activities performed by other actors, the central focus is with regard to how firms co-ordinate activity interdependencies across firm boundaries (Håkansson and Snehota, 1995:54; Dubois, 1998). This is in accordance with Richardson’s (1972) concept of closely complementary activities. Within the industrial network approach, the activity dimension primarily relates to specialization, economies of scale and the industrial division of labour. The third main assumption is that resources are heterogeneous. The value and productivity of any resource depends on which other resources they are combined with and what properties of a resource are utilised. As mentioned in the previous section, industrial networks research has analysed

64
technological development starting out from the assumption of resource heterogeneity (see Håkansson and Waluszewski, 2002b).
5.2.1 Joining layers of substance with functions
The three variables provide layers of substance at a company, relationship and network level. The three layers of substance are inseparable and intertwined across the three functional levels (see Easton, 1992 for more details). As illustrated in figure 5.2 below, at the company level, actor features are contained within an organisational structure, activity features in an activity structure and resource features in a resource collection. When moving to the relationship functional level, the individual company layers of substance are connected by actor bonds, activity links and resource ties. These join companies together in business relationships. Indeed, business relationships blur company boundaries, and changes in any layer of substance at the company level are likely to affect other firms. The network level is therefore an aggregation of bonds, links and ties that result from multiple inter-connected business relationships. In terms of the three layers of substance, these aggregates are referred to as a web of actors, an activity pattern and a resource constellation respectively. When the layers of substance and function are taken together, a framework for industrial network analysis is formed. The framework has its strength as an analysis tool for understanding the structures of networks. Put another way, “the main aim of the model is to make possible an integrated analysis of stability and development in industry” (Easton, 1992: 28). It captures how organisations with resources and activities engaged in exchange relationships can be substantively conceptualised in terms of actor bonds, resource ties and activity links. It further captures that business relationships form systems of inter-connected relationships that can be conceptualised in terms of webs of actors, resource constellations and activity patterns. One vital point that is worth reiterating is that business relationships are considered empirical and not analytical entities. In other words, neither business relationships nor industrial networks exist detached from empirical bonds, links and ties. Furthermore, exchange relationships exist whereby bonds, links and ties can be identified, whether these are acknowledged by companies or not. In this sense, a mutual orientation does not require intent at any level, only that bonds, links and ties exist. This implies that actors may be limited with respect to their horizon and perception of business

65
relationships and networks they may be part of (Anderson, Håkansson and Johanson 1994; Holmen and Pedersen, 2003).
Company/-organisation Relationship Network
Actors Organisational structure
Actor bonds
Web of Actors
Resources Resource collection
Resource ties
Resource constellation
Activities Activity structure
Activity links
Activity Pattern
Figure 5-2: The Actor – Resource – Activity framework from Håkansson and Snehota (1995)
5.3 Industrial networks and ports
The previous sections discussed how the ARA model permits the analysis of business relationships through the three layers of substance and function. The following section develops the ARA model as a tool for analysing ports. Below the text considers how ports and port authorities can be connected in an industrial network via the ARA framework. More specifically, this section views the model as a tool in order to raise questions such as; how does a port authority act; how can a port authority become an actor for its users; and do port authorities become actors?
5.3.1 Activity patterns, links and structures
The features of company-level resource collection shape company-level activity structures (and vice versa). The notion of an activity pattern is most frequently used to place the activity structure and activity links of a focal company and dyad within a network. Activity patterns consists of different activity chains that comprise “activities that are linked into a sequence, where activities of one company build on those performed by some others and enters into those of yet others” (Håkansson and Snehota, 1995:95).

66
A port-based activity pattern starts out in quay interfaces where activities are performed that directly or indirectly impact on port authority accounts. A port activity pattern can comprise many activity chains that are part of different activity patterns. Some of these may appear very similar and some very distinct when viewed from a port authority’s perspective. An activity-based analysis would emphasize a port authority in relation to the activity structure, activity links and activity patterns involved. When a port is described in terms of one kind of activity pattern, one way to perhaps more accurately describe it is as a port terminal that captures the particular activity pattern (e.g. a container terminal, ferry- and passenger terminal, oil terminal, etc.). It would be adapted to the specific features of activity patterns that are similar in some dimensions. For example, activity patterns that involve containers moving across quays may appear similar. Containers transported on trailers and trucks (Roll-on/Roll-off – Ro-Ro) require different adaptations as compared to containers that are not (Lift-on/Lift-off – Lo-Lo), however. In other words, from a port authority perspective, containerised transport may give rise to two kinds of activity patterns that require different adaptations in terms of activities and resources. Activity patterns may also be further differentiated. A Lo-Lo terminal may be differentiated according to whether containers are refrigerated or not, or what kind of handling resources are required. A Ro-Ro terminal may be distinguished in terms of whether cargoes are containerised or not, or the kinds of resources used to move cargo/trailers. Therefore, for the port authority, terminals represent several activity patterns that may require different kinds of adaptation. This is in particular the case when there are several terminals in place at a port.
5.3.1.2 A port activity structure
A port activity structure consists of all the activities that are performed to handle a corresponding port activity pattern and its constituent activity links. If one company co-ordinates and/or performs all these activities then the logical conclusion is to refer to this as a single company’s activity structure. Although it can be commonly thought of in such terms, this is not a typical set-up of a port. In most ports many companies are involved in co-ordinating and/or performing activities within a variety of activity chains. A port authority that is involved with actively handling different activity patterns will necessarily need to adapt to the resulting variety through adjusting its activity structure. Therefore, a port activity structure may embrace many actors and their corresponding activity structures. To

67
consider the port authority as an actor concerns how the activity structure of the port organisation is connected to the activity structures, links and patterns in the port district. The port activity structure is the centre of the analysis. This means that unless activity links are identified that directly or indirectly imply activation of the port authority’s activity structure, the port will not acquire features as an actor in the eyes of others.
5.3.2 Resource constellations, ties and collections
A resource-centred analysis of a port authority will emphasize first the authority in relation to the resource collection, secondly in terms of the resource ties and lastly with regard to the network-level resource constellation. This implies that a port-level resource constellation will starts out from whereby resources – typically usually quays - are utilised that directly or indirectly impact on port accounts. A port resource constellation may encompass several more or less distinct resource constellations as viewed from the perspective of the port authority. Often when a port is described as having one type of resource constellation it is in fact a port terminal. As with activity patterns that involve containers moving across quays, resource constellations that involve these containers may appear to be rather similar. It is somewhat obvious that containers transported on trailers and trucks (Ro-Ro) will require different resources when compared to those that are Lo-Lo. Containerised transport may thus require different adaptations on the part of the port authority into multiple resource constellations. Each terminal therefore represents several resource constellations from the port authority view point. What is less clear is the extent of adaptation required from the port. This implies that although the resource ties forming the different resource constellations may vary substantially, it is not given that they will impact differently in terms of the adaptations required from the port authority.
5.3.2.1 A port resource collection
If one firm controls all its resources it can be considered as a single resource collection. Although it can often be thought of in these terms, this is not a typical situation at a port. In most ports many companies are involved in the control and utilisation of resources handling a port resource constellation and its respective resource ties. As with activities discussed above, unless resource ties are in place that requires direct or indirect utilisation of the port resource collection, the port authority will not be viewed as an actor by

68
others. In other words, the port resource collection would be at the centre of an analysis. A port authority that is involved in handling different resource constellations will necessarily need to adapt to the requisite variety by making adjustments to its resource collection. But resources may also be controlled and utilised by other actors, and it is typical that there are many actors which affect port accounts. In other words, a port resource collection may encompass many actors with their corresponding resource collections. Considering the port authority as an actor therefore concerns how its resource collection is connected to the resource collections, ties and constellations in the port district.
5.4 The port actor: pooling, combining and mobilising
The port authority inheres in the structures of relations amongst industrial actors. The extent to which it is ascribed features and identity as an actor will vary, however. This is with regard to the characteristics of actor webs enacted from both resource constellations and activity patterns. It is likely that there will be variation in the extent to which a port authority is ascribed features and thus identity as an actor by others. Moreover, a port authority can be expected to attempt to influence their features and identity by various forms of intervention in activity patterns, resource constellations and actors webs. The use of the ARA model as an analytical tool suggests that there are three inter-related processes by which a port authority can intervene: by pooling activity interdependencies; by combining heterogeneous features of resources; and by mobilising actor identity. The primary or focal carrier of identity, interdependency and heterogeneity in an industrial network perspective is the firm (Snehota, 1990). Nonetheless, companies address interdependency, heterogeneity and identity through business relationships. A characteristic feature of a business relationship is that it always entails interaction whereby the involved companies become mutually oriented (Håkansson, 1982). This means that in the INA, both empirically and analytically, business relationships are the joint carriers of interdependency, heterogeneity and identity. An individual firm addresses interdependency, heterogeneity and identity through levers or mechanisms available within its activity structure, resource collection and organisational structure. On a business relationship level, the three intervention processes are addressed through activity links, resource

69
ties and actor bonds. It is still firms that individually or jointly address interdependency, heterogeneity and identity through business relationships, however. Business relationships do not do anything apart from nourishing themselves upon the resources of the involved firms (Håkansson and Snehota, 1995:387). In spite of this, descriptions of a business relationship may come to appear as so infused with features akin to those of a firm proper, or as a property of one of the firms involved, that they may be analysed as quasi-firms (Blois, 1971). The implications of this are serious, as the interaction casting the relationship becomes seen as a feature of the relationship itself and not the actions of the involved actors. A business relationship may thus be analytically endowed with its own interdependencies, heterogeneities and identities, interpreted in the eyes of the business relationship itself. Nevertheless, business relationships remain empirical rather than analytical phenomena in industrial network research. Another feature of the INA is the idea that business relationships interconnect and form aggregated structures. This opens for a network level of analysis. In the INA, networks of interconnected business relationships are defined and confined by interaction amongst firms, not by location or activity. An industrial network does not qualify as a carrier of interdependency, heterogeneity and identity, however. Instead, interdependencies, heterogeneities and identities are continuously moulded within it through interaction. The interacted moulding of activities, resources and actors is what shapes the industrial network. The above discussion raises two analytical fallacies regarding the conceptualisation of ports as actors in industrial networks. One concerns a need to maintain firms and business relationships as empirical entities, the other the need to be aware that inter-connected business relationships form analytically aggregated and open network structures. Both result in constraints or burdens in terms of linking ports as phenomena to be analysed within an industrial network by the ARA model. The port authority is a public unit, not a business actor as is typical in IMP studies. Indeed, as mentioned in Chapter Two, it is fair to say that the model is not especially attentive to contextual structures beyond networks of interconnected business relationships (e.g. Hadjikhani and Sharma, 1999; Halinen and Törnroos, 1998; Welch and Wilkinson, 2004). Typically, actors that may have a recognised but indirect impact on business behaviour through other levers than interaction and exchange amongst business actors are exogenous to the model. Such actors may be recognised as crucial in a firm, relationship and network context, but they are largely

70
taken for representing phenomena the model or approach is not set up to handle. Something being exogenous does not necessarily imply neglected or understudied, however. Research about how actors in networks affect, respond and react to exogenous influence and impact are far from unexplored within industrial networks research (e.g. Persson and Steinby, 2006; Salmi, 2000; Harrison, 1999). Nor can there be any doubt that such impact goes both ways. Presumably, anti-trust legislation, programs to fund industrial research and development or responsibility for health and environment is based on a belief and experience that certain business practices, or lack thereof, call for adequate societal response. In sum, general social citizenship, consumer or government behaviour issues have so far not been central issues to be systematically explored within the INA. This implies a two-sided challenge when studying ports. First, to position ports with regard to the ARA model, which would substantiate ports as relevant for industrial networks and vice versa. Making sense of the organisation and governance of port operations needs to be addressed. Various groups of actors need to be distinguished, e.g. port users, the port organisation, to owners and to consumers in general. The second part of the challenge is to actually conduct an analysis and discuss the subsequent implications of so doing. .
5.5 Summary
This chapter has proposed the ARA model as a tool through which to analyse how a port authority could be analysed as actor in INA via its actor, resource and activity dimensions. The analysis tool and the three processes of pooling, combining and mobilising have been presented. In the next chapter, each of the three port cases begins with a general description and background. This is followed by a description of what characterizes the port authority in terms of its activities in relation to the activity pattern, its resources in relation to the total resource constellation and its role in terms of interaction with other involved organisations. This includes the efforts made by a port authority to influence its features and identity.

71
6. Three Cases of Ports This chapter uses the ARA model presented in the previous chapter as a tool to describe and analyse three Norwegian ports, Aalesund, Karmsund and Grenland respectively. The emphasis is on exploring the actor dimension. Overall, the chapter exemplifies how general industrial network analysis of ports may look. The chapter begins with a short introduction to Norwegian ports, before presenting Aalesund, Karmsund and Grenland Ports in turn.
6.1 Norwegian ports
All Norwegian ports are defined within a geographical and administrative space; that is, a port district. A variety of technical and organisational elements facilitate the safe access and passage for vessels to, from and through the port district, as well as enabling their loading and unloading. Quays are important elements that affect the utilisation of resources for the purpose of loading and unloading vessels in all port districts. Apart from connecting landside and seaside port use, quays are of particular interest here as the registration of loading and unloading is made with reference to quays. They therefore connect a port organisation to both landside and seaside port use and users. In Norway, municipalities apply for the establishment of a port district within which jurisdiction over elements such as quays can be exercised. Although municipalities may handle port matters as part of the ordinary municipal administration, it is common to delegate the management of the jurisdiction to a port authority. Different legal enterprise forms may furthermore be chosen for port authorities, e.g. municipal enterprise (KF) or inter-municipal enterprise (IKS), but even limited company (AS) is in principle an option. Aalesund, Karmsund and Grenland ports refers to elements that, as a matter of location, are influenced by the jurisdiction of respective port authorities. The actor dimension of ports concerns the port authority’s ways of interacting with other actors in order to provide, maintain, develop and organise the port. As Norwegian port authorities operate under a public service mandate, this may well impact on port authorities’ possibilities to interact with other actors. Figure Three below illustrates the 22 main ports along the Norwegian coastline (www.Kystverket.no). The respective locations of Aalesund, Karmsund and Grenland ports are indicated.

72
Figure 6-1: The Main Ports along the Norwegian Coastline
6.1.1 Principles of port finance
Port finances have been a closed system since 1738. In other words, they have been kept separate from the finances of its owner, whether the state

73
(before 1894) or the municipality (after 1894). Port finances were to be earmarked for port purposes only, and were not to be considered as taxation. Ports had their own revenue incurred by fees, and were supposed to cover their own costs. This is referred to as the self-financing principle. When subjugated to municipal ownership in 1894, ports’ status as independent legal units was lost, however. The new owners’ ability (or willingness) to discern between financial streams was met with distrust, resulting in the principle being retained in all subsequent port legislation. For example, the fees proposed by the port board in the budget, which have to be approved by the municipality, may be reduced but not increased by that municipality. The non-tax/self-financing principle assures that port revenues are not imposed by the municipality for fiscal purposes, but instead for the continued provision of port services to port users. Fees for port use are incurred on and for the benefit of the individual port user. This implies that revenues shall cover costs both at the level of the individual facility and the port as a whole. The use of quays is not supposed to carry the costs or cross-subsidise other users of the same or other quays. The cost-responsibility principle implies that it is the actual costs related to the actual use of a cost-carrier that incurs a fee. Thus means that costs related to investment shall not be shifted to port use that is not related to the particular cost. In other words, users shall in principle not pay for investments that they do not make use of. Indeed, there are examples of port-related assets acquired by the municipality prior to 1984 which are classed as port assets (supposedly for practical reasons). Making claims to the port for hire or to returns from sale of these assets today would require the municipality to prove that the asset was acquired for municipal funds and not port funds. If they were acquired from port funds, any revenue is for port purposes only. In other words, it is the port authority’s statutory duty to safeguard the interests of port users (those that pay for use) from the interests of port users in a wider sense (e.g. municipality and other stakeholders). As long as these principles apply, port authority operations are not seen as profit motivated. This further allows both port and municipality to guarantee for investments, provided that these do not favour particular operators or users of facilities. This could result in distorted competition between operators or users, including the port authority if it is the operator of public port facilities. The next section of the chapter presents and discusses the first embedded case, that of Aalesund Port.

74
6.2 Aalesund port
Aalesund is situated in Møre and Romsdal County on the north of the Norwegian West coast. Fisheries and associated industries mark Aalesund Port and the wider region, as they have done for centuries. Aalesund Port Authority is the managing body for the Aalesund Port District. Aalesund Port is owned and organised as a municipal enterprise or KF. The 2003 port charter clearly reflects the close connection between port management and port owner, along with the order of priority between the purposes of the port and those of the municipality [my translation]: “Aalesund Port KF is the municipality’s professional body on port matters. Aalesund Port shall administer tasks delegated to the municipality according to the Port and Seaways Act. Aalesund Port shall ensure rational and efficient port operations, monitor traffic in the port district, and own and administer Aalesund Port assets. The aim is for the best possible resource utilisation for users of the port and for the municipality, and the development of the port according to objectives decided for it. The maintenance and development of the port and its traffic may involve Aalesund Port in other port-related activity when beneficial and suitable for general port activity. The port may also participate in the ownership of other companies when in accordance with the purpose of the port and laws regulating the municipality’s participation in companies and commercial activity. Aalesund Port may also hire and rent property if it is in accordance with the purpose of the port. Lastly, the port may undertake tasks imposed on it by the city council as long as it is in accordance with the purpose of Aalesund Port KF”. (Ålesund Port, 2003: §2, 1-3) Vessels register and berth for loading and unloading passengers and goods at 96 quays in Aalesund port district. 68 of these are owned and operated by private companies. The other 28 quays are publicly owned and administered by the port authority (but not operated by it). A total of 1,350,000 tonnes of goods were moved across quays in Aalesund Port District in 2001. 200,000 tonnes of goods (15% of the total) was moved across public quays, and 1,100,000 tonnes (85% of the total) was moved across private quays. 7 of the 28 public quays handled more than 1,000 tonnes of goods, 5 of them more than 10,000 tonnes and one of them - the public container terminal - more than 100,000 tonnes. These 7 quays then accounted for about 98% of what was moved across public quays. 27 of the 68 private quays handled more than 1,000 tonnes, 17 of them more than 10,000 tonnes, and one more than 100,000 tonnes. In total, 14 of the private

75
quays account for approximately 75% of all cargo moved across quays in Aalesund port district. In terms of the types of goods involved, six of the private quays register approximately 500,000 tonnes (40% of the total cargo registered across Aalesund quays) for goods such as oil, petrol and construction materials. Fish is predominantly moved across private quays. It accounts for 580,000 tonnes, or about 45% of the total. Aalesund Port is therefore marked by fisheries in terms of the proportion of cargo moving across quays and because of the large volumes of petrol and salt used in relation to fisheries.
Figure 6-2: The movement of fish across quays in Aalesund Port District, 2001.
Passenger transport makes more use of public quays in Aalesund Port than does goods transport. Many calls of the 15,000 vessels were related to passenger transport, such as the Hurtigruta and large cruise vessels. These calls account for about 10% of the calls made, but only for 1% of the goods moved across Aalesund quays. Figure 6-2 above provides approximate data for the inbound and outbound flows of fish cargoes. It also indicates how these cargoes are shipped (Aalesund Port authority 2001 statistics, all data is in 1,000 tonnes). The outbound data reflects the use of reefer or container transport vessels with equipment to control the temperature of cargo. Nearly all fish is exported (97%). The inbound data reflects fishing vessels delivering fresh fish and fish frozen at sea, and also some transport vessels landing frozen raw material from overseas. More than 90% of unloaded fish cargoes have a domestic origin.
Port Inbound: 290’ t
Outbound: 290’ t Total: 580’ t
Domestic 268’ t Bulk 1’ t Container 1’ t General cargo 266’ t
Exports 281’ t Container 171’ t General cargo 110’ t
Domestic 8,6’ t Container 0,2’ t General cargo 8,4’ t
Imports 25’ t Container 13,5’ t General cargo 11,5’ t
Inbound Outbound

76
Further analysis of this data reveals that loading and unloading activities at just 8 private quays accounts for 395,000 tonnes (68% of the total fish handling and 30% of the total handling in Aalesund Port). There are 233,000 tonnes of inbound goods and 161,000 tonnes of outbound goods. The differential is for a large part explained by the use of services berthing at the public container terminal operated by Tyrholm and Farstad, for goods transported by road (e.g. for the domestic market), and by waste or other use of spoiled material from production. Together the nine quays account for the vast majority of fish/cargo movements across quays in Aalesund Port District. It is clear that whatever lies behind these figures explains a great deal about utilisation for the purpose of loading and unloading vessels in Aalesund Port District, and also about the context for the port authority as an actor. Company, quay Total
2001 Unloaded 2001
Loaded 2001
Export 2001
Sunnmøre Fiske- industri/Normarine
29,000 18,000 11,000 10,000
West Fish 22,800 19,200 3,600 2,700
Fjordlaks 31,500 19,500 12,500 10,000
Global Fish 22,500 22,485 28
Br. Sperre 38,000 26,500 11,500 11,300
N. Sperre 37,000 25,000 12,000 10,500
Kloosterboer 138,000 70,000 67,500 64,500
Norcargo Møre 76,000 33,000 43,000 27,000
Total 394,800 233,685 161,128 136,000
Table 6-3: Cargo/fish registered across 8 private quays (1,000 tonnes)
6.2.1 Aalesund port authority
First and foremost, Aalesund port authority is characterized by administrative aspects. These are defined by reference to the owner (Aalesund municipality), the Local Government Act, along with the Port and Seaways Act. The latter regulates what a port authority may engage in and how. Aalesund Port Authority claims not to have connections to the owners

77
of goods, and vessels are not mentioned as a part of the port context, even if the revenue incurred on vessels amounts to more than fees from renting out public quay facilities to terminal and logistics operators. Aalesund Port Authority lists five main operative areas; maintenance, administration and management, seaways administration, marketing and development, and investment/property development. Of the 12 employees, two are maintenance personnel and five are port inspectors, with the remaining five holding administrative roles. The extent to which the port authority interacts with port users occurs primarily through maintenance personnel and port inspectors. Maintenance involves patrolling the port district, supervision and control of navigation marks, quay facilities and buildings, etc. Port inspectors (the port watch) supervise and monitor activity in the port. For example; they register vessels and assign berths at public quays and they register vessels at private quays. They may also assist vessels with electricity and fresh water supplies. Only a small proportion of port authority revenues are generated from services provided by port authority personnel. The main revenue sources are from fees incurred by vessels for the use of seaways, fees on cargo operations at public quay facilities and for the hire of public facilities to operators. ‘Administration and management’ tasks imply accountability to the municipality and the Port and Seaways Act. In practice, this involves tasks such as fee collection, budgeting and accounting, rate setting, etc. An increasingly important task is statistics and reporting to both Norway and the EU at large (e.g. the EU Directive for Environmental Disposal at Public and Private Quays, the ISPS/port security code, etc.). ‘Seaways administration’ is the third main operative area. It requires procedural responsibility for issues regulated by the Port and Seaways Act. For example, facilitating the safe and efficient traffic between sea and land requires attending to sea entrances, lighthouses and navigation marks within the port district. Seaways administration is also an interface to the coastal administration’s area of responsibility. The fourth and fifth areas, ‘marketing and development’ and ‘investment and property development’, are tasks catered for by the administrative personnel. Marketing and development tasks rely upon services and facilities provided by existing port users. It is in co-operation with existing and potential users in a wider sense that marketing and development tasks involve the port authority. For example, attracting cruise ships is one issue with which Aalesund Port is involved through participation in a regional association consisting of some 170 actors with interests in regional tourism. The port

78
authority seldom initiates events for this purpose, but may facilitate them in various ways, first and foremost by making areas available at the quayside. The main marketing and development task is to facilitate the continuous improvement and expansion of port services to paying port users. ‘Investment and property development’ refers primarily to new building, rehabilitation of existing facilities and the acquisition and sale of property. It may also involve the redefinition of what assets are for port purposes. Whereas marketing and development activities largely rely on port users wishing to expand their business with port facilities as a part of their strategy, investment and property development is extensively related to policy and regulation. Therefore it is also part of the Port Authority’s administration and management operative area. The next section of the chapter describes what characterizes the port in terms of activity structures, activity links and activity patterns
6.2.2 Activity patterns, links and structures
It goes without saying that many activity patterns impact on Aalesund Port. Each activity pattern contains activities performed by several companies, and within each activity pattern there is likely to be several activity chains. Activity links exist both between activities within the same chain and across chains. Companies perform a set of activities – the activity structure – that is part of one or more of these activity chains. Two examples of activity chains and how they load on quays in Aalesund Port (see table 6-3 above), those of Global Fish-Tjujino and West Fish-Rema, are provided below.
6.2.2.1 The Global Fish – Tsujino activity chain
Global Fish produces pelagic fish for human consumption and industrial processing. The headquarters and a production facility are situated in Aalesund, with several other production facilities located along the West coast of Norway. More than 200,000 tonnes of fish is produced each year, making Global Fish a large producer in a European and international context. The Aalesund factory produces round fish and fillets of mainly herring and mackerel, but also capelin and horse mackerel. As Global Fish have factories at other locations along the coast, activities performed in Aalesund need to be co-ordinated with these. Global Fish’s activity pattern consists of many partly overlapping but still distinct activity chains. Figure Five (below) approximately illustrates an activity chain directly impacting on two quays in Aalesund port, one at Global Fish’s own quays (A) and the other one at the Tyrholm and Farstad-

79
operated public quay (B). This particular activity chain is connected to a business relationship between Global Fish and Tsujino, a longstanding Japanese customer for frozen mackerel. Figure 6-4: The Global Fish – Tsujino activity chain
In the autumn of each year, fishing vessels take turns to land a catch of mackerel at the Aalesund factory. Global Fish has bid for the catch on a fish auction, certain that Tsujino will buy whatever volume (but not quality) of mackerel produced within a certain period (August 15th – 1st December) of the catching season. When berthed at the factory quay, live fish are pumped from tanks in the vessel into a tank on land. A Tsujino inspector is present in order to verify the unprocessed fish. He has the authority to accept or reject the catch. Provided the inspector accepts the catch, from then on the mackerel is moved to processing lines inside the factory. Here it proceeds through a sequence of processing activities geared specifically towards Tsujino. The fish is then cold stored, mainly at Global Fish’ own facilities, awaiting shipment to Japan or China for further processing. When it is dispatched for shipment in refrigerated containers, the fish is sent by road to Skutvika container terminal. This is a public quay operated by Tyrholm and Farstad that handles the cargo from terminal to vessel. The shipping agent used varies by the available capacity, with Maersk as the preferred carrier for both Global Fish and Tsujino. Maersk accounts for 40-50% of all transportation for Global Fish. A Maersk vessel berths at Skutvika each week. The service sails on to Hamburg and Rotterdam. Both

80
are major hubs where containers are re-routed on one of Maersk’s many Europe-Asia services in accordance with Tsujino’s preferences for delivery. Skutvika is chosen due to the size of the vessel and volumes of cargo. Norcargo is the agent for Maersk in Norway. In reality, it would prefer to host and handle the Maersk service at its own quay, particularly as Norcargo and Tyrholm and Farstad compete as shipping agents. However, there is a longer and more inconvenient entrance to the Norcargo quays. Maersk would also prefer that Tyrholm and Farstad concentrated on terminal operations rather than competing with Norcargo as the shipping agent. (Engelseth, 2006a, b; Harrison, 2003a)
6.2.2.2 The Global Fish activity pattern
The Global Fish-Tsujino activity chain connects to various other activity chains. Global Fish has many customers, and based on Global Fish’s own categorisation, there may be 10-20 activity chains. Not all are customised to the requirements of a particular customer. However, generally the activity chains attached to Japanese customers differ from those attached to Eastern European customers. For the “August catches” there is only one customer, resulting in a customised activity chain for the Japanese company Dolphin. Global Fish attempt to co-ordinate activity chains in order to economise in their overall activity pattern. One clear reason for this is that both the costs and revenues for catches going into different activity chains vary substantially. For some activities performed by Global Fish, standardised and customised activity chains overlap. This implies that activities that are closely adapted to the activities of one customer may not be so with regard to other customers. The catch conditionally accepted by the Tsujino controller early in the morning may be rejected an hour later. From then on, the same catch is part of a different activity chain, e.g. for East-European customers (although the activities involved are very similar). Indeed, as backlogs occur activities may be identical amongst different activity chains as the outcome of activities that have been performed towards one customer is used for another customer. Mackerel for the East European market is usually palletised and shipped by reefer vessels, however. Reefer vessels pick up cargo at cold storages rather than at the container terminal. Outcomes from the activity chains directed towards East European customers may therefore be cold-stored and shipped from several alternative private cold storages and quays.

81
When backlogs in production take place due to a rejection of a catch by a Tsujino inspector, costs are incurred for activity chains whereby the margins do not necessarily cover the costs of activities performed towards the Japanese. The premium price paid by Japanese customers for superior quality in their activity chains may therefore in part turn out to be the margins of other activity chains. A tentative activity pattern indicating various activity chains of Global Fish is depicted in Figure 6-5 below.
Figure 6-5: The Global Fish activity pattern

82
6.2.2.3 The West Fish – Rema activity chain
West Fish owns factories in Aalesund and Northern Norway. The company controls a fleet of trawlers with their own quotas. The most important suppliers of raw materials are vessels in the coastal fleet, which supply approximately 50% of the input needed. In addition, West Fish’s own trawlers supply 25% of the raw material inputs. The main product types are frozen codfish in various forms, salt fish, klipfish, frozen pelagic fish, products for the retail market (own and private brands) and fresh fish. The Aalesund factory processes klipfish, frozen pelagic fish, frozen fish packaged for the retail market and also some fresh fish. West Fish supply Rema, a Norwegian retail chain, with some frozen fish products for the consumer market. In particular, over one million units a year are sold of a 625-gram ‘retail package’ of frozen saithe produced at the Aalesund plant. Saithe is supplied to West Fish in industrial size blocks by their own trawlers and those managed for other companies. The blocks are cold-stored at West Fish’s Aalesund plant in order to ensure continuous production throughout the year. NorCargo collects West Fish products at Skarbøvika twice weekly. Distribution takes place by road to Rema cold storage facilities licated around Norway. Rema’s own vehicles make the ‘last-mile’ distribution. Saithe is apparently not a high profile product for West Fish. Nevertheless, regular collection and sale on a weekly basis eases production planning, not only in Aalesund but also for other West Fish sites. The saithe block is important for the Aalesund plant, accounting for as much as 40-50 % of the total annual production (Olsen, 2003)
6.2.2.4 The West Fish activity pattern
Saithe production is not the primary focus of West Fish. Instead, the company has a predominantly cod-based strategy geared towards high price – high quality products sold to large retail chains in the UK, France and the US. High-value cod activity chains, such as individually quick-frozen fillets (loins, tails and centre cuts) from West Fish’s production facility in Båtsfjord must still co-ordinate with the saithe activity chain. This is because vessels do not only catch and deliver cod. Some fish are too big to be used in the production of fillets and instead are an input in the production of salt fish. Some are the wrong species, e.g. redfish. Still other species, such as catfish, may be sold fresh on the fish market for acceptable prices. In sum, approximately only 60% of the raw material may be used for high value production. In other words, it is

83
important that one of West Fish’s production plants can buy and process saithe. This activity has value both for other processing plants and for West Fish trawlers that have saithe quotas. The latter need a buyer in order to avoid selling saithe catches as a low price bi-product to fishmeal producers. For West Fish, the issue is to extend the productive period of a factory in order to spread fixed costs.
6.2.3 The port as an activity structure
The above text exemplifies fragments of activity chains, links and structures that impact on Aalesund Port. Only a limited set of the interdependencies across activities that are performed in the context of Aalesund Port have been illustrated. In total, however, there are many interdependent activities being performed involving quays within Aalesund Port District. Furthermore, it is not only companies performing activities upon quays in Aalesund Port District that attempt to co-ordinate activities in order to economise on their overall activity pattern. Aalesund Port is obliged to take an interest in economising by co-ordinating activities that utilise resources in the port district. It is therefore possible to consider the aggregate of activities performed upon quays within Aalesund Port District as one activity structure directed towards serving customers of, for example fish from Aalesund Port. What is not straightforward is to proceed to the idea of any centralised governance of such a structure being exercised, especially not by the port authority. In Figure 6-6 below the eight private quays discussed in Table 6-3, plus the Tyrholm and Farstad operated public container terminal, are depicted as thick dotted lines. The Global Fish – Tsujino activity chain is inserted in the Figure. Similar activity chains can be depicted for all the other relevant quay interfaces, producing a large number of planned and unplanned interdependent activities. It is easy to overestimate the degree of deliberateness involved in co-ordination and adaptation between activities. Much can simply result from the price mechanism allowing, for example, a transport company to offer generally lower prices as unit costs are reduced by good utilisation of capacity. Economies of scale are thus created in the performing of an activity.

84
Figure 6-6 An activity chain depicted in a diagram of nine Aalesund quays.

85
Activities related to catching, processing and distribution have historically been considered as heavily interdependent. They have also generally been thought of as relatively spatially confined. It is not necessarily the case that processing is particularly pivotal to the utilisation of quays, however. It may be far more important for quay utilisation at Aalesund that generalised transportation costs do not exceed those of the costs for vessels with processing facilities to deliver elsewhere. New technologies, whether on- or off-shore, have broken or intercepted traditional interdependencies. This has occurred due to features such as on-board processing facilities. For a port activity structure what is important is that Aalesund Port does not primarily depend on activities performed by companies in Aalesund, only that local activities imply quay utilisation within the port district. On the one hand, processing at sea does not necessarily mean much to the port. However, this has implications for which quay resources are activated and what activities will take place upon landing and dispatching cargoes. For example, high-value fresh fish production is unlikely to generate a balanced pattern of movement across quay interfaces. Yet what it can provide access to improved landside distribution arrangements. The West Fish and Global Fish quays are mainly used for the input of raw material. They are central in the organising of the distribution arrangements, in which relationships to Rema and to Tsujino are central. Indeed, as distribution solutions for these customers become fixed, they become resources that may be used for other customers. A second group of companies use their quays for both inbound and outbound logistics, both for themselves and for others. Actors such as Norcargo and Kloosterboer use their quays both for inbound and outbound logistics for others only. The three groups have then different qualities with regard to creating scale economies in and across activities. Each group attempts to combine and connect elements of individual activity chains in order to economise on their overall activity pattern. Business relationships may often be a starting point for the combining and connecting efforts companies undertake. In other words, at a relationship level activity patterns do not start out in the individual company, but in the resource interfaces upon which activities are performed that impact on the activities of both parties. Section 6.2.4 below further considers the resource argument.

86
6.2.4 Resource collections, ties and constellations
A variety of technical and organisational resources facilitate the safe access and passage for vessels to, from and through the port district, as well as enabling their loading and unloading. This section of the chapter discuses some of the important companies involved, before moving on to consider examples of relationships, distribution arrangements and facilities. The resources that are important for Aalesund Port include fish. The most important resource for Aalesund Port, however, is companies that buy catches for landing at quays within the Aalesund Port District. Table 6-7 below illustrates the total volumes of fish registered by companies at Aalesund quays. Total
2001 Unloaded 2001
Loaded 2001
Export 2001
Turnover* 2004/ 2003
Sunnmøre Fiske- industri/Normarine
29,000 18,000 11,000 10,000 301/336
West Fish 22,800 19,200 3,600 2,700 265/510
Fjordlaks 31,500 19,500 12,500 10,000 463/406
Global Fish 22,500 22,485 28 760/835
Br. Sperre 38,000 26,500 11,500 11,300 586/498
N. Sperre 37,000 25,000 12,000 10,500 435/332
Kloosterboer 138,000
70,000 67,500 64,500 35
Norcargo Møre 76,000 33,000 43,000 27,000 n.a.
Total 394,800
233,685 161,128
136,000
2810/2917
Table 6-7 Registered across Aalesund quays
First, Sunnmøre Fiskeindustri/Normarine has a long history of seafood processing and export. The Aalesund export company Normarine bought Sunnmøre Fiskeindustri in 2000. At present, the main activities are cold storage, supply of bait to longliners and terminal services. Normarine products originate from factories along the coast and factory vessels. The company buys frozen fish (mainly white fish), but also farmed salmon and trout products from vessels and fish auctions in Norway. The main markets are the USA, EU, Japan and Russia.

87
Fjordlaks was established in 1973 to produce smoked wild salmon and peeled prawns. They later started their own production and a salmon and trout farm was in place by 1976. A wish to diversify led to the acquisition of a klipfish production facility in 1985. The Fjordlaks concern includes Fjordlaks (klipfish), Fjordlaks Aqua (salmon, trout and fish oil), and Fjordlaks Marine (fresh cod and coley). Both the Fjordlaks headquarters and a modern trout processing and cold storage plant are situated in Aalesund. Br. Sperre produces and exports round frozen pelagic, salted and dried fish. The range of products includes round mackerel, horse mackerel, herring and capelin processed at land, along with fillets of cod, saithe, haddock and herring frozen at sea. The products are exported worldwide. N. Sperre supplies fresh, frozen, wet-salted and dried salted fish. The company has one processing plant each for pelagic and white fish. Sperre Trading Ltd. is a subsidiary located in north Norway that since 1982 has specialized in the export of dried- and wet-salted fish. N. Sperre owns two vessels, M/V Koralnes and M/V Langenes, both of which are combined fresh and freezing trawlers with quotas for white fish and shrimps. Kloosterboer Terminal Norway offers 20,000 tonnes of modern cold storage capacity and a wide range of collateral service functions in Aalesund. It is an independent cold-storage terminal operator that is part of a Dutch company specialising in such terminals. The terminal is approved as control centre for the import of fish and fish products from countries outside the EU/EEA area. Kloosterboer has a capacity to store 220 containers on electricity, a large empty containers depot and frequent feeder line services. This offers a complete package of services for all frozen fish. Overall, Kloosterboer’s business is more in goods handling than storage. The last company listed in Table 3 is Norcargo Møre, is a division of Norcargo Norway. The company transports 400,000 tonnes of fresh fish (mainly salmon), most of which passes through its inland terminal rather than through its facilities at Skarbøvika in Aalesund. The main customers in the Aalesund region are Fjord Seafood, Coast, Seaborne, Ålesund Fish and Fjordlaks. For the transportation of pelagic fish, Global Fish, West Fish, Nils Sperre and Br Sperre are the biggest customers. Approximately 100 containers are shipped each week via Norcargo’s quay, which is situated adjacent to Kloosterboer’s quay. Norcargo also have a 2,000 square metres cold storage depot in the centre of Aalesund. All cold-stored and frozen fish goes from Norcargo at Breivika or the public container terminal at Skutvika. Tyrholm and Farstad operate the Skutvika terminal. They handle more than 100,000 tonnes of containerised fish, a large proportion of which is accounted for in the discussion above.
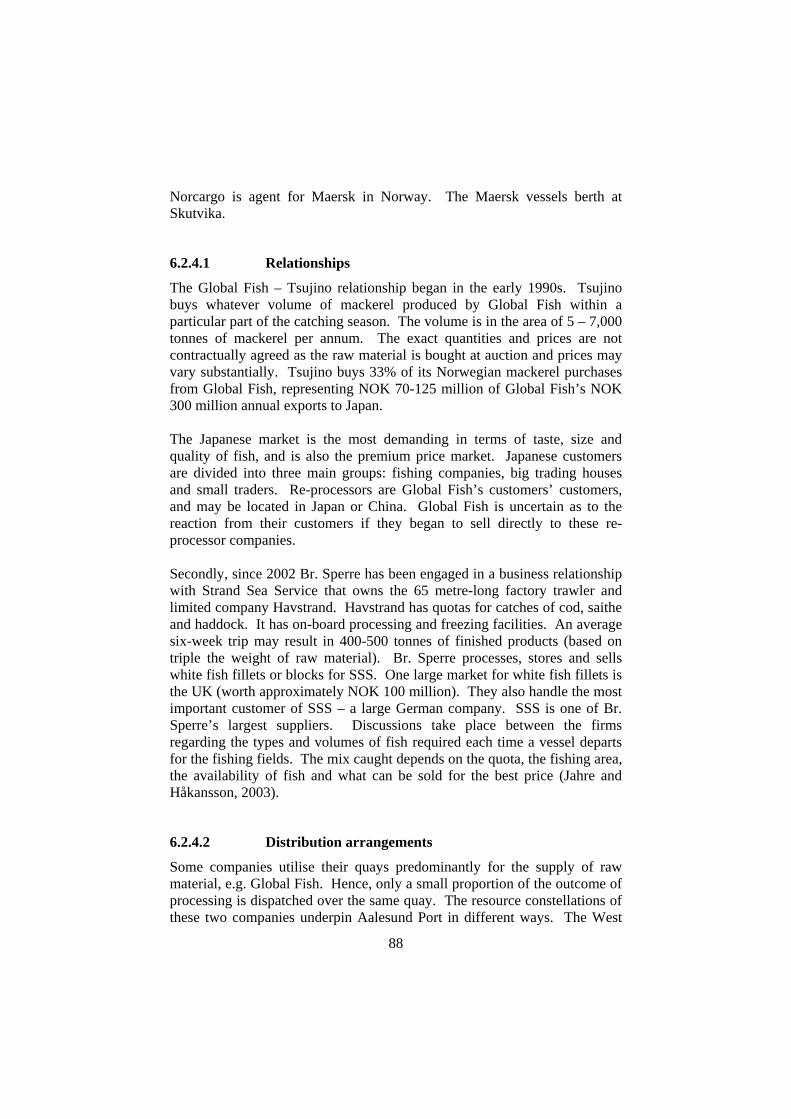
88
Norcargo is agent for Maersk in Norway. The Maersk vessels berth at Skutvika.
6.2.4.1 Relationships
The Global Fish – Tsujino relationship began in the early 1990s. Tsujino buys whatever volume of mackerel produced by Global Fish within a particular part of the catching season. The volume is in the area of 5 – 7,000 tonnes of mackerel per annum. The exact quantities and prices are not contractually agreed as the raw material is bought at auction and prices may vary substantially. Tsujino buys 33% of its Norwegian mackerel purchases from Global Fish, representing NOK 70-125 million of Global Fish’s NOK 300 million annual exports to Japan. The Japanese market is the most demanding in terms of taste, size and quality of fish, and is also the premium price market. Japanese customers are divided into three main groups: fishing companies, big trading houses and small traders. Re-processors are Global Fish’s customers’ customers, and may be located in Japan or China. Global Fish is uncertain as to the reaction from their customers if they began to sell directly to these re-processor companies. Secondly, since 2002 Br. Sperre has been engaged in a business relationship with Strand Sea Service that owns the 65 metre-long factory trawler and limited company Havstrand. Havstrand has quotas for catches of cod, saithe and haddock. It has on-board processing and freezing facilities. An average six-week trip may result in 400-500 tonnes of finished products (based on triple the weight of raw material). Br. Sperre processes, stores and sells white fish fillets or blocks for SSS. One large market for white fish fillets is the UK (worth approximately NOK 100 million). They also handle the most important customer of SSS – a large German company. SSS is one of Br. Sperre’s largest suppliers. Discussions take place between the firms regarding the types and volumes of fish required each time a vessel departs for the fishing fields. The mix caught depends on the quota, the fishing area, the availability of fish and what can be sold for the best price (Jahre and Håkansson, 2003).
6.2.4.2 Distribution arrangements
Some companies utilise their quays predominantly for the supply of raw material, e.g. Global Fish. Hence, only a small proportion of the outcome of processing is dispatched over the same quay. The resource constellations of these two companies underpin Aalesund Port in different ways. The West
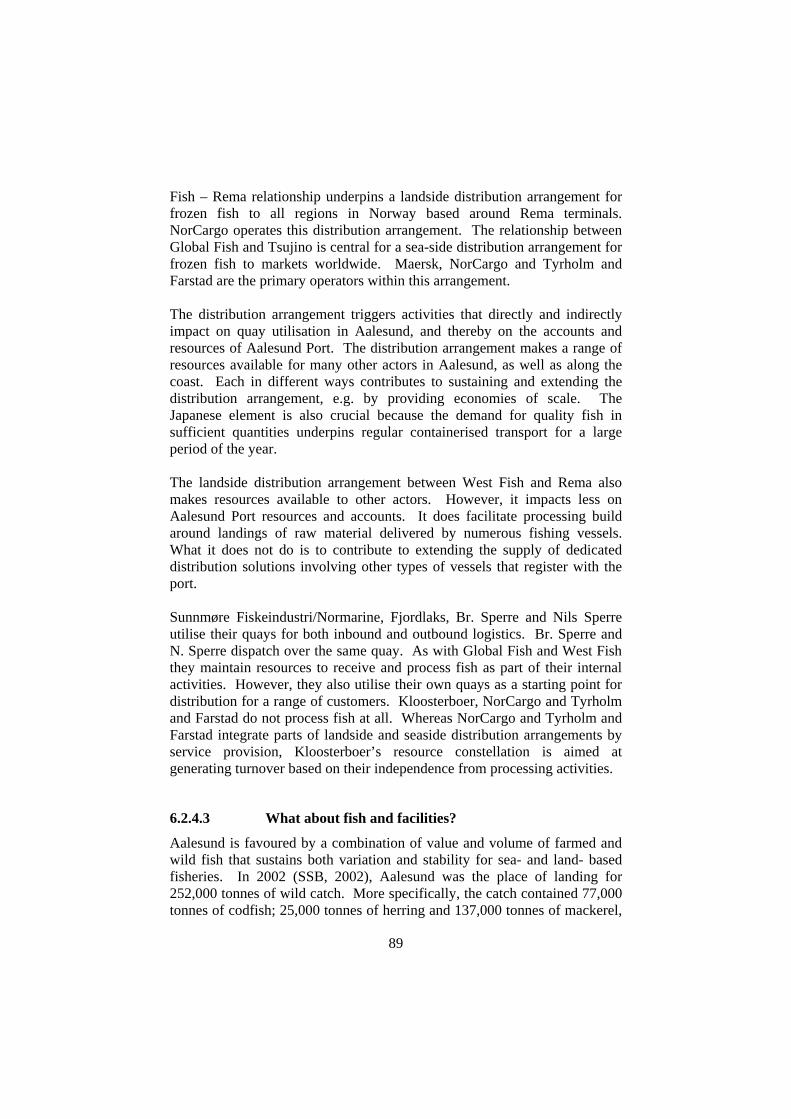
89
Fish – Rema relationship underpins a landside distribution arrangement for frozen fish to all regions in Norway based around Rema terminals. NorCargo operates this distribution arrangement. The relationship between Global Fish and Tsujino is central for a sea-side distribution arrangement for frozen fish to markets worldwide. Maersk, NorCargo and Tyrholm and Farstad are the primary operators within this arrangement. The distribution arrangement triggers activities that directly and indirectly impact on quay utilisation in Aalesund, and thereby on the accounts and resources of Aalesund Port. The distribution arrangement makes a range of resources available for many other actors in Aalesund, as well as along the coast. Each in different ways contributes to sustaining and extending the distribution arrangement, e.g. by providing economies of scale. The Japanese element is also crucial because the demand for quality fish in sufficient quantities underpins regular containerised transport for a large period of the year. The landside distribution arrangement between West Fish and Rema also makes resources available to other actors. However, it impacts less on Aalesund Port resources and accounts. It does facilitate processing build around landings of raw material delivered by numerous fishing vessels. What it does not do is to contribute to extending the supply of dedicated distribution solutions involving other types of vessels that register with the port. Sunnmøre Fiskeindustri/Normarine, Fjordlaks, Br. Sperre and Nils Sperre utilise their quays for both inbound and outbound logistics. Br. Sperre and N. Sperre dispatch over the same quay. As with Global Fish and West Fish they maintain resources to receive and process fish as part of their internal activities. However, they also utilise their own quays as a starting point for distribution for a range of customers. Kloosterboer, NorCargo and Tyrholm and Farstad do not process fish at all. Whereas NorCargo and Tyrholm and Farstad integrate parts of landside and seaside distribution arrangements by service provision, Kloosterboer’s resource constellation is aimed at generating turnover based on their independence from processing activities.
6.2.4.3 What about fish and facilities?
Aalesund is favoured by a combination of value and volume of farmed and wild fish that sustains both variation and stability for sea- and land- based fisheries. In 2002 (SSB, 2002), Aalesund was the place of landing for 252,000 tonnes of wild catch. More specifically, the catch contained 77,000 tonnes of codfish; 25,000 tonnes of herring and 137,000 tonnes of mackerel,

90
capelin, etc. In Rogaland County the catches of high-value/low volume codfish are scarce relative to low value/high volume pelagic fish (1:112). In Aalesund the ratio is 1:1.77 (see Table 6-8 below). Aalesund Møre and
Romsdal Rogaland Nordland,
Troms, Finnmark
Fraction of cod- to pelagic fish
1:1,77 1:2,1 1:112 1:0,5-1,4
Value (million NOK) 1,350 3,100 876 4,500 Volume (tonnes) 252,000 630,000 500,000 810,000 Value/volume fractions
5,35 4,92 1,75 5,55
Table 6-8: Value/volume fractions for landing of cod/pelagic fish species in four counties. (Fiskeristatistikk 2002-2003, SSB)
The ratios first and foremost reflect the different species and their relative value. They also indicate differences in the industrial use of fish and orientations to different market segments for fish products. In other words, the numbers reflect varying sea- and land-side industrial set up and quay utilisation. For example, in the county of Rogaland the typical catch is landed fresh at a Quay by a purse seine- or North Sea trawler. Here, large volumes of pelagic fish of low individual value are inputs for the production of fishmeal and fish oil. The production facilities are adapted to large volumes landed fresh by large vessels. In contrast, the northern counties are predominantly set up for industrial processing of high value codfish (also landed fresh). Here, the volumes are high but irregular, and are landed by smaller coastal vessels. Two industrial ports account for fisheries in Rogaland in contrast to the many individual quays scattered along the long coast of North Norway.
6.2.5 The port actor
The text above provides examples of resource constellations, ties and collections that in various and interconnected ways impact on Aalesund Port. Aalesund has a combination of companies, inputs, processes and customers that is both varied and reasonably profitable. In combination, these make up the port resource collection. Furthermore, the port is obliged to be concerned with the combining of resources that load in particular ways on quays in the port district. The port might view the aggregate of resources as

91
port resource collection. Centralised governance of such a collection is not readily seen, however. This section concerns Aalesund Port Authority as an actor, or as a company set up for the purpose of managing the resource elements that as a whole constitute Aalesund Port. The text above described examples within the port context of activity interdependencies, resource combinations and the actors involved in these. It is via these actors that Aalesund Port may acquire its features and identity as an actor. It is far from simple to obtain a clear picture of the port authority’s features and identity, however. Indeed, the port authority claims to have a strict landlord role, and then only with regard to companies renting quays and property. The landlord role is strong because contracts for the rental of public quays are generally long term. In addition, the contracts are specific with regard to the use of the property rented. When entering a contract with the port authority a company may be tied to a specific use of quays for a long time. Companies may also make concessions with regard to what activities can be engaged in upon public facilities. What is clear is that Aalesund Port is continuously changing, with or without any acting on the part of Aalesund Port Authority. Changes may result in different and increased use of particular quays, varying levels of containerisation or operators, etc. It can be questioned to what extent and in what ways Aalesund Port Authority is involved in, let alone influences, such continuous development processes. It is possible to gain insight into what happens when it does, however. In the following section a particular example that illuminates the port authority as an actor will be described, before the chapter shifts to consider the Karmsund port case.
6.2.5.1 Flatholmen
For historical reasons many Aalesund quay facilities are situated in or very near the town centre. Extensive use is made of central spaces and roads as a result. Regular passenger services and cruise vessels presumed to depend on proximity to a town centre call at central quays. Town centres used to be associated with access to good infrastructure services. Town centres today tend to be congested and narrow spaces in relation to land-side cargo movements in particular. The tendency is to move cargo-related resources and activities to spaces where the port is not in conflict with contemporary city life.

92
However, passenger services are still thought to depend on proximity to a city centre. What is required of a host to passenger services is an attractive and visitor-friendly town centre. Aalesund is marketed as a town characterised by Jugend-style buildings. Both the town itself and the surrounding region have features that attract visitors. Cargo handling and movements with related facilities (cranes and sheds) are hardly associated with what attracts passengers and visitors. Since 1896, Flatholmen (just outside the centre of Aalesund) has been subject to several development proposals. Each time development closer to the town centre has been chosen. Many of the facilities are now rundown and only few are still operative or central to traffic in the port district. Yet in early 2005, a first phase (costing NOK 95 million) among several planned phases towards the completion of Flatholmen as a cargo handling facility/regional container terminal was ready for use. Flatholmen is a public quay facility, financed by loans and revenue from the sale and rental of port assets. The municipality has purchased some facilities, but left quay fronts with the port authority to be dedicated for port purposes. There are other reasons for the Flatholmen project than moving activity away from the town centre. Aalesund port has for some time had status as national port, but this is being challenged in proposals for a National Transport Plan. National port status is related to importance and volume of traffic, but also to regional and national functions. Flatholmen was a precondition from the national authorities in order for Aalesund to be considered as a facility for goods transport in a regional and national context. It was also a precondition for reaching an agreement between Norcargo and the Port Authority that quays were made available for hire. Norcargo viewed this as crucial for assuming their role as operator as well as agent to Maersk. Norcargo performs terminal services in many Norwegian ports where Concordia, Maersk’s vessel on the Trondheim – Bremerhaven service, berths. Norcargo aims at being important to Maersk, which implies a long-term strategy for Norcargo’s presence at Flatholmen. In so doing, Norcargo has replaced Tyrholm and Farstad as the public container terminal operator. This means that the former provider of terminal services for Norcargo and for Maersk, Tyrholm and Farstad, loses Maersk as its biggest regular customer. As a consequence, Tyrholm and Farstad have formed an agreement with Eimskip-CTC to provide terminal services for reefer transport at Skutvika. Eimskip-CTC operates a range of vessels that now regularly call at Skutvika instead of at other quays in Aalesund. Cold storage- and container services will also be located to Skutvika.

93
6.3 Karmsund Port
Karmsund Port IKS is the managing authority for a port district comprising six municipalities within two counties (Rogaland and Hordaland) on the Southwest coast of Norway (see Figure 6-9). A council and a board reflect the ownership of Karmsund Port in political and demographical terms. Two Rogaland municipalities, Haugesund and Karmøy, each own 37.5% in the inter-municipal enterprise (IKS). The jurisdiction for all quay facilities was subjugated under Karmsund Port in 2000. This was when inter-municipal co-operation over port matters was extended. The port was endowed with nine kilometres of differentiated quay structures spread over a large number of facilities and locations within the port district. On Karmsund Port’s web pages, 39 harbours are listed as public. 6 harbours are listed as private, but these are only the largest ones (www.karmsund-havn.no). The harbour concept is furthermore used to refer to a sheltered area within which one or more quays may be situated. The total number of quays is not listed, but many public harbours comprise many separate quays (e.g. Kopervik harbour with 6 quays, Karmsund fishery port with 9 quays, etc.). Many facilities are no longer in use or suited for industrial or communal purposes, and criteria for what to include in the port portfolio is to be reconsidered. This would enable the port authority to focus on quay use rather than quay administration and maintenance. The port authority has taken some steps to assess this issue, and the port plan is of particular interest in this respect.
Figure 6-9: Karmsund Port District

94
The Karmsund Port business idea states that (my translation): “Karmsund Port shall be among the most important ports in Norway. The port shall be developed and activities extended based on the needs regional industries have for transportation. The port shall also aspire to service a national market. The port shall underpin and enhance the competitiveness for existing and new users. The port shall promote industrial development and new industries. Environmentally oriented activities shall be a natural part of the commercial and regional development. In the same way, the port shall be a safe arena for public leisure and well-being.” Different quays impact on Karmsund Port Authority accounts in different ways. Three private quays stand out in terms of cargoes and volumes carried across them; Hydro, Statoil Kårstø and Amrock respectively. Moreover, a large number of private quays are largely unaccounted for in the port plan. There are also a large number of public quays. The most important in terms of volumes are Karmøy fishery port, Garpaskjær at Haugesund and Rubbestadneset quay in Bømlo. The text below emphasizes the three large public and private quays. In total, 13.15 million tonnes of goods was carried across quays in Karmsund Port in 2001 (about ten times the volume of Aalesund Port). 7.8 million tonnes related to processing facilities for gas and condensate (at Statoil Kårstø in Tysvær). As gas and condensates arrives through pipelines, movements across this private quay are uni-directional. They accounted for 575 calls in 2001. 1.2 million tonnes related to processing facilities for aluminium in Karmøy, where 778 vessels loaded and unloaded in 2001. 1 million tonnes related to a stone quarry (Amrock’s in Tysvær) where vessels berth empty at a private quay and leave loaded with granite in various crushed or block qualities. Other private quays were registered with 2.5 million tonnes of goods in 2001. Public quays had 650,000 tonnes registered in 2001. 330,000 tonnes related to Karmsund Fishery Port (Karmøy) and 100,000 tonnes to Garpaskjær (Haugesund). The latter is at present the main public facility for goods and passenger traffic in the port district. The remaining 220,000 tonnes crossing public quays is not clearly accounted for. However, an arrangement between HSD (operator of the public Rubbestadneset quay in Bømlo) and Wärtsila explains at least part of it. In the following sections, the features of Karmsund Port from an activity and resource perspective will be outlined.

95
6.3.1 Activity patterns, links and structures
What characterizes activity structures, links, chains and patterns differs across the different types of quays. For example, the three big volume private actors, Statoil Kårstø (gas and condensate), Hydro (aluminium) and Amrock (granite), are operated as individually integrated systems. All three produce large volumes that are shipped out by sea. Only Hydro receives large and varied volumes of inputs by sea. Quays are built and dimensioned for the specific purposes and needs of the individual company.
6.3.1.1 Statoil Kårstø
Statoil is technical service provider for a gas and condensate terminal at Kårstø in Tysvær municipality. It used to be both owner and operator of the whole facility. As a consequence of the partial privatisation of Statoil, Gassco was set up as a new and state owned limited company by the Ministry of Petroleum and Energy. Gassco was to be the operator and head of Gassled, a unified system for all Norwegian gas transport with harmonized and published tariffs. Gassled is a joint venture owned by the main actors engaged in the petroleum industry in Norway. Approximately 60% is owned by Petoro (the licensee for the Norwegian state’s direct financial interest in petroleum activities) and Statoil (later merged with the oil division of Hydro). Other oil and gas operators in Norwegian waters own the remaining 40%. The Kårstø terminal is critical for the transport and treatment of gas and condensate from central parts of the North Sea and the Norwegian continental shelf. The facility separates rich gas arriving through the Statpipe and Åsgard Transport pipelines into its various components. From 2005, rich gas from the northern Kristin field in the Norwegian Sea was also piped to Kårstø via a sub-sea connection to the Åsgard Transport system. Un-stabilised condensate (condensate and natural gas liquids) from the Sleipner area in the North Sea is also piped to Kårstø. Here, it is stabilised and fractioned at a separate plant. Methane, ethane, propane, butane and naphtha (natural gasoline) are yielded at Kårstø. Dry gas (methane and some ethane) is transported through pipelines (Statpipe dry gas/Norpipe and Europipe II) to Emden (Germany). Natural gas liquids and condensate are exported by ship. Roughly four million tonnes of stabilised condensate is exported annually from Kårstø by sea. A large proportion goes to Statoil’s own refinery in Kalundborg (Denmark). Here, crude oil and condensate are refined into petrol, jet fuel, diesel oil, propane, heating- and fuel oil. But Kårstø is also one of the largest producers of liquefied petroleum gases (LPGs such as ethane,

96
propane and butane) in the world. LPG is shipped to customers worldwide by sea. In 2004 the Kårstø facility had 592 ship calls to load LPG, naphtha and stabilised condensate. Additional rich gas from the Kristin field increases the annual capacity for ethane production from 620,000 tonnes to 950,000 tonnes. Ethane is sold on long-term contracts. One large contract is with three companies in Grenland (Borealis, I/S Noretyl and Norsk Hydro). The annual value of this contract is approximately NOK 300 million (2005 prices). Delivery takes place at Noretyl, an ethylene-factory/cracker jointly owned by Borealis and Norsk Hydro. Borealis is Statoil’s biggest customer for LPG. Two vessels under long-term contractual agreements with Statoil Kårstø transport LPG and ethane from Kårstø to the petrochemical industry in Grenland and Stenungsund, Sweden for both Hydro and Borealis. In 2001 approximately 500,000 tonnes (from a total production of 620,000 tonnes) were shipped to Grenland and Stenungsund. There are concrete plans to build an off-shore pipeline in order to transport both dry- and liquefied gas to Grenland, Sweden and Poland. The entire activity chain would then disappear from Karmsund Port. By contrast, activity chains for which pipelines are not an option would continue to register in port accounts.
6.3.1.2 Hydro Aluminium – Fjordline
Hydro Aluminium has its own private quays for both bulk and Ro-Ro shipments. There is however a small activity chain that does not incorporate these dedicated quays, but instead makes use of a public quay at Garpaskjær (situated on Risøy). The latter is the main public quay for goods and passenger transport in Karmsund Port. It is divided from Haugesund city centre by a narrow sound. A bridge connects Risøy to the city centre and all road transport to and from Garpaskjær must cross this bridge. Five companies operate four terminals at Garpaskjær. The international ferry terminal is operated by Johs. Lothe AS. Fjordline’s international car and passenger ferry services call at Garpaskjær several times a week for regular sailings to Denmark and the UK. In 2001, 12,000 passengers and 6,000 tonnes of cargo were moved over Garpaskjær by Fjordline, destined for Newcastle in the UK. Furthermore, there were 4,000 tonnes of high value extrusions from Hydro. The offshore and process industry also uses Fjordline’s service for goods transport. For Hydro and the 4,000 tonnes crossing the North Sea using Fjordline, the regularity and predictability of the service is important. Uncertainty around the volumes of both passengers
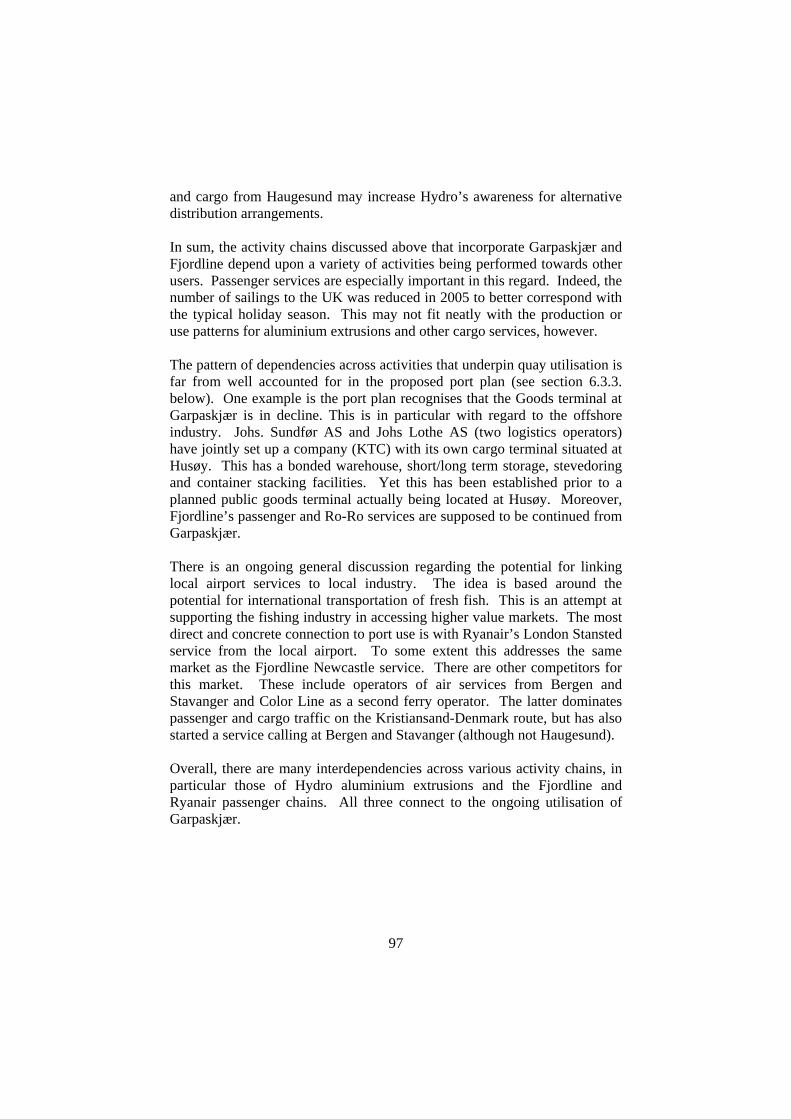
97
and cargo from Haugesund may increase Hydro’s awareness for alternative distribution arrangements. In sum, the activity chains discussed above that incorporate Garpaskjær and Fjordline depend upon a variety of activities being performed towards other users. Passenger services are especially important in this regard. Indeed, the number of sailings to the UK was reduced in 2005 to better correspond with the typical holiday season. This may not fit neatly with the production or use patterns for aluminium extrusions and other cargo services, however. The pattern of dependencies across activities that underpin quay utilisation is far from well accounted for in the proposed port plan (see section 6.3.3. below). One example is the port plan recognises that the Goods terminal at Garpaskjær is in decline. This is in particular with regard to the offshore industry. Johs. Sundfør AS and Johs Lothe AS (two logistics operators) have jointly set up a company (KTC) with its own cargo terminal situated at Husøy. This has a bonded warehouse, short/long term storage, stevedoring and container stacking facilities. Yet this has been established prior to a planned public goods terminal actually being located at Husøy. Moreover, Fjordline’s passenger and Ro-Ro services are supposed to be continued from Garpaskjær. There is an ongoing general discussion regarding the potential for linking local airport services to local industry. The idea is based around the potential for international transportation of fresh fish. This is an attempt at supporting the fishing industry in accessing higher value markets. The most direct and concrete connection to port use is with Ryanair’s London Stansted service from the local airport. To some extent this addresses the same market as the Fjordline Newcastle service. There are other competitors for this market. These include operators of air services from Bergen and Stavanger and Color Line as a second ferry operator. The latter dominates passenger and cargo traffic on the Kristiansand-Denmark route, but has also started a service calling at Bergen and Stavanger (although not Haugesund). Overall, there are many interdependencies across various activity chains, in particular those of Hydro aluminium extrusions and the Fjordline and Ryanair passenger chains. All three connect to the ongoing utilisation of Garpaskjær.

98
6.3.1.3 Karmsund Fishery Port
Karmsund Fishery Port generates between 300 – 400,000 tonnes of cargo. It is the largest public quay in terms of utilisation in Karmsund. The main contributors to the statistics are Karmsund Fiskemel, Biomar and Koralfisk. For example, Karmsund Fiskemel received 125,000 tonnes of raw material input into the production of fishmeal and oil. The main ingredients are pelagic species of low individual value, e.g. whiting and mackerel. No farmed fish is used at all. 17,000 tonnes of fishmeal and 5,000 tonnes of fish oil were dispatched by vessels to destinations predominately in Norway, Sweden and in Denmark. Neighbouring Biomar is an important customer organisation in the fishery port. It has Karmsund Sildemel as a raw material supplier for fish fodder production. Biomar’s warehouse is next to Karmsund Sildemel’s warehouse, between which there are built-in facilities for the internal transport of goods. The customer firm received 37,000 tonnes of raw material for the production of fodder for farmed fish. Koralfisk mainly produces codfish for human consumption. 13,500 tonnes of frozen fish is sent by vessel, primarily to customers located in Russia, Poland, Estonia, Lithuania and Japan.
6.3.1.4 Wärtsilä
Wärtsilä Norge AS has two production facilities situated in Bømlo. Turnover in 2001 was NOK 1 billion. The main business areas are production of reduction gears, propellers, control systems and repair/maintenance of vessels. Wärtsilä impacts on Karmsund Port accounts and resources in two ways. The first is through wharf activities at their own private quays (250-300 vessels berth every year) Secondly, there are long-term contracts with HSD Transport. In 2004, a three-year contract worth approximately NOK 100 million for logistics services, warehousing and transport of inputs and finished goods using the Karmsund Port quay Rubbestadneset was agreed. HSD is also a customer of Wärtsilä for the service and maintenance of 30 car and passenger ferries for regional traffic. The companies recently signed yet another three-year contract worth NOK 100 million (Bergens Tidende, 22.12.2004). The fishing industry (in the shape of Bremnes Fryseri, Brandasund Fiskeforedling and Espevær Lakseslakteri) generates both sea and road transport. This amounts to several hundred long-haul vehicles each month through the quays at Bømlo.

99
6.3.2 Resource constellations, ties and collections
There are a variety of resource ties and collections within Karmsund Port. The text below considers the most important resources using examples from Statoil Kårstø, Norsk Hydro and Amrock. The flows crossing the private facilities owned by the three firms differ from most other flows in Karmsund Port. This is in terms of the size of bulk volumes, but also in the type and characteristics of goods, dedicated purpose terminals and so on. Norsk Hydro has several aluminium plants around the world. One of the four plants in Norway is situated in Karmøy. Here, the company has its own quays, one of 270-metres length (equipped for raw materials operations) and one that is 125-metres long (primarily equipped for Ro-Ro operations). Unitised goods may be handled at both quays. In addition, Hydro has its warehouses on the premises. In 2001, 778 vessels berthed at these quays, loading and unloading 1.2 million tonnes of raw material inputs and finished products. The majority (75%) are the various inputs into the primary production of aluminium. They are unloaded from large bulk vessels (75 vessels unloaded 620,000 tonnes of bauxite, oxide and other inputs in 2001). Hydro Aluminium has located the responsibility for global logistics operations to Karmøy. Most of the 280,000 tonnes of base aluminium products are shipped in bulk to customers in Europe. Hydro has long term agreements with Lysline/DFDS and Wilson Euroshipping for outbound shipments with system boats. For example, approximately 8% of the volumes transported by Wilson Eurocarrier are aluminium from Hydro. The relationship has lasted since the 1960s. Moreover, Seacargo and Norlines call at several quays as part of regular services along the coast, which includes the Norsk Hydro quays. Immingham is one important UK port destination. Amrock was initially owned by AMEC Civil Engineering (UK) to supply coastal protection projects on the English coast with stone blocks. A stamp mill was installed in 1996, however, shifting production towards crushed stone mainly for export. Amrock has since 1990 quarried block and crushed stone from a granite quarry in Espevik in the municipality of Tysvær. Quays and loading equipment have been built on-site. Products are certified for use in applications such as asphalt, concrete and railway foundations. Kolo Veidekke acquired AMEC’s shares in Amrock in 2002. Expansion plans were in place for the extraction of 300 million tonnes over a period of 200 years. A concession was required, and an application for this was submitted in 2003. The municipality decided in favour of granting a concession, but the county decided against. The final decision was made by

100
the Ministry of Environment in early 2005. This confirmed the county’s decision. Nevertheless, 700,000 tonnes are extracted on an annual basis. This leaves some 10 years of further production at the same rate before the quarry is emptied. Both the mill and the loader facilities are very flexible in that they are able to produce various specified fractions and blends. The quays can receive vessels of up to 20,000 tonnes. The utilisation of the quays rests entirely the quarry and its purpose-built installations. Statoil Kårstø’s connections to the Gassled system alone account for more than half of the tonnage carried across quays in Karmsund Port. LPG vessels are designed to transport liquid ethane at –87 degrees celsius. They load at Statoil Kårstø and unload at various customer locations, e.g. at Noretyl in Grenland. LPG is shipped to customers in the US, Japan and China under long-term contracts with firms such as Enterprise Products Operating LP in Texas. A relationship with Enterprise Products developed from 1997. It was viewed to be important to establish a long-term logistical US/Gulf coast outlet for Statoil. This is a main market for the LPG produced at Kårstø and Mongstad. Furthermore, contracts for 600,000 tonnes of LPG (value of NOK 1.5 billion) have been made with Mitsui (Japan), Marubeni (Japan) and Caltex (China). Lastly, MOL Mitsui OSK Lines’ 50,000 DWT Mushashi Gloria (carrying capacity of 75,000-cubic metres) is among the largest ships for the transport of LPG. It carries approximately 43,000 tonnes of LPG at a value of $ 20 million per consignment from Kårstø to Japan and China. There are also various Norwegian companies (e.g. Knutsen OAS, Eidesvik, Bergesen Gas) operating in the specialised market for gas transportation. Decisions made by Gassco can have a large impact on Karmsund Port. For example, as Gassco is investigating whether to transport gas from Statoil Kårstø to customers in Grenland, the Oslofjord area and West Sweden by ship or investing in a pipeline. The latter would directly connect Kårstø to the Oslofjord region, West Sweden and Poland. The Gassled ownership model and organisational set up are also important in this respect. This will be further discussed in the Grenland Port case below. 2.5 million tonnes of cargo crosses other private quays. These cargo flows differ considerably in terms of composition and co-ordination. For example, ABB Offshore Systems is one company situated with private quays adjacent to the public Garpaskjær terminal on Risøy. ABB is a longstanding supplier to the Norwegian and international oil- and gas industry. The company has a turnover of NOK 3 billion. 1,400 employees maintain and modify
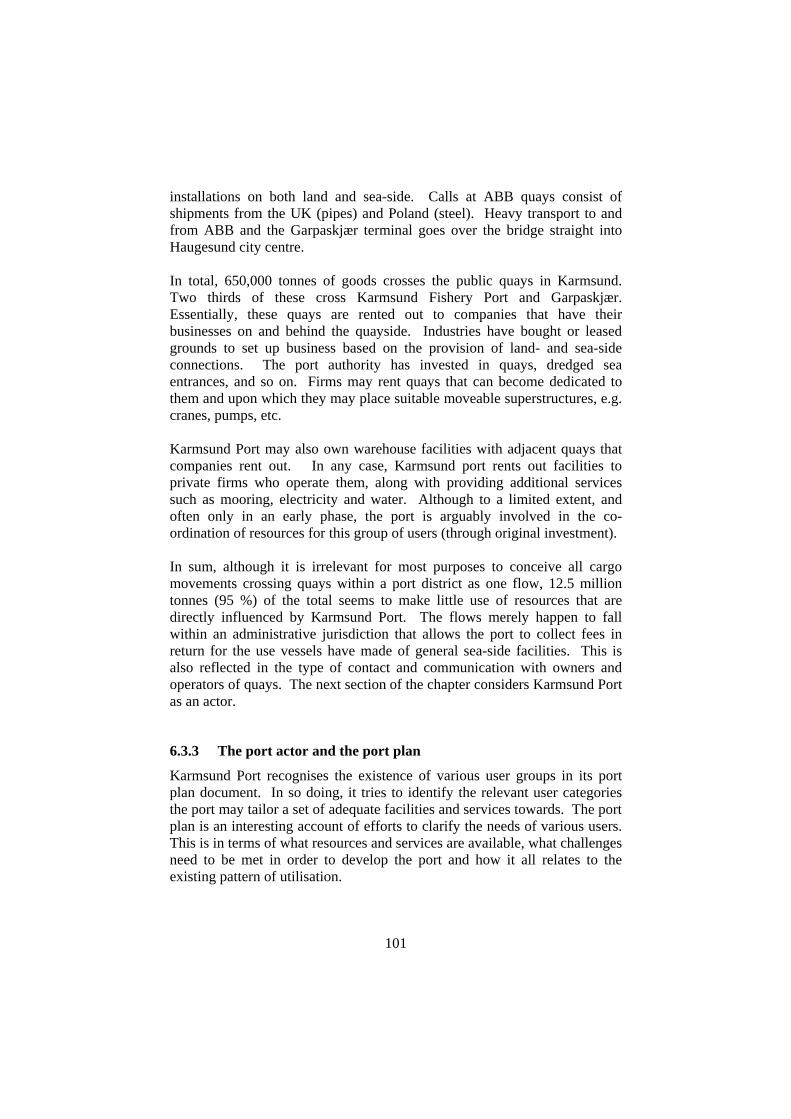
101
installations on both land and sea-side. Calls at ABB quays consist of shipments from the UK (pipes) and Poland (steel). Heavy transport to and from ABB and the Garpaskjær terminal goes over the bridge straight into Haugesund city centre. In total, 650,000 tonnes of goods crosses the public quays in Karmsund. Two thirds of these cross Karmsund Fishery Port and Garpaskjær. Essentially, these quays are rented out to companies that have their businesses on and behind the quayside. Industries have bought or leased grounds to set up business based on the provision of land- and sea-side connections. The port authority has invested in quays, dredged sea entrances, and so on. Firms may rent quays that can become dedicated to them and upon which they may place suitable moveable superstructures, e.g. cranes, pumps, etc. Karmsund Port may also own warehouse facilities with adjacent quays that companies rent out. In any case, Karmsund port rents out facilities to private firms who operate them, along with providing additional services such as mooring, electricity and water. Although to a limited extent, and often only in an early phase, the port is arguably involved in the co-ordination of resources for this group of users (through original investment). In sum, although it is irrelevant for most purposes to conceive all cargo movements crossing quays within a port district as one flow, 12.5 million tonnes (95 %) of the total seems to make little use of resources that are directly influenced by Karmsund Port. The flows merely happen to fall within an administrative jurisdiction that allows the port to collect fees in return for the use vessels have made of general sea-side facilities. This is also reflected in the type of contact and communication with owners and operators of quays. The next section of the chapter considers Karmsund Port as an actor.
6.3.3 The port actor and the port plan
Karmsund Port recognises the existence of various user groups in its port plan document. In so doing, it tries to identify the relevant user categories the port may tailor a set of adequate facilities and services towards. The port plan is an interesting account of efforts to clarify the needs of various users. This is in terms of what resources and services are available, what challenges need to be met in order to develop the port and how it all relates to the existing pattern of utilisation.

102
Varying user categories are suggested in the port plan, such as shipping/service/security and international ferry services. The grouping of actors is a way to consciously address the needs of the individual user groups. However, the consistency in how categories are conceived of varies considerably, depending on the purpose and context of use. Often the categorisation appears to only spuriously reflect the connection between user and port. The document segments private quays based on familiar industrial categories. What is seldom clear is how industries differ from the perspective of the port organisation, or how they impact on Karmsund Port accounts and resources. Whereas quays and their ownership are generally known, the resource constellations within which the quays are utilised seem diffuse. One ambition is that measuring both users and flows in the various categories will enable Karmsund Port to systematically address synergies for the benefit of the region at large, the individual municipality, firms, port and other stakeholders. In other words, the port plan seriously attempts to visualise this diverse group into a resource constellation by making the connection to various industrial segments. Varying user based categories are indicated in the port plan. Further details of the document and its contents are provided below.
6.3.3.1 The port plan
Karmsund Port has been developing a port plan formulating the basis for port development efforts towards 2011. This time period corresponds to the National Transport Plan. The plan is required to take into consideration a range of issues that would not ordinarily be thought of as directly related to everyday port operations. The port plan document offers an opportunity to investigate both some of the thinking around port development in Karmsund Port, and the role of the port itself. What is noticeable in the document is that the specific purpose and context of use the port plan is aimed at is somewhat unclear. The purposes listed appear to be expressed in many ways. Some examples are; to understand the complex patterns of traffic, to further underpin plans for improvement of road and other infrastructure; and to strengthen a maritime/shipping cluster. The connections made between parties are based on industry classifications, not how the port is connected to these. The plan appears to be heavily infused by the extended political agendas of its owners. In other words, it is a document that seeks to position the port
103
with reference to a regional and political context, rather than positioning the port with reference to elements associated with port use and users. A brief indication of this can be gleaned from the way the three major users in terms of volume are referred to (Amrock, Statoil Kårstø and Norsk Hydro). Amrock is the third biggest contributor to port statistics. It is perhaps not surprising it is mentioned three times in the plan. The first is in terms of volume, the second in relation to a general need in the port for securing anchoring areas to vessels, and thirdly in terms of the road traffic it apparently generates. The stone/granite products being shipped from Amrock are briefly mentioned twice. Statoil Kårstø and Norsk Hydro facilities and products are on the other hand central within the plan, and for the categorisation of industry are listed and described as important under various headings. How the port is connected to the three major users, in terms of what difference they make to the port, is not even mentioned. Hence the port plan, although a worthy attempt to underpin the port and its visions for the port, is for a large part referring to activities and plans for regional development and community welfare that originate outside the port. Nevertheless, these are manifested as part of the port authority’s explicit strategy and activity. It is therefore interesting to consider in some detail whether and how the port plan can be pursued through and by the port. One prominent focus is on issues related to the fact that the port district comprises six municipalities in two counties (Rogaland and Hordaland). Both counties are responsible for many of the roads leading to the main port facilities. Leaving aside issues clearly confined to Rogaland County - where Karmsund Port is located - the port plan is particularly critical towards Hordaland County. “Hordaland fails notice that two of its municipalities belong to another national port [than Bergen and Stavanger], Karmsund Port. The county transport analysis offers not a single word about the challenges to transportation in this regard... The County capitals, Bergen and Stavanger, seem to find it difficult to reconcile with the fact that Norwegian authorities have recognised the existence of a significant transport node between them” (Karmsund Havn IKS, 2002:22, 26). Furthermore, in the National Transport Plan, there is a focus on Karmsund Port as a national port. That is, as a nodal point in the cross-section between national transport corridors 4 (South-North: Kristiansand to Trondheim) and 5 (East-West: Oslo – Bergen). But Hordaland county transport plans emphasize rail and all-year road connections over Hardangervidda between Bergen and Oslo, as well as internal connections within the county. By

104
contrast, the port plan discusses that many municipalities in the southern part of Hordaland are on the route of existing all-year roads such as the E134. On the other hand, the process of regional integration across the counties in the region (largely overlapping with Karmsund Port District) has come so far that the term geographically integrated transport region is considered more relevant than administrative references. Some examples of existing regional integration are the cross-county organisation of police, health and education services. Administrative boundaries are seen as increasingly irrelevant as actual integration occurs. There are other examples of aggregation in the port plan, such as when describing Karmsund Port as industry port. Statoil Kårstø, Gassco, Hydro Aluminium, ABB Offshore Systems and Wärtsilä Norge are mentioned as central industrial actors. ABB and Wärtsilä are tenant and tenant’s customer to Karmsund Port-owned facilities in Haugesund and Bømlo. Other than shipments from England (pipes) and Poland (steel), how ABB activities impact on Karmsund Port is not evident in the port plan. Nonetheless, ABB is seen as important for activity related to the oil and gas industry in the region. Although the Statoil and Hydro patterns of shipments are somewhat documented, Gassco (operator to the Kårstø plant where Statoil is Gassco’s technical service provider) is not a port user other than indirectly through Statoil. Gassco decisions are nevertheless important, such as evaluating whether to invest in a pipeline for the transport of gas from Kårstø to Grenland and Sweden. Such a pipeline would replace all sea-based transportation of gas. The petrochemical industry is also prominent in plans for industrial development in Rogaland County. They are somewhat sceptical to national investments in a pipeline system that will favour the existing industry in Grenland over plans for such industries in Rogaland. In addition, there is an internal conflict regarding whether to make Risavika (Stavanger) or Gismarvik (Tysvær) industrial park the centre for a gas and petrochemical industry in Rogaland. Again, the concern is in terms of new industries, investments and location issues, rather than existing port use. The shipping industry and its importance to higher education institutions is also mentioned, along with the Coastal Administration, international ferry services, the fishing industry and users of gas. What is less clear is how these actors relate to Karmsund Port.

105
Moreover, the fishing industry is dependent on a whole range of factors, more national and international than local, which impact on quay utilisation. Some examples are the ownership and location of fishing vessels and quotas. As a substantial part of the fishing industry is situated in Karmsund Fishery Port, the port is certainly affected by such factors. However the port has a limited influence over these factors, apart from backing local policies whenever possible. In sum, the Karmsund port plan is weak in terms of a focus on how the port authority may influence its own position amongst port users. What resources are utilised by whom (and how) is to a large extent framed by a political context centred on port owners, rather than Karmsund Port and its users. The next part of the chapter discusses the third case study; Grenland Port.
6.4 Grenland Port
Grenland Port is Norway’s largest port for general cargo and one of the largest ports in Norway. About 10 million tonnes of goods were moved across the port district in 2001. Vessels with a tonnage of up to 150,000 tonnes can enter the port. Increasing volumes of cargo is containerised, but the vast majority of volumes are still bulk cargoes. Most of the quays are privately owned with just 4 public quays. The port authority deploys its own equipment and personnel to port operations at one quay. Grenland Port Authority is the managing body of Grenland Port District. Grenland Port was set up as an inter-municipal company (IKS) in 1992 across the municipalities of Porsgrunn, Bamble and Skien. About 3,500 vessels call at Grenland Port annually (Asplan Viak, 2005). 1,000 of these calls are made in Langesund, at the Brevik terminal and at Norcem quays, which are situated outside a narrow straight called Breviksstrømmen. The remaining 2,500 calls are destined for quays in the Frierfjord and/or the river situated between the towns of Porsgrunn and Skien, and therefore need to pass Brevikstrømmen. This results in a total of 5,000 passages of Breviksstrømmen per annum, of which 800 passages involve the carriage of dangerous or environmentally hazardous cargo. There is a tendency for vessels in commercial traffic to become both fewer and bigger. In this sense, the straight is considered a bottleneck, both in terms of vessel size (length) and capacity (depth). The total number of passages through the straight is difficult to ascertain, as non-

106
commercial and leisure purpose traffic is not registered with the port. Overall, it is believed to be in the region of 8,000 passages annually (ibid.) Grenland Port comprises some 56 quays in 27 harbours where cargo may be registered across quays in the port district. There are 5,700-metres of private quays and 2,600-metres of public quays respectively. The four largest public quays are in Skien/Vold, Porsgrunn, Brevik and Langesund. Most cargo is handled over private quays at companies’ production facilities. The public quays in Skien/Vold and Porsgrunn have spare capacity. Brevik has a capacity of 800,000 tonnes, which may be expanded to 1,350,000 tonnes. As full capacity utilisation is achieved at Brevik, Skien/Vold may be used. In section 6.4.1 below further description of Grenland Port will be provided in terms of two prominent challenges; the paper issue and the gas issue. Moreover, two aspects that differentiate Grenland Port from the cases of Aalesund and Karmsund port are introduced; the port authority as an operator and a user respectively. Focus on these issues and aspects that differentiate Grenland Port from the previous cases slightly alter the structure of this case and also shorten it.
6.4.1 Two Grenland Port issues
In this section I focus the description of Grenland Port around two issues that carry the potential to significantly alter the activity patterns and resource constellations that currently impact on the loading and unloading of vessels in Grenland Port and that registers with the port authority.
6.4.1.1 The paper issue
The Union paper mill was established in 1843. It became part of Norske Skog in 1999. Co-operation between the two firms had been extensive in terms of sales, procurement, research and logistics over a long period of time. Indeed, from 1985 onwards Norske Skog and another paper mill, Follum, strongly influenced Union as majority shareholders. Norske Skog, Follum, Tofte and Union founded Vestvirke AS in 1985/86 as a joint company for purchasing inputs into paper production. Union closed its operations in Grenland in 2006. Prior to the closure, Union produced newsprint and various grades of book-standard paper. Book paper was produced on paper machine 6 (PM6). This was built for the production of newsprint from its introduction in 1957-1958, but developments lead to it becoming out of date as a newsprint machine. Newsprint is what Norske Skog sees as the core of its activities.

107
Union operated a second paper machine for the production of newsprint - PM7. Taken together, the two machines had a combined capacity of 250,000 tonnes of paper per annum. In the late 1990s, Norske Skog Union produced 100,000 tonnes of book paper and 150,000 tonnes of newsprint. However, the production of newsprint requires large-scale capacity and the fixed costs are high. In addition, modern production facilities have a far larger capacity. From the early 2000s, book paper was increasingly seen as the future for Union. However, as newsprint-grade paper production was the strategy of Norske Skog centrally, the issue was whether to continue producing book paper as something akin to a hobby, to make the production of book paper part of the strategy, or to run down the mill as the need for upgrading became unavoidable. Only by becoming part of a new Norske Skog ‘book-paper strategy’ was seen as viable for Union in the longer term. A book-paper strategy implied converting also PM7 to the production of book-paper. The total capacity would then be in the region of 250,000 tonnes of book paper. In terms of market share, this implied that Norske Skog would have to aim for approximately 50% of the European market for book paper. The customers of book print are mainly printing houses and publishers. Five customers accounted for 50% of the volumes of book paper produced at Union. Two were in the UK; and one each in Germany, Italy and Denmark respectively. The market for book print differs substantially from that of newsprint. Printing houses and publishers are concerned with a large number of paper qualities, and delivery times are short. Storage space is usually limited and relies on door-to-door delivery solutions where timing is critical. It takes time to build this competence that Norske Skog Union has in place around PM6. Only the Swedish company Stora Enso competes with Union in terms of market shares. A Norske Skog book paper strategy would necessarily involve fierce competition with Stora Enso to win market shares to underpin a 250,000 tonne production capacity. Almost 100% of the production from PM6 was exported, typically by sea. Out of the 250,000 tonnes of finished goods, approximately 160,000 tonnes were transported by truck to the public terminal at Skien/Vold in the Voldsfjord (18-kilometres from Union). This was the most used, preferred and cheapest port facility for Union. In addition, some tonnage was sent to terminals in Larvik and Brevik. About 2,000 container units have been shipped from the Larvik container terminal per annum. The quays at

108
Union’s production facility in Skien were not in use for vessels, but instead for the loading of paper rolls on trucks. The Voldsfjorden terminal belongs to Grenland Port Authority. Norske Skog rented personnel, cranes and two warehouses from the Port Authority. One example is the personnel operating specially-equipped forklift trucks belonging to Norske Skog Union in Voldsfjorden. The cranes at facilities not in use for shipments of paper were also owned and operated by Grenland Port Authority. Norske Skog employed warehouse personnel. Union accounted for approximately 60 % of the throughput at the Voldsfjorden terminal. Union was connected to Norske Skog’s distribution arrangement for paper. Norske Skog had a contract with Lys-Line AS for the transport of paper products from production- or warehouse facilities around the Oslofjord. The contract covered the transport of paper from Oslo, Halden and Skien to Germany, Belgium, the UK and Spain. The present liner-based shipping system for paper transport in the North Sea was developed by Norske Skog and Lys-Line in co-operation. Lys-Line’s investments in the particular vessels collecting Norske Skog products were dedicated this purpose, and Norske Skog was a dominant, but not the only user of Lys-Line’s capacity. Both Lys-Line and Norske Skog have an interest in developing profitable and reliable sailings, provided that the risk for damage or delay is minimised. Not all products can be transported alongside paper, however. Norske Skog also co-operates with other shippers in Grenland, Vestfold and Østfold to develop new solutions as part of a common shipping system in the Oslofjord region. The transportation of paper and other forestry products for the Norwegian and Swedish markets has been the central basis for the Lys-Line service. Lys-Line own and operate two vessels that transport paper for Norske Skog from facilities around the Oslo Fjord. These boats are specially adapted for transporting paper, particularly with regard to the side-door loading and handling system. Each boat carries four electric-operated forklift trucks that are equipped with clamps adapted for paper handling. The forklift trucks onboard are owned and operated by Lys-Line. From 2004 onwards, there were two weekly calls at Voldsfjorden. The calls are part of different services, as the MV Lysbris that calls at Voldsfjorden/Skien on Thursdays will have called at Halden, Oslo, Moss, Hamburg and Tilbury by the following Tuesday. MV Lysvik calls at Skien on Tuesdays after having called Oslo, Moss and Halden on Mondays. It continues on to Immingham on Thursdays and Gent on Fridays. Of a total capacity of 7,500 tonnes, about 900 tonnes are normally dedicated to Union.

109
Most of the remaining vessel capacity is filled with production from other Norske Skog plants. About 200 tonnes are loaded per hour. In general, the boats are empty when they retune from deliveries overseas. This is due to difficulties in co-ordinating suitable return cargoes. By the end of 2005 it was clear that there was to be no Norske Skog ‘book-paper strategy’. Union would close down (in 2006), and consequently, no further shipments of paper would impact on the Voldsfjorden terminal. As the activity generated by Union at Voldsfjorden facilities was so dominant, it is not clear that goods handling will continue in the same way when Union is closed. The impact for remaining users is uncertain, not least because the Port Authority is unable to intervene and re-direct existing use.
6.4.1.2 The ‘gas to Grenland’ issue
Borealis, Hydro Polymers and Noretyl are strongly connected petrochemical companies in Grenland. This group is the biggest customer of LPG and ethane from Statoil Kårstø (see 6.3.1.1). Hydro and Borealis each own 50% of Noretyl (where the LPG and ethane is delivered). Noretyl is a cracker producing ethylene and propylene. Cracking is in essence the process of breaking down heavy oil molecules into lighter, more valuable fractions. These are olefins - mainly ethylene, propylene and C4 derivatives, which are sold to petrochemical companies that process them into specialised products for use in downstream industries such soaps and detergents. Both Hydro and Borealis buy ethane, propane and butane that are cracked at Noretyl. Ethylene and propylene are then sold by both firms. In addition, Borealis uses these to produce polyethylene and polypropylene. The capacity of the Noretyl plant is 550,000 tonnes of ethylene and 80,000 tonnes of propylene. Bi-products (crude C4's, pyrolysis gasoline and pyrolysis oil) from production at Noretyl enter as inputs into the production of a variety of other products. Noretyl supplies Hydro Polymers’ adjacent Vinyl Chloride Monomer (VCM) plant with ethylene. Next to the VCM plant is the chlorine facility. The VCM plant mixes chlorine and ethylene, producing an intermediary product EDC (dichloretan) that after cracking becomes VCM. The process of polymerisation turns VCM into polyvinyl chloride (PVC), but this occurs at the Hydro Polymers PVC plant across the fjord in Porsgrunn. The VCM plant at Rafnes (Grenland) is connected to the PVC plant in Porsgrunn by a sub-sea pipeline. Hydro Polymers also have production facilities in Stenungsund (Sweden) and Aycliffe (UK). The Aycliffe PVC plant is supplied with VCM from Rafnes, but ethylene for the Stensungsund plant is supplied by Borealis (Gadde, 2003).

110
Borealis’ production of polyethylene and polypropylene is based on deliveries of ethylene and propylene from Noretyl. Their products are sold as pellets to plastic converters, which produce a huge variety of plastics products. Borealis also has a plant in Stenungsund. 13% of Borealis’ production is sold to Tetra Pak’s coating factory in Skoghall (Sweden). A transport company moves the pellets from silos at Borealis (owned by Tetra Pak) to Tetra Pak Skoghalla in specially adapted bulk trucks several times each week (Bygballe and Elvekrok, 2003). The capacity of the LPG-tankers is 30,000 tonnes. The storage capacity of LPG at Noretyl and the sea entrance constrains the size of shipments possible. Fully loaded, the tankers displace 11.3 metres of water, and even with reduced loading dispensation are required from the Coastal Administration (Kystverket) for each passage through Breviksstrømmen. A project to dredge and straighten Breviksstrømmen is under consideration by the coastal administration. Not all material is shipped by road. Kystlink operates a feeder boat service that moves cargoes to Europaterminalen in Brevik for Hydro facilities in Herøya (Grenland) and Holmestrand, and for Borealis. The feeder service involves the collection of containers to be delivered at Brevik and the unloading of empty containers. From Brevik, DFDS Tor Line operates both vessels and the terminal itself. It moves containers to various European destinations, such as a regular Ro-Ro service to Hirtshals in Denmark (Harrison, 2003b). Overall, estimates for the volumes of liquid gas used in Norway vary between 850,000 and 1,150,000 tonnes (Ernst and Young 2005). Access to dry gas could substantially increase the domestic use of gas, however. Grenland, due to the density and kind of industrial users in the region, is the most relevant region for such access. The level of access possible is strongly connected to the financial viability of distribution arrangements. The present distribution pattern goes by boat from Kårstø. There are alternatives for pipeline arrangements under consideration, both for liquid and dry gas. Furthermore, there are alternative arrangements for the distribution of dry gas by vessel. All the ‘pipeline alternatives’ would require large volumes in order to be financially viable. At present, the domestic market seems to be insufficient in terms of current and planned use to provide such volumes. A pipeline can be characterized as having large fixed costs. Obviously this favours the transportation of large volumes, in order to minimise the average cost per unit transported. The flexibility of a pipeline is also low when compared to
111
sea transport. Hence a pipeline solution between Grenland and Kårstø implies a need for financial support by the national authorities. What may contribute to the financial viability of a pipeline is a substantially bigger market. The provider of gas through a pipeline would be Gassled, via their operator Gassco. The operator has undertaken studies of the conditions for the supply of gas through a pipeline. Any decision to invest in a pipeline would be made by Gassled on a commercial basis. The owners of Gassled are reluctant to support or subsidise a pipeline for many reasons. Hydro is a Gassled partner, and has questioned whether a Gassled-financed solution implies a breach with the basic principles underpinning Gassled. The latter is supposed to facilitate producers of gas with efficient transport infrastructures, not act as an instrument for the financial support of a pipeline to Grenland. Instead, a solution is required that creates a user base that can provide volumes that are sufficient to underpin investments in a pipeline. Different distribution arrangements would affect both Karmsund and Grenland ports. In general, a pipeline would replace the volumes carried by vessel, thus removing the LPG vessels destined for Grenland from Karmsund, along with all gas vessels from Grenland. A pipeline from Kårstø to Grenland may underpin further development of petrochemical industries in Grenland. This would undermine any such developments in Rogaland (Stavanger and/or Karmsund).
6.4.2 Activity patterns, links and structures
In general, the ‘gas to Grenland’ issue shows how companies are implicated in the possible replacement of one part in an activity pattern from transporting gas by vessel to the use of a pipeline. By contrast, in the ‘paper issue’ Norske Skog combines and connects elements of activity chains in a way that not only removes the parts that involve sea transport, but also all its activities in Grenland. Taking the ‘paper issue’ first, the paper based activity pattern is dictated by the overall concerns of Norske Skog and not Union, which is merely one factory in the former’s worldwide portfolio. Whereas newsprint is largely characterised by stability in the large volumes under discussion here, book print is not. Over the years PM6 and book print have become essential to Union. The success stories related to the profiled use of Union paper for printing bestsellers such as J.K. Rowling’s Harry Potter series are a source of great pride. Nevertheless, the continued existence of Union requires sales volumes that are equal to several such successes every single year. In this

112
way, there is a clash between co-ordinating for flexibility and for stability. The newsprint and book print activity chains are in other words very different. The shipment pattern from Norske Skog Union substantially impacts the activity pattern based on Grenland port. It accounts for more than half of what crosses the quays at Voldsfjorden, and a large proportion of containers crossing Larvik container terminal. In addition, Brevik is affected by the Union activities, although less dramatically than Voldsfjorden and Larvik. The activity patterns related to Noretyl, Hydro Polymers and Borealis differ. What connects these is a mixture of geographical proximity and intended interdependencies. In terms of the activity chains that impact on Grenland Port, these are based on both incoming and outbound logistics activities. The large volumes and the sizeable vessels relate to inbound logistics. Indeed, replacing vessels with a pipeline will take away a substantial share of the traffic in the port. On the other hand, Grenland Port is not involved with these vessels and cargoes in any other way than through incurring fees on vessels.
6.4.3 Resource constellations, ties and collections
There is a whole set up of process industries in Grenland, some of which use gas as an input to products, others that use gas as a source of energy. Arguably, a few companies are the main resource elements in the context of Grenland Port. It is the resource constellations in which these companies are part that account for most of the quay utilisation. Seven companies (Borealis, Eramet, Herøya Industripark, Hydro Polymers, Norcem, Noretyl and Norske Skog Union) that have formed the association ‘IndustriClusteret Grenland, represent approximately 70% of the volumes crossing Grenland Port. The seven companies co-operate and co-ordinate across areas of joint interest such as maintenance, occupational health services and the ‘gas to Grenland issue’. All the companies are part of typical process industries, producing paper (Norske Skog Union), alloys (Eramet), plastics (Borealis), cement (Norcem), fertiliser (Yara), chemicals and PVC (Hydro Polymers), ethylene and propylene (Noretyl). For example, Eramet Norway is owned by the French concern Eramet. In Grenland it produces manganese alloys. Supplies of the necessary ore from South and West Africa are shipped to quays in Grenland Port where it is unloaded. Eramet is supplied with 200-250,000 tonnes of ore annually, with each shipment weighing between 25-30,000 tonnes. The company is located at the deep-water quay. However, Yara has priority at this quay. This

113
results in disruptions to the unloading of goods after 15,000 tonnes for Eramet. If it had access to dry gas, Eramet would be likely to change over from the use of liquid gas as energy source. Yara produce fertiliser, with 520,000 tonnes of phosphate being imported from Murmansk (Russia) each year. The phosphate is delivered in shipments of 18,000 tonnes each. Smaller ships deliver 6,000 tonnes of Kaliklorid per shipment from Lithuania. 95% of the total production (350,000) is exported, dispatched by ships that carry more than 20,000 tonnes per shipment. Yara use liquid gas (mainly ethane) in the production of ammoniac that is required for the production of fertilisers. With access to dry gas, Yara would also be likely to change over to dry gas supplied by pipeline.
6.4.4 Grenland Port Authority
The Grenland Port authority account differs from those of Aalesund and Karmsund ports in at least two important respects: First, it demonstrates an inclination to engage as an operator providing services to users of its own resources. Secondly, it illustrates a liking to engage as a user of those services that are provided upon port authority resources. Both imply direct engagement with the interaction amongst actors that moulds the utilisation of resources for the purpose of loading and unloading vessels at quays in Grenland port district. The first feature of Grenland Port Authority is that it is engaged in the remunerated provision of services to port users, in particular Norske Skog Union at Voldsfjorden. At least until recently, Grenland Port Authority owned and operated facilities at Voldsfjorden (Skien), which was so closely connected to Norske Skog Union for its utilisation that it for all practical purposes was dedicated Union as a user. With regard to Voldsfjorden, the port is a commercial unit in itself. The Port Authority was also part owner of Kystlink. The Kystlink example illustrates how the port acts as a facilitator for commercial operations performed by others. In both instances cargo flows and the associated companies are affected by port activities and resources. Whereas the kind of involvement may vary, both instances entail an inherent commercial character. Assessing the commercial character of port operations in Grenland Port regarding Voldsfjorden may start out from Norske Skog’s decision to close down Union in Skien. This had repercussions on the Voldsfjorden terminal and its owner and operator Grenland Port Authority. In order to continue providing cost-efficient services at Voldsfjorden, it is necessary for the Port

114
Authority to replace volumes and activities previously generated Norske Skog Union. This could only realistically be achieved by approaching other shippers that currently generate volumes and activities with the operators of other quays, e.g. at hired public quays. Hence, the Port Authority seeks to replace itself as the operator at Voldsfjorden in order to avoid becoming a competitor to Grenland Port customers. This is one way to address the commercial character of organisation and governance of port operations. The implication of this example with regard to the commercial character of port operations is that while a public port may quite freely engage in commercial activity, when it is engaged on a commercial basis it may not take advantage of its public status amongst public or private competitors. This implies that losses incurred on Voldsfjorden operations cannot be covered with revenue generated upon other quays (as it would originate in competing activity). Moreover, subsequent operations cannot be granted terms that would not apply to any other operator. Thus, faced with operational losses, the ‘administrative’ mandate of the port overshadows its ‘commercial’ character. The situation can be addressed by directing facilities towards other port purposes, or by selling assets for other purposes. However, any revenue generated cannot be used by Grenland Port Authority as an operator. An assessment of the commercial character of port operations in Grenland Port can also start out from Grenland Port Authority’s part ownership in Kystlink. The Kystlink service provided at least two important functions. First, it operated on a regular basis between Grenland and international destinations such as Hirtshals in Denmark. Secondly, Kystlink operated a feeder service sourcing containerised cargoes from local shippers to the Brevik terminal. It is the second function that is particularly important. This is because it implies an opening for the port authority to make available an infrastructure for co-ordination based on services as well as on facilities. Grenland Port Authority differs from both Karmsund and Aalesund in that it specifically addresses a particular group of port users and the services provided by the port. That is, those owning the cargoes, but also the owners of the ships, agents for ship owners, municipalities, local industries, ship operators, etc. In sum, this chapter has presented three Norwegian port cases. The next chapter discusses the features of port authorities as actors. It does this by introducing three overlapping dimensions of port authorities, the administrative, political and commercial respectively. These dimensions have been derived from the cases presented above.

115
7. Dimensions of the Port Authority as an Actor Chapter Six does not lend support to an idea of one Aalesund, Karmsund or Grenland port network co-ordinated or ‘headed’ by a port authority. Instead, as this next chapter argues, the cases illustrate three overlapping dimensions that are present with all of the port authorities. The three dimensions receive different emphasis with the port authorities in the three ports, however. In this chapter, the means by which these dimension influence the port authority’s role in relation to other actors is considered in greater depth.
7.1 What activities shape port authorities?
The various activities performed in the port context are linked to the activities in the activity structure of the port authority. Two examples to be discussed in this section are those of ‘maintenance and charging’ and ‘handling and renting’.
7.1.1 Charging and maintenance
Charging, or the fees the port authority incurs from all users for access to the port and the use of public resources, is a mandatory administration activity for a port authority. The charges are typically incurred for the use of fairways, on berthing and services at public quays and on cargo moved across public quays. Such charges are not to be considered taxation. Instead, they should reflect the cost of use, i.e. a return for investments made and a contribution to ongoing maintenance costs. A port is allowed to set charges so that a limited dividend to investments is possible. The revenues of Aalesund, Karmsund and Grenland port authorities consist for a large part of charges. All the ports charge for the provision of services such as waste disposal. Although such services are not mandatory, they are considered as a basic part of charges levied on users. Furthermore, many users (vessels) of Norwegian ports have no other exchanges with the port authority apart from paying charges. Port authorities may thus primarily be seen as administrative bodies carrying out their mandatory duties. The collection of charges does not imply substantive interaction with users, however. Norwegian port authorities’ involvement in performing activities upon cargoes is limited. Therefore in practice charging reflects interaction across actors, but the port authority is only a party in the interaction to the extent that chargeable investment and maintenance activities enable or constrain multi-actor exchange. The role of the port

116
authority that derives from maintenance and charging is in other words dependent on what is subject to charges; most often investments that aid access for larger vessels. The basis for calculating charges reflects the principles for port finance. As a result port revenues correspond to the related activities and affect further development. The variation in revenue and activity profiles for port authorities arises from features such as the frequency with which vessels call, size of vessels, etc. For example, activities generated within the Global Fish – Tsujino relationship underpin a certain revenue and activity profile for Aalesund Port Authority. Fees from incoming vessels are frequent but seasonal, generated from small and medium-sized fishing vessels that demand little from seaway entrances or quay facilities. As these vessels berths and land their catch at private quays, fees are incurred on use of fairways. This is fairly representative for the unloading of fish in general. In the main season, the Global Fish – Tsujino relationship involves weekly calls by larger container vessels berthing at a public quay (the container terminal). Cargo to the container terminal arrives by land from Global Fish. The terminal is operated by a private company, a tenant to Aalesund Port Authority. Revenues are generated from the use of fairways and rentals from the public quay. The port authority is able to redeploy revenue back to all or even specific users of the public quay. Moreover, the flows of goods that are moved across quays in Karmsund Port District generate a revenue and activity profile that largely corresponds to that of the unloading of fish in Aalesund. Here, the port authority charges for the use of seaways as the quays are private. The important difference between Aalesund and Karmsund relates to the large volumes and the downstream industrial use of products that generate fairly frequent calls with large vessels in Karmsund. Seaways and safety measures applying to the large vessels deployed for these flows are complex and costly. They require regular maintenance, routines and specific skills, let alone physical terminal and quay facilities adapted to the vessels and the associated flows. The vessels for Statoil Kårstø also require services such as tugboats, fire-fighting equipment and the capacity to handle large-scale accidents. The revenue generated from this kind of traffic gives the port authority good reason to engage in activities at a level and with demands for skills not required for other activities in the port district. For example, the port authority may engage with local college education and training in marine safety as a part of their activities.

117
Hydro Aluminium’s use of Fjordline’s Newcastle service out of Karmsund ferry terminal in order to ship extrusions underpins a revenue and activity profile for the port authority similar to that of the Aalesund Port container terminal. The flow of extrusions goods represents a significant share of the cargo for the UK service. As Fjordline (with its two services) is the only user of the ferry terminal, threats to demand for extrusions represents a threat to the existence of the terminal. This is because approximately half of the activity of the tenant and operator of the ferry terminal would be affected. The revenue and activity profile derived from Hydro extrusion activities is therefore interdependent with public quay and other transport facilities. Furthermore, the revenue and activity profile of Karmsund Port District is similar to that of Aalesund, at least in terms of charging for the use of fairways. The connection to flows of a particular kind of input is less clear and uniform, however. Any attempt to classify flows in terms of industries such as gas or fish does not necessarily correspond to what revenue profile is generated and what activity profile can be underpinned. Karmsund Port Authority may thus engage in activities more loosely connected to the immediate use of fairways and quays. This allows for investing in equipment, skills and routines that may benefit users on a more general basis. Grenland Port receives regular calls from many large vessels at private quays that generate a similar revenue and activity profile to some of the big flows in Karmsund Port. There is less of the variation caused by the many private quays in Aalesund and Karmsund. A pipeline for gas would directly affect revenue in terms of the frequency with which large vessels made calls. This is likely to impact on the port authority’s redeployment of funds and activities for further developing and maintaining seaways in parts of the port district. Some companies, such as Borealis and Hydro Polymers, generate a revenue and activity profile for the port authority through using Kystlink as a feeder that collects cargo for the DFDS operated public Brevik terminal.
7.1.2 Handling and renting
Handling refers to activities related to the loading and unloading of vessels. Norwegian port authorities’ engagements with activities of this kind are limited. As a result, the activity links related to port operations are limited. The three port authorities mostly relate indirectly to handling activities by renting out public quays to private companies and operators. This applies in particular to Aalesund and Karmsund ports. Only Grenland Port has a recent history of charging for handling in its capacity as a terminal operator.
118
Indeed, only the latter is a port user, due to its capacity as an owner of vessels that berth at quays in the port district. The main tenants and operators in Aalesund are Norcargo and Tyrholm and Farstad, and in Karmsund Norcargo and HSD. The companies operating from public quays in Karmsund Fishery Port are also long-term tenants. DFDS is the main tenant of Grenland Port Authority as the operator of the Brevik terminal. The port authorities perform administrative and mandatory activities in relation to operators. This is in terms of monitoring that operators comply with the conditions for being awarded ‘operator responsibility’ status. Until recently, Grenland Port Authority provided services upon cargoes to port users, in particular to Norske Skog Union as operator of the Voldsfjorden terminal. The revenue and activity profile generated from handling is challenging for the port authority. This is because it needs to be kept separate from other revenue and activity profiles, both to comply with principles for port finances and to avoid conflict with other operators of public and private quays. It is now necessary for Grenland Port to replace the volumes previously generated by Norske Skog Union in order to continue to provide services that cover the operating costs at Voldsfjorden. In reality, this can only be achieved by attracting cargo operators from other public quays, i.e. tenants of Grenland Port. Hence, the activities and the related revenues of Grenland Port at Voldsfjorden are inter-connected with tenants’ activities and revenues. The issue is that a port authority may engage in performing activities, but it may not take advantage of its public status amongst (public or private competitors). Grenland Port Authority therefore in reality has to find another operator of the terminal and ensure that the activities do not conflict with the existing privately-operated terminals. As part owner in Kystlink, Grenland port authority is both a provider and a user of its own services. The revenue and activity profile derived from this arrangement is potentially awkward, in particular as Kystlink has not been a financial success. This technically implies that losses incurred on Kystlink have to be covered by revenue generated from other flows. As with the situation at Voldsfjorden, the port authority cannot redeploy revenue generated from activities that may be in competition with Kystlink. In the next section, the discussion moves to consider the resources that shape the three port authorities in question.

119
7.2 What resources shape port authorities?
How resources in the port context are connected with the port authority resource collection impacts on how a port authority is perceived by those concerned. A primary example of port authority resources connecting with resources in the port context is the public quays upon which quay operators and vessel operators perform their respective activities. First, it is not only the port authority organisation and personnel that are linked with the port context, but also the laws that regulate the port authority. Secondly, if technical facilities such as cranes or road connections are owned and operated by port authority personnel, ties with the port authority resource collection alter in character away from basic charging. The latter is not common in Norwegian ports, but is present in the Grenland Port case. The most interesting aspect in this regard is that is brings the port authority as an organisation into an interactive setting with other actors. It is here the port authority is in danger of acting in conflict with the laws and mandates governing it. Indeed, it may bring the port authority in conflict with private operators of private or public quays. All quays in the port district are linked with port authority resources (e.g. quays, personnel) at least in a loose sense. To assess the role of the port authority it may be useful to differentiate between organisational and relationship resources, and product, flow and facility resources. The three port authorities do this to varying extents, most clearly and explicitly in Karmsund Port. Organisations and business relationships are resources to the particular port authority in that they condition the use of technical resources such as quays. Therefore an activity, cost and revenue profile for the port authority is generated. The same applies to products and flows of goods and facilities. Some examples are a public quay, warehouse or crane. What public resources – such as a public quay – offer in contrast to private alternatives are a combination of transparency and discretion. This combination means that any given organisation or relationship is not prioritised in relation to others. Furthermore, the ties between a public resource and other resources are not designed to inhibit particular organisations from using that public resource. Norwegian ports tend not to be extensively equipped, apart from with quays that can berth and provide services to larger vessels. This is for a large part due to the principles for port finance that prevent recovering costs for investments from any other than the actual users. This implies that a crane or a shed is required to be self-financing from the start, because funds generated from other activity at that or another quay cannot be transferred.

120
Transparency and discretion is provided to users as a result. The users are ensured that expenses incurred for the use of a public quay will not undermine their competitiveness in relation to other users.
7.3 What actor concerns shape port authorities?
The port authority actor structure differs across the three cases. This is as a result of differences in how the activity structures are linked to activities performed by users in the respective port contexts, with the corresponding resources utilised. For the port authority as an organisation, the result is that three dimensions emerge which concentrate on different aspects particular to each of the three port authorities. This, however, is just as much a reflection of the interaction in place as an active choice on the part of the port authority. It follows from the earlier sections that the port authority is directly and indirectly connected to activities, resources, and, as implied, actors. Indeed, how actors in the port context connect with the port authority affects how a port authority is perceived by those actors. An interesting feature from the cases is that port authorities appear to be distanced from substantive interaction with others. The cases show how a great deal of the interaction, in particular with regard to activities, is distinctly administrative in nature. As the interaction becomes more political in nature, the port authority seems to take a stand as an administrative, intermediary body between the political port owners and commercial users. As interaction becomes commercial, the port authority may be made to retreat to an administrative body as soon as it reaches a competitive position with port users. This requires port authorities to assume a distanced and transparent position from users and use. However, this comes at a cost, in that there are constraints to a port authority’s capacity to acquire an identity and a role in relation to actors in its context. This can be illustrated through the issue of investing.
7.3.1 Investing
The potential for port investment is closely related to existing use. This is because the principles for port finance do not allow for the redeployment of funds across revenue and activity profiles. In Karmsund Port there are two projects that may alter the revenue and activity profile for the port authority. These are; Karmsund Fishery Port and a new public goods terminal adjacent to Karmsund Fishery Port.

121
The Fishery Port has generated activity over time that has attracted more and larger vessels to land their catch at public quays behind which private fish producers operate. The scope and scale of revenue generated upon the quays in Karmsund Fishery Port justifies further activity and investment to integrate yet more activities. A new public goods terminal for services adjacent to Karmsund Fishery Port is an investment that could further expand the possible activity profile. The main development project for Aalesund Port Authority in recent years is Flatholmen. The central idea is for the port to maintain both its status as a national port with a regional role for transport, while at the same time allowing free port areas in the town centre for other purposes. This implies both replacing the existing public container terminal with a new one, and changing the operator. The question as to whether Flatholmen as a public container terminal operated by Norcargo has the potential to affect the existing revenue and activity profile for Aalesund Port Authority is an open one. However, Norcargo is a company with a national rather than local scope. The recent acquisition of Norcargo by Norway Post is an indication of its potential as an integrator of goods. This is further strengthened by its position in the market for fresh fish transport by road. The extent to which Norcargo succeeds at Flatholmen opens up for extensive use of the terminal, with the potential for more frequent calls and a more varied cargo mix. This in turn could justify the further generation of activity at the new terminal. There are currently no large development projects directed by Grenland Port. Rather, there are attempts to further capitalise on the investments already in place.
7.4 Three dimensions of the port authority
Following on from this, three dimensions of the port authority can be derived. First, the port authority can be seen primarily as a matter of administration. This dimension tends not to bring the port authority in direct interaction with users, although it activates resources at an administrative level both within the port authority and users. The administrative dimension is mandatory and is therefore central in all three of the cases studied. Nonetheless, it is possible to argue that Aalesund Port is where the administrative dimension appears to be most prominently expressed. Secondly, the port authority can be viewed as a matter of policy. This political dimension may bring the port authority in indirect and sometimes

122
temporary direct interaction with users over issues of shared interest, e.g. as a mediator between the port owner and port users. The political dimension is present in all of the three cases, but it is perhaps at Karmsund port authority where the political dimension is most at the forefront, in particular as expressed in the port plan. Lastly, the port authority can be considered as a matter of commerce. This dimension brings the port authority in to direct interaction with users. The commercial dimension is in general not prominent in Norwegian ports. However, it can be argued to be clearly present in the Grenland case, both with respect to ownership in Kystlink and via being the operator of the Voldsfjorden terminal. It is important to note that the port authority is never exclusively focused on any of the three dimensions. It is more a matter of which dimension is at the forefront at any given point in time and with regard to what particular objectives. Furthermore, given the mandate of port authorities it is not strictly possible for a port authority to freely choose what dimension to emphasize. As to the order of priority between the dimensions, it appears from the cases that the administrative dimension outranks the political and commercial dimensions. This is supported by laws and regulations, along with the original idea of the port authority as outlined in section 1.2.7. The ownership of the port and the motivation for placing the ownership within the municipality (in Norway) seems to be partly politically and partly administratively motivated. The administrative and political dimensions of the port authority may as a consequence appear in the forefront in terms of Norwegian ports. The commercial dimension becomes an option only insofar as commercial activities do not conflict with the administrative dimension.
7.5 Features of the port authority as an actor
The port authority differs as an actor from other industrial actors and users of the port; at least in terms of how the INA and the ARA model would assess the order of priority between the three dimensions for business organisations. Here the commercial dimension would be at the forefront. This can be tentatively illustrated as in figure 7-1 below.
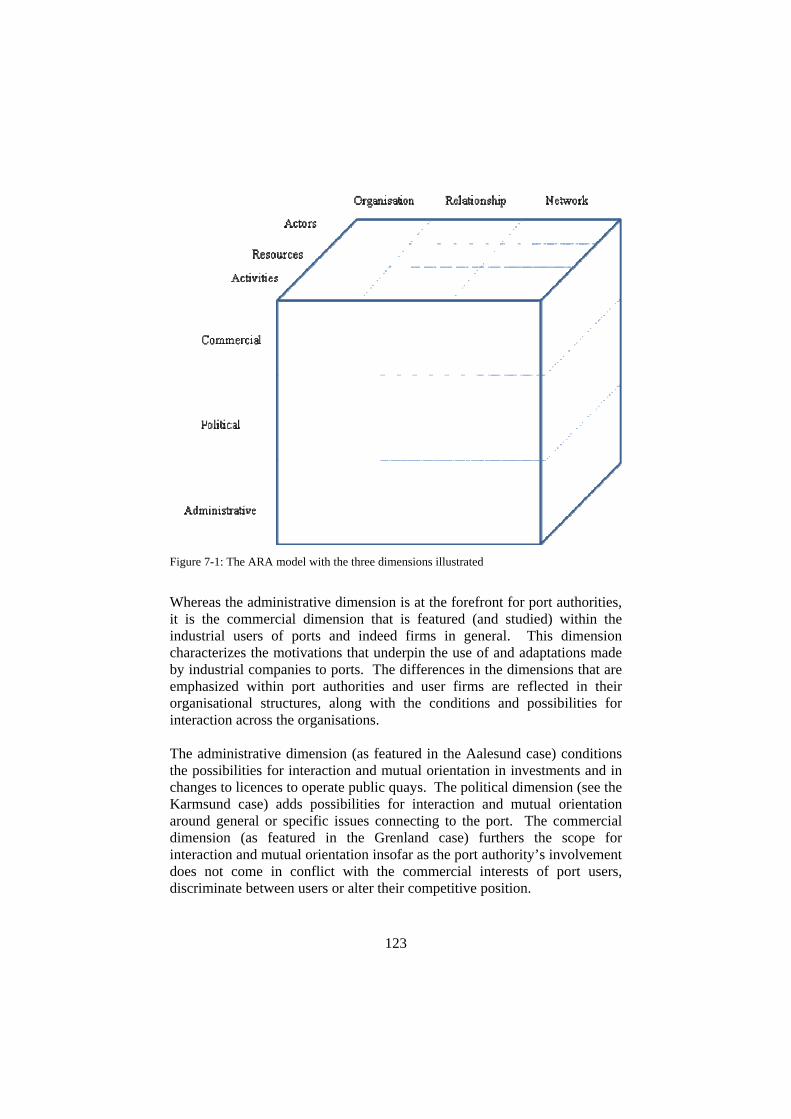
123
Figure 7-1: The ARA model with the three dimensions illustrated
Whereas the administrative dimension is at the forefront for port authorities, it is the commercial dimension that is featured (and studied) within the industrial users of ports and indeed firms in general. This dimension characterizes the motivations that underpin the use of and adaptations made by industrial companies to ports. The differences in the dimensions that are emphasized within port authorities and user firms are reflected in their organisational structures, along with the conditions and possibilities for interaction across the organisations. The administrative dimension (as featured in the Aalesund case) conditions the possibilities for interaction and mutual orientation in investments and in changes to licences to operate public quays. The political dimension (see the Karmsund case) adds possibilities for interaction and mutual orientation around general or specific issues connecting to the port. The commercial dimension (as featured in the Grenland case) furthers the scope for interaction and mutual orientation insofar as the port authority’s involvement does not come in conflict with the commercial interests of port users, discriminate between users or alter their competitive position.

124
In the next chapter the fourth case of the thesis is presented to further exemplify the three dimensions. It is about the large-scale investment by the port of Gothenburg in three container cranes. The case allows further development of the notion of the port authority as an actor in an industrial network. It does so by providing a different example to the Norwegian cases of how the three dimensions play out simultaneously.

125
8. Three Overlapping Dimensions: the Port of Gothenburg case This chapter concerns the role of the Gothenburg Port Authority in relation to a specific decision to invest in three cranes at the Skandia container terminal. The case suggests that the port authority can influence its own role in relation to other actors, through intervening in the pooling of interdependencies, combining of resources and mobilising of actors around the utilisation of specific port resources. This has implications for the role of the port authority as an actor in an industrial network.
8.1 Port of Gothenburg: Some background
The port of Gothenburg is a combined river and coastal port. It is situated along the northern section of the Göta’s outlet and along both banks of the river throughout Gothenburg itself. The administrative and jurisdictional port boundary is defined within a 22-kilometre long stretch of the river. This amounts to the use of approximately 3,600,000 metres 2 of land. Gothenburg became a port city following the visit by the King of Sweden in 1619. The king decided to build a port where river Göta flows into the North Sea (see figure 8-1 below). Two years later, Gothenburg received its city grants. Gothenburg was not the first town with a port along river Göta. Rather it replaced its upstream predecessors to avoid further Norwegian harassment of trades (Lödöse), or being scorched by the Danes (Nya Lödöse and Karl IX’s Gothenburg). The river Göta defined a narrow corridor and with it the only Swedish gateway to the western seas, until a treaty with Denmark-Norway in 1658 secured Swedish rule over the western coast. Westward access to the North Sea and Baltic Sea was crucial for a nation about to assume a position amongst the leading European powers. In particular, the industrial centre for the main Swedish exports of iron and timber was situated around Lake Vänern that has its outlet to the sea through the river Göta.

126
Figure 8-1 Swedish territories 1617-1660 (WHKLMA 2005)
Today the port of Gothenburg is a dominant port in the Nordic and Baltic region. Traditional Swedish exports such as paper, timber and steel products remain very important in terms of goods flows. However, the Port is differentiated from others in the region because it receives regular calls from inter-continental container services. Indeed, ‘Northern Europe container hub’ is a phrase used by both the port and city to coin what the port aspires to. In order to maintain and develop its position as a regional hub for inter-continental container services, the port must attract sufficient cargoes and liner services. This would make the port attractive for both goods owners and shipping companies. Gothenburg still is the main gateway to the west for Swedish industry. However, the present catchment area comprises the entire Nordic area with a potential to include the Baltic countries and parts of Russia. The owner of the Port is the city and municipality of Gothenburg. The port authority is committed to a strategy for the maintenance and development of the Port of Gothenburg as a Northern European container hub. The remainder of the chapter discusses one effort to underpin this strategy: a decision to invest in three super-postpanamax ship-to-shore cranes for container handling at the port’s dedicated car- and container terminal.
LakeVänern
River Göta
City/Port ofGothenburg
127
8.1.1 The need for bigger cranes
On the 10th December 2004, the Port of Gothenburg board decided to buy “three super-postpanamax cranes for the port’s Skandia Container Terminal…as part of its plans “to keep and develop its Northern Europe container hub function” (Port of Göteborg AB, 2004). The ‘super’ variant differed from the existing panamax and postpanamax cranes because it was able to service the new and larger generation of postpanamax and super-postpanamax container vessels. For example, in 2004 the largest operating postpanamax containerships carried up to 8,000 TEU (twenty foot equivalent unit), but the latest generation of super-postpanamax vessels were able to carry 8,000-12,000 TEU. Increasing the carrying capacity implied increased vessel size. Contracts for the construction of at least eight super-postpanamax vessels with a capacity to carry 10,000 TEU each were signed by COSCO (China Ocean Shipping (Group) Company) in 2005 (COSCO, 2005a, b). Each vessel is 349-metres long, 45.6-metres wide and 27.2-metres deep (top of hull to keel). The draft (measure for how many metres of water under the keel is displaced when the vessel is fully loaded) is 14.5-metres, and it travels with a speed of 25.8 knots (COSCO, 2005a; Hyundai Heavy Industries, 2005). There are also reports of designs for 15,000-18,000 TEU vessels (Drewry, 1999). It goes without saying that as lengths, drafts, depths and beams increase in size, fewer ports can receive such vessels as problems arise due to sheer physical size or requirements to catchment areas. Moreover, these vessels also appear to challenge or outgrow the main marine bottlenecks such as the Panama channel and Suez channel. Many ports simply cannot offer fairways and berths deep enough for the largest vessels to operate. The result is that ports are removed from sailing schedules unless they undertake substantial investments. From the perspective of a port authority, the length of a vessel makes demands on fairways, quays, berths and the number of cranes necessary. The main driver for investment in bigger cranes or alternative crane systems is changes in the width/beam of vessels. The alternatives to investment are for vessels to turn around whilst in port (so that the containers are accessible for existing cranes), stow containers within the reach of cranes, or to have cranes servicing vessels from both sides. The latter requires berthing with quays and cranes at both sides of the vessels, whereas the two former alternatives place demands for planning and adaptation on the part of the vessel and the other relevant ports of call. The only viable solution for most ports has been to invest in cranes and other landside facilities.

128
In 2004, the largest vessels with regular calls at Gothenburg were the Maersk S-class liners at 350-metres long and 42.8-metres wide, with a draft of 14.5-metres and a recorded capacity of 6,600 TEU. They were deployed on one of Maersk’s many Asia – Europe services. This beam size exceeded the crane outreach available in Gothenburg. The vessels could be serviced by existing panamax cranes by carrying 13-14 container rows across the beam. This required adaptation from both the vessel and the preceding ports of call, and hence was a central driver for the investment in the new cranes.
8.1.2 The use-context of cranes
In 2004 the annual capacity of the Port of Gothenburg was 736,000 TEU (Port of Göteborg AB, 2005a). The expectation was that an estimated 750,000 TEU annual capacity would soon be achieved, with forecasts of 1.6 million TEU by 2010-2012 (WorldCargo New, 2000). The plan, according to the Port of Gothenburg CEO, was to treble capacity as soon as possible (in Twedberg, 2002). The decision to buy three cranes was part of this larger terminal and port development program. Aggregate numbers such as these can easily be misinterpreted, because they might refer to several terminals within the port, or conceal differences in what one TEU may represent. Of the total 736,000 TEU turnover in 2004, just below 600,000 TEU was related to Lo-Lo operations in the container terminal in which the cranes are relevant. The remaining TEU’s relate to operations in the Ro-Ro terminal where ship-to-shore cranes are not used. How many container units 600,000 TEU amounts to is dependent upon the split between the types of containers. This is typically done using the ratio of 20-foot (1 TEU) versus 40-foot container units (2 TEU). In the Gothenburg container terminal, 70% (250,000 containers) are 40-foot units. By contrast, 100,000 containers are 20-foot units. Hence, a reasonable estimate for the number of container units handled in the terminal is 350,000. Ship-to-shore cranes may be involved in handling each unit more than once, depending on the proportion of transhipment. Transhipment generates two lifts per unit rather than one. A transhipment ratio of 100% generates 350,000 x 2 = 700,000 lifts. The transhipment ratio is low at the Port of Gothenburg, at just 1.8%. This results in a total of approximately 355,000 lifts. Provided that part of a development plan is to increase the transhipment ratio, and that the proportion of 20- versus 40-foot container units remains constant, the number of lifts would be expected to increase proportionally more than the growth in TEU. Transhipment is attractive to
129
the port as it generates more remunerated activity. Moreover, it is considered to make the port more attractive for inter-continental container services. To increase the level of transhipment implies that the feeder services that presently call at continental ports for inter-continental services make Gothenburg their hub port. In order for that to happen, the port has to address the economics of feeder services.
8.1.3 Cranes and crane operations
Prior to any investment in new cranes, the Lo-Lo container terminal was equipped with two postpanamax cranes (reaching over 18 container rows) and 6 panamax cranes (with an outreach over 13-14 container rows). Maersk berth there with vessels carrying 17 container rows over a width of 43-metres. Each vessel requires five cranes to be at work simultaneously. One problem was then that only two of the five crane positions covered the whole beam of the vessel. Making investments in new cranes would mean that large vessels would be handled by cranes with an outreach of 22-23 container rows. In other words, the cranes would cover the whole beam of the vessel in all five possible crane positions. The new cranes were known to be higher than existing cranes, and would move along wider gauges. Their operating speed would be faster than that of existing smaller cranes, but the increased height means that the lifting distance would increase for containers. The new cranes were likely to result in a further specialised and dedicated crane structure at the terminal. In other words, super-postpanamax/postpanamax cranes would cater for larger vessels and panamax cranes would handle smaller vessels with assistance from postpanamax cranes when necessary. The challenge would be to secure the utilisation pattern of the large cranes by attracting more large vessels and inter-continental services.
8.1.4 The bigger program: Fairways and dredging
The cost of three cranes amounted to € 27 million (SEK 240 million). However, further improvements of quays, quay walls, substructures and piling were required and have been completed. The crane investment was connected to an ongoing dredging program in order to straighten and widen the fairway used by the largest tankers and container vessels. This would increase the depth of the inner part of the fairway to 15-metres and the depths from the terminal quay walls from 12 to 14.2-metres. Although the cranes were to be purchased and financed by the port authority itself on commercial terms, the dredging programme is a joint effort between

130
the Swedish Maritime Administration (72 %) and the port (28 %). The total cost of the programme is € 60 million. A second phase involved the deepening a second shorter and straighter fairway to be financed solely by the port authority.
8.1.5 The Maersk AE1-service
The process leading up to the decision to purchase three new cranes was rooted in the need to replace one unreliable panamax crane. In addition, the ability for deploy five crane positions (as described in the previous section) with sufficient outreach for Maersk vessels was important. There was pressure from Maersk for the port authority to invest in bigger cranes. This was in order for Maersk to continue calling at Gothenburg, which was particularly important because it was the only real inter-continental service that called at the Port. The Maersk S-class vessels deployed on the AE1-service (Europe-to-Far East) are the only present users that can utilise the full potential of the new cranes and what the extended expansion programme offers. In other words, as it stands, the commercial potential of the cranes depends in full on the vessels used on the Maersk service. The service collects cargoes for Asia on a loop calling at various European ports (and in reverse from Asia to Europe). Until 2005, the main uninterrupted part of the service was crossing the Mediterranean Sea from Algeciras through the Suez Canal to Tanjong Pelepas in Malaysia on the eastern route (14 days), and the stretch from Malaysia to Felixstowe (UK) on the western route (16 days). These uninterrupted stretches accounted for about half of the total 63 days a full loop takes. For the remaining 33 days vessels made a scheduled 21 calls in a total of 12 different ports. The decision as to which ports to include (as changes are and have been made) is based on various criteria, but it is important to maintain the weekly sailing schedule and that vessels are fully laden on the uninterrupted stretches. The AE1 service berths at the Port of Gothenburg late on Thursday evening, having departed the Bremerhaven APM terminal (a subsidiary of Maersk) late on Wednesday afternoon. After the unloading and loading of 1,000-2,000 containers has taken place by Friday midday, the service departs for a short crossing over to the APM terminal in Aarhus, Denmark. From here it departs the next day for the APM terminal in Bremerhaven, where it berths on Monday. Nine vessels are deployed on the AE1 service.

131
Maersk has a strong position in the market for sea transport in the Nordic and Baltic regions. With a tight system for feeder services the market segment for inter-continental transport could be served from continental ports. For example, the APM terminal in Bremerhaven could be used, thus removing calls by inter-continental services at Scandinavian ports altogether (Drewry, 1999). Attracting new lines is not straightforward, as Gothenburg practically carries a three days sailing deviation (from Bremerhaven) on its own. However, the Port of Gothenburg depends on actors such as Maersk for its inclusion in inter-continental services, as well as the network of agents that source cargoes to Gothenburg. Due to a positive balance of exports, more full containers are sent from Gothenburg on Maersk’s services compared to goods received. This outflow of containers needs to be continuously replaced by empty containers. The number of lifts produced to move the empty containers required on the AE1-service accounts for 14% of all lifts made in the Lo-Lo terminal. Having now provided some background information, the next part of the chapter discusses Gothenburg Port Authority in terms of the investments in the three new cranes.
8.2 The port organisation
In general terms the port authority is organised to handle both its users and the relevant laws applying to ports. By contrast, the investment in the new cranes is an issue of how the port organisation can address the interaction that affects the utilisation of the container terminal and inter-continental container services. The decision for the municipality of Gothenburg to engage in port and stevedoring activities was made on the 3rd March 1983, following the acquisition of all shares from Skandiaterminalen AB. The Port of Gothenburg board consists of elected political representatives from the various political parties in the municipality. The Port is an instrument through which its owner initiates and channels industrial policies supporting general economic activity and industry. The ownership structure, decision mechanisms, company board, audits and so on reflect this general purpose. The more specific services that are to be offered to serve this purpose change over time, however. The owner directive states the; “Port of Gothenburg AB shall play a central role in Gothenburg by creating fertile conditions for industry and thereby positive effects for the employment of Gothenburg citizens”. [] “In

132
accordance with the city’s ambitions for industrial policy”, the port shall “actively promote, develop and ascertain the role of Gothenburg as a national logistical centre” (City of Gothenburg, 2003, my translation). Strategic planning for improved utilisation of the port and its resources is the responsibility of the port authority. This in turn answers to the Port of Gothenburg AB board. The port is a fully-owned subsidiary of the city and municipality of Gothenburg, through the company Göteborgs Kommunala Förvaltnings AB (GKF). The city council has the ultimate owner control and responsibility over GKF. Units organised under the GKF umbrella answer to laws applying to municipalities (municipal law, secrecy law, administration law and archive law) as well as to laws for shareholding companies in general. In the short and medium term the owner directive implies attracting as much traffic as possible to cover the costs of operating the port, and to justify the use of land dedicated to port purposes. Unlike ports in many other European countries, the Port of Gothenburg finances investments and operations from its own income or from loans serviced on commercial terms. The Port is affected by international trade and competition policies in general and also because of the inter-continental services offered. In comparison to the ports discussed in Chapter Six, the Port of Gothenburg is heavily dependent upon cargo handling activities. Cargo handling is the port authority’s domain, and it is the sole supplier of port services.
8.2.1 Port authority
The Port of Gothenburg has a harbour authority that charges for public services. This is in particular related to the use of seaways. The port authority charges for services related to berthing, loading and unloading and other services provided to vessels at public quays. The division between the harbour authority and the port authority is made because of the need for transparency in both Swedish and international regulation. The harbour authority is therefore distinct from the port authority. It is important for the investment programme outlined above because of its role in the dredging and straightening of fairways. This relates to crane investments in that vessels for which the increased crane capacity can be utilised also require deeper and straighter sea entrances. The port authority is organised to deal primarily with the short, operational term (which can be relatively long periods of time). This requires monitoring trends that are likely to affect current operations, analysing what these imply in terms of

133
investment, and to inform the owners of aspects that require attention in the medium and longer term. Typical mandated administration activities, such as charging, are kept separate from other activities in Port of Gothenburg. This is in order to increase the level of transparency across different kinds of revenue. While it is not a requirement to organisationally separate between a harbour and port authority, transparency is required with regard to finances and to exercising governmental authority. The Port of Gothenburg port authority is akin to a monopolist. This is because it takes full and exclusive responsibility for providing all services to vessels in relation to berthing and handling at quays. Only to a very limited extent does the port authority allow external suppliers on to the port premises. In other words, the structures to provide both sea and landside users with access to services are controlled by the port authority. One result is that investments are presented as part of a strategy to be better positioned for existing and potential flows of passengers and goods. This means that the port authority views itself as endowed with a role in relation to users that underpin the existing and potential flows of passengers and goods. Nevertheless, the specific users that should benefit from investments are seldom emphasized. Instead, an extended user concept tends to be applied. This has a tendency to emphasize land-based beneficiaries more than sea-side users (the paying vessels). In terms of the investments in the three new cranes, it is apparent that the port and port owner acted in response to explicit requests from one particular user, however. Only Maersk vessels are the direct beneficiaries of the investments made. The broader justification made for the three cranes relates partly to the importance of hosting inter-continental container services for the region, and partly on the perceived potential for the Port to attract new inter-continental carriers. Nevertheless, without Maersk it is difficult to consider how the Port of Gothenburg could justify investing in super-postpanamax cranes, based on the present level of utilisation.
8.2.2 Terminal operations
One department within the port authority has the operative responsibility for the container terminal. There is a division of labour between the port authority and the terminal unit, in that the former operates the cranes while the latter is responsible for contact with shipping companies and land-side carriers. Furthermore, the port authority attends to more general marketing

134
tasks, such as attracting container lines and cargo. This is to improve the utilisation of port facilities resources in general and the container terminal in particular. The two units are responsible for organising the utilisation of cranes in accordance with the port mandate. Shipping companies enter into agreements for land-haulage with private carriers or the railways with no involvement by the port authority. Hence, the port’s operative boundary extends further than the Norwegian ports, but reaches a frontier with the port community providing services to vessels and shippers outside the port. As the Port of Gothenburg is the dominant port used for containerised cargoes in Sweden, the Nordic and Baltic region, there are limits to the additional volumes available in the present catchment area. The port needs to address non-containerised cargo, as well as cargoes for inter-continental destinations from feeder services at other ports within the catchment area. Extending the catchment area to effectively source more Nordic, Russian and Baltic cargoes is another matter. For Norwegian shippers, routing cargoes destined for inter-continental destinations via Gothenburg may sometimes be an option. However, this is rather complex, because there are constraints in terms of the limited frequency and destinations of services offered. For Asian shippers the option of shipping cargoes destined for Norway via Gothenburg is more evident, yet equally constrained by the frequency of sailings. The challenge is for the port authority to source cargoes that connect the use of cranes to more and/or different sets of interdependent activities and combined resources. Container operations in ports do not lend themselves easily to such expansion activities. This is because many port authorities settle with viewing containers as the only thing that flows through a container terminal, to which everything is homogenously adapted. This is a result of the port authority having only a vague notion of what cargoes are concealed within containers. Moreover, there is no clear idea as to the origins of a container or its contents. This is because stuffing and re-stuffing may take place close to the port, or due to documents stating the origin of the container being left at the port where the contents of the container originate. The result is that it is difficult for container ports to get to get a picture of the heterogeneity inherent to the context with which their own resources are being combined. Hence, in order to address cargoes (containerised or not) within the existing or extended catchment area, the port authority needs to form ideas about the various contexts their own resources need to interact, which are realistic to
135
approach, and how to do it. The Port of Gothenburg’s Marketing Department attempts to seek out and assess opportunities that derive from potentially interdependent activities and combined resources, thus extending the use of cranes through increased market shares. However, the means by which this is done are rather rough and ready.
8.2.3 Sourcing additional flows of goods
With an extended vision of a catchment area from which to capture new cargo flows, it becomes increasingly difficult for the port authority to attach identity to the actors whose cargoes moves across the terminal. The criteria for differentiating between cargoes could be based on a segmentation of which containers generate of activities and revenue to the port (e.g. long, heavy or dangerous lifts, feeder traffic or transhipment, etc.). Activities performed at the terminal are interdependent with activities performed by other actors (both at the quay side and at other locations), as well as with activities organised by the port outside the port area itself. The activities within the terminal may also be based on additional volumes as a result of growth in the total market for containerised cargoes. Containerisation may also affect cargoes presently carried across Gothenburg Port, in the container terminal or in other terminals, e.g. in the adjacent Ro-Ro terminal. If the Maersk service was lost, in theory a large share of the present cargo would still pass through Gothenburg port for shipment by feeder services to another inter-continental port. But the leakage of calls, cargoes and activities to other and smaller Nordic and Baltic feeder ports would most likely be very noticeable. It may not be as simple as a shortened AE1 service stopping in Bremerhaven, with this destination becoming a new hub for Nordic feeder services. There are many competing services and ports on the European continent for Nordic inter-continental cargoes. Maersk would most likely experience a leakage of cargoes. In order to make it attractive for feeder ships carrying cargo for destinations to the continent or in the Nordic/Baltic area start or end their service in Gothenburg, the port authority needs to acquire a good understanding of what underpins the present Nordic and Baltic cargoes. This is to create economies of scale that a perhaps sufficient for more inter-continental services to call at Gothenburg. In short, the port authority needs to make clear the benefits of Gothenburg as a hub for Nordic and Baltic cargoes rather than Bremerhaven, Hamburg, Felixstowe or Rotterdam. When there
136
is currently only one inter-continental service that does not carry cargoes between continental ports this is a severe challenge. One potentially attractive cargo (that is described in the Aalesund and Karmsund cases) is that of frozen pelagic fish destined for the East-European market. At present, it is carried as bulk cargo in large volumes by reefer vessels passing through the strait separating Gothenburg from Denmark. Yet containerised cargo from Aalesund is currently shipped with Maersk for transhipment in Hamburg and Rotterdam to final destinations in Japan or China. Some proportion of the bulk cargo carrying fish from Norway could therefore be carried on Maersk’s AE1 service. The Maersk resource constellation and activity pattern is already important as to what arrangements are offered to shippers in Aalesund. There is therefore the possibility for Maersk to combine and connect legs of an inter-continental service with changes in distribution arrangements for frozen pelagic fish from Aalesund and Karmsund. This could create the potential for transhipment in Gothenburg. This example does not only illustrate how Maersk may consider altering its distribution arrangements for Norwegian shipments to improve regularity, utilisation and market shares for Maersk feeder services. It also illustrates how, in isolation, such an arrangement may underpin the Maersk AE1 service at Gothenburg.
8.3 The port authority as an actor?
Before considering the implications from the Gothenburg case in detail, this section returns to but follows on from the discussion in sections 7.4 and 7.5 regarding the three overlapping dimensions of port authorities; the administrative, political and commercial dimensions respectively. What differed across the three Norwegian cases was which dimension was emphasized in each. The Aalesund case was used to exemplify an emphasis on the administrative dimension, Karmsund the political dimension and the Grenland case the commercial dimension. Nevertheless, as was stated earlier, all three dimensions are present in all the port authority cases to a greater or lesser extent. Finally, it was argued through reference to the Grenland case that the administrative dimension is in some ways the default dimension for port authorities. This is due to the ways in which they are regulated in order to avoid discriminating practices towards port users. What the discussion in sections 7.4 and 7.5 further showed is that only the commercial dimension brings the port authority in direct contact with the interaction across organisations, when the linking of activities and

137
combining of resources is an ongoing matter. All other interaction that eventually moulds the use of the port is a reflection of the interaction amongst users in which the port authority is not part, and therefore not an actor in the eyes of others. This is important, as one implication is that very little information about those interactions that eventually impact on the port is accessible to the port authority. Moreover, nor may such information be very useful, as the port authority is not inclined to act upon such information apart from what registers in the administrative dimension. Chapter Six accounted for some of the interdependencies across activities that impact on port authorities through the activity structure and resource collection of the ports. The texture of interdependencies and resource combinations users impose on a port by utilising port resources is the basis for continuous efforts to economise and improve on efficiency in the activity structures of each firm. Furthermore, companies attempt to combine resources in accordance with their understanding of the bigger resource constellation. The result is a bundle of pooled interdependencies and combined resources that is imposed on a port by its users. Figure 8-2 illustrates the interaction that moulds port use via the ARA model. The port authority is not part of this as an actor at the relationship or network levels. The bundle impacts on the port authority through the use of resources which register on the administrative dimension.
Figure 8-2: A bundle as a reflection of interaction imposed on the port authority

138
8.3.1 The “non-discriminatory”, “non-actor” port authority
The lack of use of information by the port authority that could lead it to discriminate across users leads to what I term a “non-actor” port authority, even though port authorities direct and organise their activities and resources towards the bundle of pooled interdependencies and combined resources. From the perspective of the administrative dimension, information relevant for levying port charges and security issues is sufficient. In terms of the political dimension, the information relevant for further investment and connecting infrastructures is at issue. What is important from the perspective of the commercial dimension is information relevant for developing and influencing bundles that impact on the port. However, apart from investments, transparency over and changes of operating licences, and ownership to / use of its own resources, the possibilities for port authorities to engage in committed interaction with users on an ongoing or temporary basis, is restricted in the cases described in Chapter Six. In the INA, business relationships provide a focus for undertaking individual and joint efforts to exploit and further develop interdependencies between activities within the company activity structure. In addition, they bring the possibility to extend the scope for pooling interdependencies through connecting activity links across company activity structures. The three Norwegian port authorities are severely constrained from pursuing such a focus or indeed to access and share information that could give them a role as an actor in relation to users. Similarly, business relationships provide a focus for individual and joint efforts to combine resources in order to influence the scale of utilisation of resource combinations. This is done through connecting resource ties across company resource collections. Co-ordination, both in technical and organisational terms, and within a company and relationship context, may be discussed between parties in a business relationship. However, for the port authority similar constraints apply as was discussed for activities. Hence, the port authority (organisation) that is host to a bundle of pooled interdependencies and resource combinations is not necessarily in a favourable position to exert influence, power or control. A dependence on the stability of the bundle for its continued activities may constrain a port authority from taking advantage of other sources of potential interdependencies and resource combinations. Hosting a bundle may thus enable the port authority with gains, but it may also prevent further bundling. Moreover, in general co-ordination is more difficult when no relational connection or organisational structure to support potential interdependencies

139
and resource combinations between companies exists. The three Norwegian ports have as their objective to achieve maximum utilisation of the port in general and port authority governed resources in particular. Bundling is the main mechanism underpinning further utilisation, but at the same time the port authority must avoid creating obstacles to bundling. This leads to a non-discriminatory, but also distanced approach to actors. At best, investments and changes in the operators of public port facilities create temporary insight and substance to the knowledge of some actors. As figure 8-3 illustrates, the port authority that is totally defined by an imposed bundle of interdependencies and resource combinations is a non-actor in terms of the ARA model. It has no space, nor indeed need to mobilise the identity of actors that directly or indirectly activate port resources. Such port authorities exist merely as organisations, disconnected from the relationship and network functional levels. Nevertheless, this does not mean that the port organisation is unimportant to users of port resources; just that it does not exercise discriminatory influence on the processes forming the bundle.
Company/-organisation Relationship Network
Actors Organisational structure
Actor Bonds
Web of Actors
Resources Resource Collection
Resource Ties
Resource constellation
Activities Activity structure
Activity Links
Activity Pattern
Figure 8-3: The port authority as a non-actor in terms of the ARA model
What could change the potential for discriminatory influence is if significant public investments are made. Whereas investments may change the interaction shaping the bundle on a permanent basis, the role of the port authority changes only temporarily. It also may alter due to changes in the operator of public port resources in particular quays. This is how the Gothenburg case differs from the Norwegian ones, because it exemplifies the importance of accessing the bundle through the relationship and network levels. However, although the Gothenburg port authority is connected to the interaction amongst users through its resource collection and activity

140
structure, it cannot tie resources or link activities in a relational way. The reason, as discussed below, is that tying and linking creates wedges at a network level, which is simultaneously discriminatory on a relationship level.
8.3.2 Mobilising but not discriminating amongst users
The main challenge for the port authority involved in mobilising the actors whose activities and resources are embedded within a bundle, is to visualise the interdependencies and resource combinations across these actors. Furthermore, as the Gothenburg port authority is also the operator of the container terminal, a second challenge is to tailor remunerated services to this bundle. Visualising and tailoring services to a bundle requires substantial knowledge of and access to a continuous flow of information on both users and user interaction. Such knowledge and information, typically relational and discrete, may be made accessible through mutually oriented interaction between actors. This would in many cases take place as a matter of course in the co-ordination of activities and adaptation of resources between two companies in a business relationship. However, the Gothenburg port authority, although interacting with the main users, may not discriminate amongst them. As it is involved with all the users of the same facilities, mutual orientation in terms of co-ordination and adaptation to one actor in particular may be discriminatory. This is a legal issue in relation to public undertakings. Although the same conditions for use are available to all potential users, it could be argued that the investment in cranes was an individual adaptation that benefited a particular large user. The crane investment carries a potential to alter the interaction that has moulded the present bundle. Indeed, it is aimed at this by attracting new inter-continental services and increasing the level of transhipment. Whether or not this represents a wedge (this term will be further explained in section 8.3.3 below) depends on whether subsequent interaction positively or negatively discriminates or favours particular interdependencies or resource combinations in a planned and systematic way so that specific actors or groups of actors benefit. In order to avoid speculation, the Gothenburg port authority (as in the Norwegian cases), has taken steps to prevent discriminatory interventions in interdependencies and resource combinations that are likely to favour particular actors. It does this through maintaining an administrative port dimension (as emphasized also by the Aalesund case). Activities are kept distinct and transparent, even separated in the organisational units of the port

141
authority and the harbour authority. In common with the Karmsund case, the fourth case places emphasis on a political dimension by facilitating integration at a regional level. Some examples are by linking road and rail infrastructures and overcoming administrative barriers across counties. Moreover, as with the Grenland case, a commercial dimension is singled out by the Gothenburg port authority in its terminal operations. However, the main difference is that the latter port authority is the only operator in the port. In order not to discriminate across actors in the bundle, therefore, the port authority is prevented from seeing the terminal as a factory port (for and with Maersk). Instead, it needs other shipping lines and shippers in order to obtain the variation required for attracting volumes. The port authority cannot then co-ordinate and adapt to Maersk, the only present user of the cranes. It has a balancing act to perform in emphasizing all the port dimensions simultaneously and in a non-discriminatory way. This does not allow it to be part of the interaction that could provide knowledge of and access to a continuous flow of information on user interaction.
8.3.3 Bundling and wedging
In the three Norwegian cases, the respective port authorities attempted to intervene in their roles, through adapting services to the bundle of interdependent activities and combined resources that were moulded by the existing pattern of utilisation. The means to do so were via the activity structure and resource collection. It was argued that only in the Grenland case did the port authority attempt to acquire identity as an actor by operating a terminal. Due to the fact that this role was unsustainable, the identity as an actor amongst industrial actors was not acquired. Furthermore, it can be argued that the Norwegian port authorities did not place wedges between users and suppliers (apart from in relation to major investments and change of operator, both of which are very infrequent). All in all, Norwegian ports do not interact with users apart from on an administrative and political level. The Port of Gothenburg authority can be said to view itself as an actor. It ascribes a clear identity with users of a specific resource (the cranes). It is a comprehensive actor in the sense that all the three port authority dimensions are emphasized simultaneously. This stands in contrast with the three Norwegian port authorities; here one port dimension is emphasized at a given point in time. The Gothenburg port authority is limited as an industrial actor only by the constraints upon public enterprises imposed upon it with regard to discriminatory practices. This prevents the port authority

142
from becoming part of the bundling process and instead imposes wedges on the interaction shaping the bundle. Why are wedges imposed in the Gothenburg case? When the port authority invests in three new cranes that can currently only be utilised by one user, there is a danger that the large investment financed by all users will benefit that one user more. Furthermore, in principle the cranes could undermine the business of feeders, which is the biggest current group of users, if the level of transhipment did increase. The three cranes would wedge into the flows of cargoes within and between regions, which shifts the balances across shippers, carriers and paying users. Wedging implies that particular users are favoured by particular wedges. This means that the identity of the port authority is associated with a wedge, which results in the port authority becoming an actor in relation to some actors, but less so in relation to others. Wedging may as a result be difficult to reconcile with the need for an indiscriminate role in terms of the broader web of users and other actors. To attract new users to the new cranes in the Gothenburg example, however, requires some segmentation to facilitate bundles loading on this particular resource. If the port authority is prevented from doing this directly and interactively, it needs to mobilise actors on a general basis in order not to create wedges between actors that presently load on all resources in the terminal. The problem with conscious bundling and segmentation on the part of the port authority is that it wedges into existing constellations of activities and resources which paying users have invested in. This may undermine the interests served by users’ investments. Wedges are inherently relational, and adapting services according to one/some actors’ interdependencies and resource combinations implies wedging into bundles in a discriminatory way. In sum, wedging (and indeed de-wedging) opens up for bundling (and thereby un-bundling). However, whereas wedging has inherent relational implications, bundling spans the whole range from dedicated and planned bundles to completely user-enacted bundles. The final chapter of the thesis discusses the implications and conclusions of this for both ports and the INA.

143
9. Implications and conclusions In this thesis I have attempted to study the role of ports as actors in industrial networks, and more specifically what characterizes this role in an industrial network approach. The research question was designed for the purpose of investigating how ports – through their respective port authorities – interact with business actors. I have outlined a way to study ports using the ARA framework. This tool that was discussed at length in Chapter Five has been applied to four case studies. Each of the cases discussed the role of the port authority in relation to a wider network of industrial actors. Three dimensions of the port authority as an actor were suggested as following from the three Norwegian port cases presented in Chapter Six. The dimensions of a port authority as an actor are the administrative, political and commercial respectively. The three dimensions are differentially emphasized in the first three cases, and are simultaneously in place in the Port of Gothenburg case. It has been suggested that port authorities can influence their own roles by intervening in a bundle of interdependent activities and resource combinations that users’ load on the port. The interventions were said to occur through the use of pooling, combining and mobilising. The three Norwegian cases showed how this can be problematic for port authorities, however. They were prevented from engaging in pooling, combining and mobilising due to reasons related to wedging. This therefore means that the existence of a port authority in itself is not sufficient to be able to state that a port authority is an actor in an industrial context. The fourth case of the Port of Gothenburg exemplified a port authority attempting to shape the bundle that defines use, enacting all three dimensions of the port authority simultaneously to become an actor. This case further exemplifies how the port authority has a dilemma of simultaneously interacting but not creating wedges as a result. In this final chapter the implications of the thesis are discussed with regard to both ports and industrial networks.
9.1 Implications for ports
The discussions within Chapters Five to Eight illustrate how the character of a port changes in relation to the extent to which the respective port organisation connects to or intervenes in the bundle of pooled interdependencies, resource combinations and mobilised actors that impact on and define the utilisation of port resources. The role of the port authority

144
can be described in terms of its capacity to intervene in the current bundle. However, it can also be described in terms of its limitations related to mobilising actors due to wedges being created that can cut across bundles. Whereas any role for the port authority implies some intervening capacity, the actor role depends on the possibilities to intervene. This takes place through concerted efforts to put in place bundles and wedges that underpin the individual port’s mission and objectives. Port authorities can assume an active role as actors in relation to other actors to the extent to which the port is involved in the existing bundle. An active actor role can furthermore be based on the port authority’s capacity to intervene by putting in place wedges that facilitate new or extended bundles without discriminating against actors involved in the current bundle.
9.1.1 Pooling, combining and mobilising
Pooling interdependencies, combining features of heterogeneous resources and mobilising actors is the nature of business interaction in the ARA model within the INA. These words describe the pursuit of economies companies aspire to, and so would port authorities if they were a business in the traditional sense. In fact, many ports would have something to offer as a business in a business context, such as practically exclusive rights to a hinterland for seaborne transport. Ports could also in practice prevent shippers’ or vessels’ access to a port area, unless they were users of exclusive and dedicated services for transport to and from a vessel. However, the administrative dimension of the port authority prevents this. All the cases illustrate the constraints to port authorities taking on a predominantly commercial port dimension. On a day-to-day basis, ports are not actors in an industrial context. The administrative port dimension is the default dimension ports retreat to as their regular modus operandi. The main purpose in relation to industrial actors is to facilitate bundling amongst those actors. There is also a need to maximise the level of transactions in the port district, offer adequate services to the existing bundle and prevent actions that constrain bundling amongst actors. This may be described as an administrative, indiscriminate role. The political dimension of port authorities is related in particular with regard to investment decisions. Here, the port authority acts as the owners’ professional body on port matters. One major responsibility is that, after an investment is in place, the port authority can revert to an administrative port dimension. This makes the issue of operator regime important, regardless of whether the operator is external to the port organisation or not. The main

145
purpose in relation to industrial actors in this dimension is to re-fit services to a bundle that has rendered existing services inadequate or has become a bottleneck for further bundling. A change of operator may be a part of this. In sum, the port authority may both revert to an administrative dimension, and try to transcend this profile on a permanent basis as a mediator between owners and users. It may be described as an indirect political, indiscriminate role. The commercial dimension is a challenge to combine with the other dimensions on a permanent basis. As such, the commercial dimension tends to be coloured by the administrative dimension. This is due to the need to maintain a non-discriminatory, arm’s-length role in relation to business actors. The main purpose of engaging in a commercial dimension is debateable, and the issue of privatising ports or parts thereof is pertinent here. If or when a conflict across dimensions is exacerbated, the permanency of the commercial dimension is challenged, as it is based on an administrative and political monopoly for port matters in a port context. The port authority must at all times maintain the conditions for reverting to a mainly administrative dimension. The implications are that the port authority is not an embedded actor amongst industrial actors. On the one hand this may make it impartial, but it will also disconnect it from the continuous bundling processes that define a port. To become an actor amongst industrial actors, ports need to wedge into the existing bundle by altering the dimensions underlying pooling and recombining efforts.
9.1.2 Bundling and wedging
For what purposes does a port authority attempt to introduce wedges, and what happens when a port authority wedges into a bundle and mobilises actors around the utilisation of specific port resources? A bundle of interdependent activities and combined resources are imposed on ports by industrial actors. The bundle appears as one big pattern of use that loads on various port resources. However, it is comprised of multiple industrial actors’ enacted interdependencies and combinations. These actors are not concerned with the bundle as a totality, only the fragments that impact on the further pursuit of interdependencies and combinations that shape their businesses. Nor do they have any particular interest in the development of a bundle unless it enables or constrains their own interests. The port authority has an interest in facilitating bundling insofar as it underpins the individual port’s mission and objectives. In other words, the
146
interest is based on a wish to facilitate the competitiveness of local and regional industry whilst incurring the minimum inconvenience for the welfare of the community. In practice, this translates into attracting as much cargo as possible to port facilities that are designed to minimise pollution, land use, road congestion, etc., and for this to be at least self-financing, if not profitable. However, the interaction amongst industrial actors shapes a bundle that is imposed on ports, and this comes with pollution, land use, road congestion, etc. Attempts are then made to introduce wedges in order to develop the outcomes of the bundle in accordance with the port mission and objectives. Hence, the purpose of wedges is to cut across interdependencies and resource combinations in ways that improve the outcomes of interaction for the owning community. The challenge is to wedge without discriminating across actors and avoiding any unexpected obstacles for future bundling. This challenge is overcome through emphasizing port dimensions that reduce the risk of discrimination and maintain the public mandate. The cost is that the port authority is disconnected from the information that follows interaction. Wedges that have their basis in the administrative and political port dimensions are typically characterized by a very low level of mobilisation of actors, and a high level of regulation. This makes further bundling based on existing resources dwindle and at some point stop (at least in the long run). Wedges cut across a bundle, altering the interaction amongst actors to adapt to new conditions. The complexity, limited transparency and overview over the bundle and the interaction it derives from, make wedges highly unpredictable. A fear of generating suspicion as to whether favourable terms are awarded to certain actors, or that some users are being constrained from pursuing further interdependencies, means that it becomes awkward for a port authority to assess the possibilities for expanding the bundle. For example, Grenland Port has been organisationally involved in shaping the Grenland bundle through ownership and operations at Voldsfjorden, and by investments Kystlink. However, at the closure of Norske Skog Union, the port authority was impelled to withdraw from further involvement. The central reason for this was to avoid wedging into the pattern of interaction its biggest operator and tenant is part of. In large ports, typically those with a terminal structure that segments different kinds of users, this challenge can be overcome by either privatising terminals or by operating terminals in a non-discriminatory way. The latter brings with it an inherent role conflict because the port authority is not disconnected from the information that follows interaction, but it is

147
prevented from acting upon it unless it is certain that this is will not discriminate the affected actors.
9.1.3 The port (as) actor – a summary
In sum, ports are not permanent and continuous industrial actors; rather they are temporary and discrete actors. In the cases discussed in the earlier chapters, the port authorities act out three port dimensions to a varying extent. This is done in relation to a bundle of interdependent activities and combined resources imposed on them by interaction amongst industrial actors. Investments and changes in operators signify disruptions in the acting out of an administrative port dimension. However, port authorities typically revert to an administrative port dimension in order to avoid creating wedges in the further bundling taking place amongst industrial actors. If port authorities are operators, they tend to constrain themselves from acting out a commercial port dimension in order to avoid being scrutinised for discriminatory behaviour. In relation to large terminal investments where large volumes of goods are concerned, the outcome of constraining oneself from acting out a commercial dimension is that facilities are utilised less efficiently than might be the case. Therefore the costs of use are higher for shippers, ports, vessels and the community. The tendency over the last decades has been to privatise many of these investments. When privatisation does not occur, the access to information about the interaction that shapes the bundle opens a possibility for the port authority to wedge into the bundle as an actor. The traditions for doing so in ports are meagre, however. In principle at least, it would be possible to distribute information in a way that facilitated the mission and objectives of the port, and simultaneously visualised actors’ potential interdependencies and resource combinations that could result in further bundling on a non-discriminatory basis.
9.2 Implications for the Industrial Networks Approach
It goes without saying that the port authority is a type of public actor. As such, the INA is not designed to explain or rationalise some parts of the mandate and objectives of port authorities. What can be more fully assessed is the connection of such a public, non-business actor to an industrial network setting. In so doing, the INA can be used to rationalise the absence of business behaviour from a public actor by examining the interactions that take place between a port authority and its users.

148
The ARA model can be used as a tool for studying non-business actors from the perspective of that actor. This study has utilised pooling, combining and mobilising from the model as a way to assess the scope of the intervention possible by a port authority in an industrial context. Pooling, combining and mobilising can all be important for the developing and shifting of a port bundle. The extent and type of intervention possible is strongly impacted upon by the issue of discrimination through wedges. That is, particular interdependencies and resource combinations create tensions or problems at the relationship level when they are introduced as network-level substance features. The tension between the network and relationship levels posed by the issue of wedging also illustrates how the study of public, non-business actors connects to industrial actors without being present in all the substance/function layers of the ARA model. This is due to the different kinds of interaction taking place than is commonly studied within the INA. For example, there are instances of non-continuous interaction within the cases; interaction only occurring when investments are made, interaction being withdrawn due to fear of creating wedges or the reality of doing so, etc. Indeed, wedging is one way in which to consider how a non-business actor connects to an industrial network. In what other circumstances might these findings apply? It can be argued that the findings above can apply to situations in industrial networks whereby business actors have to organise for co-operation and competition simultaneously. This is particularly the case when a firm has a dual role, both as a business actor and as a provider of infrastructure-like facilities within the network. There are some similarities with a port authority when the Norwegian company Nortura is ordered by the authorities to allow competitors to use its existing processing facilities for chicken. This takes place in a certain region within Norway, and Nortura’s own use of the facilities is predicated on allowing other users equal access to it. The implication is that the company is not able to discriminate between users or cannot use the facility as a way to wedge between users. Deregulation provides another example. When an infrastructure provider such as Telenor or Posten is deregulated, wedges that were put in place are pulled out by the company. In other words, de-wedging took place when Telenor wished to build relationships around the commercial use of its physical distribution infrastructure for telecommunication. Further research could illuminate the network practices that embed and stabilise bundling and wedging in such circumstances.

149
When thinking in terms of the business actor, the notion of the interacting but non-actor organisation, one which does not have relationships or fulfil the interaction-relationship-network sequence is more problematic. This suggests that while a public actor may have constrains from its owners or mandate that result in it being connected to an industrial context without relationships, a business actor does not generally face the same constraints. The final sections of the chapter discuss two issues that are especially pertinent for Industrial Networks.
9.2.1 The importance and trouble with big users
One finding from the empirical material is that big users influence whether and when investments are made. One example is how Maersk’s use of the container terminal in Port of Gothenburg is vital to the use and efficiency of the terminal in general and the resources (cranes) in particular. However, when investments such as the three cranes are undertaken, the justification from the port authority is that it will affect the network of existing and potential user actors. In other words, the resources are introduced as a wedge into the network level of the bundle on a non-discriminatory basis (1). Nevertheless, it is unavoidable that users will benefit from their existing positions. Hence, the wedge rebounds from a network level to a relationship level (2 and 3). With its existing network position in place, Maersk will enjoy the possibility to further extend its relational interdependencies and resource combinations as an outcome of the wedge. It thus appears as if the investment/wedge has a relational basis, even though it is considered as being ‘open’ and indiscriminate to all users (see Figure 9-1 below).

150
Company/ Organisation Relationship Network
Actors Organisational structure
Actor Bonds
Web of Actors
Resources Resource Collection
Activities Activity structure
Figure 9-1: Wedges having a relational basis
The port authority at Gothenburg depends on a higher degree of utilisation than the once-a-week call from Maersk. Hence, there is a need to make the wedge rebound to a company level, with no relational connotation to the wedge. In other words, the wedge cannot be tantamount to a relationship between the big user and the port authority. Unless the wedge rebounds from a network level straight to the company level (i.e. the port authority), the relational level will not be avoided, and the investment will in practice be a discriminating wedge. This will reinforce ties and links between the port authority and Maersk even without there being any formal business relationship in place. This, in turn, represents an obstacle to further bundling on a network level. The difficulty of avoiding the relational level results in the withdrawal of the public actor from further interaction. This means that operations are left to an external, private operator. In the Gothenburg case, this is not considered as an option for various reasons. The result is that the port authority then seeks to expand the catchment area on a general basis. This is in order to attract the volumes of cargoes that would make it more interesting for other inter-continental services to call at Gothenburg. This is made difficult due to the actor being disconnected from interaction and the information that follows from this. One possible alternative is in the visualising of existing and potential interdependencies and combinations between current users. This could extend to include concrete potential users. It would require access to
1
23

151
information from existing users about their interaction. The dispersal of information throughout the network of users on a non-discriminatory (or discrete) basis would require proficiency and discretion in order for the port authority to be trusted amongst business actors.
9.2.2 The non-business actor in industrial networks
There are various reasons why entities such as ports and port authorities should be studied within an industrial network approach. This is hardly a new observation, but there are relatively few studies of how the non-business or public actor is connected within an industrial network. First, there are many organisations and institutions that impact on business actors. Some of them are large business-like organisations that perform activities and utilise resources in ways similar to that of any company, but happen to be publicly governed. For example, the postal service, educational institutions and railways, etc. Secondly, there are ‘ordinary’ companies that simultaneously have two roles; one is as a regulator of other companies with whom they are in direct competition. In particular in a Norwegian context, examples can be found in the agricultural industries (e.g. Tine, Nortura), defence-related industries and others that the government wishes to maintain some control over. In more general terms, whole political mechanisms have been built around features such as employment. This is typically as a way in which to carry basic business structures through periods of economic downturn. The New Deal and Marshall Plan clearly had a longstanding impact on business behaviour. These are not discrete actors in the same way as a port authority, but they do have a lasting impact that contributes to shape business structures and interaction over a long time period. Hence, they are not manifest as laws or regulations but are instead supported by them.
9.3 Suggestions for future research
In this thesis the ARA model has been used as a framework to characterize port authorities as actors in industrial contexts. It could be used to further study port authorities or other similar organisations that work in a business setting, but that have other explicit purposes from those traditionally associated with business, for example research universities. Moreover, I think all business/industrial actors may feature the three dimensions of the port authority to a greater or lesser extent. Companies certainly devote resources to perform activities that are predominantly

152
administrative or political in character, and that take place for administrative and political purposes rather than those that are strictly commercial. The approach used in this study may therefore also usefully apply to industrial actors that are typical objects of study for the INA. Companies such as Nortura, Tine and Telenor (three large Norwegian organisations) that act as market regulators are clearly relevant in this respect, but also companies that rely heavily on the state as their dominant customers. The latter would typically be relevant with regard to e.g. the defence and health industries. There may furthermore be scope to usefully address companies’ approaches to e.g. industry associations and corporate responsibility in a similar manner. In particular, I think that it would be a useful exercise to ask whether there are any dimensions of any object studied by use or reference to the ARA model that feature dimensions that differ substantially from those of its interactive contexts. If so, does the difference call for explicitly addressing the character of the vertical linkages between dimensions to extend the study of interaction by referring to the horizontal linkages between layers and levels in the ARA model?

153
References Airriess, C. A. 2001. The regionalization of Hutchinson Port Holdings in mainland China. Journal of Transport Geography, 9: 267-278. Alchian, A. A. and Demzets, H. 1972. Production, information cost, and economic organization. The American Economic Review, 62: 777-795. Amable, B. 1994. Endogenous growth theory, convergence and divergence. In: G. Silverberg, and L. Soete (Eds.), The economics of growth and technical change - technologies, nations, agents. Aldershot: Edward Elgar Publishing Limited. Andrews, J. H. 1956. Two problems in the interpretation of the Port Books. The Economic History Review, New Series, 9(1): 119-122. Araujo, L. and Easton, G. 1996. Networks in socioeconomic systems: A critical review. In: D. Iacobucci (Ed.), Networks in marketing. London: Sage Publications. Asplan, V. 2005. Konsekvensutredning for utvidelse, utdyping og utretting av Brevikstrømmen. Kystverket Sørøst. Baird, A. 1999. Analysis of private seaport development: The port of Felixstove. Transport Policy, 6: 109-122. Baraldi, E. 2003. The Places of IKEA: Using Space as a Strategic Weapon in Handling Resource Networks. Paper presented at the 19th IMP conference, Lugano, Switzerland. Barreto, L. F. 1998. Macau: An Intercultural Frontier in the Ming Period, In: Saraiva, L. (ed.). History of Mathematical Sciences: Portugal and East Asia II: Scientific Practices and the Portuguese Expansion in Asia (1498-1759), University of Macau, China, World Scientific: Singapore Bartzokas, A. and Teubal, M. 2002. A framework for policy oriented innovation studies in industrialising countries. Economics of Innovation and New Technology, 11 (4-5): 477-496. Bichou, K. and Gray, R. 2004. A logistics and supply chain management approach to port performance measurement. Maritime Policy Management, 31 (1): 47-67. Blois, K. J. 1971. Vertical Quasi-Integration, Journal of Industrial Economics, 20(3): 253-272. Britannica Student Encyclopedia. 2002. Search terms: 'harbour' and 'port'. Bygballe, L. E. and Elvekrok, I. 2003. Business relationship case - Borealis Rønningen and Tetra Pak Skoghall. Netlog case study. Oslo. Carbone, V. and De Martino, M. 2003. The changing role of ports in supply-chain management: an empirical analysis. Maritime Policy Management, 30(4): 305-320.

154
City of Gothenburg. 2003. Ägardirektiv för Göteborgs Hamn AB (owners directive for Port of Gothenburg AB), http://www.goteborg.se/prod/g-info/ffs.nsf/0/1cff71f71cd202aac1256d96003d7df0? Gothenburg. Clark, X. Dollar, D. and Micco, A. 2001. Maritime transport costs and port efficiency. Washington DC: World Bank. Clark, X. Dollar, D. and Micco, A. 2004. Port efficiency, maritime transport costs, and bilateral trade. Journal of Development Economics, 75: 417-450. Cole, A. H. 1960. A note on social overhead and a dynamic analysis of industry. The Quarterly Journal of Economics, 74 (3): 413-415. Coleman, J. S. 2000. Social capital in the creation of human capital. In: P. Dasgupta and I. Seragelding (Eds.), Social capital: A multifaceted perspective. Washington D.C: World Bank. Cornes, R. and Sandler, T. 1996. The theory of externalities, public goods, and club goods (2nd Ed.). New York: Cambridge University Press. COSCO. 2005a. Big News: Containerization International 2. COSCO. 2005b. COSCO Secured World's Largest Containership Orderbook. Cullinane K. and Song, D-W. 2002. Port privatization policy and practice. Transport Reviews, 22(1): 55-75. Day, R. H. 1994. Do economies diverge? In: G. Silverberg and L Soete (Eds.), The economics of growth and technical change - technologies, nations, agents. Aldershot: Edward Elgar Publishing Limited. de Langen, P. W. 2002. Clustering and performance: the case of maritime clustering in The Netherlands. Maritime Policy Management, 29(3): 209-221. de Langen, P.W. and Visser, E-J. 2004. Collective action regimes in seaport clusters: the case of the Lower Mississippi port cluster. Journal of Transport Geography,. Department of Environment. 2000. Modern Ports: A UK Policy. Doig, J. W. 1993. Expertise, politics, and technological change. Journal of the American Planning Association, 59(1). Dosi, G. 1988. The nature of the innovative process. In: G. Dosi, C. Freeman, R. Nelson, G. Silverberg and L. Soete (Eds.), Technical Change and Economic Theory. London: Pinter Publishers Ltd. Douglas, R. A. P. 1990. Port Administration: A review of the structural and legal aspects. Discussion paper, The World Bank: Policy Planning and External Affairs Infrastructure and Urban Development Department, Report INU 0076. The World Bank: Washington Drewry. 1999. North European Container Ports: A '$2 billion plus' industry adapts to change. London: Drewry Shipping Consultants LTD. Dubois, A. 1994. Organising Industrial Activities - an analytical framework. Doctoral Dissertation, Chalmers University of Technology, Göteborg.

155
Easton, G., and Araujo, L. 1997. Inter-Firm responses to heterogeneity of demand over time. In: M. Ebers (Ed.), The Formation of Inter-organizational Networks. Oxford: Oxford University Press. Easton, G. and Lundgren, A. 1992. Changes in industrial networks as flow through nodes. In: B. Axelsson and G. Easton (Eds.), Industrial Networks: A new view of reality. London: Routledge: 89-104. Economic and Social Commission for Asia and the Pacific. 2003a. Commercial development of regional ports as logistics centres. In: ESCAP/UNDP (Ed.). New York: UN. Economic and Social Commission for Asia and the Pacific. 2003b. Improvement of transport and logistics facilities to expand port hinterlands: Policy guidelines. In ESCAP/UNDP (Ed.). New York: UN. Encyclopædia Britannica Online. 2002. Search terms: 'Harbours' and 'sea works'. Engelseth, P. 2006a. Facility case - Global 2000 production line, TracefishUse project case study. Oslo. Engelseth, P. 2006b. Facility case - Global Fish ERP system, TracefishUse project case study. Oslo. Estache, A. 2001. Privatization and regulation of transport infrastructure in the 1990s. The World Bank Research Observer, 16 (1): 85-107. Estache, A. and de Rus, G. (Eds.). 2000. Privatization and regulation of transport infrastructure: Guidelines for policymakers and regulators. Washington D.C.: World Bank. EU Commission. 2006. Green paper: Towards a future maritime policy for the Union - A European vision for the oceans and seas. In: European Commission Collection. Brussels: European Union. Everett, S. 2005. Policy making and planning for the port sector: paradigms in conflict. Maritime Policy Management, 32(4): 347-362. Feldman, M. P. 1999. The new economics of innovation, spillovers and agglomeration: A review of empirical studies. Economics of Innovation and New Technology, 8: 5-25. Foray, D. and Teubal, M. 1999. The creation of industry-specific public goods: new insights into the technology policy debate. Paper presented at the International Symposium Towards Strategy for Israel. http://www.dauphine.fr/imri/Valorisation/WP2000/WP07.pdf. Ford, D., Berthon, P., Brown, S., Gadde, L-E., Håkansson, H., Naude, P., Ritter, T. and Snehota, I. (Eds.). 2002. The Business Marketing Course: Managing in Complex Networks. Chichester: John Wiley and Sons Ltd. Fujita, M. and Mori, T. 1996. The role of ports in the making of major cities: Self agglomeration and hub-effect. Journal of Development Economics, 49: 93-120. Gadde, L-E. 2003. Product case - PVC in Norsk Hydro, Netlog case study. Oslo.

156
Gordon, I. R. and McCann, P. 2000. Industrial clusters: Complexes, agglomeration and/or social networks. Urban Studies, 37(3): 513-520. Goss, R. O. 1990a. Economic policies and seaports 1: The economic functions of seaports. Maritime Policy and Management, 17(3): 207-219. Goss, R. O. 1990c. Economic policies and seaports 3: Are port authorities necessary. Maritime Policy and Management, 17(4): 257-271. Goss, R. O. 1992. Port privatization: the public interest. Department of Maritime Studies and International Transport at the University of Wales College of Cardiff, UK. Graham, S. and Marvin, S. 2001. Splintering urbanism: networked infrastructures, technological mobilities and the urban condition. London: Routledge. Gramlich, E. M. 1994. Infrastructure investment: A review essay. Journal of Economic Literature, 32(3): 1176-1196. Hadjikhani, A. and Sharma, D. D. 1999. A view on political and business actors. In: P. N. Ghauri (Ed.), Advances in International Marketing, Vol. 9. Stamford: JAI Press: 243-257. Halinen, A. and Törnroos, J. Å. 1998. The role of embeddedness in the evolution of business networks. Scandinavian Journal of Management, 14(3): 187-205. Hall, P. V. 2002. The institution of infrastructure and the development of port-regions. Unpublished PhD, University of California at Berkeley, Berkeley. Hall, P. V. 2004. 'We'd Have to Sink the Ships': Impact studies and the 2002 West Coast Port Lockout. Economic Development Quarterly, 18(4): 354-367. Hall, R. E. and Jones, C. I. 1999. Why do some countries produce so much more output per worker than others? The Quarterly Journal of Economics, 114(1): 83-116. Harrison, D. 2003a. Business relationship case - Global Fish and Tsujino, Netlog case study. Oslo. Harrison, D. 2003b. Facility case - Boa Vista, Netlog case study. Oslo. Harrison, D. and Håkansson, H. 2002. Resource Networks: A Comparative Case of Ports. Paper presented at the IMP Asia Conference, Perth. Hatteland, C.J. 1995. On the contribution of learning and knowledge to economic growth. Master thesis. Oslo: University of Oslo. Hatteland, C. J. 2005. Facility case - PM6 at Norske Skog Union, Netlog case study. Oslo. Hauknes, J. 1999. Technological infrastructures and innovation policies. Oslo: Step-Group. Heidenreich, R. 1998. Economics and Institutions: The Socioeconomic Approach of K. William Kapp. Journal of Economic Issues, 32 (4):
157
Hirschman, A. O. 1957. Investment policies and "dualism" in underdeveloped countries. The American Economic Review, 47(5): 550-570. Hirschman, A. O. 1958. The Strategy of Economic Development. New Haven: Yale University Press. Hoare, A. G. 1986. British ports and their export hinterlands: a rapidly changing geography. Geografiska Annaler, Series B, Human Geography, 68(1): 29-40. Holland, T. 2003. Rubicon: The triumph and tragedy of the Roman republic. London: Abacus. Howe, F. A. 1912. The sensitiveness of the modern seaport. The Economic Journal, 22(87): 410-420. Huybrechts, M., Meersman, H., van De Voorde, E., van Hooydonk, E., Verbeke, A. and Winkelmans, W. (Eds.). 2002. Port competitiveness: An economic and legal analysis of the factors determining the competitiveness of seaports. Antwerp: Editions De Boeck Ltd. Hyundai Heavy Industries. 2005. HHI Received the Order for the World's Largest Containership, Press Release. Håkansson, H. (Ed.). 1982. International Marketing and Purchasing of Industrial Goods: An Interaction Approach. Chichester: John Wiley and Sons Ltd. Håkansson, H. (Ed.). 1987. Industrial Technological Development: A Network Approach. London: Croom Helm. Håkansson, H. and Snehota, I. 1990. No Business is an Island: the Network Concept of Business Strategy. Scandinavian Journal of Management, 4(3): 187-200. Håkansson, H., and Snehota, I. (Eds.). 1995. Developing Relationships in Business Networks. London: Routledge. Håkansson, H., Tunisini, A. and Waluszewski, A. 2002a. Place as a Resource in Business Networks. Paper presented at the 18th IMP Conference, Dijon.. Håkansson, H. and Waluszewski, A. 2002b. Managing Technological Development: IKEA, the environment and technology. London: Routledge. Jahre, M., Gadde, L-E., Håkansson, H., Harrison, D. and Persson, G. (Eds.). 2006. Resourcing in Business Logistics: The art of systematic combining. Stockholm: Liber and Copenhagen Business School Press. Jahre, M. and Håkansson, H. 2003. Facility case - Havstrand AS a factory trawler, Netlog case study. Oslo. Jarvis, R. C. 1959. The appointment of ports. The Economic History Review, New Series, 11(3): 455-466. Jones, C. I. 1998. Introduction to Economic Growth. New York: W. W. Norton and Company, Inc. Justman, M. 1995. Infrastructure, Growth and the Two Dimensions of Industrial Policy. The Review of Economic Studies, 62(1): 131-157.

158
Justman, M. and Teubal, M. 1995. Technological infrastructure policy (TIP): creating capabilities and building markets. Research Policy, 24: 259-281. Karmsund Havn IKS. 2002. Havneplan (Port plan). Haugesund: Karmsund Interkommunale Havnevesen. Kessides, C. 1993. Institutional options for the provision of infrastructure, World Bank Discussion Papers. Washington D.C.: World Bank. Konvitz, J. W. 1994. The crisis of Atlantic port cities 1880-1920. Comparative Studies in Society and History, 36(2): 293-318. Krauss, C., Myers, S.L., Revkin, A. and Romero, S. 2008. As Polar Ice Turns to Water, Dreams of Treasure Abound, New York Times, 10th October. Krugman, P. 1991. Increasing Returns and Economic Geography. The Journal of Political Economy, 99(3): 483-499. kystverket.no. http://www.kystverket.no/arch/_img/9497975.pdf, Main ports in the stamnett Laine, J. T. and Vepsalainen, A. P. J. 1994. Economies of speed in sea transportation. International Journal of Physical Distribution and Logistics Management, 24(8): 33-41. Lee, T-W., Park, M-K. and Lee, D-W. 2003. A simulation study for the logistics planning of a container terminal in view of SCM. Maritime Policy and Management, 30(3): 243-254. Liebowitz, S. J. and Margolis, S. E. 1994. Network externality: An uncommon tragedy. Journal of Economic Perspectives, 8(2): 133-150. Lloyd's Register. 2005a Market sector: Leading the way in developing the optimum ultra large container ship. Lloyd's Register. 2005b. Press release February 21, 2005 LR/03/05: Lloyd’s Register to class world’s first 10,000 TEU container ships. Malchow, M. B. and Kanafani, A. 2004. A disaggregate analysis of port selection. Transportation Research Part E, 40: 317-337. Manshanden, W. J. J., Rutten, P. W. M. and Kuipers, B. 2005. Brainport: The creative mainport? Is the creative industry-concept a logical step towards the development of the brainport-concept? Paper presented at the 22nd IMP Conference, Rotterdam. McCalla, R .J. 1999. Global change, local pain: intermodal seaport terminals and their service areas. Journal of Transport Geography, 7: 247-254. Ministry of Fisheries. 2002. Ny havne og farvannslovgivning (New Port and Seaways Legislation), Havnelovutvalgets utredning (Report of Committee for revision of the Port and Seaways Act). Oslo: Norwegian Ministry of Fisheries. Moe, R. C. 1987. Exploring the limits of privatization. Public Administration Review, 47: 453-460. Munnell, A. H. 1992. Policy watch: Infrastructure investment and economic growth. The Journal of Economic Perspectives, 6(4): 189-198.
159
North, D. C. 1977. Markets and other allocation systems in history. The Journal of European Economic History, 6(3): 703-716. Norwegian Ministry of Fisheries. 1996-97. Havner og infrastruktur for sjøtransport. Stortingsmelding nr. 46. Oslo: Norwegian Ministry of Fisheries. Norwegian Ministry of Fisheries. 2002. Ny havne- og farvannslovgivning, Havnelovutvalget. Oslo: Norwegian Ministry of Fisheries. Notteboom, T. E. and Rodrigue, J.-P. 2005. Port regionalization: Towards a new phase in port development, Maritime Policy and Management. Notteboom, T. E. and Winkelmans, W. 2001. Structural changes in logistics: how will port authorities face the challenge. Maritime Policy Management, 28: 71-89. Notteboom, T. E., and Winkelmans, W. 2004. Factual report on the European port sector. Brussels: European Sea Ports Organisation (ESPO). Olsen, N. V. 2003. Product Case - The West Fish Saithe Block, Netlog case study. Oslo. Ottaviano, G. I. P. and Puga, D. 1998. Agglomeration in the global economy: A survey of the `new economic geography'. World Economy, 21(6): 707-715. Oxford University Press. 1985. Oxford Student's Dictionary of Current English. Oxford. Paik, S-K. and Bagchi, P. K. 2000. Process reengineering in port operations: A case study. The International Journal of Logistics Management, 11(2): 59-72. Paixao, A. C. and Marlow, P. B. 2003. Fourth generation ports - a question of agility? International Journal of Physical Distribution and Logistics Management, 33(4): 355-376. Patton, D. 1957. Some recent literature on ports. Annals of the Association of American Geographers, 47(2): 193-195. Payer, H. G. 2002. Economic and technical aspects of mega-container carriers. Paper presented at the IAME conference, Panama. Peeters, C., Hendrickx, F., Kneepkens, H. and Bruynseels, S. 1999. Executive summary, In: P. R. C.N.V. (Ed.), The Dutch seaport sector. Delft: Delft University Press. Penguin. 2002. The Penguin English Dictionary. London: Penguin Books. Penrose, E. 1959. The Theory of the Growth of the Firm. Oxford: Blackwell. Polanyi, K. 1963. Port of trade in early societies. The Journal of Economic History, 23(1): 30-45. Port of Göteborg AB. 2004. Port of Göteborg to buy super-postpanamax container cranes, PortGotNews. Port of Göteborg AB. 2005a. Port of Göteborg AB 2004 annual report: increase in total sales and profits, PortGotNews, 2005/3.

160
Port of Göteborg AB. 2005b. Three super post-panamax container cranes ordered for Port of Göteborg. PortGotNews, 2005/8. Richards, E. S. 1973. Structural change in a regional economy: Sutherland and the industrial revolution: 1780-1830. The Economic History Review, 26(1): 63-76. Robinson, R. 2002. Ports as elements in value-driven chain systems: the new paradigm. Maritime Policy Management, 29(3): 241-255. Romer, P. M. and Griliches, Z. 1993. Implementing a national technology strategy with self-organizing industry investment boards (comments by Zvi Griliches). Brookings Papers on Economic Activity, Microeconomis, 2: 345-399. Samuelson, P. A. and Nordhaus, W. D. 2001. Macroeconomics (17th Ed.). New York: McGraw-Hill. Serageldin, I. and Grootaert, C. 1998. Part 3 Institutional Development and Social Capital 10: Defining social capital: an integrating view. Evaluation and Development: The Institutional Dimension - World Bank on Evaluation and Development, World Bank: Washington D.C. Slack, B. 1993. Pawns in the game: Ports in a global transportation system. Growth and Change, 24(Fall): 579-588. Smith, K. 1997. Economic infrastructures and innovation systems. In: C. Edquist (Ed.), Systems of Innovation - Technologies, institutions and organizations. London: Pinter. Snehota, I. 1990. Notes on a Theory of Business Enterprise. Doctoral Dissertation, Uppsala University, Uppsala. Song, D-W. 2003. Port co-opetition in concept and practice. Maritime Policy Management, 30(1): 29-44. SSB. 2002. Fiskeristatistikk 2002-2003. Steenken, D., Voss, S. and Stahlbock, R. 2004. Container terminal operation and operation research - a classification and literature review. OR Spectrum, 26: 3-49. Styhre, L. 2005. Towards improved port performance in intermodal transportation. Thesis for the degree of Licentiate of Engineering. Report 60. Division of Logistics and Transportation. Chalmers University of Technology. Gothenburg. Sundaeus, P. 2002. Granskning av investeringsrutinen hos Göteborgs Hamn AB. ÖhrlingsPricewaterhouseCoopers AB. Teubal, M. and Andersen, E. 2000. Enterprise restructuring and embeddedness: A policy and systems perspective. Industrial and Corporate Change, 9(1): 87-111. Teubal, M., Foray, D., Justman, M. and Zuscovitch, E. (Eds.). 1996. Technological Infrastructure Policy: An international perspective. Dordrecht: Kluwer. The Baltic Magazine. 2001. Heavyweight Boxing, Special supplement 2001, World Ports.

161
Todd, D. 1993. The interplay of trade, regional and technical factors in the evolution of a port system: The case of Taiwan. Geografiska Annaler, Series B, Human Geography, 75(1): 3-18. Tovar, B., Trujillo, L. and Jara-Diaz, S. 2004. Organization and regulation of the port industry: Europe and Spain. In: P. Coto-Millán (Ed.), Essays on Microeconomics and Industrial Organization, (2nd Ed). Heidelberg: Springer-Verlag: 189-207. Trujillo, L. and Nombela, G. 1999. Privatization and Regulation of the Seaport Industry. Washington DC: World Bank. Trujillo, L. and Nombela, G. 2000. Seaports. In: A. Estache, and G. de Rus (Eds.), Privatization and regulation of transport infrastructure: Guidelines for policymakers and regulators. Washington D.C.: World Bank. Twedberg, J. 2002. Miljardvision med miljön i fokus (milliard vision with environmental focus), Vårt Göteborg. Gothenburg. Taaffe, E. J., Morill, R. L. and Gould, P. R. 1963. Transport expansion in underdeveloped countries: A comparative analysis. Geographical Review, 53(4): 503-529. UNCTAD. 2004. Assessment of a seaport land interface: an analytical framework. Report by the UNCTAD secretariat, 31 December. UNCTAD/SDTE/TLB/MISC/2004/3 van Cleef, E. 1945. East Baltic ports and boundaries: with special reference to Konigsberg. Geographical Review, 35(2): 257-272. van Ham, J. C. and Koppenjan, J. F. M. 2001. Investment in Infrastructure: The Role of Public and Private Parties in Port Projects. Paper presented at the 5th International Conference on Technology, Policy and Innovation, Delft, Netherland. van Houtte, J. A. 1966. The rise and decline or the market of Bruges. The Economic History Review, New Series, 19(1): 29-47. van Klink, H. A. 1998. The port network as a new stage in port development: the case of Rotterdam. Environment and Planning, 30(A): 143-160. van Klink, H. A. and van den Berg, G. C. 1998. Gateways and inter-modalism. Journal of Transport Geography, 6(1): 1-9. Villiers, J. 1980. Silk and silver: Macau, Manila and trade in the China Seas in the sixteenth century. Lecture delivered to the Hong Kong Branch of the Royal Asiatic Society at the Hong Kong Club, 10 June. Journal of the Hong-Kong Branch and the Royal Asiatic Society Hong-Kong, 20: 66-80 Vis, I. F. A. and de Koster, R. 2003. Trans-shipment of containers at a container terminal: An overview. European Journal of Operational Research, 147: 1-16. Wang, J. J., Ng, A. K.-N. and Olivier, D. 2004. Port governance in China: a review of policies in an era of internationalizing port management practices. Transport Policy, 11: 237-250.

162
Weigend, G. G. 1956. The problem of hinterland and foreland as illustrated by the port of Hamburg. Economic Geography, 32(1): 1-16. Weigend, G. G. 1958. Some elements in the study of port geography. Geographical Review, 48(2): 185-200. Weiss, A. R. and Birnbaum, P. H. 1989. Technological infrastructure and the implementation of technological strategies. Management Science, 35(8): 1014-1026. Welch, C. and Wilkinson, I. F. 2004. The political embeddedness of international business networks. International Marketing Review, 21(2): 216-231. WHKLMA 2005. Sweden 1617-1660. In KLMA (Ed.), World History at KMLA. World Bank. 1994. World development report 1994: Infrastructure for development. New York: Oxford University Press for The International Bank for Reconstruction and Development. World Bank. 2001. Port reform tool kit. Washington DC: World Bank. WorldCargo News. 2000. Gothenburg plots ambitious course, 26. Ålesund Port. 2003. Vedtekter for Ålesund Havn KF (Ordinance for Ålesund Port), 92/2003, ratified by Ålesund City Council 02.10.2003. Ålesund: Ålesund Municipality.

163
Appendices
Sources/interviews
Due to a burglary in December 2007, where my computer and some backups and transcripts were stolen, some dates and also some names for interviews conducted for this thesis, is missing or incomplete. I can only apologize for this.
Aalesund Port
Interview with Birger Flem (Harbour Master) and Tor Knutsen (Office Manager), March, 2003 Ålesund Havn, Statistikk, 2001 Port statistics, Port charter Ålesund Port. 2003. Vedtekter for Ålesund Havn KF (Ordinance for Ålesund Port), 92/2003, ratified by Ålesund City Council 02.10.2003. Ålesund: Ålesund Municipality. http://www.alesund.havn.no/forside.asp?level=987&lang=0, Ålesundregionens Havnevesen, Strategisk Havneplan, Høringsutkast, 2006 Netlog cases: A product case: Fish oil. Written by Lena E. Bygballe A facility case: Havstrand AS – a factory trawler. Written by Marianne Jahre and Håkan Håkansson A facility case: West Fish Aalesund plant. Written by Lars Erik Gadde A facility case: Production line for trout. Written by Marianne Jahre and Håkan Håkansson A product case: Bacalao to the Portuguese market. Written by Ann Karin Refsland Fougner and Lena E. Bygballe A business unit case: Waagan transport Aalesund. Written by Per Engelseth A facility case: The Skutvika container terminal. Written by Andreas Brekke A facility case: the Kloosterboer cold-storage warehouse. Written by Per Engelseth A business relationship case: Global Fish and Tsujino. Written by Debbie Harrison

164
Karmsund Port
Geir Toskedal, Chairman of board of Karmsund Port IKS, telephone interview, 290605. Telephone interview with Inger Moen Einarsen, Norsk Hydro, Karmøy/Håvik, 290905. Karmsund Havn IKS. 2002. Havneplan. Haugesund: Karmsund Interkommunale Havnevesen. (Port plan 2002: http://www.karmsund-havn.no/khframe-filer/plan_karmsund_havn.pdf, accessed 240805). Asplan Viak. 2001. Regional sjømatproduksjon på Haugalandet (Regional seafood production at Haugalandet). Final report. Stavanger: Haugalandrådet. Annual reports, various printed news articles, presentations.
Grenland Port
Grenland Havn IKS. Strategisk Plan. Porsgrunn/Brevik: Vekst i Grenland/Grenland Havnevesen. Annual reports, various printed news articles. Netlog cases: A facility case: PM6 at Norske Skog Union. Written by Carl J. Hatteland A business relationship case: Borealis Rønningen and Tetra Pak Skoghall. Written by Lena E. Bygballe and Ingunn Elvekrok A product case: PVC in Norsk Hydro. Written by Lars Erik Gadde A business unit case: Grenland Port Authority. Written by Debbie Harrison A facility case: Boa Vista. Written by Debbie Harrison

165
Gothenburg Port
Interviews with Anders Johansson, Sales and Marketing, Port of Gothenburg, May 2004. In one of the interviews Anders Johansson was accompanied by a port official that had special competence about the cranes. Interview with captain of a DFDS vessel berthed at the Ro-Ro terminal. Interview with Per Jessing, Secretary General, The Institute of Shipping Analysis, Gothenburg, May 2004. Annual reports, external reports, various printed news articles, various issues of Port of Gothenburg newsletter - PortGotNews.

166
The outline used for all four types of NETLOG cases
A FACILITY CASE
0) Background In most cases it is necessary to give some background to the case – to place the facility and its situation in its general context, for example in terms of ownership etc. 1) Description of the focal resource - the facility Describe the main features of the facility. The space is limited so the description must focus on the most important characteristics of the facility as a logistics resource. In the previous version the following dimensions were suggested - investment/capacity - complexity - integration - set up time These are examples. They might not be the most relevant dimensions in all cases. Add other dimensions in accordance with the characteristics of the specific facility. 2) Interfaces with resources of the same type – the facility vs other
facilities Describe in which way the facility is related to other facilities. In the previous version there were no dimensions suggested for this analysis. This analysis takes its point-of-departure in the dimensions discussed in 1) above. The central issue to cover concerns how the facility is linked to other facilities, for example in terms of: - activity links - technical connections - adaptations - capacity balance Again, these are suggested dimensions.

167
3) Interfaces with other resources The space available is limited and we need to be selective. For each of the three types of interfaces start the description by briefly indicating how many connections that are really important; from one or a few to many. Then describe a limited number of these important interfaces. Once we suggested no more than three, but depending on the situation four or five might occasionally be necessary. a) Facility vs Products This description includes the interfaces of the facility with: - the products that are important for the facility - the products for which the facility is important Try to describe the interfaces both in qualitative and quantitative terms. For example: - the share of the capacity of the facility that the product makes use of - the contribution of the facility to the value of the end-product - how much, and in which ways, is the product marked by the facility - how much, and in which ways, is the facility marked by the product b) Facility vs Business units This description includes the interfaces of the facility with: - the business units that are important for the facility and - the business units for which the facility is important. Try to describe the interfaces both in qualitative and quantitative terms. For example: - the share of the capacity of the facility that the business unit makes use of - the share of the turnover for the business unit that the facility accounts for - how much, and in which ways, is the business unit marked by the facility - how much, and in which ways, is the facility marked by the business unit c) Facility vs Business relationship This description includes the interfaces of the facility with: - the business relationships that are important for the facility - the business relationships for which the facility is important.
168
Try to describe the interfaces both in qualitative and quantitative terms. For example: - the share of the capacity of the facility that the business relationship makes use of - the facilities share of the business relationship (difficult to estimate – try) - how much, and in which ways is the business relationship marked by the facility - how much, and in which ways is the facility marked by the business relationship 4) Concluding remarks In this section we bring up the most important things from the analysis in 1-3 – short. Furthermore, we need to come back to one issue that we seem to have lost on the way. When we started the project we talked about ‘contradictions’ in the usage of resources – i.e. the ‘best’ development of each of the four resource elements discussed seldom follow the same track, which imposes problems when resource combinations are to be changed. In some of the cases we have talked about including a discussion of ‘potential’ interfaces. Irrespective of whether this is done or not we think this final section should include a short discussion of the dynamics of resource combining, for example developing one of the resources in one way might prohibit the development of another. Maybe, ‘tensions’ is a better word for it. The need for this discussion of tensions is most important in cases that primarily are described in structural terms. Some cases are more problem-oriented and then these tensions are included in the case description.

169
A PRODUCT CASE 0) Background In most cases it is necessary to give some background to the case – to place the product and its situation in its general context, for example in which applications it is used. 1) Description of the focal resource - the product Describe the main features of the product. The space is limited so the description must focus on the most important characteristics of the product as a logistics resource. In the previous version the following dimensions were suggested - price, price variation over time - design/technical features - standardization/adaptations These are examples. They might not be the most relevant dimensions in all cases. Add other dimensions in accordance with the characteristics of the specific product. 2) Interfaces with resources of the same type – the product vs other
products Describe in which way the product is related to other products. In the previous version there were no dimensions suggested for this analysis. This analysis takes its point-of-departure in the dimensions discussed in 1) above. The central issue to cover concerns how the product is linked to other products, for example in terms of: - technical connections - adaptations - used by the same customer - delivered by the same supplier Again these are suggested dimensions. 3) Interfaces with other resources The space available is limited and we need to be selective. For each of the three types of interfaces start the description by briefly indicating how
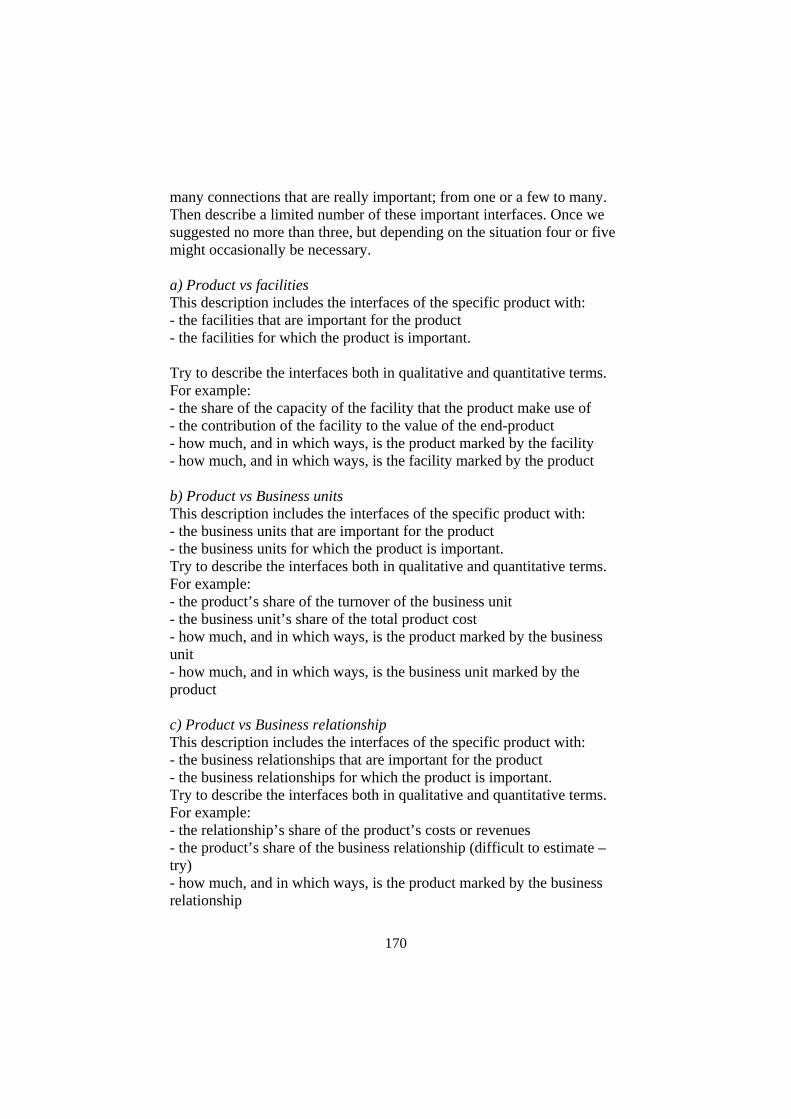
170
many connections that are really important; from one or a few to many. Then describe a limited number of these important interfaces. Once we suggested no more than three, but depending on the situation four or five might occasionally be necessary. a) Product vs facilities This description includes the interfaces of the specific product with: - the facilities that are important for the product - the facilities for which the product is important. Try to describe the interfaces both in qualitative and quantitative terms. For example: - the share of the capacity of the facility that the product make use of - the contribution of the facility to the value of the end-product - how much, and in which ways, is the product marked by the facility - how much, and in which ways, is the facility marked by the product b) Product vs Business units This description includes the interfaces of the specific product with: - the business units that are important for the product - the business units for which the product is important. Try to describe the interfaces both in qualitative and quantitative terms. For example: - the product’s share of the turnover of the business unit - the business unit’s share of the total product cost - how much, and in which ways, is the product marked by the business unit - how much, and in which ways, is the business unit marked by the product c) Product vs Business relationship This description includes the interfaces of the specific product with: - the business relationships that are important for the product - the business relationships for which the product is important. Try to describe the interfaces both in qualitative and quantitative terms. For example: - the relationship’s share of the product’s costs or revenues - the product’s share of the business relationship (difficult to estimate – try) - how much, and in which ways, is the product marked by the business relationship

171
- how much, and in which ways, is the business relationship marked by the product 4) Concluding remarks In this section we bring up the most important things from the analysis in 1-3 – short. Furthermore, we need to come back to one issue that we seem to have lost on the way. When we started the project we talked about ‘contradictions’ in the usage of resources – i.e. the ‘best’ development of each of the four resource elements discussed seldom follow the same track, which imposes problems when resource combinations are to be changed. In some of the cases we have talked about including a discussion of ‘potential’ interfaces. Irrespective of whether this is done or not we think this final section should include a short discussion of the dynamics of resource combining, for example developing one of the resources in one way might prohibit the development of another. Maybe, ‘tensions’ is a better word for it. The need for this discussion of tensions is most important in cases that primarily are described in structural terms. Some cases are more problem-oriented and then these tensions are included in the case description.

172
A BUSINESS UNIT CASE 0) Background In most cases it is necessary to give some background to the case – to place the business unit and its situation in its general context. 1) Description of the focal resource - the business unit Describe the main features of the business unit. The space is limited so the description must focus on the most important characteristics of the business unit as a logistics resource. In the previous version the following dimensions were suggested - strategy - competence - experience - size These are examples. They might not be the most relevant dimensions in all cases. Add other dimensions in accordance with the characteristics of the specific business unit. 2) Interfaces with resources of the same type – the business unit vs
other business units Describe in which way the business unit is related to other business units. In the previous version there were no dimensions suggested for this analysis. This analysis takes its point-of-departure in the dimensions discussed in 1) above. The central issue to cover concerns how the business unit is linked to other business units, for example in terms of: - business exchange - technical interaction and learning - connections to other business units - common ownership Again these are suggested dimensions. 3) Interfaces with other resources The space available is limited and we need to be selective. For each of the three types of interfaces start the description by briefly indicating how

173
many connections that are really important; from one or a few to many. Then describe a limited number of these important interfaces. Once we suggested no more than three for each type of resource, but depending on the situation four or five might occasionally be necessary. a) Business unit vs Facilities This description includes the interfaces of the specific business unit with: - the facilities that are important for the business unit - the facilities for which the business unit is important. Try to describe the interfaces both in qualitative and quantitative terms. For example: - the share of the capacity of the facility that the business unit make use of - the facility’s share of the business unit (difficult to estimate – try) - how much, and in which ways, is the business unit marked by the facility - how much, and in which ways, is the facility marked by the business unit b) Business unit vs Products This description includes the interfaces of the specific business unit with: - the products that are important for the business unit - the products for which the business unit is important. Try to describe the interfaces both in qualitative and quantitative terms. For example: - the product’s share of the turnover of the business unit - the business unit’s share of the total product cost - how much, and in which ways, is the product marked by the business unit - how much, and in which ways, is the business unit marked by the product c) Business unit vs Business Relationships This description includes the interfaces of the business unit with: - the business relationships that are important for the business unit - the business relationships for which the business unit is important. Try to describe the interfaces both in qualitative and quantitative terms. For example: - the business unit’s share of the relationship (100% for dyadic partners) - the relationship’s share of the business unit’s total turnover (difficult to estimate – try)

174
- how much, and in which ways, is the business unit marked by the business relationship - how much, and in which ways, is the business relationship marked by the business unit 4) Concluding remarks In this section we bring up the most important things from the analysis in 1-3 – short. Furthermore, we need to come back to one issue that we seem to have lost on the way. When we started the project we talked about ‘contradictions’ in the usage of resources – i.e. the ‘best’ development of each of the four resource elements discussed seldom follow the same track, which imposes problems when resource combinations are to be changed. In some of the cases we have talked about including a discussion of ‘potential’ interfaces. Irrespective of whether this is done or not we think this final section should include a short discussion of the dynamics of resource combining, for example developing one of the resources in one way might prohibit the development of another. Maybe, ‘tensions’ is a better word for it. The need for this discussion of tensions is most important in cases that primarily are described in structural terms. Some cases are more problem-oriented and then these tensions are included in the case description.
175
A BUSINESS RELATIONSHIP CASE 0) Background In most cases it is necessary to give some background to the case – to place the business relationship and its situation in its context, e.g. something about the firms in the dyad 1) Description of the focal resource - the business relationships Describe the main features of the business relationships. The space is limited so the description must focus on the most important characteristics of the business relationship as a logistics resource. In the previous version the following dimensions were suggested: - volume - time, history - frequency - number and type of persons involved - contract - matching of plans These are examples. They might not be the most relevant dimensions in all cases. Add other dimensions in accordance with the characteristics of the specific relationship. 2) Interfaces with resources of the same type – relationship vs other
relationships Describe in which way the business relationship is related to other business relationships. In the previous version there were no dimensions suggested for this analysis. This analysis takes its point-of-departure in the dimensions discussed in 1) above. The central issue to cover concerns how the business relationship is linked to other business relationships, for example in terms of: - interdependencies - communality of actors - connections to other relationships - joint actions Again these are suggested dimensions.

176
3) Interfaces with other resources The space available is limited and we need to be selective. For each of the three types of interfaces start the description by briefly indicating how many connections that are really important; from one or a few to many. Then describe a limited number of these important interfaces. Once we suggested no more than three for each type of resource, but depending on the situation four or five might occasionally be necessary. a) Business relationship vs Facilities This description includes the interfaces of the specific business unit with: - the facilities that are important for the business relationship - the facilities for which the business relationship is important Try to describe the interfaces both in qualitative and quantitative terms. For example: - the share of the capacity of the facility that the business relationships make use of - the facility’s share of the business relationship (difficult to estimate – try) - how much, and in which ways is the business relationship marked by the facility - how much, and in which ways is the facility marked by the business relationship b) Business relationship vs Products This description includes the interfaces of the specific business relationship with: - the products that are important for the business relationships - the products for which the business relationship is important. Try to describe the interfaces both in qualitative and quantitative terms. For example: - the relationship’s share of the product’s costs or revenues - the product’s share of the business relationship (difficult to estimate – try) - how much, and in which ways, is the product marked by the business relationship - how much, and in which ways, is the business relationship marked by the product c) Business relationship vs Business unit This description includes the interfaces of the business relationship with:

177
- the business units that are important for the business relationship - the business units for which the business relationship is important. Try to describe the interfaces both in qualitative and quantitative terms. For example: - the business unit’s share of the relationship (100% for dyadic partners) - the relationship’s share of the business unit’s total turnover (difficult to estimate – try) - how much, and in which ways, is the business unit marked by the business relationship - how much, and in which ways, is the business relationship marked by the business unit 4) Concluding remarks In this section we bring up the most important things from the analysis in 1-3 – short. Furthermore, we need to come back to one issue that we seem to have lost on the way. When we started the project we talked about ‘contradictions’ in the usage of resources – i.e. the ‘best’ development of each of the four resource elements discussed seldom follow the same track, which imposes problems when resource combinations are to be changed. In some of the cases we have talked about including a discussion of ‘potential’ interfaces. Irrespective of whether this is done or not we think this final section should include a short discussion of the dynamics of resource combining, for example developing one of the resources in one way might prohibit the development of another. Maybe, ‘tensions’ is a better word for it. The need for this discussion of tensions is most important in cases that primarily are described in structural terms. Some cases are more problem-oriented and then these tensions are included in the case description.

178
Example of NETLOG case in Aalesund FACILITY CASE – WEST FISH ÅLESUND PLANT Team: Ingunn, Svanhild, Kjersti, Nina, Lars-Erik Written by: Lars Erik BACKGROUND Westfish Aarsaether AS is a Norwegian supplier of fish. The company has a long and exciting history ever since its establishment in 1877. It was substantially restructured in the 1990s when the focus of the business changed from trading to industrial operations. West Fish now is involved in the whole fish supply process: catch, production and sales. The company headquarter is located in Ålesund. The main product groups are frozen white fish (cod, haddock, saithe, etc) in various forms (fillets and blocks), salt fish, klipfish (salted and dried), frozen pelagic fish (herring and mackerel), a wide range of products for the retail market (both own and private brands), and fresh fish. West Fish owns six trawlers and is supplied also by other fishing companies. West Fish operates three shore-based processing plants located close to the rich fisheries in the Barents Sea and the North Sea. Two of them are situated in Finnmark in the far north while the third is located in Ålesund. This case is about the production facility in Ålesund. DESCRIPTION OF THE ÅLESUND FACILITY The production facility in Ålesund is used for the processing of the following types of fish: • Klipfish (Fish that is first salted and then dried) • Frozen pelagic fish (herring and mackerel) • Frozen fish packaged for the retail market • Fresh fish The capacity of the facility is about 10 000 portions of fillet, 14 000 tons of pelagic fish, 2000 tons of klipfish, and around 3 000 tons of frozen fish for the retail market. Fresh fish is not yet a voluminous product for West Fish. However, it is expanding and predicted to be important for the future. There are several production units within the facility. Below we discuss the processing of frozen fish for the retail market, the pelagic fish and the klipfish.

179
Processing for the retail market The Ålesund facility makes use of two production lines for its processing for the retail market. One of them is used for processing of fish in bags for example, salmon steaks, bacalao, soup-dish cubes etc. The processing of salmon cutlets is illustrated in the flowchart below. The bags contains 2-4 cutlets together weighing 450g.
The other production line one is used for processing of fish products in boxes, such as fillets of cod, saithe etc and functions in the following way:
In the three cutting operations the fish blocks can get various shapes owing to the actual adjusting of the saws. As a complement to the flowchart it can be mentioned that there are also three manual packaging lines and one line for bulk packaging. It is important that the process throughput time is minimised to secure the quality of the products. In some cases it is limited to half an hour, while in some operations the process takes 2 hours. Processing of herring and mackerel Pelagic fishes tend to assemble in shoals, which makes it possible to ‘pump’ them into the boat where they are kept in saltwater at a temperature of – 2 degrees. When the boat arrives at the facility the temperature normally is – 0.5. The fish is pumped up in the ceiling of the processing building and then put on a conveyor belt where it is weighed. Further on the belt the fish is sorted automatically through different trellis – the smallest fishes fall down on the first packaging line while the bigger continues on the conveyor belt to larger and larger trellis. In total there are seven different packing lines. The fish is packed in boxes of corrugated paper coming on another conveyor belt. The insides of the boxes are covered with a plastic ‘apron’ to protect the box from water. Each box is filled with 20.8 kg to compensate for the water (the fish is sold in 20 kg packages). The fish is then frozen as it is – without any
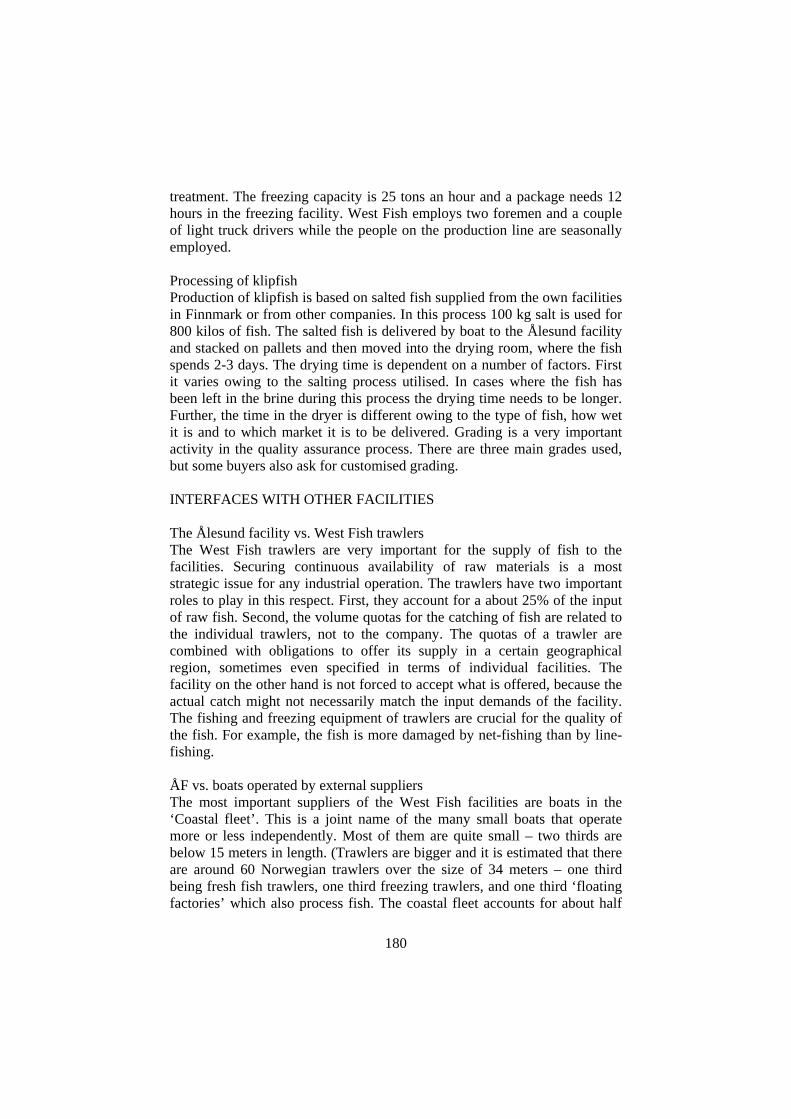
180
treatment. The freezing capacity is 25 tons an hour and a package needs 12 hours in the freezing facility. West Fish employs two foremen and a couple of light truck drivers while the people on the production line are seasonally employed. Processing of klipfish Production of klipfish is based on salted fish supplied from the own facilities in Finnmark or from other companies. In this process 100 kg salt is used for 800 kilos of fish. The salted fish is delivered by boat to the Ålesund facility and stacked on pallets and then moved into the drying room, where the fish spends 2-3 days. The drying time is dependent on a number of factors. First it varies owing to the salting process utilised. In cases where the fish has been left in the brine during this process the drying time needs to be longer. Further, the time in the dryer is different owing to the type of fish, how wet it is and to which market it is to be delivered. Grading is a very important activity in the quality assurance process. There are three main grades used, but some buyers also ask for customised grading. INTERFACES WITH OTHER FACILITIES The Ålesund facility vs. West Fish trawlers The West Fish trawlers are very important for the supply of fish to the facilities. Securing continuous availability of raw materials is a most strategic issue for any industrial operation. The trawlers have two important roles to play in this respect. First, they account for a about 25% of the input of raw fish. Second, the volume quotas for the catching of fish are related to the individual trawlers, not to the company. The quotas of a trawler are combined with obligations to offer its supply in a certain geographical region, sometimes even specified in terms of individual facilities. The facility on the other hand is not forced to accept what is offered, because the actual catch might not necessarily match the input demands of the facility. The fishing and freezing equipment of trawlers are crucial for the quality of the fish. For example, the fish is more damaged by net-fishing than by line-fishing. ÅF vs. boats operated by external suppliers The most important suppliers of the West Fish facilities are boats in the ‘Coastal fleet’. This is a joint name of the many small boats that operate more or less independently. Most of them are quite small – two thirds are below 15 meters in length. (Trawlers are bigger and it is estimated that there are around 60 Norwegian trawlers over the size of 34 meters – one third being fresh fish trawlers, one third freezing trawlers, and one third ‘floating factories’ which also process fish. The coastal fleet accounts for about half

181
of the total supply of the West Fish facilities – and for Ålesund this share is even bigger. There are problems with the continuity of the supply from the coastal fleet. The boats, of course, are keen on fishing as much as possible when the availability of fish is rich and the quality is at its best. Therefore, a boat might well fill its quota in the first three months of the year. In this period the facilities are not able to use the huge amounts of fresh fish that are supplied. This fish is then either frozen or landed on other markets. In the rest of the year – when the coastal fleet has filled its quota – the facilities run short of supply and have to rely on frozen fish and deliveries from Russian trawlers. These suppliers play an important role in balancing supply and demand (at the same time as they are accused for over-fishing). ÅF vs other West Fish facilities To some extent the three West Fish facilities are competitors for raw materials owing to the problems with securing continuous supply of fresh fish. It is the West Fish head quarters that direct the long term supply of the facilities but when it comes to the daily need each facility has to secure its own supply. The northern facilities supply Ålesund with salted fish that is used for klipfish production. ÅF vs Transportation equipment It goes without saying that the quality of the end-product is strongly dependent on the transportation and logistics facilities. Both for fresh and frozen fish it is of the utmost importance that the fish is stored and transported at the appropriate temperature. Fresh fish landed in Ålesund is delivered in good shape in Paris three days after landing if adequately handled. However, in most cases ‘fresh’ fish can be substantially older. In the worst case it might take almost two weeks from catch to sales in the retail outlet. It is a logistic challenge, therefore, when Norwegian suppliers aim at increasingly supply Europe with fresh fish. The frozen fish requires an unbroken freezing chain through various transportation activities, intermediate storing, processing of different types, handling in stores, and by final consumers. It is a long way (and long time) from catch in the Barents Sea to consumption somewhere in North America, Africa or Latin America.

182
INTERFACES WITH OTHER RESOURCES 3a) The Ålesund facility vs. Products West Fish supply products to three different market segments: retail, catering and industry. Retail products The Ålesund facility supplies frozen seafood products packed for the retail market. Most products are skinless and boneless portions of fillet, ready to cook. The variants of fish produced are natural, smoked, salted, and breaded. West Fish offers a wide variety of fish species. The most important products are cod, saithe, salmon and trout, but substantial volumes of red-fish, pollock, halibut and catfish are produced as well. The fish can be prepared as fillets, steaks, loins, portions, or even further processed as crumbed fillets, fish fingers, fish burgers, fish schnitzel and soup-dish cubes. For retail sales West Fish also offers salted and dried cod (klipfish) cut into portions and desalted, ready for use in a variety of Bacalao dishes. Three own brands are utilised: West Fish – Aarsaether (to be squeezed out), West Fish, and Nordmar (which is used in Finland mainly). In addition the products are distributed under a number of different private labels such as Sea Bell, Garant and Eldorado. The products are distributed in cartons, bags and vacuum-packs and range from 250 to 1100g. The most common size is the 400g package. The best seller in Norway – a fillet of saithe – is packed in a 625g carton. Catering and industry Most of the retail products are packed also for the catering market. Furthermore, products at customers’ specifications are available for this market, as well as a wide range of standard products. The brand names include West Fish, Nordmar. and Polar Star, and private labels like Sea Bell (Norway) and IFP and Sysco (USA). The most important products are steaks and portions of haddock, saithe, redfish, halibut and salmon. However, for West Fish this facility has its main role as the producer of frozen pelagic fish and klipfish. The salted fish and the klipfish is sold both to the catering and industry markets. Salted fish and fillets are produced in strict accordance with demands from the major markets in Portugal, France, Italy, Greece, Brazil, the Caribean Islands, and Africa. These products are mainly supplied in cartons of 25 kg net or on pallets. The fish is sorted and graded in different qualities, which is a crucial activity. Salted fish is the raw material for klipfish, which is delivered in cartons, bales, and wooden cases of 25 or 50 kg.

183
For the industrial market the Ålesund facility is a major supplier of frozen pelagic fish that is further processed by these customers. The main products are herring and mackerel, which are graded according to standardised sizes, but also on customer specification. Packing is preferably in boxes of 20 kg. Changing market segments For West Fish the industry segment (including also trading) today represents almost half of total sales (48%). Catering accounts for 44% and retail products for 8%. There is a strong emphasis on changing these figures in the direction of more refined products. The plan for the coming years is to expand retail and catering and reduce the share that is sold to industry without being processed. This change has already started and West Fish aims at reducing the industry share to 20% and increase retail and catering to 25% and 55% respectively. The more refined products offer West Fish enhanced margins. For the Ålesund facility this shift will require expanding capacity for processing of retail products. 3b) The Ålesund facility vs. Business units The West Fish production facilities are responsible for their own supply of raw materials. As discussed above the West Fish trawlers are important suppliers of fish to the facilities. For the company as a whole their share of the total input is about 25%. For the Ålesund facility this figure is lower, because the own trawlers operate closer to the other two production sites and owing to the fact that Ålesund is very dependent on pelagic fish. Pelagic fish is purchased at the Bergen auction organised by Norges Sildesalgslag. This auction is held four times a day. The buyer is allowed only one price quotation and might state preferences concerning which boat to purchase from. In this choice it is not only the quantity and the grades that matter. Also the buyer’s experience of the individual boats in terms of fishing equipment, freezing facilities and ‘general quality’ has considerable impact on which boat is preferred. White fish for fillets and retail products is supplied partly from own boats and partly from the coastal fleet. When it comes to supply from the coastal fleet there is only one counterpart to deal with – Sunnmöre og Romsdals Fiskesalgslag. This organisation is guaranteed the first buy from the fishing companies and then sets the minimum price for sales to processing facilities, which creates problematic conditions for the buyers. The klipfish production relies on supply of salted cod and haddock, which is delivered partly by the own processing units in Finnmark and partly by other pre-processing facilities.

184
Each of the West Fish facilities is responsible for the purchase of raw material. As illustrated above this task does not require heavy interaction with organisations we normally refer to as business units. For external deliveries the Bergen auction and the negotiations with Sunnmöre og Romsdals Fiskesalgslag represent the main means of assuring supply. And when it comes to internal supply neither the facilities nor the trawlers are self governing independent economic units. The marketing and sales activities of West Fish are centralised to the head quarter which is responsible for the contacts with the own sales subsidiaries (in four countries), the agents and the importers. In most cases there is limited interaction between the facility and these organisations except for information exchange concerning production volumes and delivery svheduling. 3c) The Ålesund facility vs. business relationships The resource interaction with business units is thus not a significant issue for the Ålesund facility. On the other hand the facility is very crucial for some of the important business relationships of the West Fish corporation. On its web-site West Fish lists 10 product groups. The Ålesund facility is involved in the processing of seven of these. For three of the product groups the facilities in the north are more important than Ålesund. For the four remaining, however, Ålesund is the sole producer. This means that the operations of this facility are very significant for the business relationships between West Fish and the customers buying the following products: salted cod fillets, klipfish, frozen pelagic fish, and retail products. Below some characteristics of these business relationships are discussed. ÅF vs. West Fish/Rema 1000 Rema 1000 is one of the four Norwegian national retail chains in everyday commodities. In particular, West Fish is the supplier of a retail package of frozen saithe to the stores of Rema. This 625g product is sold in a quantity of more than one million packages a year (the Norwegian population amounts at 4.5 millions). The relationship was established about ten years ago and sales have increased continuously. In particular it was enhanced when West Fish introduced a new package - changing from vacuum bags to cartons. This change was launched by West Fish to enhance the image of the product and also to make the package user-friendlier. The change turned out to be very successful and sales increased by 30%. ÅF vs. West Fish/Finnish retail chains Finland is an important market for the retail products of West Fish. The financial impact of sales to Finland is more significant than the sales in Norway. Finnish retail chains like Kesko are supplied with the Nordmar

185
brand. Some of the relationships with these chains are direct while some are handled through importers in Finland. ÅF vs. West Fish/Buyers of klipfish The main geographical markets for klipfish were discussed above. Normally West Fish has a business relationship with an agent/importer because the users of klipfish may be many and widely spread. Most of these relationships are of a long-term nature. In Portugal West Fish is in direct contact with the user of the klipfish. This occurs because this firm was once a state owned corporation with monopoly and required direct supplier contact. This customer buys both ready-made klipfish and salted fish for further processing in its own plants. ÅF vs. West Fish/Users of pelagic fish Customers use pelagic fish in a number of applications, for example, processing of hermetically sealed products. The main buyers of mackerel are Japanese producers. However, owing to changing economic conditions the operations of these companies have moved from Japan, to South Korea, then to Thailand, and now to China in order to reduce labour cost. The relationships with the Japanese importers have lasted for long. When it comes to herring, Eastern Europe is a big market, for example Russia, Belarus and Ukraine. In these cases the business relationships are more transaction based and the buyer might never come back again. 4. CONCLUDING REMARKS The Ålesund facility is an important operation in the integrated strategy adopted by West Fish. It is the sole supplier of four of the product groups of the company. The processing plants of West Fish have a common problem in securing a continuous inflow of raw materials, which is a prerequisite for the industrialised activities that are the basis for the current operations of West Fish. According to company representatives the prevailing system of regulations in the fishing industry is a severe drawback in this respect. To improve the conditions on the supply side West Fish is working with partnering projects directed towards the coastal fleet and is involved also in cod farming. Like many other Norwegian fishing companies West Fish is trying to further refine the fish they catch. INTERVIEWS CONDUCTED FOR THE CASE 07.03 2003 Interview with Terje Kjölsöy (production manager and sales director). Rune Vågnes (export manager) and Tore Gjosdal (UK market). (Ingunn, Svanhild, Nina, Kjersti, Lars-Erik)

186
09.03 2003 Interview with Tore Gjosdal. (Ingunn, Svanhild, Nina, Kjersti, Lars-Erik) 10.03 2003 Interview with Kjell Stette (raw material responsible/fleet manager) (Ingunn, Svanhild, Nina, Calle, Lars-Erik) Visit to the Ålesund processing facility. Interview with Beate Sperre (quality manager) and Anton Standal (one of the founders). (Ingunn, Svanhild, Nina, Kjersti, Lars-Erik). ILLUSTRATION OF THE FOCAL RESOURCE AND ITS MAIN INTERFACES

187
Example of NETLOG case in Grenland
Boa Vista Team: Debbie Harrison 0. Background to the case study Question
• Why was the Boa Vista (resource) service introduced? • In what ways is the Boa Vista facility resource embedded into,
and dynamically combined with, the existing industrial activities of the users?
General context For several years goods were transported using relatively small cargo ships. When containers became a more normal way of transporting goods, DFDS Tor Line provided the feeder service. However, DFDS Tor Line operates relatively large ships, and these were considered to be too large to make the feeder transportation from Herøya to Brevik economically acceptable. Afterwards a rail route became the primary transportation mode. It was considered to be a more efficient solution for both Herøya and DFDS Tor Line that a separate feeder company was started. In addition, there was a strategic question regarding the ownership of resources. The Hydro Logistics unit considered that it is an issue that the Europaterminal own 90% of DFDS Tor Line. In addition, the harbour at Brevik has been under development for many years, and was “finished” in the late 1990s. The developments at Brevik meant that the RO/RO facility at Herøya would not be expanded. In the late 1990s a decision was taken to establish an independent small shipping company, Kystlink, to take care of the feeder transportation from Herøya to Brevik. The company was founded on 1st November 2000. There are multiple owners of Kystlink. The main owners are as follows: Taubåtcompaniet in Trondheim (17%), Hydro (15%), Grenland Port Authorities, Lyse Line, Bjørn Tore Valen (who is also managing director), and Lasse Andersen. For the first ten months of operation Kystlink leased a boat, the Boa Transporter, from Taubåtcompaniet. Initially the boat provided a feeder service between Herøya, Holmestrand, and Brevik. Later, a shipping line between Brevik and Hirtshals (Denmark) was added. This boat was replaced by the Boa Vista because it was too small (in capacity terms) and too inflexible (just a low boat). For example, the capacity of Boa Transporter was so limited that on most of the trips there was a waiting list (12 drivers only). The Boa Transporter vessel is currently not in operation (See

188
potential interfaces, section 5, for some additional comments regarding the Boa Transporter.). Kystlink now operates and owns the Boa Vista. There is no other ship: “Kystlink is Boa Vista”. The ship was bought and started operating from August 2001. Boa Vista is a RO/RO ship with a capacity of 12,000 line meters. The cargo for the ship can be both containers and trucks (with or without the driving unit). The ship sails four times a week between Brevik, Herøya and Borealis providing a feeder service. Once a week, the ship also visits Hydro Holmestrand. Boa Vista also sails between Brevik and Hirtshals six nights a week. From October 2001 Kystlink operated feeder activities for Borealis. Hence there are three users of the Kystlink resource: Hydro Herøya, Hydro Holmestrand, and Borealis. Hydro Holmestrand use the Kystlink feeder service for moving metal products. 1. Description of the focal resource - the facility • Investment / capacity The capacity of the Boa Vista is 12,000 line metres. In 2001 the Boa Vista service transported 175,000 tonnes of products in containers (both in and out). During the day Boa Vista is utilised as a feeder ship. Four days a week it sails from Brevik to Herøya and Borealis and then returns to Brevik. One a week it sails to Hydro in Holmestrand before returning to Brevik. Boa Vista only takes containers when used as a feeder ship. 96% of the containers collected at the three main customers are unloaded at Brevik. At present the capacity utilisation of the boat when it is operating as a feeder service to Brevik is 80-100% per trip. On the return “inward feeder” journey, empty containers are shipped back to Herøya and Borealis. When the Boa Vista has reached 100% utilisation and more goods need to be moved, Kystlink transports the goods using trucks owned by the MD (a separate company). The unloaded cargo is then shipped to various European destinations using DFDS Tor Line. The main locations after the Europaterminal are Ghent, Rotterdam, and Immingham. The ship also runs a line from Brevik to Hirtshals. Six days a week Boa Vista leaves Brevik in the evening and returns from Hirtshals in the morning. Only containers from Borealis are shipped to Hirtshals. Goods from Hydro are moved in trucks to Denmark. In addition, the boat collects trucks that are drive to Brevik. The trucks are driven from Hydro Postgrunn and Borealis to be transported to Hirshals. The goods on the trucks are obviously not containers. Trucking companies drive for both Hydro Postgrunn and Borealis. Each week 20-30 complete trucks and 50 trailers without a driving unit are transported. Only 30% to 40% of the capacity is utilised on this route. There is very poor utilisation of the boat on the return journey from Denmark.

189
• Complexity, Integration, and Set Up Time The Boa Vista operates standard routes on a weekly basis. On Tuesday-Friday inclusive the Boa Vista leaves Brevik at 9.30. The boat arrives at Hydro Postgrunn at 10.00 and departs at 12 noon. The arrival and departure times at Borealis are 12.30 and 14.30 respectively. The Boa Vista returns to Brevik to complete the journey at 15.00. Every Sunday the Boa Vista departs from Brevik at 10.00 and arrives at Hydro Holmestrand at 15.00. The service leaves Hydro at 17.00, returning to Brevik at 22.00. On Monday-Saturday inclusive the service departs from Brevik at 17.30 and arrives at Hirtshals at 24.00. The boat departs Hirtshals at 01.30 to arrive back at Brevik by 08.00. The boat can carry different types of goods in different formats from different customers simultaneously. Further, there are differences in the type, format and customer across the two main routes. It can be that agriculture, magnesium and PVC from Herøya is transported at the same time as plastics from Borealis. For the feeder service all goods are transported in containers. For the service to Denmark, the modes are mixed. Containers from Borealis are on board, alongside trucks carrying goods from both Borealis and Herøya. One special feature of the Boa Vista is its capability to transport dangerous goods. Kystlink has a special licence for shipping such goods. This is important because of the nature of the goods produced in the Grenland area. It is the open deck on Boa Vista that makes the transport of dangerous goods possible. The Boa Vista service is the only boat that can perform this function between Norway and Denmark. There is a fast turnaround of the ship in the various public and private ports. For example, when the ship is used as a feeder service, unloading and loading at Hydro takes two hours. On Tuesday-Friday inclusive there is also a two and a half hour window for unloading and loading at the Europaterminalen in preparation for the Hirtshals service. In sum, there is one service that runs four times a week, one service that runs six times a week that partly overlaps with the feeder service, and one service running on a Sunday that does not overlap with the other two. This is a standardised service, week in week out. There is no requirement for any kind of change over between types of goods or customer. Goods of different types from the same customer and goods from different customers can be transported on the boat simultaneously. Set up times are further minimised because there is no need for the boat to be cleaned between customers or routes. In addition, it is unnecessary to provide ‘special treatment’ for any of the different types of customer goods. There are no fixed space allocations for either of the two main customers. If the boat is full at any stage, a trucking service is used.

190
2. Interfaces with resources of the same type – the facility versus other facilities There are a great many facilities that can be identified as being related to the Boa Vista. These include the following; Hydro Postgrunn Quay, Borealis Quay, Hydro Holmestrand Quay, Brevik Terminal, Hirtshals Public Port, Containers, DFDS Tor Line ships, Documentation Flow System, Customer Production and Warehousing Facilities, and GTI Trucks. I have selected what I consider to be the most important interfaces between the focal facility and multiple similar resources: Boa Vista-Hydro Postgrunn Quay, Boa Vista-Brevik Terminal, and Boa Vista-GTI trucks.
In selecting the three facility interfaces the following procedure was conducted. First I thought through as many possible facility-facility interfaces as I could. This process was repeated until the interfaces became somewhat trivial. For instance, “Boa Vista-Containers” is an obvious interface. The three most important interfaces listed above are those that I consider to be central facility resource connections for the operation of the service. Each of the three interfaces is discussed in terms of activity links, technical connections, adaptations, and capacity balance.
Boa Vista-Hydro Quays The resources are combined to differing extents within closely complementary activities because there is a different level of service for the two Hydro quays. The Boa Vista calls at Holmestrand once each week. Hydro Holmestrand have utilised the Boa Vista service from September 2001. Using 2001 data, 36% of aluminium product manufactured at Holmestrand was transported by the Boa Vista via the Holmestrand quays. The product is transported on the boat within trailers. The use of trailers rather than containers requires no special adaptations within the Boa Vista. Hydro Holmestrand has 100% of the capacity of the resource for this one journey. In terms of the number of journeys made by the boat, Hydro Holmestrand has 20% of the capacity of the Boa Vista when it is utilised for the feeder operations. The other capacity implication of calling at the Holmestrand quay is that it is not possible to conduct the international service to Hirtshals on the same day. The RO-RO ramp at Herøya is mainly used by the Boa Vista. The Boa Visa calls at Herøya four times each week. In 2001 the Boa Vista shipped 170,000 tonnes of goods in total. The goods were shipped either in containers. The use of containers requires no special adaptations to the Boa Vista. This is a relatively small amount of the total volume of production across the three divisions at the Herøya site. The boat is more important as a feeder service to some product types than for others. Approximately 50% of the total goods transported on each of the four feeder sailings each week are

191
manufactured at Herøya. It would be possible for Herøya to take more of the capacity but the obvious constraint is the dimensions of the boat. Boa Vista-Brevik Terminal The terminal in its present form is relatively new. One impact is that the equipment and machinery resources accessed and used by the Boa Vista is relatively expensive because there are few other boats / shipping lines using these. On the other hand, the provision of a feeder service would be meaningless without such resource interfaces. Hence the Boa Vista is currently an important resource impacting upon the utilisation of the terminal. The Brevik terminal is used by multiple shipping lines and thus in some senses is the interface across these companies. The terminal provides complementary activities to the shipping lines. For instance, DFDS Tor Line ships also use the Europaterminalen alongside the Boa Vista. On the one hand DFDS ships are complementary to the Boa Vista in that both are containerised and hence customer goods can be easily transferred between the services at Brevik. The Boa Vista adds value to its customers and its customers’ customers by interfacing with the DFDS ships as a feeder. The DFDS ships make sailings to various international destinations on a daily basis. On the other hand, the Boa Vista is in conflict with DFDS ships because of the addition of another shipping line between Brevik and Hirtshals.
Boa Vista-GTI trucks The resource combination here is between the boat and a fleet of trucks owned by GTI. The interface joining the two facilities is underpinned by a management contract that was agreed when Kystlink took over feeder responsibilities for Hydro in 2000. The trucks are used as a ‘back up’ function when the Boa Vista is used as a feeder service for Borealis and Norsk Hydro. The function of the trucks is to transport the ‘overflow’ goods when the capacity upon the Boa Vista is fully utilised. The capacity of the boat is loosely planned for each of the sailings, using information contained within the document flow system. On the days when the boat is at 100% capacity utilisation the GTI trucks have to be used to transport the excess capacity between the warehouses at the customer sites and the Brevik terminal. The requirement for the use of GTI trucks is increasing over time. The use of a single resource by Kystlink results in access to, and adaptations with, the trucks becoming more vital to the feeder service. The GTI trucks are vital for maintaining the frequency and reliability of the Boa Vista service to both Borealis and Norsk Hydro. Both the Boa Vista and the GTI trucks perform similar activities, yet are also closely complementary in one direction.
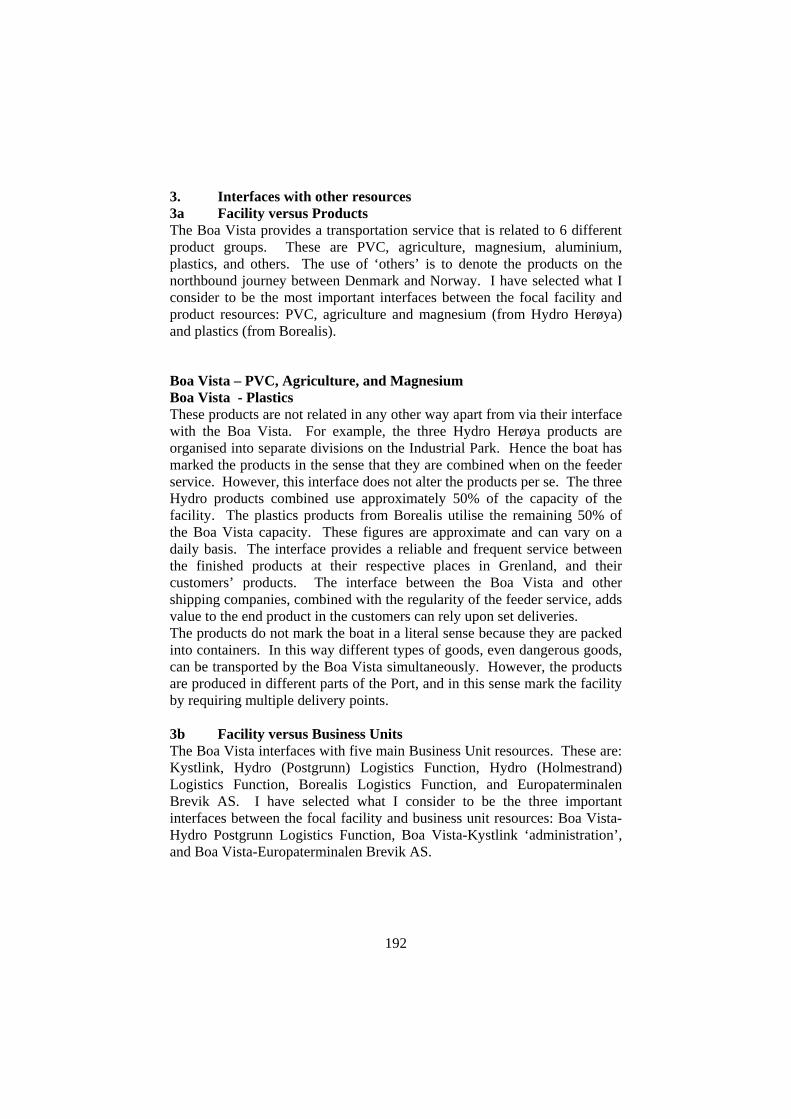
192
3. Interfaces with other resources 3a Facility versus Products The Boa Vista provides a transportation service that is related to 6 different product groups. These are PVC, agriculture, magnesium, aluminium, plastics, and others. The use of ‘others’ is to denote the products on the northbound journey between Denmark and Norway. I have selected what I consider to be the most important interfaces between the focal facility and product resources: PVC, agriculture and magnesium (from Hydro Herøya) and plastics (from Borealis).
Boa Vista – PVC, Agriculture, and Magnesium Boa Vista - Plastics These products are not related in any other way apart from via their interface with the Boa Vista. For example, the three Hydro Herøya products are organised into separate divisions on the Industrial Park. Hence the boat has marked the products in the sense that they are combined when on the feeder service. However, this interface does not alter the products per se. The three Hydro products combined use approximately 50% of the capacity of the facility. The plastics products from Borealis utilise the remaining 50% of the Boa Vista capacity. These figures are approximate and can vary on a daily basis. The interface provides a reliable and frequent service between the finished products at their respective places in Grenland, and their customers’ products. The interface between the Boa Vista and other shipping companies, combined with the regularity of the feeder service, adds value to the end product in the customers can rely upon set deliveries. The products do not mark the boat in a literal sense because they are packed into containers. In this way different types of goods, even dangerous goods, can be transported by the Boa Vista simultaneously. However, the products are produced in different parts of the Port, and in this sense mark the facility by requiring multiple delivery points. 3b Facility versus Business Units The Boa Vista interfaces with five main Business Unit resources. These are: Kystlink, Hydro (Postgrunn) Logistics Function, Hydro (Holmestrand) Logistics Function, Borealis Logistics Function, and Europaterminalen Brevik AS. I have selected what I consider to be the three important interfaces between the focal facility and business unit resources: Boa Vista-Hydro Postgrunn Logistics Function, Boa Vista-Kystlink ‘administration’, and Boa Vista-Europaterminalen Brevik AS.

193
Boa Vista-Hydro Logistics Function The Boa Vista does not interface directly with any of the three divisions at Norsk Hydro Herøya. After goods have been produced, they are delivered to a warehouse and stored for a certain time period. The warehousing, internal site transport vehicles, and external site transport vehicles are owned by the Hydro Logistics Function. Therefore it is with this function or service division that the Boa Vista interacts. Prior to Borealis becoming a Boa Vista customer, Hydro was for some time the only user of the boat service. In the present day (2002) the Logistics Function has a share of approximately 50% of the capacity of the Boa Vista. That is, 50% of the capacity of the Boa Vista for each of the feeder journeys within the Grenland Port area. Most Hydro goods are offloaded at Brevik, and therefore the Logistics function has little capacity of the boat for the Brevik-Hirtshals service. In transporting approximately 170,000 tonnes of mainly agricultural and PVC goods (2001 data), the Boa Vista transports nearly 10% of production out of the Herøya site. No special adaptations to the boat are required for the transporting of Hydro goods. The main issue is the volume of goods that Hydro accounts for. The Boa Vista does provide a well-used alternative transport mode compared to trucks and larger ships. This is because more cargo can be loaded onto the Boa Vista than onto a truck, and the journeys are more frequent. The 10% of goods transported out of Herøya could easily increase and the value of Boa Vista as a transport mode would rise accordingly. Boa Vista-Kystlink ‘administration’ There is a key interface between the boat and Kystlink. The Boa Vista is the one (central) resource owned by the company. To paraphrase several actors, “The Boa Vista is Kystlink”. This is therefore an unusual case of an apparently perfect mapping of resource / actor. The interface is activated by the information flow that links together these two resources with Hydro, Borealis, and Brevik respectively. The descriptions of this interface are somewhat extreme along each of the relevant dimensions. The use of the focal facility accounts for the turnover of Kystlink. This business unit owns all of the capacity of the Boa Vista but does not make use of the service per se. Instead, this business unit provides the service through the ownership of the resource.
Boa Vista-Europaterminalen Brevik AS Europaterminalen Brevik AS owns many of the resources (e.g. the Quay) that the Boa Vista must access in order to be able to operate on a day-to-day basis. These are shared with other actors such as the DFDS Tor Line ships, and charges are made. The charges are currently considered to be “high” because the utilisation of the cranes, handling machines etc owned by
194
Europaterminalen is low. Hence the Europaterminalen Brevik AS does not use the facility per se, but is instead used by the focal facility. It is fair to say that much of the value of the Boa Vista service would be lost without the anchoring for both the feeder and international services at the Brevik quay. The Boa Vista is one of the two main actors utilising these resources on a regular basis (along with DFDS). Both of the shipping services increase the attractiveness and value of the Brevik quay because other resources can interface with the boats. At the present time DFDS ships and the Boa Vista transport most sea-bound goods and hence account for a large proportion of the cargo flows at the Europaterminalen. 3c Facility versus Business Relationships There are many businesses that can be identified as being related to by the facility. These include; Kystlink, Hydro (Postgrunn and Holmestrand), Borealis, Grenland Port Authority, Hirtshals Port Authority, Europaterminalen Brevik AS, DFDS Tor Line, Colorline, Local entrepreneurs, Taubåtkompaniet, customers on the return trip from Denmark, and a local Trucking company. I have selected what I consider to be the 2 most important interfaces between the focal facility and multiple business relationships; Kystlink-Norsk Hydro, and Kystlink-Borealis. Boa Vista-Kystlink-Norsk Hydro Hydro are one of the owners of Kystlink (and therefore the boat, at least indirectly). The three divisions at Herøya have been customers of the feeder boat service since the Boa Transporter started to operate. The Boa Vista has a direct interface with the Logistics side of Hydro Business Partner Supply. Logistics is a shared service provided for all three Herøya divisions by Hydro Business Partner Supply. Initially Hydro had the whole of the capacity of the resource when the ship operated the feeder service. This has now reduced somewhat to around 50% because Borealis shares the transport capacity of the feeder service. The boat is not customised internally for Hydro, though of course Herøya has been a destination for the service from the beginning. Boa Vista-Kystlink-Borealis The customer relationship between Boa Vista and Borealis is relatively recent when compared with Hydro. In October 2001 Borealis started using Kystlink for container transportation. The relationship has a relatively large share of the capacity of the facility, approximately 50%. This share can vary on a daily basis, from zero to 100%, depending upon how the resource is shared with Norsk Hydro. The facility’s share of the business relationship is more difficult to estimate. The best measure we have is to express this in terms of cargo dispatched from Borealis. 100,000 tons of products are put into containers each year. 4000 containers of product each year (an average

195
of 77 containers per week), is transported on the Boa Vista. Approximately 1200 containers a year continue on board from Brevik to Hirtshals. The Boa Vista only takes containers and no trucks or trailers from Borealis to Brevik. It is fair to say that the resource is strongly marked by the customer relationship with Borealis in utilisation terms, yet there are no special adaptations made for the Borealis relationship within the boat itself. However, there is the obvious point that the boat has adapted the route and calls additionally at the Borealis quay. Further, the utilisation of the existing RO-RO facilities at Borealis has increased. 4. Contractions or tensions in potential resource combinations During our interviews we discussed the developmental potential of the Boa Vista resource, and therefore the two transportation routes provided by the boat, with the relevant participants. The current tension is between two main routes for deepening the existing resource combinations: (a) for the boat to become an exclusive feeder service, and (b) for the boat to become an exclusive international service. There is a tension within Kystlink between these two possibilities for resource combination deepening or increasing heaviness in a certain direction. A change in the service provided by the Boa Vista by developing the resource interfaces across facilities, products, business units and business relationships in one of the directions identified above would prohibit the development of the other. In other words, the contradictions in the potential resource combinations discussed here takes the facility as the starting point, and continues by assessing the impact of increasing one of the existing uses of the resource upon the similar and different interfaces within the four types of resources. Kystlink are currently considering whether to expand the number of journeys using Boa Vista as a feeder service, or to use a second boat. The use of the Boa Vista as an exclusive feeder service would obviously eliminate the Brevik-Hirtshals route. This would have a variety of implications. For example, the interface between the boat and the various Logistics department business units would be affected. A larger number of goods in either containers or in trucks could be transported out of the area. Those that continued the journey from Brevik to Hirtshals would have to be offloaded at Brevik. A change in the relationship with DFDS might occur in securing the international element of the Boa Vista service through accessing other resources. Alternatively, it might be possible to add new resources by re-introducing the old Boa Transporter boat, previously leased from Taubåtkompaniet and currently moored at Langesaund, for the summer 2002 season. This might become a permanent service. Clearly the option discussed above would increase the dependency of the boat upon the traffic in the Grenland Port area. Kystlink managers identified this as a problem. The alternative use of the existing resource is to increase

196
the capacity of Boa Vista for northbound traffic. Due to the sailing time of 6 ½ hours one way between Brevik and Hirtshals, it is not possible to put in two trips Brevik – Hirtshals – Brevik in a 24-hour period. At the moment there is not enough business on the route Brevik – Hirtshals to make this interesting to consider. Kystlink is currently searching for relationships with those who wish to transport goods to Norway using self-drive vehicles. An agent in Denmark is working on this on behalf of the company. The goods would be transported to Oslo by road on arrival at Brevik. This would rival the Larvik (Colorline) and Goteburg (DFDS) services. A new Hydro-owned smelting company should increase the utilisation of the boat between Denmark and Norway because metal will be imported from China in containers.