portfolio management service - dynamic defensive
TRANSCRIPT
www.whitechurch.co.uk
Q2 - 2021
Key FactsAs at 30th June 2021
Source: FE Analytics, Whitechurch Securities. Performance figures are calculated net of fees in sterling. Unit Trust prices are calculated on a bid-to-bid basis. OEICs & Investment Trust prices are calculated on a mid-to-mid basis, with net income reinvested. The past is not necessarily a guide to future performance. The value of investments and any income will fluctuate and investors may not get back the full amount invested. Currency exchange rates may affect the value of investment. Benchmark figures are based on ARC estimates and are subject to revision.
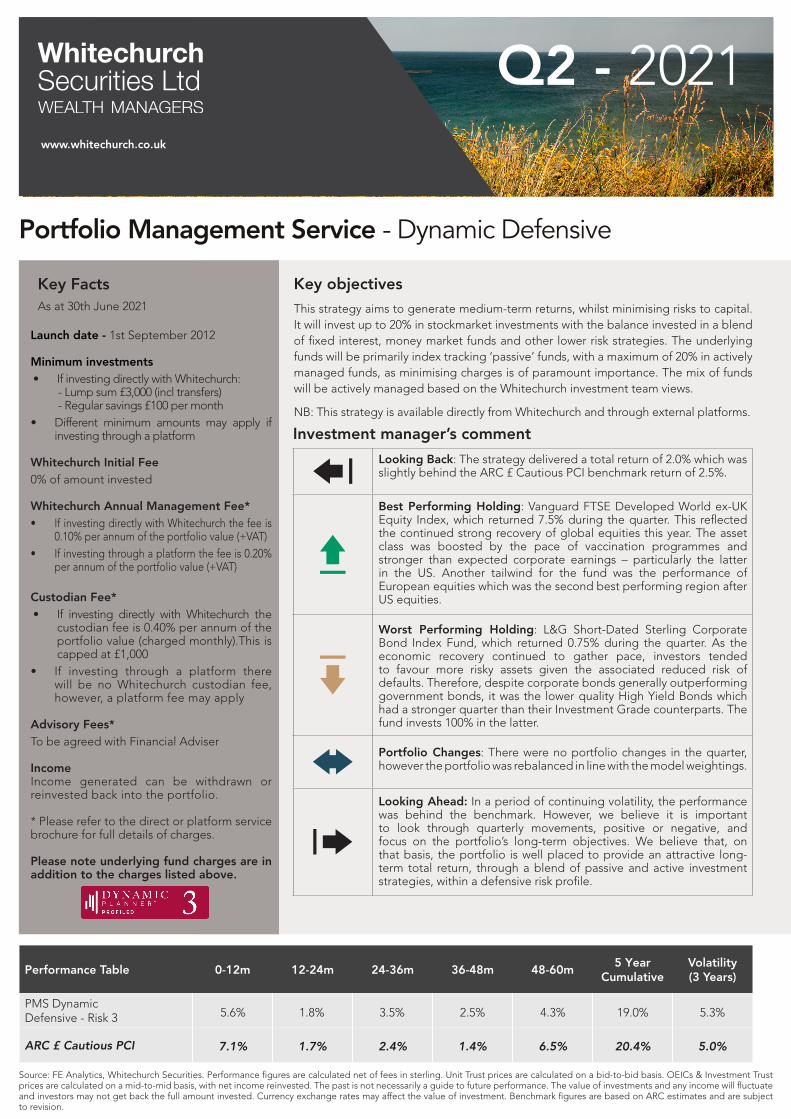
Portfolio Management Service - Dynamic Defensive
Key objectivesThis strategy aims to generate medium-term returns, whilst minimising risks to capital. It will invest up to 20% in stockmarket investments with the balance invested in a blend of fixed interest, money market funds and other lower risk strategies. The underlying funds will be primarily index tracking ‘passive’ funds, with a maximum of 20% in actively managed funds, as minimising charges is of paramount importance. The mix of funds will be actively managed based on the Whitechurch investment team views.
NB: This strategy is available directly from Whitechurch and through external platforms.
Performance Table 0-12m 12-24m 24-36m 36-48m 48-60m5 Year
CumulativeVolatility (3 Years)
PMS DynamicDefensive - Risk 3
ARC £ Cautious PCI
Investment manager’s comment
Launch date - 1st September 2012
Minimum investments• If investing directly with Whitechurch: - Lump sum £3,000 (incl transfers) - Regular savings £100 per month• Different minimum amounts may apply if
investing through a platform
Whitechurch Initial Fee0% of amount invested
Whitechurch Annual Management Fee*• If investing directly with Whitechurch the fee is
0.10% per annum of the portfolio value (+VAT)• If investing through a platform the fee is 0.20%
per annum of the portfolio value (+VAT)
Custodian Fee*• If investing directly with Whitechurch the
custodian fee is 0.40% per annum of the portfolio value (charged monthly).This is capped at £1,000
• If investing through a platform there will be no Whitechurch custodian fee, however, a platform fee may apply
Advisory Fees*To be agreed with Financial Adviser
IncomeIncome generated can be withdrawn or reinvested back into the portfolio.
* Please refer to the direct or platform service brochure for full details of charges.
Please note underlying fund charges are in addition to the charges listed above.
Looking Back: The strategy delivered a total return of 2.0% which was slightly behind the ARC £ Cautious PCI benchmark return of 2.5%.
Best Performing Holding: Vanguard FTSE Developed World ex-UK Equity Index, which returned 7.5% during the quarter. This reflected the continued strong recovery of global equities this year. The asset class was boosted by the pace of vaccination programmes and stronger than expected corporate earnings – particularly the latter in the US. Another tailwind for the fund was the performance of European equities which was the second best performing region after US equities.
Worst Performing Holding: L&G Short-Dated Sterling Corporate Bond Index Fund, which returned 0.75% during the quarter. As the economic recovery continued to gather pace, investors tended to favour more risky assets given the associated reduced risk of defaults. Therefore, despite corporate bonds generally outperforming government bonds, it was the lower quality High Yield Bonds which had a stronger quarter than their Investment Grade counterparts. The fund invests 100% in the latter.
Portfolio Changes: There were no portfolio changes in the quarter, however the portfolio was rebalanced in line with the model weightings.
Looking Ahead: In a period of continuing volatility, the performance was behind the benchmark. However, we believe it is important to look through quarterly movements, positive or negative, and focus on the portfolio’s long-term objectives. We believe that, on that basis, the portfolio is well placed to provide an attractive long-term total return, through a blend of passive and active investment strategies, within a defensive risk profile.
5.6% 1.8% 3.5% 2.5% 4.3% 19.0% 5.3%
7.1% 1.7% 2.4% 1.4% 6.5% 20.4% 5.0%

For further information about any of the areas included in this or any of our other strategies in the Portfolio Management Service please contact your Financial Adviser.
Tel: 0117 452 1207E-mail: [email protected]
Website: www.whitechurch.co.uk
Whitechurch Securities Ltd, The Old Chapel, 14 Fairview Drive, Redland, Bristol, BS6 6PH. Whitechurch Securities Ltd is authorised and regulated by the Financial Conduct Authority.
This fact sheet is intended to provide information of a general nature and does not represent a personal recommendation of the service. If you are unsure, seek professional advice before making an investment. Whilst we have made great efforts to ensure complete accuracy we cannot accept responsibility for inaccuracies. The past is not necessarily a guide to future performance. The value of investments and any income produced can go down as well as up and you may not get back the full amount invested. Levels and bases of, and reliefs from, taxation are subject to change.
FP3225.26.07.21
Asset allocation - Portfolio breakdown (at 30th June 2021)
Current holdings
Source: Financial Express 30th June 2021. Asset allocation numbers may not add up to 100% due to rounding. Negative asset allocation can occur due to the underlying positions employing hedging strategies.
For further information about any of the areas included in this or any of our other strategies in the Portfolio Management Service please contact your Financial Adviser.
Other strategies under the Portfolio Management Service • Dynamic Cautious Strategy 4/10 - Low Risk *• Cautious Growth Strategy 4/10 - Cautious
• Dynamic Balanced Strategy 5/10 - Medium *• Monthly Distribution Strategy 5/10 - Medium
• Ethical Balanced Strategy 5/10 - Medium
• Dynamic Steady Growth Strategy 6/10 - Above Average *• Global Income & Growth Strategy 6/10 - Above Average
• Dynamic Growth Strategy 7/10 - High Risk *• Stockmarket Growth Strategy 7/10 - High Risk
• Energy & Global Shift Strategy 8/10 - Aggressive
Risk Profile 3/10 - Low Risk
This is a defensive strategy where the emphasis is upon capital preservation and the majority of the portfolio will be invested in lower risk investments. This strategy will invest up to a maximum of 20% in equities with the aim of enhancing returns over the medium to long-term and combating inflation. Investors accept that the overall portfolio will show losses over certain periods but are accepting the moderate risk in return for potentially achieving returns in excess of cash over the medium to long term.
Whitechurch Risk Ratings
Risk is defined as the risk to the capital or original investment (based on a minimum 5 year investment term). Whitechurch provides a risk rating of portfolios on a scale of 1 to 10 (1 being the lowest risk and 10 being the highest risk). Full guidelines are available in the Whitechurch Portfolio Management Service brochure.
• Fidelity UK Index
• Gravis Clean Energy
• Jupiter Corporate Bond
• L&G Global Inflation Linked Bond Index
• L&G Short Dated Sterling Corporate
Bond Index
• L&G Sterling Corporate Bond Index
• TwentyFour Corporate Bond
• Vanguard FTSE Developed World ex UK
Equity Index
• Vanguard Global Bond Index Hedge
• Cash
UK Equity 8.8%
Global Developed Equity 10.2%
Global Emerging Equity 0.2%
UK Fixed Income 13.4%
Global Developed Fixed Income 47.9%
Global Emerging Fixed Income 0.8%
Renewable Energy 2.0%
Cash & Money Market 16.7%
www.whitechurch.co.uk
Q2 - 2021
Key FactsAs at 30th June 2021
Source: FE Analytics, Whitechurch Securities. Performance figures are calculated net of fees in sterling. Unit Trust prices are calculated on a bid-to-bid basis. OEICs & Investment Trust prices are calculated on a mid-to-mid basis, with net income reinvested. The past is not necessarily a guide to future performance. The value of investments and any income will fluctuate and investors may not get back the full amount invested. Currency exchange rates may affect the value of investment. Benchmark figures are based on ARC estimates and are subject to revision.
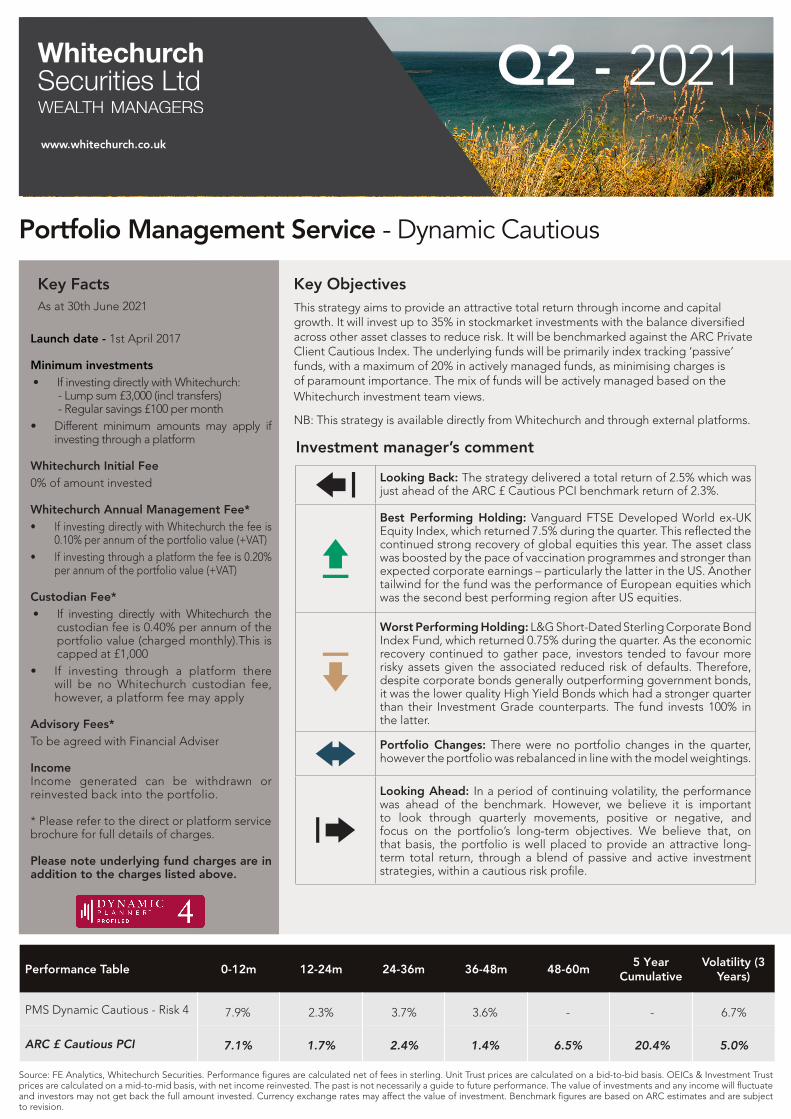
Portfolio Management Service - Dynamic Cautious
Key ObjectivesThis strategy aims to provide an attractive total return through income and capitalgrowth. It will invest up to 35% in stockmarket investments with the balance diversifiedacross other asset classes to reduce risk. It will be benchmarked against the ARC PrivateClient Cautious Index. The underlying funds will be primarily index tracking ‘passive’funds, with a maximum of 20% in actively managed funds, as minimising charges isof paramount importance. The mix of funds will be actively managed based on theWhitechurch investment team views.
NB: This strategy is available directly from Whitechurch and through external platforms.
Launch date - 1st April 2017
Minimum investments• If investing directly with Whitechurch: - Lump sum £3,000 (incl transfers) - Regular savings £100 per month• Different minimum amounts may apply if
investing through a platform
Whitechurch Initial Fee0% of amount invested
Whitechurch Annual Management Fee*• If investing directly with Whitechurch the fee is
0.10% per annum of the portfolio value (+VAT)• If investing through a platform the fee is 0.20%
per annum of the portfolio value (+VAT)
Custodian Fee*• If investing directly with Whitechurch the
custodian fee is 0.40% per annum of the portfolio value (charged monthly).This is capped at £1,000
• If investing through a platform there will be no Whitechurch custodian fee, however, a platform fee may apply
Advisory Fees*To be agreed with Financial Adviser
IncomeIncome generated can be withdrawn or reinvested back into the portfolio.
* Please refer to the direct or platform service brochure for full details of charges.
Please note underlying fund charges are in addition to the charges listed above.
Investment manager’s comment
Performance Table 0-12m 12-24m 24-36m 36-48m 48-60m5 Year
CumulativeVolatility (3
Years)
PMS Dynamic Cautious - Risk 4
ARC £ Cautious PCI
7.9% 2.3% 3.7% 3.6% - - 6.7%
7.1% 1.7% 2.4% 1.4% 6.5% 20.4% 5.0%
Looking Back: The strategy delivered a total return of 2.5% which was just ahead of the ARC £ Cautious PCI benchmark return of 2.3%.
Best Performing Holding: Vanguard FTSE Developed World ex-UK Equity Index, which returned 7.5% during the quarter. This reflected the continued strong recovery of global equities this year. The asset class was boosted by the pace of vaccination programmes and stronger than expected corporate earnings – particularly the latter in the US. Another tailwind for the fund was the performance of European equities which was the second best performing region after US equities.
Worst Performing Holding: L&G Short-Dated Sterling Corporate Bond Index Fund, which returned 0.75% during the quarter. As the economic recovery continued to gather pace, investors tended to favour more risky assets given the associated reduced risk of defaults. Therefore, despite corporate bonds generally outperforming government bonds, it was the lower quality High Yield Bonds which had a stronger quarter than their Investment Grade counterparts. The fund invests 100% in the latter.
Portfolio Changes: There were no portfolio changes in the quarter, however the portfolio was rebalanced in line with the model weightings.
Looking Ahead: In a period of continuing volatility, the performance was ahead of the benchmark. However, we believe it is important to look through quarterly movements, positive or negative, and focus on the portfolio’s long-term objectives. We believe that, on that basis, the portfolio is well placed to provide an attractive long-term total return, through a blend of passive and active investment strategies, within a cautious risk profile.

For further information about any of the areas included in this or any of our other strategies in the Portfolio Management Service please contact your Financial Adviser.
Tel: 0117 452 1207E-mail: [email protected]
Website: www.whitechurch.co.uk
Whitechurch Securities Ltd, The Old Chapel, 14 Fairview Drive, Redland, Bristol, BS6 6PH. Whitechurch Securities Ltd is authorised and regulated by the Financial Conduct Authority.
This fact sheet is intended to provide information of a general nature and does not represent a personal recommendation of the service. If you are unsure, seek professional advice before making an investment. Whilst we have made great efforts to ensure complete accuracy we cannot accept responsibility for inaccuracies. The past is not necessarily a guide to future performance. The value of investments and any income produced can go down as well as up and you may not get back the full amount invested. Levels and bases of, and reliefs from, taxation are subject to change.
FP3225.26.07.21
Asset allocation - Portfolio breakdown (at 30th June 2021)
Current holdings
Source: Financial Express 30th June 2021. Asset allocation numbers may not add up to 100% due to rounding. Negative asset allocation can occur due to the underlying positions employing hedging strategies.
For further information about any of the areas included in this or any of our other strategies in the Portfolio Management Service please contact your Financial Adviser.
Other strategies under the Portfolio Management Service• Dynamic Defensive Strategy 3/10 - Low Risk *• Cautious Growth Strategy 4/10 - Cautious
• Dynamic Balanced Strategy 5/10 - Medium
• Monthly Distribution Strategy 5/10 - Medium
• Ethical Balanced Strategy 5/10 - Medium
• Dynamic Steady Growth Strategy 6/10 - Above Average *• Global Income & Growth Strategy 6/10 - Above Average
• Dynamic Growth Strategy 7/10 - High Risk *• Stockmarket Growth Strategy 7/10 - High Risk
• Energy & Global Shift Strategy 8/10 - Aggressive
Risk Profile 4/10 - Cautious
This is a cautious strategy, whereby the majority of the portfolio will be in lower risk investments. This strategy will invest up to a maximum of 35% in equities with the aim of enhancing returns over the medium to long-term and combating inflation. Investors accept that the overall portfolio will show losses over certain periods but are accepting a degree of risk in return for a potentially higher return over the long term.
Whitechurch Risk Ratings
Risk is defined as the risk to the capital or original investment (based on a minimum 5 year investment term). Whitechurch provides a risk rating of portfolios on a scale of 1 to 10 (1 being the lowest risk and 10 being the highest risk). Full guidelines are available in the Whitechurch Portfolio Management Service brochure.
• Fidelity UK Index• Gravis Clean Energy• Jupiter Corporate Bond• L&G Global inflation Linked Bond Index • L&G Short Dated Sterling Corporate Bond
Index• L&G Sterling Corporate Bond Index• TwentyFour Corporate Bond• Vanguard FTSE Developed World ex UK
Equity Index• Vanguard FTSE UK Equity Income Index • Vanguard Global Bond Index Hedge• Cash
UK Equity 15.8%
Global Developed Equity 16.9%
Global Emerging Equity 0.3%
UK Fixed Income 12.7%
Global Developed Fixed Income 39.9%
Global Emerging Fixed Income 0.6%
Renewable Energy 2.0%
Cash & Money Market 11.8%

www.whitechurch.co.uk
Q2 - 2021
Key FactsAs at 30th June 2021
Source: FE Analytics, Whitechurch Securities. Performance figures are calculated net of fees in sterling. Unit Trust prices are calculated on a bid-to-bid basis. OEICs & Investment Trust prices are calculated on a mid-to-mid basis, with net income reinvested. The past is not necessarily a guide to future performance. The value of investments and any income will fluctuate and investors may not get back the full amount invested. Currency exchange rates may affect the value of investment. Benchmark figures are based on ARC estimates and are subject to revision.
Portfolio Management Service - Dynamic BalancedKey objectivesThis strategy aims to provide an attractive total return through income and capital growth. It will invest up to 60% in stockmarket investments with the balance diversified across other asset classes to reduce risk. The underlying funds will be primarily index tracking ‘passive’ funds, with a maximum of 20% in actively managed funds, as minimising charges is of paramount importance. The mix of funds will be actively managed based on the Whitechurch investment team views.
NB: This strategy is available directly from Whitechurch and through external platforms.
Launch date - 1st September 2012
Minimum investments• If investing directly with Whitechurch: - Lump sum £3,000 (incl transfers) - Regular savings £100 per month• Different minimum amounts may apply if
investing through a platform
Whitechurch Initial Fee0% of amount invested
Whitechurch Annual Management Fee*• If investing directly with Whitechurch the fee is
0.10% per annum of the portfolio value (+VAT)• If investing through a platform the fee is 0.20%
per annum of the portfolio value (+VAT)
Custodian Fee*• If investing directly with Whitechurch the
custodian fee is 0.40% per annum of the portfolio value (charged monthly).This is capped at £1,000
• If investing through a platform there will be no Whitechurch custodian fee, however, a platform fee may apply
Advisory Fees*To be agreed with Financial Adviser
IncomeIncome generated can be withdrawn or reinvested back into the portfolio.
* Please refer to the direct or platform service brochure for full details of charges.
Please note underlying fund charges are in addition to the charges listed above.
Performance Table 0-12m 12-24m 24-36m 36-48m 48-60m5 Year
CumulativeVolatility (3 Years)
PMS Dynamic Balanced - Risk 5
ARC £ Balanced Asset PCI
Investment manager’s comment
Looking Back: The strategy delivered a total return of 3.0% which was just behind the ARC £ Balanced Asset PCI benchmark return of 3.5%.
Best Performing Holding: L&G US Index Fund, which returned 8.1% in the quarter. This reflected the strong performance of the US market. The asset class continued its recovery, further boosted by the pace of vaccinations and stronger than expected corporate earnings. The latter helped technology stocks, which make up 28% of the fund, bounce back strongly after a relatively weak Q1. Two other notable sector contributors during the period were Healthcare and Consumer Discretionary, which make up a further 27% of the underlying index.
Worst Performing Holding: L&G Japan Index Fund, which returned -0.6% during the quarter. Japan was the worst performing region for equities during Q2. Despite Covid case numbers remaining relatively low compared to most other nations, the slow vaccination programme continued to attract further criticism. Investor sentiment was also negatively impacted by the extension of tight lockdown restrictions in the Tokyo region and the release of poor GDP growth figures for Q1.
Portfolio Changes: We took the decision to marginally increase exposure to European Equities when the portfolio was rebalanced in line with the model weightings at the end of the quarter. This was in light of the improving outlook for the region, as both vaccination programmes and wider global economic recovery gathered pace.
Looking Ahead: In a period of continuing volatility, the performance was slightly behind the benchmark. However, we believe it is important to look through quarterly movements, positive or negative, and focus on the portfolio’s long-term objectives. We believe that, on that basis, the portfolio is well placed to provide an attractive long-term total return, through a blend of passive and active investment strategies, within a balanced risk profile.
13.5% 1.4% 2.6% 4.7% 13.8% 40.7% 10.1%
11.5% 0.5% 2.7% 3.0% 10.6% 31.1% 7.9%

For further information about any of the areas included in this or any of our other strategies in the Portfolio Management Service please contact your Financial Adviser.
Tel: 0117 452 1207E-mail: [email protected]
Website: www.whitechurch.co.uk
Whitechurch Securities Ltd, The Old Chapel, 14 Fairview Drive, Redland, Bristol, BS6 6PH. Whitechurch Securities Ltd is authorised and regulated by the Financial Conduct Authority.
This fact sheet is intended to provide information of a general nature and does not represent a personal recommendation of the service. If you are unsure, seek professional advice before making an investment. Whilst we have made great efforts to ensure complete accuracy we cannot accept responsibility for inaccuracies. The past is not necessarily a guide to future performance. The value of investments and any income produced can go down as well as up and you may not get back the full amount invested. Levels and bases of, and reliefs from, taxation are subject to change.
FP3225.26.07.21
Asset allocation - Portfolio breakdown (at 30th June 2021)
Current holdings
Source: Financial Express 30th June 2021. Asset allocation numbers may not add up to 100% due to rounding. Negative asset allocation can occur due to the underlying positions employing hedging strategies.
For further information about any of the areas included in this or any of our other strategies in the Portfolio Management Service please contact your Financial Adviser.
Other strategies under the Portfolio Management Service• Dynamic Defensive Strategy 3/10 - Low Risk *• Dynamic Cautious Strategy 4/10 - Low Risk *• Cautious Growth Strategy 4/10 - Cautious
• Monthly Distribution Strategy 5/10 - Medium
• Ethical Balanced Strategy 5/10 - Medium
• Dynamic Steady Growth Strategy 6/10 - Above Average *• Global Income & Growth Strategy 6/10 - Above Average
• Dynamic Growth Strategy 7/10 - High Risk *• Stockmarket Growth Strategy 7/10 - High Risk
• Energy & Global Shift Strategy 8/10 - Aggressive
Risk Profile 5/10 - Medium
This is a balanced strategy focused towards investors who accept a degree of risk whilst looking to enhance returns. This strategy will invest up to a maximum of 60% in equities with the aim of enhancing returns over the medium to long-term and combating inflation. Investors accept that the overall portfolio will show losses over certain periods but are accepting a medium level of risk in return for a potentially higher return over the long term.
Whitechurch Risk Ratings
Risk is defined as the risk to the capital or original investment (based on a minimum 5 year investment term). Whitechurch provides a risk rating of portfolios on a scale of 1 to 10 (1 being the lowest risk and 10 being the highest risk). Full guidelines are available in the Whitechurch Portfolio Management Service brochure.
• Fidelity UK Index• Gravis Clean Energy• HSBC European Index• HSBC FTSE 250 Index• Jupiter Corporate Bond• L&G Global inflation Linked Bond Index • L&G Japan Index• L&G Short Dated Sterling Corporate Bond
Index• L&G US Index• TwentyFour Corporate Bond• Vanguard FTSE Developed World ex UK
Equity Index• Vanguard FTSE UK Equity Income Index • Vanguard Global Bond Index Hedge• Cash
UK Equity 24.5%
Global Developed Equity 31.9%
Global Emerging Equity 0.1%
UK Fixed Income 8.8%
Global Developed Fixed Income 28.0%
Global Emerging Fixed Income 0.5%
Renewable Energy 2.0%
Cash & Money Market 4.3%

www.whitechurch.co.uk
Q2 - 2021
Key FactsAs at 30th June 2021
Source: FE Analytics, Whitechurch Securities. Performance figures are calculated net of fees in sterling. Unit Trust prices are calculated on a bid-to-bid basis. OEICs & Investment Trust prices are calculated on a mid-to-mid basis, with net income reinvested. The past is not necessarily a guide to future performance. The value of investments and any income will fluctuate and investors may not get back the full amount invested. Currency exchange rates may affect the value of investment. Benchmark figures are based on ARC estimates and are subject to revision.
Portfolio Management Service - Dynamic Steady GrowthKey objectivesThis strategy aims to provide long-term growth mainly from a globally diversified stockmarket focused portfolio. It will invest up to 80% in equities with the balance diversified across other asset classes to reduce risk. The underlying funds will be primarily index tracking ‘passive’ funds, with a maximum of 20% in actively managed funds, as minimising charges is of paramount importance. The mix of funds will be actively managed based on the Whitechurch investment team views.
NB: This strategy is available directly from Whitechurch and through external platforms.
Launch date - 1st April 2017
Minimum investments• If investing directly with Whitechurch: - Lump sum £3,000 (incl transfers) - Regular savings £100 per month• Different minimum amounts may apply if
investing through a platform
Whitechurch Initial Fee0% of amount invested
Whitechurch Annual Management Fee*• If investing directly with Whitechurch the fee is
0.10% per annum of the portfolio value (+VAT)• If investing through a platform the fee is 0.20%
per annum of the portfolio value (+VAT)
Custodian Fee*• If investing directly with Whitechurch the
custodian fee is 0.40% per annum of the portfolio value (charged monthly).This is capped at £1,000
• If investing through a platform there will be no Whitechurch custodian fee, however, a platform fee may apply
Advisory Fees*To be agreed with Financial Adviser
IncomeIncome generated can be withdrawn or reinvested back into the portfolio.
* Please refer to the direct or platform service brochure for full details of charges.
Please note underlying fund charges are in addition to the charges listed above.
Investment manager’s comment
Performance Table 0-12m 12-24m 24-36m 36-48m 48-60m5 Year
CumulativeVolatility (3
Years)
PMS Dynamic Steady Growth - Risk level 6
ARC £ Steady Growth PCI
Looking Back: The strategy delivered a total return of 3.3% which was behind the ARC £ Steady Growth PCI benchmark return of 4.4%.
Best Performing Holding: L&G US Index Fund, which returned 8.1% in the quarter. This reflected the strong performance of the US market. The asset class continued its recovery, further boosted by the pace of vaccinations and stronger than expected corporate earnings. The latter helped technology stocks, which make up 28% of the fund, bounce back strongly after a relatively weak Q1. Two other notable sector contributors during the period were Healthcare and Consumer Discretionary, which make up a further 27% of the underlying index.
Worst Performing Holding: L&G Japan Index Fund, which returned -0.6% during the quarter. Japan was the worst performing region for equities during Q2. Despite Covid case numbers remaining relatively low compared to most other nations, the slow vaccination programme continued to attract further criticism. Investor sentiment was also negatively impacted by the extension of tight lockdown restrictions in the Tokyo region and the release of poor GDP growth figures for Q1.
Portfolio Changes: We took the decision to marginally increase exposure to European Equities when the portfolio was rebalanced in line with the model weightings at the end of the quarter. This was in light of the improving outlook for the region, as both vaccination programmes and wider global economic recovery gathered pace.
Looking Ahead: In a period of continuing volatility, the performance was behind the benchmark. However, we believe it is important to look through quarterly movements, positive or negative, and focus on the portfolio’s long-term objectives. We believe that, on that basis, the portfolio is well placed to provide an attractive long-term total return, through a blend of passive and active investment strategies, within an above average risk profile.
18.1% 2.0% 3.3% 6.2% - - 12.7%
15.4% -0.5% 3.5% 4.9% 14.4% 42.6% 10.3%

For further information about any of the areas included in this or any of our other strategies in the Portfolio Management Service please contact your Financial Adviser.
Tel: 0117 452 1207E-mail: [email protected]
Website: www.whitechurch.co.uk
Whitechurch Securities Ltd, The Old Chapel, 14 Fairview Drive, Redland, Bristol, BS6 6PH. Whitechurch Securities Ltd is authorised and regulated by the Financial Conduct Authority.
This fact sheet is intended to provide information of a general nature and does not represent a personal recommendation of the service. If you are unsure, seek professional advice before making an investment. Whilst we have made great efforts to ensure complete accuracy we cannot accept responsibility for inaccuracies. The past is not necessarily a guide to future performance. The value of investments and any income produced can go down as well as up and you may not get back the full amount invested. Levels and bases of, and reliefs from, taxation are subject to change.
FP3225.26.07.21
Asset allocation - Portfolio breakdown (at 30th June 2021)
Current holdings
Source: Financial Express 30th June 2021. Asset allocation numbers may not add up to 100% due to rounding. Negative asset allocation can occur due to the underlying positions employing hedging strategies.
For further information about any of the areas included in this or any of our other strategies in the Portfolio Management Service please contact your Financial Adviser.
Other strategies under the Portfolio Management Service• Dynamic Defensive Strategy 3/10 - Low Risk *• Dynamic Cautious Strategy 4/10 - Low Risk *• Cautious Growth Strategy 4/10 - Cautious
• Dynamic Balanced Strategy 5/10 - Medium
• Monthly Distribution Strategy 5/10 - Medium
• Ethical Balanced Strategy 5/10 - Medium
• Global Income & Growth Strategy 6/10 - Above Average
• Dynamic Growth Strategy 7/10 - High Risk *• Stockmarket Growth Strategy 7/10 - High Risk
• Energy & Global Shift Strategy 8/10 - Aggressive
Risk Profile 6/10 - Above Average
This strategy is focused towards investors who accept a higher degree of risk whilst looking to enhance returns. This strategy will invest up to a maximum of 80% in equities with the aim of enhancing returns over the medium to long-term and combating inflation. Investors accept that the overall portfolio will show losses over certain periods but are accepting a higher level of risk in return for a potentially higher return over the long term.
Whitechurch Risk Ratings
Risk is defined as the risk to the capital or original investment (based on a minimum 5 year investment term). Whitechurch provides a risk rating of portfolios on a scale of 1 to 10 (1 being the lowest risk and 10 being the highest risk). Full guidelines are available in the Whitechurch Portfolio Management Service brochure.
• Fidelity UK Index• Gravis Clean Energy• HSBC European Index• HSBC FTSE 250 Index• HSBC Pacific Index• iShares Emerging Markets Equity Index• Jupiter Corporate Bond• L&G Global inflation Linked Bond Index • L&G Japan Index• L&G Short Dated Sterling Corporate Bond
Index• L&G US Index• Vanguard FTSE Developed World ex UK
Equity Index• Vanguard FTSE UK Equity Income Index • Cash
UK Equity 27.4%
Global Developed Equity 37.5%
Global Emerging Equity 10.4%
UK Fixed Income 2.7%
Global Developed Fixed Income 15.7%
Renewable Energy 2.0%
Cash & Money Market 4.4%

www.whitechurch.co.uk
Q2 - 2021
Key FactsAs at 30th June 2021
Source: FE Analytics, Whitechurch Securities. Performance figures are calculated net of fees in sterling. Unit Trust prices are calculated on a bid-to-bid basis. OEICs & Investment Trust prices are calculated on a mid-to-mid basis, with net income reinvested. The past is not necessarily a guide to future performance. The value of investments and any income will fluctuate and investors may not get back the full amount invested. Currency exchange rates may affect the value of investment. Benchmark figures are based on ARC estimates and are subject to revision.
Performance Table 0-12m 12-24m 24-36m 36-48m 48-60m5 Year
CumulativeVolatility (3 Years)
PMS Dynamic Growth - Risk 7
ARC £ Equity Risk PCI
Portfolio Management Service - Dynamic Growth
Key objectives This strategy is focused towards providing long-term growth from a globally diversified stockmarket focused portfolio. This will be primarily made up of index tracking ‘passive’ funds, with a strict limit on exposure to active funds capped at 20%, as minimising charges is of paramount importance. The mix of funds will be actively managed based on the Whitechurch investment team views.
NB: This strategy is available directly from Whitechurch and through external platforms.
Investment manager’s comment
Launch date - 1st September 2012
Minimum investments• If investing directly with Whitechurch: - Lump sum £3,000 (incl. transfers) - Regular savings £100 per month• Different minimum amounts may apply if
investing through a platform
Whitechurch Initial Fee0% of amount invested
Whitechurch Annual Management Fee*• If investing directly with Whitechurch the fee is
0.10% per annum of the portfolio value (+VAT)• If investing through a platform the fee is 0.20%
per annum of the portfolio value (+VAT)
Custodian Fee*• If investing directly with Whitechurch the
custodian fee is 0.40% per annum of the portfolio value (charged monthly).This is capped at £1,000
• If investing through a platform there will be no Whitechurch custodian fee, however, a platform fee may apply
Advisory Fees*To be agreed with Financial Adviser
IncomeIncome generated can be withdrawn or reinvested back into the portfolio.
* Please refer to the direct or platform service brochure for full details of charges.
Please note underlying fund charges are in addition to the charges listed above.
Looking Back: The strategy delivered a total return of 3.6% which was behind the ARC £ Equity Risk PCI benchmark return of 5.4%.
Best Performing Holding: L&G US Index Fund, which returned 8.1% in the quarter. This reflected the strong performance of the US market. The asset class continued its recovery, further boosted by the pace of vaccinations and stronger than expected corporate earnings. The latter helped technology stocks, which make up 28% of the fund, bounce back strongly after a relatively weak Q1. Two other notable sector contributors during the period were Healthcare and Consumer Discretionary, which make up a further 27% of the underlying index.
Worst Performing Holding: L&G Japan Index Fund, which returned -0.6% during the quarter. Japan was the worst performing region for equities during Q2. Despite Covid case numbers remaining relatively low compared to most other nations, the slow vaccination programme continued to attract further criticism. Investor sentiment was also negatively impacted by the extension of tight lockdown restrictions in the Tokyo region and the release of poor GDP growth figures for Q1.
Portfolio Changes: We took the decision to marginally increase exposure to European Equities when the portfolio was rebalanced in line with the model weightings at the end of the quarter. This was in light of the improving outlook for the region, as both vaccination programmes and wider global economic recovery gathered pace.
Looking Ahead: In a period of continuing volatility, the performance was behind the benchmark. However, we believe it is important to look through quarterly movements, positive or negative, and focus on the portfolio’s long-term objectives. We believe that, on that basis, the portfolio is well placed to provide an attractive long-term total return, through a blend of passive and active investment strategies, within a higher risk profile.
21.9% -2.0% 3.1% 7.5% 23.0% 62.8% 14.3%
20.2% -1.1% 4.0% 6.4% 17.0% 53.9% 12.5%

For further information about any of the areas included in this or any of our other strategies in the Portfolio Management Service please contact your Financial Adviser.
Tel: 0117 452 1207E-mail: [email protected]
Website: www.whitechurch.co.uk
Whitechurch Securities Ltd, The Old Chapel, 14 Fairview Drive, Redland, Bristol, BS6 6PH. Whitechurch Securities Ltd is authorised and regulated by the Financial Conduct Authority.
This fact sheet is intended to provide information of a general nature and does not represent a personal recommendation of the service. If you are unsure, seek professional advice before making an investment. Whilst we have made great efforts to ensure complete accuracy we cannot accept responsibility for inaccuracies. The past is not necessarily a guide to future performance. The value of investments and any income produced can go down as well as up and you may not get back the full amount invested. Levels and bases of, and reliefs from, taxation are subject to change.
FP3225.26.07.21
Asset allocation - Portfolio breakdown (at 30th June 2021)
Current holdings
Source: Financial Express 30th June 2021. Asset allocation numbers may not add up to 100% due to rounding. Negative asset allocation can occur due to the underlying positions employing hedging strategies.
For further information about any of the areas included in this or any of our other strategies in the Portfolio Management Service please contact your Financial Adviser.
Other strategies under the Portfolio Management Service • Dynamic Defensive Strategy 3/10 - Low Risk *• Dynamic Cautious Strategy 4/10 - Low Risk *• Cautious Growth Strategy 4/10 - Cautious
• Dynamic Balanced Strategy 5/10 - Medium
• Monthly Distribution Strategy 5/10 - Medium
• Ethical Balanced Strategy 5/10 - Medium
• Dynamic Steady Growth Strategy 6/10 - Above Average *• Global Income & Growth Strategy 6/10 - Above Average
• Stockmarket Growth Strategy 7/10 - High Risk
• Energy & Global Shift Strategy 8/10 - Aggressive
Risk Profile 7/10 - High Risk
This is a higher risk strategy that can invest up to 100% of monies into stockmarket investments. Consequently, investors must accept that it may experience material fluctuations and losses of capital do occur over certain time periods. In this strategy there may be additional risks such as stock specific risk from direct equity exposure and currency fluctuations via investment in overseas markets. Investors accept a higher level of risk with a view to potentially receiving higher returns over the long term.
Whitechurch Risk Ratings
Risk is defined as the risk to the capital or original investment (based on a minimum 5 year investment term). Whitechurch provides a risk rating of portfolios on a scale of 1 to 10. (1 being the lowest risk and 10 being the highest risk). Full guidelines are available in the Whitechurch Portfolio Management Service brochure.
• Fidelity UK Index
• Gravis Clean Energy
• HSBC European Index
• HSBC FTSE 250 Index
• HSBC Pacific Index
• iShares Emerging Markets Equity Index
• L&G Global inflation Linked Bond Index
• L&G Japan Index
• L&G US Index
• Vanguard FTSE Developed World ex UK
Equity Index
• Vanguard FTSE UK Equity Income Index
• Vanguard Global Small-Cap Index
• Cash
UK Equity 30.8%
Global Developed Equity 46.4%
Global Emerging Equity 10.9%
Global Developed Fixed Income 6.0%
Renewable Energy 2.0%
Cash & Money Market 3.9%

www.whitechurch.co.uk
Q2 - 2021
Key FactsAs at 30th June 2021
Source: FE Analytics, Whitechurch Securities. Performance figures are calculated net of fees in sterling. Unit Trust prices are calculated on a bid-to-bid basis. OEICs & Investment Trust prices are calculated on a mid-to-mid basis, with net income reinvested. The past is not necessarily a guide to future performance. The value of investments and any income will fluctuate and investors may not get back the full amount invested. Currency exchange rates may affect the value of investment. Benchmark figures are based on ARC estimates and are subject to revision.
Portfolio Management Service - Cautious Growth
Key objectivesThe strategy aims to generate medium-term positive returns, through investing in a range of investment strategies that have potential to generate positive returns, irrespective of market conditions. The portfolio will aim to operate with a lower risk than more traditional approaches to portfolio management, which tend to be largely dependent on the performance of equity markets.
Launch date10th March 2009
Minimum investment • Direct Portfolio - £3,000• ISA - £3,000 (including transfers) • £100 per month (ISA, Direct Portfolio)
Whitechurch Initial Fee0% of amount invested
Whitechurch Annual Management Fee*0.65% per annum of the portfolio value (+VAT)
Whitechurch Custodian Fee*0.52% per annum of portfolio value(charged monthly). Capped at £1,300
Advisory Fees*To be agreed with Financial Adviser
Risk Rating 4/10 - Cautious
* Please refer to brochure for full details of charges
Please note underlying fund charges are in addition to the charges listed above.
Performance Table 0-12m 12-24m 24-36m 36-48m 48-60m5 Year
CumulativeVolatility (3
Years)
PMS Cautious Growth - Risk 4
ARC £ Cautious PCI
Investment manager’s commentLooking Back: The strategy delivered a total return of 3.5% which was ahead of the ARC £ Cautious PCI benchmark return of 2.3%.
Best Performing Holding: Vanguard FTSE Developed World ex-UK Equity Index, which returned 7.5% during the quarter. This reflected the continued strong recovery of global equities this year. The asset class was boosted by the pace of vaccination programmes and stronger than expected corporate earnings – particularly the latter in the US. Another tailwind for the fund was the performance of European equities which was the second best performing region after US equities.
Worst Performing Holding: TwentyFour Absolute Return Credit, which returned 0.9% during the quarter. Broadly speaking, Fixed Income as an asset class underperformed their equity counterparts, as the economic recovery continued to gather pace. Government bonds also continued to sell off in some regions, as vaccination progress boosted expectations for economic growth and inflation, in turn increasing yields.
Portfolio Changes: As well as rebalancing the portfolio in line with model weightings, we sold our position in the TB Evenlode Global Income Fund. The fund had been under review for some time and we concluded that there are stronger global equity funds available. We used the sale proceeds to take up a holding in the Fundsmith Equity Fund, a growth-orientated fund we hold widely across our strategies.
Looking Ahead: In a period of considerable market uncertainty, the performance was ahead of the benchmark. However, we believe it is important to look through quarterly movements, positive or negative, and focus on the portfolio’s long-term objectives. We believe that, on that basis, the portfolio is well placed to deliver an attractive long-term total return, with an emphasis on capital growth, within a cautious risk profile.
7.1% -3.5% -0.5% -1.3% -1.0% 0.4% 7.7%
7.1% 1.7% 2.4% 1.4% 6.5% 20.4% 5.0%

For further information about any of the areas included in this or any of our other strategies in the Portfolio Management Service please contact your Financial Adviser.
Tel: 0117 452 1207E-mail: [email protected]
Website: www.whitechurch.co.uk
Whitechurch Securities Ltd, The Old Chapel, 14 Fairview Drive, Redland, Bristol, BS6 6PH. Whitechurch Securities Ltd is authorised and regulated by the Financial Conduct Authority.
This fact sheet is intended to provide information of a general nature and does not represent a personal recommendation of the service. If you are unsure, seek professional advice before making an investment. Whilst we have made great efforts to ensure complete accuracy we cannot accept responsibility for inaccuracies. The past is not necessarily a guide to future performance. The value of investments and any income produced can go down as well as up and you may not get back the full amount invested. Levels and bases of, and reliefs from, taxation are subject to change.
FP3225.26.07.21
Asset allocation - Portfolio breakdown (at 30th June 2021)
Current holdings
Source: Financial Express 30th June 2021. Asset allocation numbers may not add up to 100% due to rounding. Negative asset allocation can occur due to the underlying positions employing hedging strategies.
For further information about any of the areas included in this or any of our other strategies in the Portfolio Management Service please contact your Financial Adviser.
Risk Profile 4/10 - Cautious
This is a cautious strategy, whereby the majority of the portfolio will be in lower risk investments. This strategy will invest up to a maximum of 35% in equities with the aim of enhancing returns over the medium to long-term and combating inflation. Investors accept that the overall portfolio will show losses over certain periods but are accepting a degree of risk in return for a potentially higher return over the long term.
Whitechurch Risk Ratings
Risk is defined as the risk to the capital or original investment (based on a minimum 5 year investment term). Whitechurch provides a risk rating of portfolios on a scale of 1 to 10 (1 being the lowest risk and 10 being the highest risk). Full guidelines are available in the Whitechurch Portfolio Management Service brochure.
Other strategies under the Portfolio Management Service• Dynamic Defensive Strategy 3/10 - Low Risk
• Dynamic Cautious Strategy 4/10 - Low Risk
• Monthly Distribution Strategy 5/10 - Medium
• Dynamic Balanced Strategy 5/10 - Medium
• Ethical Balanced Strategy 5/10 - Medium
• Dynamic Steady Growth Strategy 6/10 - Above Average
• Global Income & Growth Strategy 6/10 - Above Average
• Dynamic Growth Strategy 7/10 - High Risk
• Stockmarket Growth Strategy 7/10 - High Risk
• Energy & Global Shift Strategy 8/10 - Aggressive
• CG Real Return
• Fidelity UK Index
• Franklin UK Equity Income
• Fundsmith Equity
• Jupiter Corporate Bond
• RM Alternative Income
• TwentyFour Absolute Return Credit
• TwentyFour Corporate Bond
• Vanguard FTSE Developed World ex UK
Equity Index
• Cash
UK Equity 18.8%
Global Developed Equity 16.0%
Global Emerging Equity 0.2%
UK Fixed Income 18.0%
Global Developed Fixed Income 30.7%
Property 2.7%
Renewable Energy 1.7%
Alternative 0.3%
Other 0.3%
Cash & Money Market 11.4%

www.whitechurch.co.uk
Q2 - 2021
Key FactsAs at 30th June 2021
Source: FE Analytics, Whitechurch Securities. Performance figures are calculated net of fees in sterling. Unit Trust prices are calculated on a bid-to-bid basis. OEICs & Investment Trust prices are calculated on a mid-to-mid basis, with net income reinvested. The past is not necessarily a guide to future performance. The value of investments and any income will fluctuate and investors may not get back the full amount invested. Currency exchange rates may affect the value of investment. Benchmark figures are based on ARC estimates and are subject to revision.
Performance Table 0-12m 12-24m 24-36m 36-48m 48-60m5 Year
CumulativeVolatility (3 Years)
PMS Monthly Distribution - Risk 5
ARC £ Balanced Asset PCI
Portfolio Management Service - Monthly DistributionKey objectivesThis strategy is aimed at long-term investors seeking a sustainable level of above average income and genuine prospects for capital growth. The strategy provides access to a balanced portfolio of collective investments, investing in equity, property and fixed interest funds. The strategy aims to provide an initial target yield of 4% gross. Income can be paid out monthly or reinvested. There is also the facility to receive fixed regular withdrawals.
Launch date10th March 2003
Minimum investment • Direct Portfolio - £3,000• ISA - £3,000 (including transfers) • £100 per month (ISA, Direct Portfolio)
Whitechurch Initial Fee0% of amount invested
Whitechurch Annual Management Fee*0.65% per annum of the portfolio value (+VAT)
Whitechurch Custodian Fee*0.52% per annum of portfolio value(charged monthly). Capped at £1,300
Advisory Fees*To be agreed with Financial Adviser
Income Current target gross yield of 4%, distributed monthly or reinvested back into the portfolio
Risk Rating 5/10 - Medium
* Please refer to brochure for full details of charges
Please note underlying fund charges are in addition to the charges listed above.
Investment manager’s comment
Looking Back: The strategy delivered a total return of 2.1% which was behind the ARC £ Balanced Asset PCI benchmark return of 3.5%.
Best Performing Holding: Schroder UK-listed Equity Income Maximiser Fund, which returned 5.5% in the quarter. This reflected the strong performance of the FTSE-100 which was boosted both by the continued success of the UK’s vaccination programme and the $1.9trn US fiscal stimulus announced in Q1. Notable contribution during the period came from defensive sectors, such as Healthcare and Utilities, as well as cyclical sectors such as Industrials and Real Estate. Investor sentiment towards UK Equities was also helped by encouraging economic data, such as rising retail sales and an upward revision of the UK’s GDP growth forecast for 2021.
Worst Performing Holding: Aegon Property Income Fund, which returned -4.3% during the quarter. Despite the recent resurgence of the IA UK Direct Property Sector, commercial property has been one of the casualties of the coronavirus epidemic, which has had an adverse effect on both property valuations and demand. During the quarter, Aegon announced that, in the best interest of clients, they will be closing the fund, with the proceeds to be returned to investors as soon as practicable.
Portfolio Changes: As well as rebalancing the portfolio in line with the model weightings, we took the opportunity to sell out of the Newton Global Income Fund in favour of the RWC Global Income Fund. The decision was made in order to maintain continuity of fund management following the departure of Nick Clay and his team from Newton. They will be adopting the same management style at RWC, and on balance, we favour the team’s experience managing equity income strategies. We also exited our position in the TB Evenlode Global Fund. The fund had been under review for some time and we concluded that there are stronger global equity funds available. We used the sale proceeds to increase the size of an existing holding, the Fidelity Global Dividend Fund.
Looking Ahead: In a period of considerable market uncertainty, the performance was behind the benchmark. However, we believe it is important to look through quarterly movements, positive or negative, and focus on the portfolio’s long-term objectives. We believe that, on that basis, the portfolio is well placed to deliver an attractive long-term total return, through a blend of income and capital growth, within a balanced risk profile.
7.4% -7.2% -0.6% -1.3% 8.8% 6.4% 9.5%
11.5% 0.5% 2.7% 3.0% 10.6% 31.1% 7.9%
For further information about any of the areas included in this or any of our other strategies in the Portfolio Management Service please contact your Financial Adviser.
Tel: 0117 452 1207E-mail: [email protected]
Website: www.whitechurch.co.uk
Whitechurch Securities Ltd, The Old Chapel, 14 Fairview Drive, Redland, Bristol, BS6 6PH. Whitechurch Securities Ltd is authorised and regulated by the Financial Conduct Authority.
This fact sheet is intended to provide information of a general nature and does not represent a personal recommendation of the service. If you are unsure, seek professional advice before making an investment. Whilst we have made great efforts to ensure complete accuracy we cannot accept responsibility for inaccuracies. The past is not necessarily a guide to future performance. The value of investments and any income produced can go down as well as up and you may not get back the full amount invested. Levels and bases of, and reliefs from, taxation are subject to change.
FP3225.26.07.21
Asset allocation - Portfolio breakdown (at 30th June 2021)
Current holdings
Source: Financial Express 30th June 2021. Asset allocation numbers may not add up to 100% due to rounding. Negative asset allocation can occur due to the underlying positions employing hedging strategies.
For further information about any of the areas included in this or any of our other strategies in the Portfolio Management Service please contact your Financial Adviser.
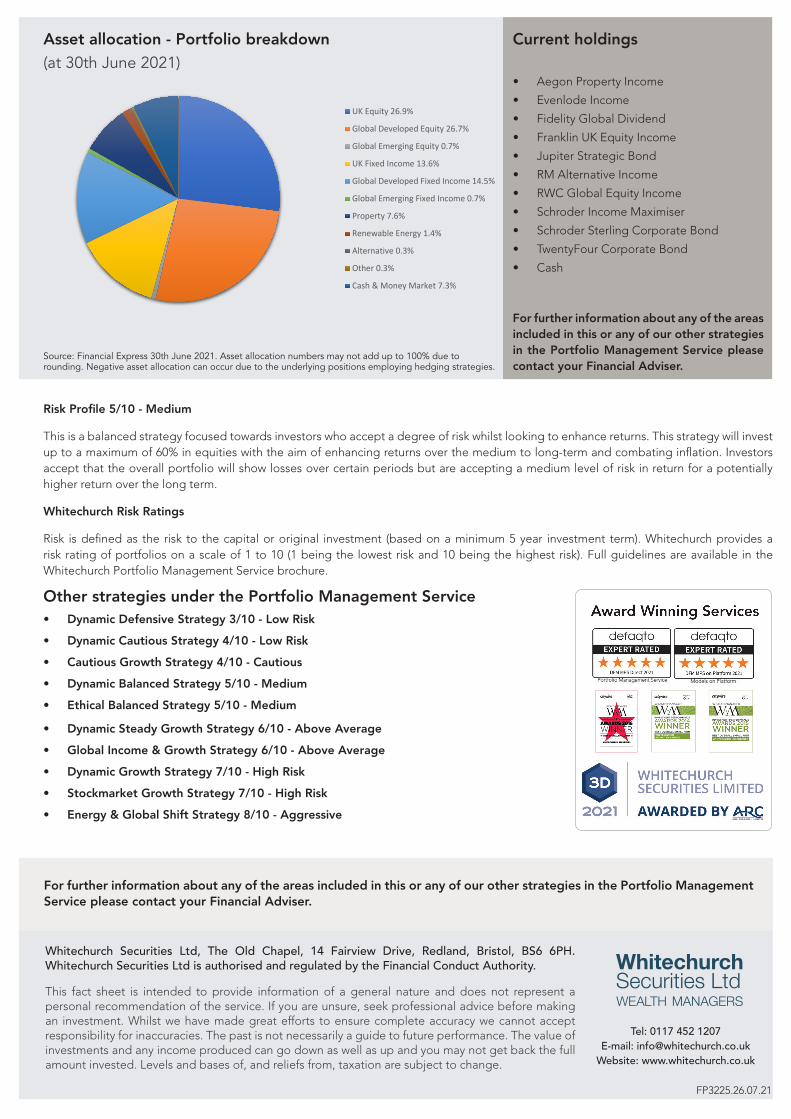
Risk Profile 5/10 - Medium
This is a balanced strategy focused towards investors who accept a degree of risk whilst looking to enhance returns. This strategy will invest up to a maximum of 60% in equities with the aim of enhancing returns over the medium to long-term and combating inflation. Investors accept that the overall portfolio will show losses over certain periods but are accepting a medium level of risk in return for a potentially higher return over the long term.
Whitechurch Risk Ratings
Risk is defined as the risk to the capital or original investment (based on a minimum 5 year investment term). Whitechurch provides a risk rating of portfolios on a scale of 1 to 10 (1 being the lowest risk and 10 being the highest risk). Full guidelines are available in the Whitechurch Portfolio Management Service brochure.
Other strategies under the Portfolio Management Service• Dynamic Defensive Strategy 3/10 - Low Risk
• Dynamic Cautious Strategy 4/10 - Low Risk
• Cautious Growth Strategy 4/10 - Cautious
• Dynamic Balanced Strategy 5/10 - Medium
• Ethical Balanced Strategy 5/10 - Medium
• Dynamic Steady Growth Strategy 6/10 - Above Average
• Global Income & Growth Strategy 6/10 - Above Average
• Dynamic Growth Strategy 7/10 - High Risk
• Stockmarket Growth Strategy 7/10 - High Risk
• Energy & Global Shift Strategy 8/10 - Aggressive
• Aegon Property Income
• Evenlode Income
• Fidelity Global Dividend
• Franklin UK Equity Income
• Jupiter Strategic Bond
• RM Alternative Income
• RWC Global Equity Income
• Schroder Income Maximiser
• Schroder Sterling Corporate Bond
• TwentyFour Corporate Bond
• Cash
UK Equity 26.9%
Global Developed Equity 26.7%
Global Emerging Equity 0.7%
UK Fixed Income 13.6%
Global Developed Fixed Income 14.5%
Global Emerging Fixed Income 0.7%
Property 7.6%
Renewable Energy 1.4%
Alternative 0.3%
Other 0.3%
Cash & Money Market 7.3%

www.whitechurch.co.uk
Q2 - 2021
Key FactsAs at 30th June 2021
Source: FE Analytics, Whitechurch Securities. Performance figures are calculated net of fees in sterling. Unit Trust prices are calculated on a bid-to-bid basis. OEICs & Investment Trust prices are calculated on a mid-to-mid basis, with net income reinvested. The past is not necessarily a guide to future performance. The value of investments and any income will fluctuate and investors may not get back the full amount invested. Currency exchange rates may affect the value of investment. Benchmark figures are based on ARC estimates and are subject to revision.
Key objectivesThis strategy is aimed at long-term investors seeking income together with attractive prospects for capital growth. The strategy provides access to collective investments within a globally diversified managed portfolio investing in equity income funds and other asset classes. The strategy aims to provide an initial target yield of 3.5% gross. Income can be paid out quarterly or reinvested.
Launch date15th February 2006
Minimum investment • Direct Portfolio - £3,000• ISA - £3,000 (including transfers) • £100 per month (ISA, Direct Portfolio)
Whitechurch Initial Fee0% of amount invested
Whitechurch Annual Management Fee*0.65% per annum of the portfolio value (+VAT)
Whitechurch Custodian Fee*0.52% per annum of portfolio value(charged monthly). Capped at £1,300
Advisory Fees*To be agreed with Financial Adviser
Income Current target gross yield of 3.5%, distributed quarterly or reinvested back into the portfolio
Risk Rating 6 /10 - Above Average
* Please refer to brochure for full details of charges
Please note underlying fund charges are in addition to the charges listed above.
Performance Table 0-12m 12-24m 24-36m 36-48m 48-60m5 Year
CumulativeVolatility (3
Years)
PMS Global Income & Growth - Risk 6
ARC £ Steady Growth PCI
Portfolio Management Service - Global Income and Growth
Investment manager’s comment
Looking Back: The strategy delivered a total return of 4.4% which was in line with the ARC £ Steady Growth PCI benchmark return of 4.4%.
Best Performing Holding: Fundsmith Equity Fund, which returned 9.0% in the quarter. This reflected the continued strong recovery of global equities this year. The asset class was boosted by the pace of vaccination programmes and stronger than expected corporate earnings. The latter, particularly in the US, saw technology stocks bounce back strongly after a relatively weak Q1. The fund was a major beneficiary, with 72% of underlying assets invested in the US, and technology as its largest underlying sector exposure.
Worst Performing Holding: Baillie Gifford Japanese Income Growth Fund, which returned -2.2% in the quarter. Japan was the worst performing region for equities during Q2. Despite Covid case numbers remaining relatively low compared to most other nations, the slow vaccination programme continued to attract further criticism. Investor sentiment was also negatively impacted by the extension of tight lockdown restrictions in the Tokyo region and the release of poor GDP growth figures for Q1.
Portfolio Changes: There were no portfolio changes in the quarter, however the portfolio was rebalanced in line with the model weightings.
Looking Ahead: In a period of considerable market uncertainty, the performance was in line with the benchmark. However, we believe it is important to look through quarterly movements, positive or negative, and focus on the portfolio’s long-term objectives. We believe that, on that basis, the portfolio is well placed to deliver an attractive long-term total return, through a blend of income and capital growth, within an above average risk profile.
14.3% 1.2% 2.3% 2.6% 14.9% 39.5% 10.6%
15.4% -0.5% 3.5% 4.9% 14.4% 42.6% 10.3%

For further information about any of the areas included in this or any of our other strategies in the Portfolio Management Service please contact your Financial Adviser.
Tel: 0117 452 1207E-mail: [email protected]
Website: www.whitechurch.co.uk
Whitechurch Securities Ltd, The Old Chapel, 14 Fairview Drive, Redland, Bristol, BS6 6PH. Whitechurch Securities Ltd is authorised and regulated by the Financial Conduct Authority.
This fact sheet is intended to provide information of a general nature and does not represent a personal recommendation of the service. If you are unsure, seek professional advice before making an investment. Whilst we have made great efforts to ensure complete accuracy we cannot accept responsibility for inaccuracies. The past is not necessarily a guide to future performance. The value of investments and any income produced can go down as well as up and you may not get back the full amount invested. Levels and bases of, and reliefs from, taxation are subject to change.
FP3225.26.07.21
Asset allocation - Portfolio breakdown (at 30th June 2021)
Current holdings
Source: Financial Express 30th June 2021. Asset allocation numbers may not add up to 100% due to rounding. Negative asset allocation can occur due to the underlying positions employing hedging strategies.
For further information about any of the areas included in this or any of our other strategies in the Portfolio Management Service please contact your Financial Adviser.
Risk Profile 6/10 - Above Average Risk
This is an above average risk strategy that will have up to 80% of the portfolio invested in stockmarket investments. The aim of the strategy is to provide higher total returns over the medium to long-term, whilst accepting that losses of capital do occur over certain time periods. In this strategy there may be additional risks such as currency fluctuations via investment in overseas markets.
Whitechurch Risk Ratings
Risk is defined as the risk to the capital or original investment (based on a minimum 5 year investment term). Whitechurch provides a risk rating of portfolios on a scale of 1 to 10 (1 being the lowest risk and 10 being the highest risk). Full guidelines are available in the Whitechurch Portfolio Management Service brochure.
Other strategies under the Portfolio Management Service• Dynamic Defensive Strategy 3/10 - Low Risk
• Dynamic Cautious Strategy 4/10 - Low Risk
• Cautious Growth Strategy 4/10 - Cautious
• Monthly Distribution Strategy 5/10 - Medium
• Dynamic Balanced Strategy 5/10 - Medium
• Ethical Balanced Strategy 5/10 - Medium
• Dynamic Steady Growth Strategy 6/10 - Above Average
• Dynamic Growth Strategy 7/10 - High Risk
• Stockmarket Growth Strategy 7/10 - High Risk
• Energy & Global Shift Strategy 8/10 - Aggressive
• Baillie Gifford Japan Income Growth
• CG Real Return
• Evenlode Income
• Franklin UK Equity Income
• Fundsmith Equity
• Hermes Global Emerging Markets
• Legg Mason IF Brandywine Global Income
Optimiser
• Schroder European Alpha Income
• Schroder US Equity Income Maximiser
• TwentyFour Corporate Bond
• Vanguard FTSE Developed World ex UK
Equity Index
• Cash
UK Equity 22.7%
Global Developed Equity 41.7%
Global Emerging Equity 7.4%
UK Fixed Income 6.8%
Global Developed Fixed Income 16.6%
Global Emerging Fixed Income 0.3%
Cash & Money Market 4.4%

www.whitechurch.co.uk
Q2 - 2021
Key FactsAs at 30th June 2021
Source: FE Analytics, Whitechurch Securities. Performance figures are calculated net of fees in sterling. Unit Trust prices are calculated on a bid-to-bid basis. OEICs & Investment Trust prices are calculated on a mid-to-mid basis, with net income reinvested. The past is not necessarily a guide to future performance. The value of investments and any income will fluctuate and investors may not get back the full amount invested. Currency exchange rates may affect the value of investment. Benchmark figures are based on ARC estimates and are subject to revision.
Key objectivesThis strategy will seek above average long-term capital growth from a well diversified portfolio of stockmarket investments. The strategy will provide a core exposure to the UK stockmarket together with a mix of the best opportunities offered by funds exposed to overseas markets.
Portfolio Management Service - Stockmarket Growth
Performance Table 0-12m 12-24m 24-36m 36-48m 48-60m5 Year
CumulativeVolatility (3 Years)
PMS Stockmarket Growth - Risk 7
ARC £ Equity Risk PCI
Launch date15th October 2003
Minimum investment • Direct Portfolio - £3,000• ISA - £3,000 (including transfers) • £100 per month (ISA, Direct Portfolio)
Whitechurch Initial Fee0% of amount invested
Whitechurch Annual Management Fee*0.65% per annum of the portfolio value (+VAT)
Whitechurch Custodian Fee*0.52% per annum of portfolio value(charged monthly). Capped at £1,300 Advisory Fees*To be agreed with Financial Adviser
Risk Rating 7/10 - High
*Please refer to brochure for full details of charges
Please note underlying fund charges are in addition to the charges listed above.
Investment manager’s comment
Looking Back: The strategy delivered a total return of 5.3% which was just behind the ARC £ Equity Risk PCI benchmark return of 5.4%.
Best Performing Holding: Baillie Gifford Positive Change, which returned 13.5% in the quarter. The fund has 73% of its assets invested in US and European equities, which were the two best performing regions during Q2. Specifically, the fund’s top three sector exposures are Healthcare, Consumer Discretionary and Information Technology, which collectively account for 67% of the underlying companies held in the fund. All three were standout contributors to performance during the period.
Worst Performing Holding: Baillie Gifford Japanese Income Growth Fund, which returned -2.2% in the quarter. Japan was the worst performing region for equities during Q2. Despite Covid case numbers remaining relatively low compared to most other nations, the slow vaccination programme continued to attract further criticism. Investor sentiment was also negatively impacted by the extension of tight lockdown restrictions in the Tokyo region and the release of poor GDP growth figures for Q1.
Portfolio Changes: There were no portfolio changes in the quarter, however the portfolio was rebalanced in line with the model weightings.
Looking Ahead: In a period of considerable market uncertainty, the performance was just behind the benchmark. However, we believe it is important to look through quarterly movements, positive or negative, and focus on the portfolio’s long-term objectives. We believe that, on that basis, the portfolio is well placed to deliver an attractive long-term total return, with an emphasis on capital growth, within a higher risk profile.
20.2% -1.1% 4.0% 6.4% 17.0% 53.9% 12.5%
24.9% 4.2% -0.8% 6.2% 21.1% 66.1% 14.7%

For further information about any of the areas included in this or any of our other strategies in the Portfolio Management Service please contact your Financial Adviser.
Tel: 0117 452 1207E-mail: [email protected]
Website: www.whitechurch.co.uk
Whitechurch Securities Ltd, The Old Chapel, 14 Fairview Drive, Redland, Bristol, BS6 6PH. Whitechurch Securities Ltd is authorised and regulated by the Financial Conduct Authority.
This fact sheet is intended to provide information of a general nature and does not represent a personal recommendation of the service. If you are unsure, seek professional advice before making an investment. Whilst we have made great efforts to ensure complete accuracy we cannot accept responsibility for inaccuracies. The past is not necessarily a guide to future performance. The value of investments and any income produced can go down as well as up and you may not get back the full amount invested. Levels and bases of, and reliefs from, taxation are subject to change.
FP3225.26.07.21
Asset allocation - Portfolio breakdown (at 30th June 2021)
Current holdings
Source: Financial Express 30th June 2021. Asset allocation numbers may not add up to 100% due to rounding. Negative asset allocation can occur due to the underlying positions employing hedging strategies.
For further information about any of the areas included in this or any of our other strategies in the Portfolio Management Service please contact your Financial Adviser.
Risk Profile 7/10 – High Risk
This is a higher risk strategy that can invest up to 100% of monies into stockmarket investments. Consequently, investors must accept that it may experience material fluctuations and losses of capital do occur over certain time periods. In this strategy there may be additional risks such as stock specific risk from direct equity exposure and currency fluctuations via investment in overseas markets. Investors accept a higher level of risk with a view to potentially receiving higher returns over the long term.
Whitechurch Risk Ratings
Risk is defined as the risk to the capital or original investment (based on a minimum 5 year investment term). Whitechurch provides a risk rating of portfolios on a scale of 1 to 10 (1 being the lowest risk and 10 being the highest risk). Full guidelines are available in the Whitechurch Portfolio Management Service brochure.
Other strategies under the Portfolio Management Service• Dynamic Defensive Strategy 3/10 - Low Risk
• Dynamic Cautious Strategy 4/10 - Low Risk
• Cautious Growth Strategy 4/10 - Cautious
• Monthly Distribution Strategy 5/10 - Medium
• Dynamic Balanced Strategy 5/10 - Medium
• Ethical Balanced Strategy 5/10 - Medium
• Dynamic Steady Growth Strategy 6/10 - Above Average
• Global Income & Growth Strategy 6/10 - Above Average
• Dynamic Growth Strategy 7/10 - High Risk
• Energy & Global Shift Strategy 8/10 - Aggressive
• Artemis US Smaller Companies
• Baillie Gifford Japan Income & Growth
• Baillie Gifford Positive Change
• CFP SDL UK Buffettology
• Crux European Special Situations
• Franklin UK Equity Income
• Fundsmith Equity
• Hermes Asia Ex Japan Equity
• Hermes Global Emerging Markets
• NinetyOne Global Environment
• Cash
UK Equity 28.9%
Global Developed Equity 55.2%
Global Emerging Equity 10.8%
Cash & Money Market 5.2%
www.whitechurch.co.uk
Q2 - 2021
Key FactsAs at 30th June 2021
Source: FE Analytics, Whitechurch Securities. Performance figures are calculated net of fees in sterling. Unit Trust prices are calculated on a bid-to-bid basis. OEICs & Investment Trust prices are calculated on a mid-to-mid basis, with net income reinvested. The past is not necessarily a guide to future performance. The value of investments and any income will fluctuate and investors may not get back the full amount invested. Currency exchange rates may affect the value of investment. Benchmark figures are based on ARC estimates and are subject to revision.
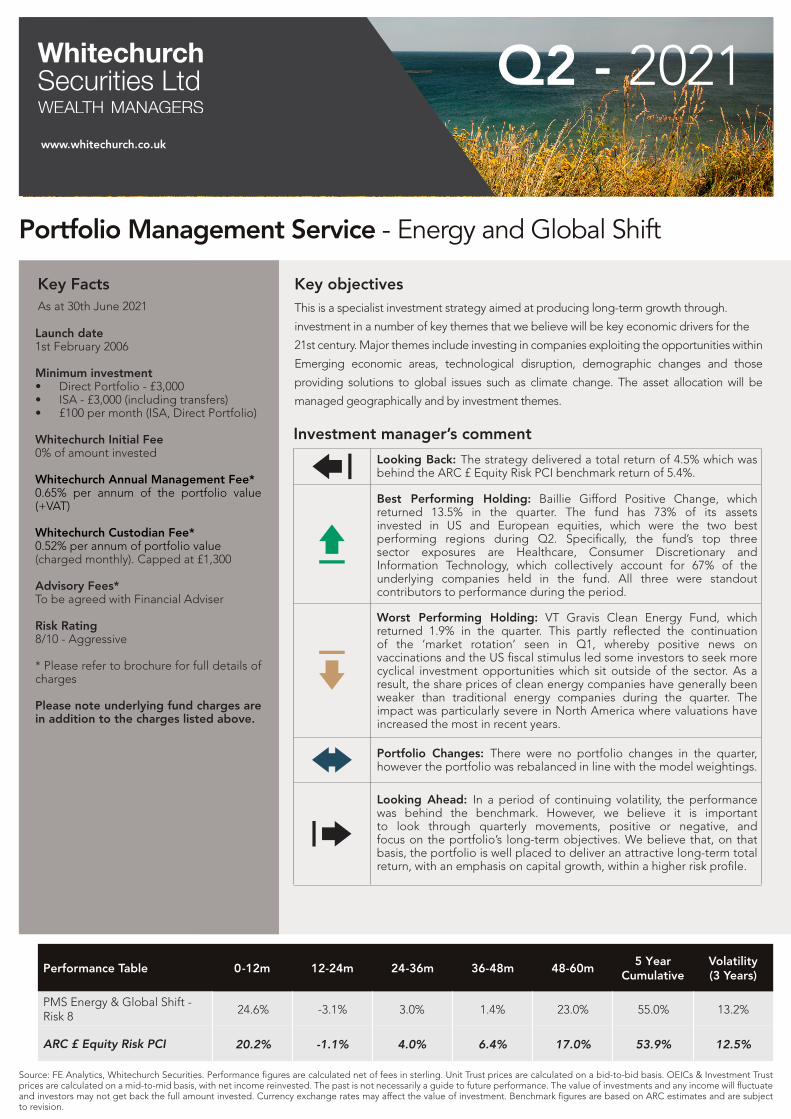
Key objectivesThis is a specialist investment strategy aimed at producing long-term growth through.
investment in a number of key themes that we believe will be key economic drivers for the
21st century. Major themes include investing in companies exploiting the opportunities within
Emerging economic areas, technological disruption, demographic changes and those
providing solutions to global issues such as climate change. The asset allocation will be
managed geographically and by investment themes.
Launch date1st February 2006
Minimum investment • Direct Portfolio - £3,000• ISA - £3,000 (including transfers)• £100 per month (ISA, Direct Portfolio)
Whitechurch Initial Fee0% of amount invested
Whitechurch Annual Management Fee*0.65% per annum of the portfolio value (+VAT)
Whitechurch Custodian Fee*0.52% per annum of portfolio value(charged monthly). Capped at £1,300 Advisory Fees*To be agreed with Financial Adviser
Risk Rating 8/10 - Aggressive
* Please refer to brochure for full details of charges
Please note underlying fund charges are in addition to the charges listed above.
Portfolio Management Service - Energy and Global Shift
Performance Table 0-12m 12-24m 24-36m 36-48m 48-60m5 Year
CumulativeVolatility (3 Years)
PMS Energy & Global Shift - Risk 8
ARC £ Equity Risk PCI
Investment manager’s comment
Looking Back: The strategy delivered a total return of 4.5% which was behind the ARC £ Equity Risk PCI benchmark return of 5.4%.
Best Performing Holding: Baillie Gifford Positive Change, which returned 13.5% in the quarter. The fund has 73% of its assets invested in US and European equities, which were the two best performing regions during Q2. Specifically, the fund’s top three sector exposures are Healthcare, Consumer Discretionary and Information Technology, which collectively account for 67% of the underlying companies held in the fund. All three were standout contributors to performance during the period.
Worst Performing Holding: VT Gravis Clean Energy Fund, which returned 1.9% in the quarter. This partly reflected the continuation of the ‘market rotation’ seen in Q1, whereby positive news on vaccinations and the US fiscal stimulus led some investors to seek more cyclical investment opportunities which sit outside of the sector. As a result, the share prices of clean energy companies have generally been weaker than traditional energy companies during the quarter. The impact was particularly severe in North America where valuations have increased the most in recent years.
Portfolio Changes: There were no portfolio changes in the quarter, however the portfolio was rebalanced in line with the model weightings.
Looking Ahead: In a period of continuing volatility, the performance was behind the benchmark. However, we believe it is important to look through quarterly movements, positive or negative, and focus on the portfolio’s long-term objectives. We believe that, on that basis, the portfolio is well placed to deliver an attractive long-term total return, with an emphasis on capital growth, within a higher risk profile.
24.6% -3.1% 3.0% 1.4% 23.0% 55.0% 13.2%
20.2% -1.1% 4.0% 6.4% 17.0% 53.9% 12.5%

For further information about any of the areas included in this or any of our other strategies in the Portfolio Management Service please contact your Financial Adviser.
Tel: 0117 452 1207E-mail: [email protected]
Website: www.whitechurch.co.uk
Whitechurch Securities Ltd, The Old Chapel, 14 Fairview Drive, Redland, Bristol, BS6 6PH. Whitechurch Securities Ltd is authorised and regulated by the Financial Conduct Authority.
This fact sheet is intended to provide information of a general nature and does not represent a personal recommendation of the service. If you are unsure, seek professional advice before making an investment. Whilst we have made great efforts to ensure complete accuracy we cannot accept responsibility for inaccuracies. The past is not necessarily a guide to future performance. The value of investments and any income produced can go down as well as up and you may not get back the full amount invested. Levels and bases of, and reliefs from, taxation are subject to change.
FP3225.26.07.21
Asset allocation - Portfolio breakdown (at 30th June 2021)
Current holdings
Source: Financial Express 30th June 2021. Asset allocation numbers may not add up to 100% due to rounding. Negative asset allocation can occur due to the underlying positions employing hedging strategies.
For further information about any of the areas included in this or any of our other strategies in the Portfolio Management Service please contact your Financial Adviser.
Risk Profile 8/10 - Aggressive
This is an aggressive strategy which will invest up to 100% of monies in specialist areas of the stockmarket and other high risk investment areas. Investors must accept that it may experience significant losses of capital over certain time periods. In this strategy there may be additional risks such as stock specific risk from direct equity exposure and currency fluctuations via investment in overseas markets. Investors accept a high level of risk with a view to potentially receiving higher returns over the long term.
Whitechurch Risk Ratings
Risk is defined as the risk to the capital or original investment (based on a minimum 5 year investment term). Whitechurch provides a risk rating of portfolios on a scale of 1 to 10. (1 being the lowest risk and 10 being the highest risk). Full guidelines are available in the Whitechurch Portfolio Management Service brochure.
Other strategies under the Portfolio Management Service• Dynamic Defensive Strategy 3/10 - Low Risk
• Dynamic Cautious Strategy 4/10 - Low Risk
• Cautious Growth Strategy 4/10 - Cautious
• Monthly Distribution Strategy 5/10 - Medium
• Dynamic Balanced Strategy 5/10 - Medium
• Ethical Balanced Strategy 5/10 - Medium
• Dynamic Steady Growth Strategy 6/10 - Above Average
• Global Income & Growth Strategy 6/10 - Above Average
• Dynamic Growth Strategy 7/10 - High Risk
• Stockmarket Growth Strategy 7/10 - High Risk
• Baillie Gifford Positive Change
• Fidelity EM Focus
• Gravis Clean Energy
• Hermes Asia Ex Japan Equity
• Impax Environmental Markets IT
• JPM Emerging Markets Income
• New India IT
• NinetyOne Global Environment
• Renewables Infrastructure Group
• Cash
UK Equity 8.8%
Global Developed Equity 32.3%
Global Emerging Equity 41.8%
Renewable Energy 3.3%
Other 10.0%
Cash & Money Market 3.8%