poqoprivredna tehnika - university of belgradejageng.agrif.bg.ac.rs/files/casopis/pt_01-2014.pdfthe...
TRANSCRIPT

ISSN 0554-5587 UDK 631 (059)
POQOPRIVREDNA TEHNIKA
AGRICULTURAL ENGINEERING НАУЧНИ ЧАСОПИС SCIENTIFIC JOURNAL
УНИВЕРЗИТЕТ У БЕОГРАДУ, ПОЉОПРИВРЕДНИ ФАКУЛТЕТ, ИНСТИТУТ ЗА ПОЉОПРИВРЕДНУ ТЕХНИКУ
UNIVERSITY OF BELGRADE, FACULTY OF AGRICULTURE, INSTITUTE OF AGRICULTURAL ENGINEERING
Година XXXIX Број 1, 2014. Year XXXIX, No. 1, 2014.

Издавач (Publisher) Универзитет у Београду, Пољопривредни факултет, Институт за пољопривредну технику, Београд-Земун University of Belgrade, Faculty of Agriculture, Institute of Agricultural Engineering, Belgrade-Zemun Уредништво часописа (Editorial board) Главни и одговорни уредник (Editor in Chief) др Горан Тописировић, професор, Универзитет у Београду, Пољопривредни факултет
Уредници (National Editors) др Ђукан Вукић, професор, Универзитет у Београду, Пољопривредни факултет др Стева Божић, професор, Универзитет у Београду, Пољопривредни факултет др Мирко Урошевић, професор, Универзитет у Београду, Пољопривредни факултет др Мићо Ољача, професор, Универзитет у Београду, Пољопривредни факултет др Анђелко Бајкин, професор, Универзитет у Новом Саду, Пољопривредни факултет др Милан Мартинов, професор, Универзитет у Новом Саду,Факултет техничких наука др Душан Радивојевић, професор, Универзитет у Београду, Пољопривредни факултет др Драган Петровић, професор, Универзитет у Београду, Пољопривредни факултет др Раде Радојевић, професор, Универзитет у Београду, Пољопривредни факултет др Милован Живковић, професор, Универзитет у Београду, Пољопривредни факултет др Зоран Милеуснић, професор, Универзитет у Београду, Пољопривредни факултет др Рајко Миодраговић, доцент, Универзитет у Београду, Пољопривредни факултет др Александра Димитријевић, доцент, Универзитет у Београду, Пољопривредни факултет др Милош Пајић, доцент, Универзитет у Београду, Пољопривредни факултет др Бранко Радичевић, доцент, Универзитет у Београду, Пољопривредни факултет др Иван Златановић, доцент, Универзитет у Београду, Пољопривредни факултет др Милан Вељић, професор, Универзитет у Београду, Машински факултет др Драган Марковић, професор, Универзитет у Београду, Машински факултет др Саша Бараћ, професор, Универзитет у Приштини, Пољопривредни факултет, Лешак др Предраг Петровић, Институт "Кирило Савић", Београд дипл. инг. Драган Милутиновић, ИМТ, Београд Инострани уредници (International Editors) Professor Peter Schulze Lammers, Ph.D., Institut fur Landtechnik, Universitat, Bonn, Germany Professor László Magó, Ph.D., Szent Istvan University, Faculty of Mechanical Engineering, Gödöllő, Hungary Professor Victor Ros, Ph.D., Technical University of Cluj-Napoca, Romania Professor Sindir Kamil Okyay, Ph.D., Ege University, Faculty of Agriculture, Bornova - Izmir, Turkey Professor Stavros Vougioukas, Ph.D., Aristotle University of Tessaloniki Professor Nicolay Mihailov, Ph.D., University of Rousse, Faculty of Electrical Enginering, Bulgaria Professor Silvio Košutić, Ph.D., University of Zagreb, Faculty of Agriculture, Croatia Professor Selim Škaljić, Ph.D., University of Sarajevo, Faculty of Agriculture, Bosnia and Hercegovina Professor Dragi Tanevski, Ph.D., "Ss. Cyril and Methodius" University in Skopje, Faculty of Agriculture, Macedonia Professor Zoran Dimitrovski, Ph.D., University "Goce Delčev", Faculty of Agriculture, Štip, Macedonia Professor Sitaram D. Kulkarni, Ph.D., Agro Produce Processing Division, Central Institute of Agricultural Engineering, Bhopal, India Контакт подаци уредништва (Contact) 11080 Београд-Земун, Немањина 6, тел. (011)2194-606, 2199-621, факс: 3163-317, 2193-659, e-mail: [email protected], жиро рачун: 840-1872666-79. 11080 Belgrade-Zemun, str. Nemanjina No. 6, Tel. 2194-606, 2199-621, fax: 3163-317, 2193-659, e-mail: [email protected] , Account: 840-1872666-79

POQOPRIVREDNA TEHNIKA
НАУЧНИ ЧАСОПИС
AGRICULTURAL ENGINEERING SCIENTIFIC JOURNAL
УНИВЕРЗИТЕТ У БЕОГРАДУ, ПОЉОПРИВРЕДНИ ФАКУЛТЕТ, ИНСТИТУТ ЗА ПОЉОПРИВРЕДНУ ТЕХНИКУ
UNIVERSITY OF BELGRADE, FACULTY OF AGRICULTURE, INSTITUTE OF AGRICULTURAL ENGINEERING

WEB адреса www.jageng.agrif.bg.ac.rs
Издавачки савет (Editorial Council) Проф. др Властимир Новаковић, Проф. др Милан Тошић, Проф. др Петар Ненић, Проф. др Марија Тодоровић, Проф. др Драгиша Раичевић, Проф. др Ђуро Ерцеговић, Проф. др Ратко Николић, Проф. др Драгољуб Обрадовић, Проф. др Божидар Јачинац, Проф. др Драган Рудић, Проф. др Милош Тешић
Техничка припрема (Technical editor) Иван Спасојевић, Пољопривредни факултет, Београд
Лектура и коректура: (Proofreader) Гордана Јовић
Превод: (Translation) Весна Ивановић, Зорица Крејић, Миљенко Шкрлин Штампа (Printed by) "Академска издања" – Земун Часопис излази четири пута годишње Тираж (Circulation) 350 примерака Pretplata za 2015. godinu iznosi 2000 dinara za institucije, 500 dinara za pojedince i 100 dinara za studente po svakom broju časopisa. Радови објављени у овом часопису индексирани су у базама (Abstracting and Indexing): AGRIS i SCIndeks Издавање часописа помоглo (Publication supported by) Министарство просвете и науке Републике Србије
Na osnovu mišljenja Ministarstva za nauku i tehnologiju Republike Srbije po rešenju br. 413-00-606/96-01 od 24. 12. 1996. godine, časopis POLJOPRIVREDNA TEHNIKA je oslobođen plaćanja poreza na promet robe na malo.

S A D R Ž A J
NUMERIČKE SIMULACIJE TOPLOTNIH OPTEREĆENJA TRAKTORISTE PROUZROKOVANIH SUNČEVIM ZRAČENJEM Dragan Ružić......................................................................................................................................1-8 UTICAJ RASPOREDA FERTIRIGACIJE I NAVODNJAVANJA NA PORAST I PRINOS KRASTAVCA (CUCUMIS SATIVUS L.) Ashwini Patwardhan.........................................................................................................................9-14 POGODNOST ULJA PIRINČANIH MEKINJA KAO STOČNE HRANE ZA PROIZVODNJU BIODIZELA Abhinab Mishra, Ghanshyam Tiwari, Abhay Kumar Mehta, Sudhakar Jindal................................15-20 UTICAJ DIJAGNOSTIKE STANJA NA POUZDANOST DVOSTRUKIH POLJOPRIVREDNIH KARDANSKIH VRTAILA Aleksandar N. Ašonja , Aleksandr Gennadievič Pastuhov..............................................................21-30 POREĐENJE KARAKTERISTIKA JEDNOG INDUKCIONOG MOTORA, ČIJI PARAMETRI SU ODREĐENI EKSPERIMENTALNO I GENETIČKIM ALGORITMOM Anka Krasteva, Donka Ivanova, Miglena Hristova .........................................................................31-38 REZULTATI ISPITIVANJA TEMPERATURE SOLARNIH MODULA Konstantin Koev, Krasimir Martev ..................................................................................................39-47 POSTUPCI PAKOVANJA U MODIFIKOVANOJ ATMOSVERI RADI PRODUŽENJA VREMENA SKLADIŠTENJA KLICA LEBLEBIJA (Cicer arietinum L.) Ranjeet Singh, Ashok Kumar, Sitaram D. Kulkarni ....................................................................... 49-59
UPOTREBA UNUTRAŠNJEG NADPRITISKA ZA POVEC ANJE STABILNOSTI TANKOG ZIDA ROTACIONE SIMETRIČNE OPLATE OPTEREC ENE AKSIJALNOM SILOM Stanislav Kotšmíd, Marián Minárik................................................................................................. 61-70

C O N T E N T S
NUMERICAL SIMULATION OF TRACTOR OPERATOR THERMAL LOADS CAUSED BY SOLAR RADIATION Dragan Ružić..................................................................................................................................... 1-8 EFFECT OF FERTIGATION AND IRRIGATION SCHEDULING ON GROWTH AND YIELD OF CUCUMBER (CUCUMIS SATIVUS L.) Ashwini Patwardhan........................................................................................................................ 9-14 SUITABILITY OF RICE BRAN OIL AS FEEDSTOCK FOR BIODIESEL MAKING Abhinab Mishra, Ghanshyam Tiwari, Abhay Kumar Mehta, Sudhakar Jindal......................... ..... 15-20 THE INFLUENCE OF DIAGNOSTIC STATE OF RELIABILITY OF AGRICULTURE DOUBLE CARDAN SHAFT Aleksandar N. Ašonja, Aleksandr Genadievič Pastuhov.................................................................21-30 COMPARISON OF THE PERFORMANCE CHARACTERISTICS OF AN INDUCTION MOTOR, THE PARAMETERS OF WHICH ARE DETERMINED EXPERIMENTALLY AND BY A GENETIC ALGORITHM Anka Krasteva, Donka Ivanova, Miglena Hristova......................................................................... 31-38 RESULTS FROM A STUDY ON THE TEMPERATURE OF SOLAR MODULES Konstantin Koev, Krasimir Martev.................................................................................................. 39-47
MODIFIED ATMOSPHERIC PACKAGING STRATEGIES TO PROLONG SHELF LIFE OF CHICKPEA (Cicer arietinum L.) SPROUTS Ranjeet Singh, Ashok Kumar, Sitaram D. Kulkarni........................................................................ 49-59
INSIDE OVERPRESSURE UTILIZATION FOR A STABILITY INCREASING AT THE THIN-WALLED ROTATIONAL SYMMETRICAL SHELL STRAINED BY AXIAL FORCE Stanislav Kotšmíd, Marián Minárik................................................................................................. 61-70

Univerzitet u Beogradu Poljoprivredni fakultet Institut za poljoprivrednu tehniku Naučni časopis POLJOPRIVREDNA TEHNIKA Godina XXXIX Broj 1, 2014. Strane: 1 – 8
University of Belgrade Faculty of Agriculture
Institute of Agricultural Engineering Scientific Journal
AGRICULTURAL ENGINEERING Year XXXIX No. 1, 2014.
pp: 1 – 8
UDK: 629.06 Originalni naučni rad Original scientific paper
NUMERICAL SIMULATION OF TRACTOR OPERATOR THERMAL LOADS CAUSED BY SOLAR RADIATION
Dragan Ružić∗
University of Novi Sad, Faculty of Technical Sciences, Department for Mechanization
and Design Engineering, Chair for Motor Vehicles and IC Engines, Novi Sad, Serbia
Abstract: This paper deals with analysis of solar radiation direction and intensity influence on thermal flux on agricultural tractor operator's body surface. The analysis was carried out on a virtuel model of a tractor cab. The results showed that the highest solar load can occur when the sun is shining on the side of the tractor cab. When the sun is behind the cab and relatively low in the sky, the back and neck are critical body parts regarding the solar irradiation.
Key words: agricultural tractor cab, solar radiation, virtual thermal manikin, CFD, thermal comfort
INTRODUCTION
Thermal conditions in agricultural tractor cab are more adverse in hot than in cold ambient. Higher ambient temperatures, accompanied with solar radiation, cause increase of both interior air and surface temperatures above safety limits. From that reason, although the tractor cab offers the mechanical protection and protection from adverse ambient conditions, on the other hand, even under moderate outside conditions the closed cab act like green house and its closed interior could become unpleasant, unbearable and even dangerous.
∗ Corresponding author. E-mail: [email protected] Project TR31046 "Improvement of the quality of tractors and mobile systems with the aim of increasing competitiveness and preserving soil and environment", supported by Serbian Ministry of Education, Science and Technological Development

Ružić D.: Numeričke simulacije toplotnih opterećenja.../Polj. tehn. (2014/1), 1 - 8 2
Experimental determination of local heat fluxes on human body surface caused by solar radiation demands the use of complex and expensive measurement equipment and test facilities. The other way is to simulate these processes in virtual experiments, as in other fields of research [3], [5]. This paper deals with numerical modelling of solar radiation transmitted through tractor cab glazing.
Number of researches is focused on person thermal load caused by solar radiation, and this problem is especially interesting in field of mobile machinery. An operator enclosure can be treated as a workspace and the conditions inside a tractor cab have significant impact on the performance of the operator. From the operator's point of view, tractor cab ergonomics is a key factor in ensuring his optimum working performance, which could easily become the weakest link in the working process.
The project presented in the report by Bohm et al. [1], concerns the thermal effect of glazing in cabs with large glass areas. The effect of different kind of glass and design of the windows as well as the effects of sun protection and insulation glazing have been studied and evaluated, using the thermal manikin called AIMAN. Results showed that neither in severe winter conditions, nor in sunny summer conditions, could acceptable climate be obtained with standard glazing in cabs with large glass areas.
In the comprehensive project focused on the reduction of vehicle auxiliary load, done by National Renewable Energy Laboratory [7], variety of researching methods were used to research and develop innovative techniques and technologies for lowering thermal loads. The aim of the research was to investigate solutions for improvement of fuel economy of air-conditioning system. They concluded that reflecting the solar radiation incident on the vehicle’s glass is the most important factor in making significant reductions in the thermal loads. Using solar-reflective glass can reduce the average air temperature and the seat temperature. Using reflective shades and electrochromic switchable glazing is also effective techniques for reducing the solar energy entering the passenger compartment. They also found that solar-reflective coatings on exterior opaque surfaces and body insulation can reduce a vehicle’s interior temperatures, but to a lesser extent than solar-reflective glazing, shades, and parked-car ventilation can.
Results of Ružić et al. [8], [9], [10] showed that tractor cab glazing is the most influencing factor for thermal loads. They concluded that the highest heat flux that enters the cab is caused by solar radiation through the glass, which could be several times higher than the heat transferred by other modes. Therefore, the selection of appropriate glass properties could be the way to reduce operator’s thermal load. Furthermore, the shape of a cab, glass solar properties and thermal load of the operator are in close relation.
The aim of the paper is to investigate influence of sun position relative to the tractor cab on heat fluxes caused by solar radiation over the operator's body surface. Furthermore, the goal is to identify the worst case regarding solar heat load, since the exposed surfaces of the body must be either protected from the adverse effects of solar radiation or directly cooled by airflow from air-conditioner vents, in order to reduce risk of thermal discomfort.
MATERIAL AND METHODS Determination of heat fluxes caused by solar radiation was done using the numerical
simulations. The simulations were carried out in STAR CCM+ software. The CAD model of the virtual thermal manikin (VTM) is a simplified humanoid in the sitting

Ružić D.: Numerical Simulation of Tractor Operator.../Agr. Eng. (2014/1), 1 - 8 3
posture. The manikin’s body is symmetric, with its posture defined by characteristic points in places where the main body joints are (hips, shoulders, neck, elbows etc). Main body dimensions are adopted from CATIA database for a 50th percentile European male, and the body is divided into 18 segments (Fig. 1). According to the chosen sizes of the body, the VTM is 1.74 m tall and weighs 68 kg. The area of VTM body surface in sitting position is 1.796 m2. The VTM surface is discretized in around 13,600 surface elements.
Figure 1. Virtual thermal manikin with numbered segments
The cab was modelled after the protective operator's cab of small agricultural tractor
powered by 30 kW engine. The interior geometry was simplified, neglecting non-important and small details such command levers etc.
The amount of solar radiation energy that will be absorbed by the body will depend on the effective projected area and on the solar absorptivity of the body surface. The largest effective projected radiation area Aeff of a person in the sitting position is with the azimuth and altitude angles of 30° and 15° respectively [2], [6]. Solar absorptivity of the human skin is around 0.62, while solar absorptivity for clothing depends on the colour [4], [6]. In this research, solar absorptivity of all virtual manikin's segments was set to 0.62.
The problem was treated as a steady-state three-dimensional, with stationary bodies and boundaries. Solar load was calculated by Solar load model incorporated in CFD software STAR-CCM+. The coordinate system for the orientation of the direct solar flux is defined in the Fig. 2. In this study, the gray spectrum model is used and the total solar loads represent the full-thermal spectrum, including both direct and diffuse components. The solar load model is defined by the following properties: the sun direction vector in a specified coordinate system (azimuth and altitude angles), the direct and the diffuse solar fluxes (W·m-2) [15].
Solar irradiation is variable depending on the position of the sun as well as the orientation of the cab. Fig. 3 presents the values of maximum ("clear sky") intensity of normal irradiation and its variations during the daylight, in a central European region.

Ružić D.: Numeričke simulacije toplotnih opterećenja.../Polj. tehn. (2014/1), 1 - 8 4
x
y
z
Φ
ΘS
Figure 2. Solar coordinate system relative to tractor cab: θS – solar altitude (sun elevation), Φ - azimuth angle
0
200
400
600
800
1000
1200
0 20 40 60 80 100 120 140 160 180
Sol
ar c
lear
-sky
irra
diat
ion,
W/m
2
Solar altitude, °
directdifusetotal
Figure 3. Solar clear-sky irradiation in a central European region on a day in July
(http://re.jrc.ec.europa.eu/pvgis/apps3/pvest.php). Vertical lines present the solar altitudes that were considered in the analysis
Tractor cab glazing is semi-transparent medium where solar irradiation can be
partially reflected, absorbed and transmitted. Absorbed part of the solar energy will be emitted to the cab interior by both convection and long-wave radiation. When a tractor cab is exposed to the sun, the operator's body receives the heat partly by solar radiation transmitted through the glass and partly by long-wave thermal radiation from the surrounding surfaces. Total amount of heat transmitted through the glass caused by solar radiation is related with cab surface projection normal to the radiation direction.
In this research, only transmitted part of the solar radiation was analyzed, since it has direct effect on the operator, increasing his skin temperature and hence producing the discomfort. Using available values of glass properties for tinted glass (green, with 75% transmittance of visible light [14]) normal solar transmissivity was set to 0.5.
Ružić D.: Numerical Simulation of Tractor Operator.../Agr. Eng. (2014/1), 1 - 8 5
RESULTS AND DISCUSSION
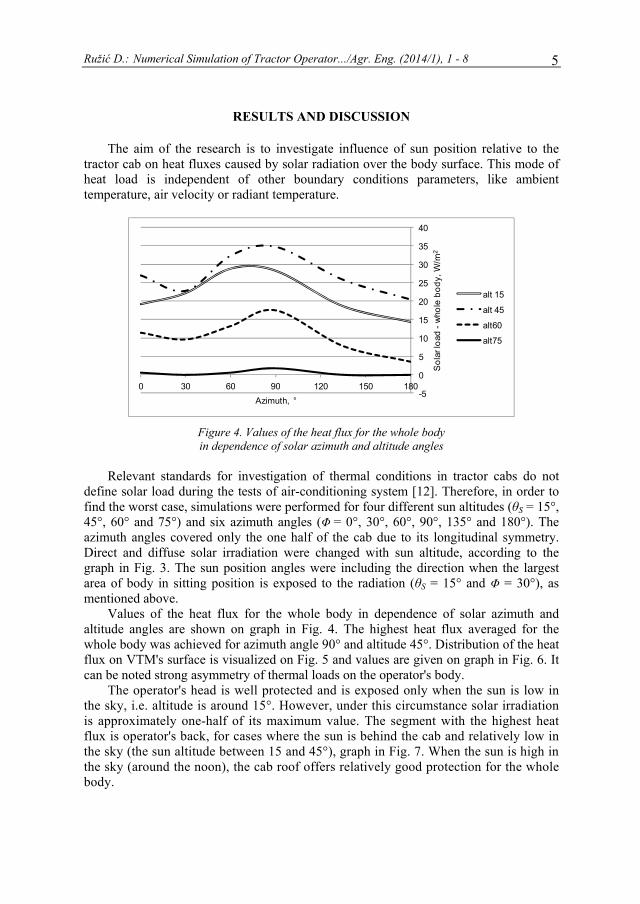
The aim of the research is to investigate influence of sun position relative to the
tractor cab on heat fluxes caused by solar radiation over the body surface. This mode of heat load is independent of other boundary conditions parameters, like ambient temperature, air velocity or radiant temperature.
-5
0
5
10
15
20
25
30
35
40
0 30 60 90 120 150 180
Sol
ar lo
ad -
who
le b
ody,
W/m
2
Azimuth, °
alt 15
alt 45
alt60
alt75
Figure 4. Values of the heat flux for the whole body in dependence of solar azimuth and altitude angles
Relevant standards for investigation of thermal conditions in tractor cabs do not
define solar load during the tests of air-conditioning system [12]. Therefore, in order to find the worst case, simulations were performed for four different sun altitudes (θS = 15°, 45°, 60° and 75°) and six azimuth angles (Φ = 0°, 30°, 60°, 90°, 135° and 180°). The azimuth angles covered only the one half of the cab due to its longitudinal symmetry. Direct and diffuse solar irradiation were changed with sun altitude, according to the graph in Fig. 3. The sun position angles were including the direction when the largest area of body in sitting position is exposed to the radiation (θS = 15° and Φ = 30°), as mentioned above.
Values of the heat flux for the whole body in dependence of solar azimuth and altitude angles are shown on graph in Fig. 4. The highest heat flux averaged for the whole body was achieved for azimuth angle 90° and altitude 45°. Distribution of the heat flux on VTM's surface is visualized on Fig. 5 and values are given on graph in Fig. 6. It can be noted strong asymmetry of thermal loads on the operator's body.
The operator's head is well protected and is exposed only when the sun is low in the sky, i.e. altitude is around 15°. However, under this circumstance solar irradiation is approximately one-half of its maximum value. The segment with the highest heat flux is operator's back, for cases where the sun is behind the cab and relatively low in the sky (the sun altitude between 15 and 45°), graph in Fig. 7. When the sun is high in the sky (around the noon), the cab roof offers relatively good protection for the whole body.

Ružić D.: Numeričke simulacije toplotnih opterećenja.../Polj. tehn. (2014/1), 1 - 8 6
Figure 5. Distribution of solar heat load over the VTM's surface
in the case with the highest heat flux for the whole body
0
10
20
30
40
50
60
70
80
90
Sola
r loa
d, W
/m2
Figure 6. Values of solar load heat flux on VTM's segments
in the case with the highest heat flux for the whole body
0
20
40
60
80
100
120
Sola
r loa
d, W
/m2
Figure 7. Values of solar load heat flux on VTM's segments
when the sun is behind the cab and at altitude of 45°

Ružić D.: Numerical Simulation of Tractor Operator.../Agr. Eng. (2014/1), 1 - 8 7
CONCLUSION
Tractor cab design and the operator’s position on the seat generally do not offer good protection from solar radiation, although roof ensures shading for the operator under some circumstances. The highest heat flux that the body receives is when the sun is shining on the side of the tractor cab. The back and neck are critical body parts regarding the solar irradiation, when the sun is behind the cab and relatively low in the sky. When the sun is low in the sky, the head and the trunk are exposed and protected only by solar properties of glass, unless some kind of solar shading devices or direct cooling by air-conditioning are used.
Shading devices can be placed on the inner side, or as a better solution, on the outer side of the cab. In both cases, the shading devices must not restrict the operator's normal field of vision in the working area of the tractor. For that reason, sun visors or curtains must be easily adjustable. In addition to shading the operator, the outer shading devices prevent increase of temperature of glass and other surfaces caused by the solar radiation. A common solution for these purposes is the use of cab roof overhangs, since aerodynamics is not an issue in agricultural tractors. Furthermore, paying attention to solar characteristics of glass and design of air distribution system in such way that air-conditioner vents can be directed to areas with the highest fluxes are an efficient way to reduce the operator’s thermal load.
Numerical values obtained from the simulations should be considered for comparison purposes only, and validation of the numerical model must be done by experiment on physical models.
REFERENCES
[1] Bohm, M., Holmer, I., Nilsson, H., Noren, O. 2002. Thermal effects of glazing in driver’s cabs, JTI-rapport 305, JTI – Institutet for jordbruks, ISSN 1401-4963, Uppsala, Sweden
[2] Fanger, P. O. 1970. Thermal Comfort, Copenhagen, Denmark: McGraw-Hill, [3] Glišović, J. Demić, M., Miloradović, M. 2011. Review of Virtual Reality Applications for
Reducing Time and Cost of Vehicle Development Cycle. Journal of Applied Engineering Science Vol 9(3): 361-372
[4] Incropera, F. P., DeWitt, D. P. 1981. Fundamentals of Heat and Mass Transfer, New York, USA: John Wiley & Sons
[5] Ognjanović, M. 2008. Design in Mechanical Engineering - Multidisciplinary Approach. Istraživanja i projektovanja za privredu, 20/2008: 15-22
[6] Parsons, K. 2003. Human thermal environments: The effects of hot, moderate and cold environments on human health, comfort and performance, 2nd Edition. London, UK: Taylor & Francis
[7] Rugh, J. & Farrington, R. 2008. Vehicle Ancillary Load Reduction Project Close-Out Report, Technical Report NREL/TP-540-42454, Golden, USA: National Renewable Energy Laboratory
[8] Ružić, D., Časnji, F. 2011. Konstruktivni parametri kabine od uticaja na toplotnu interakciju između čoveka i kabine. Poljoprivredna tehnika, 36 (1): 11-19
[9] Ružić, D., Časnji, F. 2012. Thermal interaction Between a Human Body and a Vehicle Cabin, published in: Heat Transfer Phenomena and Applications, S. N. Kazi (ed.), InTech
[10] Ružić, D., Časnji, F., Muzikravić V. 2007. Karakteristike stakla kao faktor od uticaja na mikroklimu u traktorskoj kabini. Traktori i pogonske mašine, 12 (4): 92-97

Ružić D.: Numeričke simulacije toplotnih opterećenja.../Polj. tehn. (2014/1), 1 - 8 8
[11] Türler, D., Hopkins, D., Goudey, H. 2003. Reducing Vehicle Auxiliary Loads Using Advanced Thermal Insulation and Window Technologies. SAE Paper 03HX-36, USA: Society of Automotive Engineers
[12] ***. 1997. ASABE/ISO 14269-2 Tractors and Self-propelled Machines for Agriculture and Forestry - Operator Enclosure Environment - Part 2: Heating, Ventilation and Air-conditioning Test Method and Performance
[13] ***. 1999. ASHRAE Book of Applications, Chapter 32: Solar Energy Use, American Society of Heating, Refrigerating and Air Conditioning Engineers, Atlanta, USA
[14] ***. 2003. Saint-Gobain Sekurit - Glazing Manual, available at http://www.sekurit.com, [accessed at july 2013]
[15] ***, STAR-CCM+, User Guide, CD-Adapco, 2011
NUMERIČKE SIMULACIJE TOPLOTNIH OPTEREĆENJA TRAKTORISTE PROUZROKOVANIH SUNČEVIM ZRAČENJEM
Dragan Ružić
Univerzitet u Novom Sadu, Fakultet tehničkih nauka, Departman za mehanizaciju i konstrukciono mašinstvo, Katedra za motore i vozila, Novi Sad
Sažetak: U radu je prikazana analiza uticaja pravca i intenziteta sunčevog zračenja na toplotni fluks na površini tela rukovaoca u kabini poljoprivrednog traktora. Analiza je izvršena na virtuelnom modelu kabine. Rezultati su pokazali da najveće toplotno opterećenje tela usled sunčevog zračenja može nastati kada je kabina bočnom stranom okrenuta ka suncu, a da je najveće lokalno toplotno opterećenje na leđima i na vratu rukovaoca kada je sunce iza kabine.
Ključne reči: traktorska kabina, sunčevo zračenje, virtuelna toplotna lutka, CFD, toplotni komfor
Prijavljen: Submitted: 16.8.2013
Ispravljen: Revised:
Prihvaćen: Accepted: 07.10.2013.
Univerzitet u Beogradu Poljoprivredni fakultet Institut za poljoprivrednu tehniku Naučni časopis POLJOPRIVREDNA TEHNIKA Godina XXXIX Broj 1, 2014. Strane: 9 – 14
University of Belgrade Faculty of Agriculture
Institute of Agricultural Engineering Scientific Journal
AGRICULTURAL ENGINEERING Year XXXIX No. 1, 2014.
pp: 9 – 14
UDK: 634.11 Originalni naučni rad Original scientific paper
EFFECT OF FERTIGATION AND IRRIGATION SCHEDULING ON GROWTH AND YIELD OF CUCUMBER
(CUCUMIS SATIVUS L.)
Ashwini Patwardhan*
K. K. Wagh College of Agricultural Engineering, Department of Irrigation and Drainage Engineering, Nashik, Affiliated to Mahatma Phule Krishi Vidyapeeth,
Rahuri, India
Abstract: The maximum yield (21.67 t·ha-1 and 20.85 t·ha-1) was obtained with fertigation level F1 (80% of R.D) and irrigation level I2 (0.3PE). The yield was 44.28% and 39% higher in fertigation level F1 and irrigation level I2 as compared to conventional method of irrigation. The individual effect of fertigation and irrigation levels showed significant effect on the yield but the interaction effect between fertigation and irrigation levels was found to be non-significant. The maximum water use efficiency (WUE) of 11.6 t·ha-1-mm and 10.9 t·ha-1-mm was recorded with I1 and F1 while maximum fertilizer use efficiency (FUE) of 135.10 was recorded with F1. The total quantity of water applied through drip irrigation and conventional method of irrigation was 16.35 cm and 48.00 cm respectively, indicating 65.93% saving of water in drip irrigation system over conventional method of irrigation. The B:C ratio 1.94 was found maximum in treatment combination I2 F1.
Key words: cucumber, irrigation, water use efficiency, fertilizer use efficiency, fertigation, yield, B:C ratio.
INTRODUCTION
Cucumber has high place in the diet as a rich source of carbohydrates, as a breakfast fruit and as an ingredient of salads. Cucumber forms an important and big group of vegetable in our diet due to its high nutritive value (44.5 g of average nutritive value per
* Corresponding author. E-mail: [email protected]
Patwardhan A.: Uticaj rasporeda fertirigacije .../Polj. tehn. (2014/1), 9 - 14 10
100 g dry matter). It can give cool and refreshing effects in summer. The area and productivity of cucumber is very low in Maharashtra. Hence to increase the production per unit use of water, adequate and timely supply of water is crucial one. The important input which seriously affects the growth and yield of any vegetable is fertilizer application. Thus with Hi-tech irrigation practice like drip irrigation, fertilizer were applied with water directly in the root-zone of crop, thereby avoiding leaching and percolation losses with the economy in the use of fertilizers and water to be applied. The cultural practices coupled with balanced use of fertilizers and optimum use of irrigation water plays an important role in enhancing the productivity of cucumber. Therefore the present study was aimed to work out fertilizer and water requirement, compare yield of cucumber, WUE and FUE as influenced by drip and surface irrigation method and compute benefit cost ratio.
MATERIAL AND METHODS
The field experiment was conducted at the Instructional Farm of Department of Irrigation and Drainage Engineering, Dr. Annasaheb Shinde College of Agricultural Engineering, MPKV., Rahuri on clay soil during the period from December 2004 to March 2005. The topography of the experimental field was uniform and leveled. The EC and pH of the experimental plot were 0.502 dSm-1 and 8.05, respectively. Available N, P and K were observed as 416.97 kg·ha-1, 45.824 kg·ha-1, 728.00 kg·ha-1. The quality of water was of class C3S1.
The experiment was carried out in split plot design with three main-plot treatments and four sub-plot treatments with one control treatment each having three replications. The main-plot treatments included I1 : Irrigation at 0.2PE by drip irrigation method, I2 : Irrigation at 0.3PE by drip irrigation method, I3 : Irrigation at 0.4PE by drip irrigation method, Where 0.2, 0.3 and 0.4 were the integrated factors derived from crop coefficient (Kc), pan factor (Kp) and wetted area (Wa). Sub-plot treatments included F1 : 80% of recommended dose (RD) through water soluble fertilizer (WSF), F2 : 100% of recommended dose through water soluble fertilizer, F3 : 120% of recommended dose through water soluble fertilizer and F4 : Application of N through drip and P, K by band placement according to recommended dose. The treatments were compared with a suitable control i.e with conventional method of irrigation (ridges and furrows) replicated thrice.
The experiment was laid out with twelve treatment combinations arranged randomly on a field of 40 m x 22 m size with spacing of 1.0 m x 0.5 m while with conventional method of irrigation on a field of 40 m x 1 m size with a spacing of 0.5 m x 1.0 m. The buffer of 1m was left between two successive treatment plots in order to avoid lateral movement of water from one treatment plot to another. One lateral commanded two rows of cucumber plants.The seeds of cucumber (var. Himangi) were dibbled on 29th December 2004 at the rate of 1.50 kg·ha-1.
Water-soluble fertilizer (Ultrasol) of grade (19:19:19) and urea was used for treatments with fertigation levels from F1 to F3 while urea (46% N), single super phosphate (16% P2O5), murate of potash (60% K2O) were used for treatment with fertigation level F4 and conventional method of irrigation. The recommended dose of fertilizer (NPK) for the cucumber crop is 100:50:50 kg·ha-1. Water soluble fertilizers

Patwardhan A.: Effect of Fertigation and Irrigation.../Agr. Eng. (2014/1), 9 - 14 11
(Ultrasol) were applied weekly as per different treatments. The basal dose was divided into four splits as 10%, 30%, 30% and 30% respectively and was applied weekly after sowing, whereas the dose for top dressing was divided into four equal splits as 12.5% and was applied weekly in the next month.
In case of control, solid fertilizers were used in which half dose of N and full dose of P and K were given at the time of sowing and remaining half dose of N was given one month after sowing.
The effect of fertigation and irrigation levels on growth and yield contributing parameters viz., length of vine, diameter of fruit, weight of fruit, length of fruit, number of fruit, compactness of fruit and yield of fruit were observed.
RESULTS AND DISCUSSION
It was observed that the maximum 480.00 mm depth of irrigation water was applied to cucumber crop in control treatment followed by 227.04, 195.28 and 163.52 mm as in irrigation level I3, I2, I1 that was 237.04 mm respectively through drip irrigation system. The maximum saving (65.58%) of water in I1 was achieved with drip irrigation system over control.
It was also observed that the yield per hectare of cucumber differed significantly due to irrigation levels. The maximum average yield of 20.83 t·ha-1 was reported for treatment I2 (0.3PE) and was found significantly superior over rest of treatments (I1 and I3). This might be due to the favorable moisture status in the rootzone of crop produced by treatment with irrigation level I2 during the growth period as compared to treatment with I1 (0.2PE) and I3 (0.4PE), which resulted in reduced average yield of fruit. The treatments I1 and I3 were at par with each other. The minimum yield of 17.79 t·ha-1 was observed in irrigation level of I3. Similarly, it was revealed that the average yield per hectare of cucumber varied significantly due to fertigation levels. The maximum average yield of 21.62 t·ha-1 was obtained in treatment F1 (80% R.D) and was significantly superior over F3 and F4. The treatment F1 and F2 were at par with each other. However the average yield obtained in F2 was significantly superior to that obtained by F4 (N through drip and P, K by band placement) and was also at par with F3. It was also reported that average yield obtained in treatment F3 was at par with F4. The interaction effect between irrigation levels and fertigation levels was observed to be non-significant in respect of average yield per hectare. In control treatment, the minimum average yield of 14.98 t·ha-1 was registered, this decrease in yield in case of control treatment might be caused due to deep percolation and conveyance losses of fertilizers during application.
From Tab. 1. it was revealed that the WUE ranged from 3.12 t·ha-1-mm to 11.6 t·ha-
1-mm due to different treatments. It was revealed that maximum WUE was reported in treatment with irrigation level I1 (0.2PE) and with fertigation level F1 (80% RD). The increase in WUE was largely due to reduction in total water used. It was also noted that through drip system maximum WUE was achieved than with conventional method of irrigation. The saving in irrigation water was to the extent of 63.12% and 59.32% [2] in case of irrigation level I1 (0.2PE) and I2 (0.3PE) in drip irrigation system as compared with conventional method of irrigation. In other words, within the same quantity of water, about 63.12% and 59.32% additional area could have been brought under irrigation.

Patwardhan A.: Uticaj rasporeda fertirigacije .../Polj. tehn. (2014/1), 9 - 14 12
Table 1. Water and fertilizer use efficiency as influenced by different treatment Tr
eatm
ents
Yield
[t·ha-1]
Depth of water
applied
[cm]
Water use efficiency
[t·ha-1-mm]
Percent saving in
water
[%]
Quantity of fertilizer applied
[kg·ha-1]
Fertilizer use
efficiency
[%]
Increase in yield
[%] Irrigation
levels
I1 18.94 16.35 11.6 65.93 200 94.71 20.91 I2 20.83 19.83 10.7 59.32 200 104.13 28.06 I3 17.79 23.70 7.5 50.61 200 88.96 15.74
Fertigation levels
F1 21.62 19.86 10.9 58.62 160 135.10 30.69 F2 19.86 19.86 10.0 58.62 200 99.30 24.56 F3 18.44 19.86 9.3 58.62 240 76.81 18.73 F4 16.84 19.86 8.5 58.62 200 84.18 11.02
Control 14.98 48.00 3.1 - 200 74.91 -
Irrigation levels Fertigation levels Interaction (I x F)
SE ± 2.29 6.78 CD at 5% 9.02 20.14 N.S.
The maximum value of FUE (135.10%) was observed in Tab. 1 for fertigation level with F1 (80% RD) followed by F2 (100% RD), F3 (120% RD) and F4 (N through drip and P, K by band placement) whereas in case of irrigation levels FUE was observed maximum (104.17%) in I2 (0.3PE) followed by I1 (0.2PE) and I3 (0.4PE). The drip irrigation treatment registered maximum values of FUE as compared to those obtained with conventional method of irrigation. It was revealed that there was 30.69% increase in yield and 20% saving in fertilizers over control.
Table 2. Cost economics of fertigation for different treatments
Items I1F4 I1F2 I1F1 I1F3 I2F2 I2F3 I2F1 I2F4 I3F3 I3F1 I3F4 I3F2
Con
trol
Cost of production [Rs·ha-1] 40
257
4988
1
4742
0
5229
3
4988
1
5229
3
4742
0
4025
7
5229
3
4742
0
4025
7
4988
2
3372
7
Gross monetary
return [Rs]
6560
0
8000
0
8640
0
7040
0
6270
0
8280
0
9200
0
7440
0
6760
0
8040
0
6160
0
7440
0
5960
0
Net income [Rs] 25
343
3011
9
3898
0
1810
7
1281
9
3050
7
4458
0
3414
3
1530
7
3298
0
2134
3
2451
8
2587
3
B:C Ratio 1.63 1.60 1.82 1.35 1.28 1.58 1.94 1.85 1.29 1.70 1.53 1.49 1.76

Patwardhan A.: Effect of Fertigation and Irrigation.../Agr. Eng. (2014/1), 9 - 14 13
The maximum B:C ratio was observed in treatment combination I2F1 (1.94) and the least value was found in treatment combination I2F2 (1.28) for drip irrigation system whereas it was 1.76 in control (Tab. 2).
Cost of production (Rs·ha-1) = seasonal fixed cost Rs.8890/-, Variable and fertilizer cost, rental value Rs. 1000·ha-1 and interest on working capital 10%, selling price Rs. 400·q-1. The study revealed that there was 30.69% increase in yield and 20% saving in fertilizers over control. The highest water use efficiency (11.58 t·ha-1-mm) was found in treatment with irrigation level I1 (0.2PE) whereas in case of fertigation level highest value of WUE (10.9 t·ha-1-mm) was recorded in F1 (80% RD). The fertilizer use efficiency was recorded highest (104.13%) in irrigation level I2 (0.3PE) whereas in case of fertigation level highest value (135.10%) was recorded for F1 (80% RD). The maximum B:C ratio (1.94) was found in treatment combination I2F1 which was the combination of treatments with irrigation level I2 (0.3PE) and fertigation level F1 (80% RD) with the maximum net income of 44,580 Rs·ha-1.
CONCLUSIONS
From the present study it was concluded that though the effect of interaction between irrigation and fertigation level was found statistically non-significant but the individual effects of irrigation and fertigation levels gave significant results. Thus, it was concluded that cucumber irrigated with 0.3PE grown in clay soil with irrigation scheduled on the alternate day, and with 80% of RD through WSF showed better results in respect of yield under Rahuri conditions.
BIBLIOGRAPHY
[1] Narayanamoorthy, A. 1997. Economic viability of drip irrigation: An Empirical Analysis from Maharashtra. India Journal of Agricultural Economics, Vol.52, No.4, October-December, pp.728-739.
[2] NCPAH. 2001. Progress report. Ministry of Agriculture, Government of India, New Delhi. [3] Pollack, S. 1995. Cucumbers: An Economic Assessment of the Feasibility of Providing
Multiple-Peril Crop Insurance. Economic Research Service, USDA, pp-15-19.
UTICAJ RASPOREDA FERTIRIGACIJE I NAVODNJAVANJA NA PORAST I PRINOS KRASTAVCA (CUCUMIS SATIVUS L.)
Ashwini Patwardhan
K. K. Wagh Fakultet za poljoprivrednu tehniku, Institut za navodnjavanje i
odvodnjavanje, Nashik, Rahuri, Indija
Sažetak: Maksimalni prinos (21.67 t·ha-1 i 20.85 t·ha-1) je postignut sa nivoom fertirigacije F1 (80% R.D) i nivoom navodnjavanja I2 (0.3PE). Prinos je bio 44.28% i
Patwardhan A.: Uticaj rasporeda fertirigacije .../Polj. tehn. (2014/1), 9 - 14 14
39% viši sa nivoom fertirigacije F1 i nivoom navodnjavanja I2 u poređenju sa konvencionalnom metodom navodnjavanja. Pojedinačni efekti nivoa fertirigacije i navodnjavanja pokazali su značajan uticaj na prinos, ali efekat interakcije nivoa fertirigacije i navodnjavanja nije bio značajan. Maksimalna efikasnost navodnjavanja (WUE) od 11.6 t·ha-1-mm i 10.9 t·ha-1-mm je postignuta sa I1 i F1 dok je maksimalna efikasnost đubrenja (FUE) od 135.10 postignuta sa F1. Ukupna količina vode koja je upotrebljena za navodnjavanje kap po kap i konvencionalni metod navodnjavanja bila je 16.35 cm i 48.00 cm, redom, pokazujući uštedu vode od 65.93% pri navodnjavanju kap po kap u odnosu na konvencionalni metod navodnjavanja. Odnos B:C od 1.94 je bio maksimalan u tretmanu kombinacijom nivoa I2 F1.
Ključne reči: krastavac, navodnjavanje, efikasnost navodnjavanja, efikasnost đubrenja, fertirigacija, prinos, odnos B:C
Prijavljen: Submitted: 31.8.2013
Ispravljen: Revised: 10.3.2014.
Prihvaćen: Accepted: 15.3.2014.
Univerzitet u Beogradu Poljoprivredni fakultet Institut za poljoprivrednu tehniku Naučni časopis POLJOPRIVREDNA TEHNIKA Godina XXXIX Broj 1, 2014. Strane: 15 – 20
University of Belgrade Faculty of Agriculture
Institute of Agricultural Engineering Scientific Journal
AGRICULTURAL ENGINEERING Year XXXIX No. 1, 2014. pp: 15 – 20
UDK: 547.916 Originalni naučni rad Original scientific paper
SUITABILITY OF RICE BRAN OIL AS FEEDSTOCK FOR BIODIESEL MAKING
Abhinab Mishra1*, Ghanshyam Tiwari1, Abhay Kumar Mehta1, Sudhakar Jindal2
1Maharana Pratap University of Agriculture and Technology, College of Technology and Engineering, Department of Farm Machinery and Power Engineering, Udaipur, India
2Maharana Pratap University of Agriculture and Technology, College of Technology and Engineering, Department of Mechanical Engineering, Udaipur, India
Abstract: India is second largest rice producing country and the estimated yield of crude rice bran oil (RBO) is about 400.000 tons of which only 50% is of edible grade, 50% of the total available rice bran oil is left unutilized due to presence of active lipase in bran and lack of economic stabilization methods most of the bran is used as animal feed or for industrial application. One of the best ways for the potential utilization of RBO is the production of biodiesel; also a very little research has been done to utilize this oil as a replacement for mineral diesel. In the present study, biodiesel has been prepared from Rice Bran oil by trans-esterification method meeting the acceptable quality standards and then used as fuel.
Key words: rice bran oil, blend, trans-esterification, biodiesel
INTRODUCTION
Energy is an essential requirement for economic and social development for any country but, with advent of industrial revolution and sky rocketing of petroleum fuel costs in present day has led to growing interest in alternative fuels which can be produced from locally available resources within the country such as alcohol, biodiesel, vegetable oils etc in order to provide a suitable substitute to diesel for a compression ignition (CI) engine [1, 5]. Presently the vegetable oils are the promising alternative fuel to diesel oil since they are renewable, biodegradable and clean burning fuel having similar properties as that of diesel.
* Corresponding author. E-mail: [email protected]

Mishra A., et al.: Pogodnost ulja pirinčanih mekinja.../Polj. tehn. (2014/1), 15 - 20 16
The most commonly used method to make vegetable oil suitable for use in CI engines is to convert it into biodiesel. Some of the vegetable oils like jatropha, karanj, sunflower, and castor are converted into biodiesel for a substitute to diesel for compression ignition (CI) engine but unavailability of these oils in plenty amount, rice bran oil may be one of the option. The estimated yield of crude rice bran oil (RBO) in our country is about 400.000 tons of which only 50% is of edible grade, 50% of the total available rice bran oil is left unutilized due to presence of active lipase in bran, which hydrolyses the triglyceride to fatty acids and glycerol, as a result the FFA content increases making difficult to refine, due to the presence of tightly associated wax [6]. Hence, the oil has to be de-waxed and degummed before being neutralized which lack economic stabilization. As a result most of the bran is used as animal feed or for industrial application. One of the best ways for the potential utilization of RBO is to extract Biodiesel from it; also a very little research has been done to utilize this oil as a replacement for mineral diesel.
MATERIAL AND METHODS
Filtration of crude oil
The crude rice bran oil was procured and various samples were prepared. The oil was filtered to remove the contaminants of oil to obtain a clear biodiesel. Due to excess viscosity and contaminants in the oil a filtration unit was made in which the oil was filtered from a filter cloth of 5 micron with a vacuum pump to obtain clear oil for the experiment (Fig.1).
Figure 1. Filtration unit
Determination of free fatty acid content
The clear filtered oil was further processed for esterification process for obtaining
biodiesel. Before esterification process it is very important to determine the free fatty acid content of the oil. In order to determine the percent of FFA content in the oil,
Mishra A., et al.: Suitability of Rice Bran Oil.../Agr. Eng. (2014/1), 15 - 20 17
chemical titration method was adopted as per manual of methods of analysis of foods, oils, and fats, Directorate General of health Services, Ministry of health and Family, GOI, New Delhi. 1 ml of rice bran oil in 10 ml of methanol was titrated with 0.1% NaOH solution (1 gram of NaOH in 1000 ml of water) using 4 - 5 drops of phenolphthalein as end point indicator till the color changes to light pink. The reading obtained were recorded and compared against standard values.
Trans-esterification process
After obtaining the FFA content in the oil from the above process, the sample was
trans esterified as per standard rules i.e. if the oil contains more than 2% FFA, the FFA is reduced first by acid catalyst esterification method (using methanol in presence of sulphuric acid) and then alkali catalyzed method [7] (using methanol in presence KOH) esterification was done. After separation of glycerol, the ester was washed to remove un-reacted meth oxide. It was then heated to remove the water traces to obtain clear biodiesel. The rice bran methyl ester (biodiesel) thus obtained by this process was totally miscible with mineral diesel in any proportion. The process flow diagram for production of biodiesel is described in the Fig.2. [2-4]
Fuel properties
The fuel properties of Rice bran biodiesel and its blend were measured and tabulated
in Tab. 1. Fuel properties of biodiesel and diesel were investigated for relative density at 31°C, kinematic viscosity in cSt, flash point (°C), calorific value (MJ·kg-1) and copper strip corrosion test at 50°C. The resulted fuel properties of biodiesel were compared with ASTM standards.
RESULTS AND DISCUSSION
Free fatty acids content of crude rice bran oil from titration was found to be >3.57 which was quite higher for preparation of biodiesel. Hence, Acid esterification and Alkali trans-esterification methods were followed which reduced the FFA content of Rice Bran Oil to 0.71%, which was quite low with permissible limit of 2%.
The relative density of crude rice bran oil was found to be 0.94. The values of relative density for diesel, RB biodiesel at room temperature were found to be 0.84, 0.88 respectively, while RB05 was observed to have density closer to diesel. This result confirms the findings of Mohanty (2013), who found similar results while producing biodiesel from rice bran oil [8].
The kinematic viscosity of crude rice bran oil was observed to be to be 48.4cSt at 31°C. The kinematic viscosity for diesel and RB biodiesel at room temperature were found to be 3.93 and 4.6 cSt respectively. Similar results were observed by K.C.Velappan (2007), when rice bran biodiesel and its five blends were fuelled to a CI engine [10]. The kinematic viscosity was very high for crude rice bran oil at ambient temperature but reduction in kinematic viscosity was observed after trans-esterification of the oil.

Mishra A., et al.: Pogodnost ulja pirinčanih mekinja.../Polj. tehn. (2014/1), 15 - 20 18
Figure 2. Process flow diagram for production of bio diesel
The calorific value for crude rice bran oil was found to be 41.36 MJ·kg-1 which is
quite higher as compared to diesel. The difference in the calorific value of diesel and RB biodiesel may be attributed due to the difference in their chemical composition i.e. due to the difference in carbon and hydrogen content.

Mishra A., et al.: Suitability of Rice Bran Oil.../Agr. Eng. (2014/1), 15 - 20 19
Flash point for rice bran oil was found to be 290°C, whereas trans-esterification of the oil marginally reduced the flash point temperature of the oil to 190°C. Although, higher flash point creates problem in self ignition in CI engines, but looking to the safe side of storage and handling of these biodiesels, higher flash point is more desirable.
The copper corrosion strip for evidence of tarnishing or corrosion was examined by comparing with the ASTM copper strip corrosion standards and the strip was found in transition state 1a (slight tarnish).i.e. light orange, almost same as freshly polished strip which indicates that the corrosion forming tendencies of fuel are less or equal to that of conventional diesel. Sanford et.al, (2009) prepared a feedstock and reported biodiesel characteristics for different crops and found similar results. [9]
Table 1. Properties of selected fuel compared with ASTM standards
S. No. Property Unit ASTM Methods
Rice bran iodiesel Diesel
1. Calorific value [MJ·kg-1] D-4809 43.171 41.382
2. Relative density at room temperature [g·cm-3] D-1298 0.880 0.831
3. Kinematic viscosity at 40°C [cSt] D-445 4.600 3.210
4. Flash point [°C] D-93 190.000 76.000
5. Copper strip corrosion testat 50°C - D-130 1A
(slight tarnish) 1A
CONCLUSIONS
The aim of this study was to evaluate rice bran oil as a potential raw material for biodiesel production. The biodiesel sample prepared in the present study showed better results and not deviating from ASTM standard. With the increasing demand for fuels, biodiesel can be a good substitute as it is a renewable source and can be a partial diesel substitute to boost the farm economy; reduce uncertainty of fuel availability by efficiently using it in small portable engines in rural areas for agricultural work and make fuel availability to the farmers and self-reliant. Also, this help in controlling air pollution to a great extent.
BIBLIOGRAPHY
[1] Annonymous. 2007. Planning Commission five year plan. 10th Volume, Chapter 7.3.: 1-42. [2] Bala, B.K. 2005. Studies on biodiesels from transformation of vegetable oils for Diesel
engines. Energy Edu Sci Technology 2005, 15: 1-43. [3] Debrimas, A. 2003. Biodiesel fuels from vegetable oils via catalytic and non-catalytic super
critical alcohol transformation and other methods: a survey. Energy Conversion and Management 44; 2093-2109.
[4] Demirbas. A. 2007. Comparison of trans-esterification methods for production of biodiesel from vegetable oils and fats. Energy Conversion and Management Vol. 05 (2): 1-6.

Mishra A., et al.: Pogodnost ulja pirinčanih mekinja.../Polj. tehn. (2014/1), 15 - 20 20
[5] Gupta P.K., Kumar R., Panesar B.S., Thapar V.K., 2007. Parametric Studies on Bio-diesel prepared from Rice Bran Oil. Agricultural Engineering International: the CIGRE journal. Manuscript EE 06 007. Vol. IX. April, 2007.1-12
[6] Kusum R. 2011. Palm oil and rice bran oil: Current status and future prospects. International Journal of Plant Physiology and Biochemistry Vol. 3(8): 125-132.
[7] Maa, F., Hanna,M.A. 1999. Biodiesel production: a review. Bioresource Technology 70 :1-15. [8] Mohanty, S.K. 2013. A Production of biodiesel from rice bran oil and experimenting on small
capacity diesel engine. International Journal of Modern Engineering Research Vol.3(2): 920-923. [9] Sanford, S.D. 2009. Feedstock and Biodiesel Characteristics Report. Renewable Energy
Group, Inc., www.regfuel.com (2009): 47-86. [10] Velappan, K.C. 2007. Less NOx biodiesel: CI engine studies fuelled with rice bran oil
biodiesel and its five blends. Journal of scientific and industrial research Vol. (66): 60-71.
POGODNOST ULJA PIRINČANIH MEKINJA KAO STOČNE HRANE ZA PROIZVODNJU BIODIZELA
Abhinab Mishra1, Ghanshyam Tiwari1, Abhay Kumar Mehta1, Sudhakar Jindal2
1Maharana Pratap Univerzitet za poljoprivredu i tehnologiju, Fakultet za tehnologiju i
inžinjerstvo, Institut za poljoprivredne i pogonske mašine, Udaipur, Indija 2 Maharana Pratap Univerzitet za poljoprivredu i tehnologiju, Fakultet za tehnologiju i
inžinjerstvo, Institut za mašinstvo, Udaipur, Indija
Sažetak: Indija je druga zemlja po proizvodnji pirinča, sa procenjenim prinosom ulja sirovih pirinčanih mekinja (RBO) od oko 400.000 t, od čega je samo 50% jestivo, a ostalih 50% ukupno raspoloživog ulja pirinčanih mekinja ostaje neupotrebljeno zbog prisustva aktivne lipaze u ljusci i nedostatka ekonomičnih metoda stabilizacije, pa se najveća količina ljuske koristi za stočnu hranu i industrijsku upotrebu. Jedan od najboljih načina za potencijalnu upotrebu RBO je proizvodnja biodizela; takođe, veoma malo istraživanja je izvedeno na upotrebi ovog ulja kao zamene za mineralni dizel. U ovom istraživanju biodizel je pripreman od ulja pirinčanih mekinja trans-esterifikacijom, čime je dobijen prihvatljiv kvalitet prema važećim standardima, a koji je kasnije upotrebljen kao gorivo.
Ključne reči: ulje pirinčanih mekinja, smesa, trans-esterifikacija, biodizel
Prijavljen: Submitted: 18.10.2013.
Ispravljen: Revised:
Prihvaćen: Accepted: 07.10.2013.

Univerzitet u Beogradu Poljoprivredni fakultet Institut za poljoprivrednu tehniku Naučni časopis POLJOPRIVREDNA TEHNIKA Godina XXXIX Broj 1, 2014. Strane: 21 – 30
University of Belgrade Faculty of Agriculture
Institute of Agricultural Engineering Scientific Journal
AGRICULTURAL ENGINEERING Year XXXIX No. 1, 2014. pp: 21 – 30
UDK: 631.372 Originalni naučni rad Original scientific paper
UTICAJ DIJAGNOSTIKE STANJA NA POUZDANOST DVOSTRUKIH POLJOPRIVREDNIH KARDANSKIH VRTAILA
Aleksandar N. Ašonja ∗ 1, Aleksandr Gennadievič Pastuhov2
1Srpski akademski centar, Novi Sad, Srbija
2Belgorodska državna poljoprivredna akademija, V.Я. Gorina, Belgorod, Rusija
Sažetak: U radu je predstavljen model pouzdanosti dvostrukih poljoprivrednih kardanskih vratila zasnovan na dijagnostici stanja ležišnih sklopova na kardanskim zglobovima. Model pouzdanosti kardanskih vratila bio je zasnovan na ispitivanju dijagnostičkih veličinama na ležišnim sklopovima kardanskih zglobova. Osnovani cilj predloženih i izvršenih istraživanja u okviru prezentovanog rada je bila dijagnostika stanja ležišnih sklopova na zglobovima kardanskih vratila u cilju definisanja pouzdanosti kardanskih vratila. Za potrebe istraživanja isprojektovan je i izrađen laboratorijsko-opitni sto, model: "ANA", tip: modela: 23-26-26-04, koji je prvenstveno namenjen za ispitivanje pouzdanosti poljoprivrednih kardanskih vratila.
Ključne reči: pouzdanost, dvostruko kardansko vratilo, ležišni sklopovi
UVOD
Mehanizam koji je razmatran u ovom istraživanju je kardansko vratilo. Kardansko vratilo ima veliku primenu u različitim vrstama industrijskih i transportnih mašina. Elementi kardanskog vratila su opterećeni kombinovanim naprezanjem na savijanje, uvijanje, smicanje i površinski pritisak. Tokom eksploatacije, usled preopterećenja, može doći do različitih vidova razaranja materijala i loma delova kardana [1].
Od četiri načina prenosa snage (mehanički, hidraulični, električni i pneumatski) od traktora do priključne mašine, u praksi najveći značaj imaju mehanički i hidraulični prenos. Za sada je mehanički prenos daleko više zastupljen od hidrauličnog. Mehanički
∗ Kontakt autor. E-mail: [email protected]

Ašonja A., et al.: Uticaj dijagnostike stanja na pouzdanost.../Polj. tehn. (2014/1), 21 - 30 22
prenos snage kod poljoprivrednih mašina ostvaruje se direktno, remenicama, lančanicima, zupčanicima, kardanskim vratilima ili elastičnim vratilima [2].
Kardanska vratila danas imaju značajnu ulogu u prenošenju obrtnog momenta sa radne mašine (traktora) na priključnu mašinu. Danas, na skoro svim priključnim mašinama u poljoprivredi (prese, sejalice, rasipači mineralnog đubriva, vadilice krompira itd.) obrtni moment i snaga od traktora se uglavnom prenosi mehaničkim putem preko kardanskog vratila [3].
U eksploataciji se vek trajanja kardanskih prenosa kod poljoprivrednih mašina automobila, traktora i druge opreme koja koristi kardanske prenose, ograničava narušavanjem radne sposobnosti kardanskih zglobova u 80 - 90 % slučajeva. Sve ovo je uslovljeno nedozvoljenim povećanjem aksijalnog i radijalnog zazora i kružnog (međuigličastog) zazora u spojevima kardanskog zgloba (spoljašnjem radijalnom rukavcu vratila krstaka i igličastog ležaja) i (igličastog ležaja i otvora šoljice na viljuškama). Osnovni vidovi narušavanja pouzdanosti kardanskih prenosnika (pri uslovima pravilnog izbora veličine kardanskih vratila i isključivanja iz razmatranja pojave korozije i oštećenja površina i kvarova koji su uslovljeni grubim greškama u proizvodnji i eksploataciji) su zamor površina materijala i abrazivno habanje u 41 % i formiranje uzdužnih, često strmih, kosih udubljenja izazvanih efektom tzv. „brinelovanja” (plastična deformacija) u 45 %. Prema današnjim ispitivanjima poljoprivrednih mašina 14 % otkaza na mehaničkim prenosnicima odlazi na kardanske prenose, a na njima su oko 60 % zastupljeni otkazi kardanskih zglobova [4].
a. b.
Slika 1. Primeri mogućih pojava opasnosti na dvostrukim kardanskim vratilima: a) oštećeno vratilo na kamionu sa cisternom i b) oštećeno vratilo na poljoprivrednom traktoru
Figure 1. Examples of the possible occurrence of hazards on a double cardan shafts: a) the damaged shaft on a truck with tank and b) the damaged shaft on agricultural tractor
Neki od primera snižene pouzdanosti kardanskih vratila prkazani su na Sl.1. Na
Sl.1-a prikazano je oštećeno dvostruko kardansko vratilo, koje je smrtno ranilo 61-godišnjeg vozača kamiona cisterne. Nastradali radnik je pokušao uključiti vratilo, koje je služilo za pogon pumpe na cisterni, međutim, isto je otkazalo otkačivši se na jednom od

Ašonja A., et al.: The Influence of Diagnostic State.../Agr. Eng. (2014/1), 21 - 30 23
zglobova [5]. Još jedan od primera smrtne povrede koja se desila na nezaštićenom dvostrukom kardanskom vratilu u poljoprivredi u Italiji prikazan je na Sl.1-b [6].
MATERIJAL I METODE RADA
Ispitivanja pouzdanosti vršena su na dvostrukim poljoprivrednim kardanskim vratilima u laboratorijskim i eksploatacionim uslovima. Za ispitivanje je korišćena veličina I dvostrukog kardanskog vratila. Korišćena je Z radna izvedba kardanskih vratila, pod uglom zakretanja 20º, Sl.2. Na Sl. 3 prikazan je ispitivani kardanski zglob u radu koji se sastoji iz 5 radnih elemenata: igličastih ležajeva, krstaka, šoljica, maziva i zaptivača.
Slika 2. Dvostruko kardansko vratilo prikazano u 3D Figure 2. 3D image of a double cardan shaft
Slika 3. Kardanski zglob prikazan u 3D Figure 3. 3D image of a cardan joints
Dinamičke metode ispitivanja
Od dinamičkih metoda ispitivanja pouzdanosti kardanskih vratila u radu su
korišćene dinamičke metode za praćenje vibracija i temperature u kardanskim zglobovima i metoda ispitivanja broja obrtanja kardanskog prenosnika.
Dijagnostika stanja kotrljajnih ležajeva u ležišnim sklopovima je izvođena kako na zglobovima kardanskih vratila, tako i na fiksnim ležajevima pogonskog i gonjenog vratila. Na fiksnim ležajnim jedinicama, koji su bliže kardanskim zglobovima odn. koji se nalaze na kraju vratila na kojima su vezani kardanski zglobovi ispitivane su vibracije, čije vrednosti su u stvari vrednosti vibracija u ležišnim sklopovima kardanskih zglobova.
Instrumenti korišćeni za merenje bili su: - Marlin sonda SMVL 3600 IS - za merenje nivoa vibracija, - Laserski infracrveni termometar - za praćenje stanja temperature i - Probator - za merenje broja obrtaja.
Laboratorijski sto
Za potrebe istraživanja isprojektovan je i izrađen laboratorijsko-opitni sto, model:
"ANA", tip: modela: 23-26-26-04, koji je prvenstveno namenjen za ispitivanje pouzdanosti poljoprivrednih kardanskih vratila, međutim, on se može koristiti i za ispitivanje ostalih kardanskih vratila i ostalih mehaničkih prenosnika snage [7,8,9].
Osnovni delovi ovog opitnog stola, na kojem su vršena ispitivanja pouzdanosti kardanskih vratila, Sl.4, su: 1 čelična konstrukcija (postolje), 2 glavni elektro razvodni

Ašonja A., et al.: Uticaj dijagnostike stanja na pouzdanost.../Polj. tehn. (2014/1), 21 - 30 24
ormar za snabdevanje strujom elektromotora i sistema za regulaciju opterećenja, 3 pogonski deo (elektromotor), 4 remeni prenosnici na pogonskom delu, 5 ležišne jedinice na prvom pomoćnom vratilu, 6 prvo pomoćno vratilo, 7 akumulatori (baterije), 8 ispitno kardansko vratilo, 9 DC generator jednosmerne struje, 10 ležišne jedinice na drugom pomoćnom vratilu, 11 drugo pomoćno vratilo, 12 remeni prenosnici na kočionom delu, 13 sistem za regulaciju opterećenja, 14 ručna regulacija pobude DC generatora i 15 kontrolna lampa pobude DC generatora [7]. Na šematskom crtežu, zbog jednostavnosti prikazivanja, izostavljen je sistem zaštite stola i sistem sa mobilnim stop tasterom.
Na laboratorijskim uzorcima kardanskih vratila ispitivana su vratila pri broju obrtanja od 540 o⁄min, koja su radila dok nisu dostigla ukupan broj ciklusa obrtanja od 107, što odgovara dužini ispitivanja do 300 časova rada. Takođe su na laboratorijskom opitnom stolu ispitivana i poljoprivredna dvostruka kardanska vratila u predotkaznom stanju doneta iz eksploatacije, na kome su merene krajnje dijagnostičke veličine, kao i na uzorcima u samo laboratorijskim ispitivanjima. Za potrebe ispitivanja korišćen je promenljivi režim opterećenja po unapred određenim ciklusima od po 50 časova rada. Navedeni režimi opterećenja su režimi koji su dosta zastupljeni u praksi, radi se o potrebnoj snazi za pogon priključnih mašina (2, 3 i 4 kW) odn. 36, 55 i 75 Nm.
Slika 4. Šematski prikaz laboratorijsko-opitnog stola „ANA”
za ispitivanje pouzdanosti kardanskih vratila Figure 4. The schematic view of the laboratory stand - "ANA"
for testing the reliability of cardan shaft
Na laboratorijsko-opitnom stolu specijalno za ova istraživanja je isprojektovana i izrađena električna kočnica za simulaciju opterećenja, model: "EK", tip: 6/28. Na sistemu za regulaciju opterećenja na električnoj kočnici EK 6/28 ručno se moglo zadavati opterećenje na izlazu laboratorijskog stola, kroz vrednosti snage.
Tako se na osnovu ispisanih vrednosti (struje I i napona U) na digitalnim displejevima računala snaga P po Jed.1 odnosno vrednost obrtnog momenta M preko izmerene snage P i broja obrtaja n, Jed. 2, [7]:
P U I= ⋅ (1)

Ašonja A., et al.: The Influence of Diagnostic State.../Agr. Eng. (2014/1), 21 - 30 25
gde je: P [kW] - snaga, U [V] - napon, I [A] - jačina struje.
9550PMn⋅
= (2)
gde je: M [Nm] - obrtni moment, P [kW] - snaga,, n [min-1] - broj obrtaja.
REZULTATI ISTRAŽIVANJA I DISKUSIJA
Na Sl. 5 prikazane su ukupne prosečne pouzdanosti posmatranih dijagnostičkih parametra temperature i aksijalnih ubrzanja vibracija na ležišnim sklopovima prvih zglobova u laboratorijskim i eksploatacionim ispitivanjima. Sa Sl. 5 se može zaključiti da bi ležišni sklopovi prvih zglobova u laboratorijskim uslovima dostigli pouzdanost od 10% na ~993 h, dok bi oni u eksploatacionim uslovima ispitivanja to dostigli na ~380 h.
Slika 5. Ukupna pouzdanost ležišnih sklopova prvih zglobova
u laboratorijskim i eksploatacionim uslovima ispitivanja Figure 5. Overall reliability of bearing assemblies of the first joints
in laboratory and exploitation conditions
Na Sl. 6 prikazane su ukupne prosečne pouzdanosti za posmatrane dijagnostičke parametre temperature i aksijalnih ubrzanja vibracija na ležišnim sklopovima drugih zglobova u laboratorijskim i eksploatacionim uslovima ispitivanjima. Sa Sl. 6 se može zaključiti da bi ležišni sklopovi drugih zglobova u laboratorijskim uslovima dostigli

Ašonja A., et al.: Uticaj dijagnostike stanja na pouzdanost.../Polj. tehn. (2014/1), 21 - 30 26
pouzdanost od 10% na ~611 h, dok bi oni u eksploatacionim uslovima ispitivanja to dostigli na ~321 h.
Slika 6. Ukupna pouzdanost ležišnih sklopova drugih zglobova
u laboratorijskim i eksploatacionim uslovima ispitivanja Figure 6. Overall reliability of bearing assemblies of the second joints
in laboratory and exploitation conditions
Završna ispitivanja, ukupne pouzdanosti dvostrukih poljoprivrednih kardanskih vratila, zasnovana na prosečnim pouzdanostima posmatranih dijagnostičkih parametara na prvim i drugim zglobovima za laboratorijske i eksploatacione uslove, prikazana su na Sl. 7 i 8. Na Sl. 7 vidi se da bi prosečna predviđena pouzdanost kardanskog vratila u laboratorijskim uslovima bila ~378 h rada, pouzdanost samo drugih zglobova ~611 h, dok bi prvih bila znatno viša.
Slika 7. Prosečne pouzdanosti zglobova (vratila) u laboratorijskim ispitivanjima
Figure 7. Average reliability of joints (shaft) in laboratory test

Ašonja A., et al.: The Influence of Diagnostic State.../Agr. Eng. (2014/1), 21 - 30 27
Na Sl. 8 vidi se da bi prosečna predviđena pouzdanost kardanskog vratila u eksploatacionim uslovima bila ~174 h rada, pouzdanost samo drugih zglobova ~321 h, dok bi pouzdanost prvih zglobova iznosila ~380 h.
Slika 8. Prosečne pouzdanosti zglobova (vratila) u eksploatacionim ispitivanjima
Figure 8. Average reliability of joints (shaft) in exploitation conditions
Rezultati dijagnostičkih istraživanja pri ispitivanju pouzdanosti kardanskih vratila na laboratorijskom stolu, pri uglu zakretanja vratila od 20º, ukazali su na veoma složene uslove rada. Razloge zašto se vek trajanja, dvostrukih poljoprivrednih kardanskih vratila, u eksploatacionim rezultatima ispitivanja razlikuje od rezultata dobijenih u laboratorijskim uslovima i zašto je nivo eksploatacije poljoprivrednih kardanskih vratila znatno složeniji, treba tražiti u sledećim konstatacijama [10]:
- nedovoljan nivo tehničkog održavanja, (prvenstveno u vršenju procesa podmazivanja koje treba da se izvodi u skladu sa preporukama proizvođača kardanskih vratila, koja su kod svih ista i izvode se na svakih 8 časova rada),
- nezaštićenost vratila od atmosferskih uticaja kako za vreme rada tako i za vreme kada se vratilo ne koristi,
- nemogućnost konstantnog održavanja paralelnih uglova na ulaznom i izlaznom vratilu, zbog veoma složenih uslova (konfiguracije terena, okretanja mašina i sl.) koji vladaju u poljoprivrednoj proizvodnji,
- nagli udari prilikom svakog uključivanja kardanskih vratila, - promena radnih uglova u toku rada kardanskog vratila pod opterećenjem, - prenos vibracija sa radne i priključne mašine na vibracije u ležišnim sklopovima
kardanskog zgloba, - korišćenje vratila za rad na više raznih priključnih mašina; ponekad se koriste i
na mašinama čiji obrtni momenti prevazilaze ukupne dozvoljene obrtne momente na kardanskim prenosima,
- ne pridržavanje uputstava da se kardanska vratila uvek obrću u istom smeru i - neadekvatna upotrebi.
Ašonja A., et al.: Uticaj dijagnostike stanja na pouzdanost.../Polj. tehn. (2014/1), 21 - 30 28
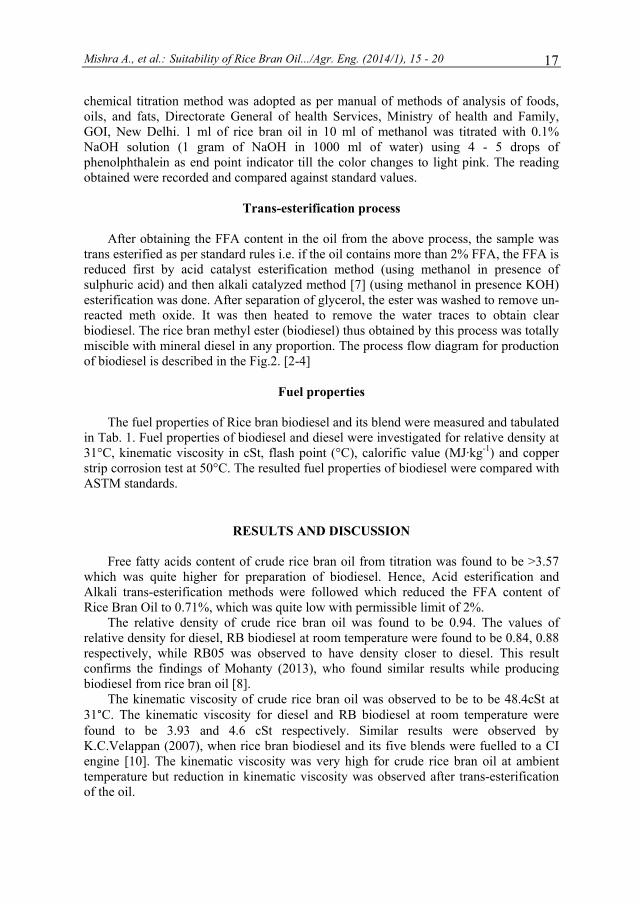
Ključni rezultati istraživanja u okviru navedenih ispitivanja pouzdanosti dvostrukih kardanskih vratila su:
- drugi kardanski zglob na dvostrukom kardanskom vratilu je deo tehničkom sistema koji prvi otkazuje,
- veoma mala pouzdanost i vek trajanja poljoprivrednih kardanskih vratila u eksploataciji, su posledice neadekvatnog tehničkog održavanja i upotrebe, kao i složenih uslova koji vladaju u poljoprivrednoj proizvodnji,
- gotovo identične dijagnostičke parametre na praćenju ležišnih sklopova kardanskih zglobova pokazale su vrednosti aksijalnih vibracija, prvenstveno ubrzanja i temperature,
- ne preporučuje se korišćenje kardanskih vratila u eksploataciji pod uglom zakretanja >20º, jer pri navedenim uglovima zakretanja i pri opterećenjima >75 Nm, u uslovima strogo paralelnih vratila u Z izvedbi, nivo aksijalnih vibracija (ubrzanja) ulazi u zonu nepoželjnih,
- pod uglom zakretanja dvostrukih kardanskih vratila od 20o čak i pri minimalnim korišćenim opterećenjima od 36 Nm primetno je bilo izlivanje masti iz ležišnih sklopova na oba zgloba, što je sigurno bila posledica visokog nivoa vibracija,
- pri jednosmerno promenljivim opterećenjima od 36,15, 55,25 i 74,86 Nm, dvostruka kardanska vratila u laboratorijskim uslovima ispitivanja izdržala su bez ikakvih vidljivih oštećenja do 304 h rada, dok su ona u eksploatacionim ispitivanjima izdržala u proseku 139 h rada,
- predviđena pouzdanost na dvostrukim poljoprivrednim kardanskim vratilima u eksploataciji (u trenutku vremena predotkazne pouzdanosti od 10 %), mogla bi se uvećati za ~2,17 puta i iznosila bi ~378 h, sl.7 i 8,
- kao najvažniji razlozi u odstupanju veka trajanja u eksploatacionim u odnosu na laboratorijska ispitivanja mogu se nabrojati: neadekvatno tehničko održavanje, složeni uslovi konfiguracije terena i eksploatacije koji vladaju u poljoprivrednoj proizvodnji, mogućnosti pojave kratkotrajnih neparalelnosti između ulaznih i izlaznih vratila i sl.,
- kao posledice nelinearnog kontakta između iglica i rukavaca krstaka odn. šoljica, na svakom rukavcu krstaka vidljiva su bila oštećenja u vidu otanjene površine na gornjem delu rukavca pod najvećim uglom od ~120º, odn. na šoljicama od 100o,
- nešto veći ugao oštećenja primetan je bio na površinama rukavaca krstaka drugih kardanskih zglobova u odnosu na prve,
- predstavljeni matematički modeli zasnovani na analizi dijagnostičkih veličina, korišćeni u analizi pouzdanosti dvostrukih poljoprivrednih kardanskih vratila, su validni i predstavljaju novinu u definisanju pouzdanosti ovakvih tipova mehaničkih prenosnika snage i
- predstavljeni matematički modeli zasnovani na analizi dijagnostičkih parametara mogu se primeniti i na ostalim mehaničkim prenosnicima snage.

Ašonja A., et al.: The Influence of Diagnostic State.../Agr. Eng. (2014/1), 21 - 30 29
ZAKLJUČAK
Analiza pouzdanosti dvostrukih poljoprivrednih kardanskih vratila koja se koriste u eksploataciji između traktora i priključne mašine, ukazuju na činjenicu da se može predvideti njihov vek trajanja. Eksploataciona ispitivanja pouzdanosti kardanskih vratila ukazala su na znatno manji vek trajanja ležišnih sklopova na kardanskim zglobovima u odnosu na sprovedena laboratorijska ispitivanja. Kao prvenstveni razlozi koji utiču na to, ističu se: neadekvatno održavanje, složeni uslovi konfiguracije terena koji vladaju u poljoprivrednoj proizvodnji, neodgovarajuća upotreba i sl.
Rezultati istraživanja pokazali su da ne treba koristiti dvostruka poljoprivredna kardanska vratila pod uglovima zakretanja zglobova većim od 20º. Pod navedenim uglovima zakretanja zglobova i sa veoma malim korišćenim opterećenjima tokom ispitivanja pouzdanosti kardanskih vratila primećene su pojave veoma visokih vrednosti dijagnostičkih parametara i izlivanje maziva iz ležišnih sklopova u toku rada. Dijagnostika stanja na kotrljajnim ležajevima kardanskih vratila poljoprivrednih mašina, za date uslove korišćenja, ukazala je pre svega na sve nedostatke navedenog mehanizma u procesu eksploatacije, na osnovu kojih su predložene mere za dalje mogućnosti eksploatacije (kroz vek trajanja kotrljajnih ležajeva) u cilju povećanja pouzdanosti kardanskih vratila.
LITERATURA
[1] Fischer, I.S., de Waal, J.K. 1995. Experimental Study of Cardan Joint Dynamics. ASME Journal of Mechanical Design. American Society of Mechanical Engineers, 117 (4), pp.526-531.
[2] Ерохин, М.Н, Пастухов, А.Г. 2008. Надежность карданных передач трансмиссий сельскохозяйственной техники в эксплуатации. Белгородская государственная сельскохозяйственная академия, Белгород.
[3] Ašonja, A. 2008. Ekonomska opravdanost reparacije ležišnih sklopova, Poljoprivredna tehnika, 33 (1), 67-73.
[4] Пастухов, А.Г. (2008). Повышение надежности карданных передач трансмиссий сельскохозяйственной техники. Докторская диссертация, Белгородская государственная сельскохозяйственная академия - Московский государственный агроинженерный университет имени В.П. Горячкина (ФГОУ ВПО МГАУ), Москва.
[5] Iowa FACE Program. 2002. Tanker Truck Driver Killed by Unshielded PTO Shaft, Case No. 2IA24, The University of Iowa.
[6] Cecchini, M., Monarca, D., Biondi, P., Colantoni, A., Menghini, G., Brenciaglia, G. 2011. Safety of Tractor PTO Drive Shafts: Survey on Maintenance on a Sample of Farms in Central Italy. Efficient and safe production processes in sustainable agriculture and forestry, XXXIV CIOSTA CIGR V Conference.
[7] Ašonja, A., Adamović, Ž., Gligorić, R., Mikić, D. 2012. Razvoj modela laboratorijskog stola za ispitivanje pouzdanosti poljoprivrednih kardanskih vratila. Tehnička dijagnostika, 11 (3), pp.27-32.
[8] Ilić, B., Adamović, Ž., Jevtić, N. 2012. Automatizovana dijagnostička ispitivanja u procesnoj industriji. Tehnička dijagnostika, 11 (3), pp.11-18.

Ašonja A., et al.: Uticaj dijagnostike stanja na pouzdanost.../Polj. tehn. (2014/1), 21 - 30 30
[9] Ilić, B., Adamović, Ž., Jevtić, N. 2012. Primena metoda veštačke inteligencije prilikom donošenja dijagnostičkih zaključaka o stanjima mašina u procesnoj industriji. Tehnička dijagnostika, 11 (3), pp.33-40.
[10] Ašonja, A., Adamović, Ž., Jevtić, N. 2013. Analysis of Reliability of Carda Shafts Based on Condition Diagnostics of Bearing Assembly in Cardan Joints. Journal Metalurgia International, 18 (4), pp.216-221.
THE INFLUENCE OF DIAGNOSTIC STATE OF RELIABILITY OF AGRICULTURE DOUBLE CARDAN SHAFT
Aleksandar N. Ašonja1, Aleksandr Genadievič Pastuhov2
The Serbian Academic Center, Novi Sad
2Belgorod State Agricultural Academy named after V. Gorin, Belgorod, Russia
Abstract: This paper presents a reliability model of double agricultural cardan shafts based on diagnostic of the state of box-set on the cardan shaft joints. The reliability model of cardan shaft was based on an examination of diagnostic sizes of box-set on the cardan shaft joints. The main aim of the proposed and conducted research in the presented paper was diagnostic of box-set at cardan shafts joints in order to define the reliability of cardan shafts. For the needs of examination it have been designed and manufactured laboratory-examination stand, a model, "ANA", type: model: 23-26-26-04, which is primarily intended for testing the reliability of agricultural cardan shafts.
Key words: reliability, double cardan shaft, bearing assembly
Prijavljen: Submitted: 12.8.2013.
Ispravljen: Revised:
Prihvaćen: Accepted: 07.10.2013.
Univerzitet u Beogradu Poljoprivredni fakultet Institut za poljoprivrednu tehniku Naučni časopis POLJOPRIVREDNA TEHNIKA Godina XXXIX Broj 1, 2014. Strane: 31 – 38
University of Belgrade Faculty of Agriculture
Institute of Agricultural Engineering Scientific Journal
AGRICULTURAL ENGINEERING Year XXXIX No. 1, 2014. pp: 31 – 38
UDK: 621.313 Originalni naučni rad Original scientific paper
COMPARISON OF THE PERFORMANCE CHARACTERISTICS OF AN INDUCTION MOTOR, THE PARAMETERS OF WHICH
ARE DETERMINED EXPERIMENTALLY AND BY A GENETIC ALGORITHM
Anka Krasteva*, Donka Ivanova, Miglena Hristova
University of Ruse, Faculty of Electrical and Electronic Engineering and Automation,
Ruse, Bulgaria
Abstract: In the present study, the parameters of the T-shaped equivalent circuit of an induction motor (IM) are defined by way of experiment and by using a genetic algorithm. An algorithm is constructed for obtaining data about the performance characteristics of an IM through models created in the Matlab/Simulink environment. A virtual setup is developed by means of which a comparison is made of the performance characteristics of an IM, the parameters of which are obtained experimentally and by a genetic algorithm. The relative errors for the studied values are determined and reasonable grounds are given for the possibility of using a genetic algorithm to determine the parameters of the equivalent circuit.
Key words: induction motor, Matlab/Simulink, genetic algorithm
INTRODUCTION
In order to compute the performance and mechanical characteristics of induction motors and determine their efficiency at different loads, the exact values of the parameters (resistance and inductive reactance of the stator and rotor windings and of the magnetizing circuit) from the equivalent circuit of an induction motor (IM) have to be known.
* Corresponding author. E-mail: [email protected]

Krasteva A., et al.: Poređenje karakteristika jednog .../Polj. tehn. (2914/1), 31 - 38 32
For determining the equivalent circuit parameters of IM, a number of methods have been created and new ones are continuously being developed. Most generally, these methods can be classified in two groups: analytical and experimental.
The analytical methods, according to the data that are used for determining the equivalent circuit parameters, are as follows: method based on the motor nameplate data; method of catalog data; method of reference data; etc.
The classic experimental method is based on data from the no-load test and short- circuit test and is difficult to apply in practice but the parameters defined through it correspond with high accuracy to the specific motor being tested. New contemporary experimental methods for determining the parameters of IM have been developed that allow avoiding the carrying out of no-load and short-circuit tests. In some, a genetic algorithm is used [1, 2], which optimizes the data from measurements at different loads of the supply voltage, current, power consumption, stator winding resistance, and rotational speed, in order to obtain the parameters of the T-shaped equivalent circuit.
The purpose of this study is by means of a virtual setup to take and compare the data necessary to build the performance characteristics of an induction motor (IM), with the parameters of the T-shaped equivalent circuit being determined by two different methods – experimentally and by using a Genetic Algorithm (GA).
MATERIAL AND METHODS
A block diagram is given in Fig. 1, in which the steps for obtaining data about the performance characteristics of an IM by means of a virtual setup are specified. The IM parameters are determined by two different methods –experimentally, and by using a Genetic Algorithm (GA). During the first step, experiments have been held in laboratory conditions with an induction motor (IM) of the type 1LA9083-2KA60, energy efficiency class EEF1, with the following catalogue data: Rated power Pr = 1,1 kW, rotational speed nr = 2860 min-1, rated voltage Ur = 400V, rated current Ilr = 2,1A, efficiency η = 0,85, power factor cos φ = 0,89, delta connection of the stator winding. To compute the parameters of the T-shaped circuit (Fig. 2) of the IM based on experimental data, the methodology described in [3] is applied.
The necessary input data according to the methodology are as follows: rated nameplate data of the IM, stator winding resistance, no-load and short-circuit test results. The no-load test provides the measured values for the current Io, voltage Uo and power Po at rated voltage, and the short-circuit test provides the current Ik, voltage Uk and power Pk at rated current.
The stator winding resistance Rl is measured using a measuring bridge or by the ammeter and voltmeter method with DC supply.
Based on the data obtained in the experimental study of the IM, the values of resistance and inductive reactance of the stator winding Rl = 13,16Ω, Xl = 18,05Ω, and rotor winding Ω03,20R'
2 = , Ω05,18X '2 = and of the magnetizing circuit Xμ = 799,31 Ω
have been measured by the methodology, described in [3]. In order to determine the parameters of the T-shaped equivalent circuit of the
IM using a GA (second step in Fig.1) the objective function is necessary to be selected, by means of which to obtain results similar to the ones produced experimentally.

Krasteva A., et al.: Comparison of the Performance.../Agr. Eng. (2014/1), 31- 38 33
Figure 1. Algorithm for obtaining data on the IM performance characteristics using models
in the Matlab/Simulink software environment

Krasteva A., et al.: Poređenje karakteristika jednog .../Polj. tehn. (2914/1), 31 - 38 34
2R′
1U 1I
2X′1X1R
2I′μIμX s
s1−′2R
a
b Figure 2. Т – shaped equivalent circuit of an IM
RESULTS AND DISCUSSION
To create the objective function, it is necessary to define the equivalent resistance Req, the equivalent inductive reactance Xeq and the impedance Zeq of the equivalent circuit using the following formulas:
( )
;XX
sR
sRX
RR2
2
22
22
1eq
μ
μ
+′+⎟⎠⎞
⎜⎝⎛ ′
′
+= (1)
( )
( );
XXs
R
XXXXXs
R
XX2
2
22
22
22
1eq
μ
μμμ
+′+⎟⎠⎞
⎜⎝⎛ ′
+′′+⎟⎠⎞
⎜⎝⎛ ′
+= (2)
.2екв
2еквeq XRZ += (3)
In the M-file of the GA, the power factor cos φ, current consumption Il, power
consumption Pl are computed by the formulas:
екв
11 Z
UI = ; (4)
; RXgarctancoscosекв
екв⎟⎟⎠
⎞⎜⎜⎝
⎛=ϕ (5)
ϕcosIU3P 111 = . (6)
For the study, the following objective function is selected, where n is the number of data groups:
∑ ∑∑= ==
⎟⎟⎠
⎞⎜⎜⎝
⎛−+⎟
⎟⎠
⎞⎜⎜⎝
⎛−+⎟⎟
⎠
⎞⎜⎜⎝
⎛−=
n
1i
n
1i
2
iм1
ie1
2
iм1
ie1n
1i
2
iм
ie 1PP
1II
1coscosF
ϕϕ (7)

Krasteva A., et al.: Comparison of the Performance.../Agr. Eng. (2014/1), 31- 38 35
The measured values are marked with an index „е“, while the values computed through GA have an index “m”. The experimentally obtained data for Ilie, cos φie, Plie and slip serve as input data to the GA. To determine the objective function optimum value (7), IliM, cos φiM and PliM are computed from the equations (4), (5) and (6). Output data of the GA are the parameters of the T-shaped equivalent circuit.
This paper presents the solution of the optimization problem by a GA using two sets of experimental data. They are obtained from the study of an IM in laboratory condition for two different loads (Р2/Р2r) – 28,18% and 93,80%. The IM is loaded by a separately excited DC generator. The resulting values for the phase voltage U1, current I1, power consumption P1, rotational speed n, power factor cos φ, motor shaft effective power Р2 are given in Tab. 1.
Table 1. Experimental results from the load test of an IM of EEF1 energy class
U1 I1 P1 n Р2 cosϕ Р2/Р2r [V] [A] [W] [min-1] [W] [-] [%] 391 0,570 374,1 2960 310,00 0,559 28,18 391 1,215 1266,0 2846 1031,85 0,887 93,80
For solving the optimization problem, limitations are set on the equivalent circuit
parameters. The range is specified within which their values change in relative units [4]. An M-file is generated that includes the object function, the experimental data from
Tab. 1, and the basic dependencies (1) to (7) determined according to the circuit in Fig. 2. The solution of the optimization problem using a Genetic Algorithm produces the following values for the resistance and inductive reactance of the stator winding: Rl = 15,99 Ω, Xl = 16,56 Ω and rotor winding: Ω44,18R2 =′ , Ω56,16X 2 =′ and for the magnetizing circuit Xμ = 775,59 Ω.
At the third step of the algorithm described in Fig. 1, a virtual setup (Fig. 3) is created, with two IM, AD1 and AD2, and the performance of the setup at different loads is simulated. The parameters of the equivalent circuit of AD1 are determined experimentally, while those of AD2 – by a GA. The proposed setup is used to compare the performance characteristics of the two motors.
For the designing of the stand, two completed blocks of a three-phase induction machine, designated as AD1 and AD2, are used. The motors are powered by a Three-Phase Programmable Voltage Source. At the output of the Machines Measurement Demux1 and Machines Measurement Demux2 blocks information is obtained about the currents in the stator winding in different coordinate systems, the angular speed, electromagnetic torque, other state variables, which are fed to the input of the developed Performance 1 and Performance 2 subsystems. They are used to obtain data about the current consumption I1, power consumption P1, power factor cos φ, rotational speed n, efficiency, motor shaft torque М2, motor shaft effective power Р2 that are necessary to construct the performance characteristics of the induction motor.
The data about the performance characteristics of an IM, the parameters of which are determined experimentally and by a GA, are compared using the relative error δ. Its percentage value is computed by the developed subsystem Relative error that has 14

Krasteva A., et al.: Poređenje karakteristika jednog .../Polj. tehn. (2914/1), 31 - 38 36
inputs and 3 outputs. The relative error δ of the studied values is computed by the formula:
%, 100,1
12
xxx −
=δ (8)
where X1 is the value obtained from simulation on the virtual setup for АD1, while X2 is the value obtained for АD2.
Figure 3. Virtual setup for taking the performance characteristics of an induction motor
in the Matlab/Simulink environment
Table 2 Data about the relative error obtained for the two IM for which the parameters are determined experimentally and by using a GA at different relative loads (RL)
RL Iδ 1Pδ ϕδcos nδ ηδ 2Mδ 2Pδ % % % % % % % % 10 3,028 2,290 0,693 0,041 2,126 0,074 0,115 25 2,387 1,086 1,244 0,103 0,956 0,017 0,111 50 1,451 0,845 0,564 0,204 0,610 0,025 0,229 75 0,970 0,906 0,563 0,301 0,566 0,033 0,335
100 0,809 1,017 0,205 0,400 0,615 0,005 0,395
To the first seven inputs of Relative error information is supplied for the values of the performance characteristics of the first motor, and to the inputs from 8 to 14 -of the second one, respectively. The display connected to output 1 visualizes the values for AD1, and the one connected to output 3 is used for AD2. From output 2 information is received for the relative error.

Krasteva A., et al.: Comparison of the Performance.../Agr. Eng. (2014/1), 31- 38 37
The procedure for adjustment of the individual blocks in the circuit is described in detail in [5, 6].
Table 2 shows the relative error δ of the studied values for the IM the parameters of which are determined experimentally and by a GA.
The highest relative error - 3.028% in the study is received for the current consumption at a relative load of 10%. From Tab. 2 it is evident that the errors for the other tested values are very small. On these grounds it can be asserted that by using a GA to determine the T-shaped equivalent circuit parameters of an IM, and the suggested virtual setup, we can receive data about the performance characteristics of an IM which describe with sufficient accuracy the data about the performance characteristics obtained by the simulated operation of an IM the parameters of which are determined by way of experiment.
CONCLUSIONS
An algorithm has been drawn up for obtaining data based on which the performance characteristics of an IM can be built in the Matlab/Simulink environment.
With the use of data about two different loads applied to a VFD and a GA, the parameters of the T-shaped equivalent circuit are determined. A virtual setup is created, in which the performance of an IM is simulated after obtaining the parameters of its T-shaped equivalent circuit in two different ways – experimentally, and by using a Genetic Algorithm. The obtained values for the relative errors of the studied parameters are very small, up to 3%. Therefore, the Genetic Algorithm can be used to determine the parameters of the equivalent circuit with sufficient accuracy, without carrying out no-load or short-circuit tests. Thus it is possible to easily take the performance characteristics of an induction motor by means of a virtual setup and to determine the power indices of automated drives at different loads.
BIBLIOGRAPHY
[1] Ertan, B., Leblebicioglu, K., Avenoglu, B., Ercan, B. 2003. Identification of parameters of an induction motor from field solution. Proceedings of the Sixth International Conference on Electrical Machines and Systems ICEMS 2003, Vol. 1, 2003 , pp. 1-6.
[2] Kostov, I., Spasov, V., Rangelova, V. 2009. Application of genetic algorithms for determining the parameters of induction motors. Scientific-professional journal of technical faculties of the University of Osijek, 2009, Vol.16, pp. 49-53.
[3] Христова, М. 2011. Методика за определяне натоварването и коефициента на полезно действие на асинхронните двигатели. Енергетика, 2011, брой 4, стр. 25-29.
[4] Волдек, А. 1971. Електрически машини. ДИ Техника. София. 1971. [5] Христова, М., Кръстева, A. 2012. Изследване на трифазен асинхронен двигател в
програмната среда на Matlab/Simulink. Известия на съюза на учените. Русе, 2012. [6] Черных, И.В. 2008. Моделирование электротехнических устройств в MATLAB,
SimPowerSystems и Simulink, М. ДМК Пресс, Москва 2008.

Krasteva A., et al.: Poređenje karakteristika jednog .../Polj. tehn. (2914/1), 31 - 38 38
POREĐENJE KARAKTERISTIKA JEDNOG INDUKCIONOG MOTORA, ČIJI PARAMETRI SU ODREĐENI
EKSPERIMENTALNO I GENETIČKIM ALGORITMOM
Anka Krasteva, Donka Ivanova, Miglena Hristova
Univerzitet Ruse, Fakultet za elektrotehniku, elektroniku i automatizaciju,
Ruse, Bugarska
Sažetak: U predstavljenom istraživanju, parametri T-ekvivalentnog kola jednog indukcionog motora (IM) su definisani eksperimentalno i upotrebom genetičkog algoritma. Algoritam je formiran za dobijanje podataka o performansama jednog IM kroz modele koji su kreirani u Matlab/Simulink okruženju. Virtuelni setap je razvijen poređenjem karakteristika jednog IM, čiji parametri su određeni eksperimentalno i genetičkim algoritmom. Za proučavane vrednosti su određene relativne greške i date su logične osnove za mogućnost upotrebe genetičkog algoritma za određivanje parametara ekvivalentnog kola.
Ključne reči: indukcioni motor, Matlab/Simulink, genetički algoritam
Prijavljen: Submitted: 04.10.2013
Ispravljen: Revised:
Prihvaćen: Accepted: 12.01.2014.

Univerzitet u Beogradu Poljoprivredni fakultet Institut za poljoprivrednu tehniku Naučni časopis POLJOPRIVREDNA TEHNIKA Godina XXXIX Broj 1, 2014. Strane: 39 – 47
University of Belgrade Faculty of Agriculture
Institute of Agricultural Engineering Scientific Journal
AGRICULTURAL ENGINEERING Year XXXIX No. 1, 2014. pp: 39 – 47
UDK:621.31 Originalni naučni rad Original scientific paper
RESULTS FROM A STUDY ON THE TEMPERATURE OF SOLAR MODULES
Konstantin Koev*, Krasimir Martev
University of Ruse “Angel Kanchev”, Faculty of Electrical and Electronic Engineering
and Automation, Department of Electrical Power Engineering, Ruse, Bulgaria
Abstract: A research was made on the influence of the temperature of stationary photovoltaic modules on the production of electricity. The modules are connected in groups, with a total maximum installed capacity of 117.24 kWp. They are mounted on the roof of a non-residential building, located in an uninhabited area. The study covers several typical months in the period from January 2009 to December 2012. The produced electricity changes in the interval 0 - 25.55kWh, for a temperature difference between the photovoltaic modules and the environment in the range of -5 to +30° C.
Key words: photovoltaic modules, temperature of the modules, electrical energy, overheating, cooling
INTRODUCTION
One method of converting the energy of the solar radiation is through the use of the photovoltaic effect [1]. It is used widely in the photovoltaic cells and panels for receiving electrical power. The biggest advantages of this technology are the availability of virtually unlimited amounts of free energy source (solar radiation) and the lack of hazardous waste [2]. Major disadvantage of the photovoltaic modules is their low efficiency (efficiency), the values of which decreases continuously during operation [3].
Several studies show that the characteristics of the photovoltaic modules depend on their temperature [4]. Therefore are proposed models of these relationships through which are examined and predicted the duration and effectiveness of the operation of photovoltaic modules [5].
* Corresponding author. E-mail: [email protected]

Koev K., et al.: Rezultati ispitivanja temperature solarnih.../Polj. tehn. (2014/1), 39 - 47 40
The purpose of this study is to analyse the changes in the power output, related to the overheating of photovoltaic modules in the region of Rousse, Bulgaria.
MATERIAL AND METHODS
Subject of the study
The examined object is a photovoltaic system with a total maximum power of the modules 117.24 kWp [6]. The modules are located on the roof of a non-residential building, located in an uninhabited territory at an altitude of 76 m and in a moderate continental climate. The site is located in the region of Ruse, near the Danube river.
The chosen site is unique for several reasons. The photovoltaic system is with power more than 100 kWp and is built on a roof structure. The area of the city of Ruse, where the system is established is characterized by the second largest in Bulgaria annual average intensity of solar energy 1450 - 1500 kWh·m-2 [7]. Another feature of the object is that it is composed of more than one type of photovoltaic modules, arranged in rows and sections. This is a prerequisite for making comparative analysis of the climate characteristics of the modules by types, sections and rows.
The total number of the modules is 824, and 528 of them have a maximum power - 130 Wp. They are arranged in 4 lines, with 3 sections (Fig. 1) and in each section are mounted 44 modules. The remaining 324 modules have a maximum power of 150 Wp each, and are located in the northern part of the roof (Fig. 1). These modules are divided into 6 sections, each comprising 54 modules, arranged in 2 rows.
Figure 1. Location of the modules in sections and rows on the roof: N - north; S - south
The produced electrical energy is converted by inverters fitted to each section of
photovoltaic modules. The total number of inverters is 18.
Methods and tools for the study
Solar irradiation and the temperature of the modules are the main factors determining the production of electricity from photovoltaic modules [1,3]. The first factor is decisive, because it also affects the temperature of the modules.
The electricity output is determined by the information received from the inverters, and recorded every 15 minutes.

Koev K., et al.: Results From a Study on the Temperature.../Agr. Eng. (2014/1), 39 - 47 41
The temperature of the modules and the environment is measured by a resistive transducers type Pt100, with range –40 to +125°C and accuracy of ± 0,5°C. The values of the temperatures recorded at the same interval as the electrical energy - 15 minutes.
Very often, rather than the temperature of the photovoltaic modules, it is convenient to monitor the temperature of their overheating compared to the ambient temperature [8]. It is represented as the difference between the temperatures of the modules Tm and the environment Ta, i.e. (Tm - Ta). Overheating temperature gives an idea of the thermal regime in which the modules operate at different ambient temperatures. This is particularly important in photovoltaic modules, because they are made of semiconductor cells, for which the parameters strongly depend on the temperature [1,3].
RESULTS AND DISCUSSION
In the study are examined four years from the operation of photovoltaic modules - 2009 - 2012, in the specific geographic conditions. Processed data cover the months during which are produced the greatest amounts of electricity for the year. These months are May of 2009, August of 2010, and July of 2011 and 2012.
Produced quantities of electric energy E from the photovoltaic plant are different for each month throughout the year and the decisive point is the influence of solar irradiation. Its power intensity set for 1 m2 area of photovoltaic panels is amended periodically. The maximum values of the intensity are observed during the summer months, and the minimum - in the winter. This is explained by the latitude at which the object is located.
Electricity output for the period 2009 - 2012 is presented in Fig. 2. Below are the total electrical energy per year (kWh) and the months with the highest production during the year (% of annual production). Comparing the values for the entire period shows that the amount of electricity produced is highest in July 2012 - 19 707.25 kWh. This year the production is also the largest - 154 315.8 kWh, as in July were generated 12.77% of this amount.
138964.1154315.8
12.94 % 12.66 % 12.75 % 12.77 %
146344.2147809.7
0
20000
40000
60000
80000
100000
120000
140000
160000
May 2009 Aug 2010 July 2011 July 2012
E, kWh
monthly yearly
Figure 2. Generated electricity for the period 2009 - 2012 by year and month with the highest production in the respective year

Koev K., et al.: Rezultati ispitivanja temperature solarnih.../Polj. tehn. (2014/1), 39 - 47 42
The analysis of the data indicates that the total amount of electricity produced in 2009, is higher than that in 2011 by 1 465.5 kWh. This is 1% of the quantity produced during 2011. In addition, the share of the month with the highest production for 2009 - May is the highest for the four years - 12.94% (Fig. 2). For these reasons, the data for 2009 are an exception from the trend for changes of production in the period 2010 - 2012. Then there is an increase in both the total annual quantity of electricity, and the share of the month with the highest production. The generated electricity in May 2009 was 19119.34 kWh, and in July 2012 was 19707.25 kWh. The share of these amounts in the total annual production is respectively 12.94% and 12.77%. The difference in the final values is due to the fact that the total annual electricity production in 2009 was lower than in 2012.
The observed changes in electricity production are mainly due to the changes in weather conditions under which works the photovoltaic system. These changes affect the performance of the modules, as the main factor is the thermal regime. It is determined by the solar irradiation and the conditions of cooling. This requires to be studied the influence of the temperature of the modules on the production of electricity.
Collected and processed are data for the production of electricity for the months considered - May 2009, August 2010, July 2011 and 2012. The amounts of energy and module temperature Tm and the environment Ta are recorded every 15 min. PV modules generate electricity only during daylight when solar irradiation is large enough. In some clear nights, especially on a full moon, are registered very small amounts of energy produced (several tens Wh). This is due to the limited light flux of the moon. For these reasons, the data for the energy and temperature are presented and analyzed only for the hours of daylight.
In Fig. 3 - Fig. 6 are presented the dependencies of the produced electrical energy E, kWh, the difference in temperature (Tm-Ta), °C, for the four months considered, for each day of the month.
May 2009
0
5
10
15
20
25
30
1 2 3 4 5 6 7 8 9 10 11 12 13 14 15 16 17 18 19 20 21 22 23 24 25 26 27 28 29 30 31day
E, kWh
-10
-5
0
5
10
15
20
25
30
35
Tm-Ta,oC
E, kWh Tm-Ta, oC
Figure 3. Changes of the produced electrical energy E, kWh, depending on overheating (Tm - Ta), °C, for each day of May 2009
The comparison of the graphs (Fig. 3, 4, 5 and 6) for the impact of the difference in
temperature (Tm-Ta) (overheating modules) on electricity produced E, for each day of the month makes it possible to be detected some particularities. Every day of the four

Koev K., et al.: Results From a Study on the Temperature.../Agr. Eng. (2014/1), 39 - 47 43
months is characterized by a bell rescheduling of the energy produced. There are exceptions, which are least in July, 2012. The charts of the electricity produced are in accordance with the daily changes of solar irradiation [9], which is explained by the strong influence of the latter [10].
The maximum values of the electricity produced in the four months are registered during the midday hours and fluctuate between 20 - 25.55 kWh. It can also be noticed some exceptions - 13th day of May, 2009, 5th, 16th, 30th and 31th of August, 2010, the 3rd of July 2011 and 30th of July 2012. The considerably small and irregular performance of the photovoltaic system in these days is due to the dynamic changes in solar radiation. The latter are due to frequent changes in the cloud cover.
August 2010
0
5
10
15
20
25
1 2 3 4 5 6 7 8 9 10 11 12 13 14 15 17 18 19 20 21 22 23 24 26 27 28 29 30 31
day
E, kWh
-10-505101520253035
Tm-Ta,oC
E, kWh Tm-Ta, oC
Figure 4. Changes of the produced electrical energy E, kWh, depending on overheating (Tm - Ta), °C, for each day of August, 2010
July 2011
0
5
10
15
20
25
30
1 2 3 4 5 6 7 8 9 10 11 12 13 14 15 16 17 18 19 20 21 22 23 24 25 26 27 28 29 30 31
day
E, kWh
-10
-5
0
5
10
15
20
25
30
Tm-Ta,oC
E, kWh Tm-Ta, oC
Figure 5. Changes of the produced electrical energy E, kWh, depending on overheating (Tm - Ta), °C, for each day of July, 2011
The graphs (Fig. 3, 4, 5 and 6) impede the analysis of the functional relationship
between the studied variables - temperature of the overheating (Tm-Ta) of photovoltaic modules and their electricity output E. The analysis shows that it is more appropriate to present the changes of the energy output only depending on the temperature of overheating, without showing the changes in the individual days (Fig. 7, 8, 9 and 10).

Koev K., et al.: Rezultati ispitivanja temperature solarnih.../Polj. tehn. (2014/1), 39 - 47 44
July 2012
0
5
10
15
20
25
1 2 3 4 5 6 7 8 9 10 11 12 13 14 15 16 17 18 19 20 21 22 23 24 25 26 27 28 29 30 31
day
E, kWh
-10
-5
0
5
10
15
20
25
30
Tm-Ta,oC
E, kWh Tm-Ta, oC
Figure 6. Changes of the produced electrical energy E, kWh, depending on overheating (Tm - Ta), °C, for each day of July, 2012
May 2009
0
5
10
15
20
25
30
-5 0 5 10 15 20 25 30
Tm-Ta, oC
E, kWh
Figure 7. Effect of overheating (Tm-Ta) of photovoltaic modules on
their electricity output E, in May 2009
August 2010
0
5
10
15
20
25
-5 0 5 10 15 20 25 30
Tm-Ta, oC
E, kWh
Figure 8. Effect of overheating (Tm-Ta) of photovoltaic modules on
their electricity output E, in the month of August 2010
When comparing the graphical dependence E = f(Tm-Ta) for the four months considered, can be seen that they have approximately the same nature of change. The

Koev K., et al.: Results From a Study on the Temperature.../Agr. Eng. (2014/1), 39 - 47 45
values of the electrical power are positive, increasing from 0 and reaching 22 - 25kWh. Only in May 2009, are reported several values above 25 kWh, the maximum of which is 25.55 kWh. These features can be explained by the relatively high solar radiation and better cooling conditions, in comparison with typical summer months.
July 2011
0
5
10
15
20
25
-5 0 5 10 15 20 25 30
Tm-Ta, oC
E, kWh
Figure 9. Effect of overheating (Tm-Ta) of photovoltaic modules
on their electricity output E, in July 2011
July 2012
0
5
10
15
20
25
-5 0 5 10 15 20 25 30
Tm - Ta, oC
E, kWh
Figure 10. Effect of overheating (Tm-Ta) of photovoltaic modules
on their electricity output E, in the month of July 2012
From the graphs can be observed the presence of ''threshold'' value of the temperature of overheated modules (Tm-Ta), above which the maximum electrical energy output is increasing. This limit is different for the different months and approximately is 17°C in May 2009 (Fig. 7), 15°C in August 2010 (Fig. 8) and July 2011 (Fig. 9) and 13°C in July 2012 (Fig. 10). Therefore, the greatest threshold value of overheating modules was observed in May 2009. The probable cause for this is the better cooling. It can be assumed that the changes in the latter, cause a larger scatter of the values of the produced energy E, when there is overheating of PV modules in the interval (Tm-Ta) = 5 - 20°C (Fig. 7, 8, 9 and 10).
On all the graphs (Fig. 7, 8, 9 and 10) can be seen that the values of the electric energy produced E is characterized by variable diffusion and ambiguity. The latter is expressed in the fact that a particular value of the energy E correspond to several values

Koev K., et al.: Rezultati ispitivanja temperature solarnih.../Polj. tehn. (2014/1), 39 - 47 46
of modules overheating (Tm-Ta). The reason for this ambiguity may be explained by the differing conditions of the cooling of the photovoltaic modules.
Overheating of the modules (Tm-Ta) for all the months is characterized by small negative values. They are in the range -5 to 0°C and are in accordance with the electrical energy produced E = 0 - 5 kWh. Negative values of overheating are observed at the start and in some cases at the end of days. At the beginning of Day Tm < Ta, because the modules are cooled during the night and time passes while they are heated to or above the ambient temperature Ta. At the end of the day the modules are cooling and their temperature Tm decreased, and in most cases it is close in value to the ambient temperature Ta, but it does not fall below it. Therefore, overheating of the module (Tm-Ta) in the evening hours is in the range 0 - 1°C. In some days, with better cooling (e.g., wind), the modules cool down more rapidly than the surrounding air. Then Tm < Ta and are recorded negative values of the overheating (Tm-Ta).
CONCLUSIONS
Collected and processed are data for the operation of a photovoltaic system with a total maximum power 177.24 kWp, located near the town of Ruse. Analysed are the data for the months with the highest annual quantity of electricity produced in the period 2009 - 2012. The study addresses the influence of the temperature of the PV modules Tm on the production of electricity E by the temperature of overheating (Tm-Ta).
It was found that the functional dependencies E = f (Tm-Ta), for all the months were similar, but ambiguous. This is due to the variety of operating conditions - the solar irradiation and thermal regime (cooling). It can be assumed that the ambiguity will be eliminated if the analyses are performed at unchanging solar radiation.
The values of electrical energy E vary in the range (0 - 25.55) kWh, rising continuously until they reach a maximum "threshold" value. The latter changes in the interval 13 - 17°C.
The temperature of overheating of the modules (Tm-Ta) changes in the interval -5 to + 30°C. The negative values -5 to 0°C, are due to changes in the conditions of cooling of the modules - the temperature of the modules Tm is less than the ambient temperature Ta, in the morning hours of the days and in some cases - in their evening hours.
Complete picture of the influence of the temperature of overheating of the modules (Tm-Ta) on electricity produced from photovoltaic modules E can be obtained by an investigation for more months. It is then possible to model the functional relationship E = f (Tm-Ta) even at various values of the solar irradiation.
BIBLIOGRAPHY
[1] 2008. Planning and installing photovoltiac systems : a guide for installers, architects, and engineers. The German Energy Society (Deutsche Gesellshaft fur Sonnenenergie (DGS LV Berlin BRB). Earthscan, London&Sterling, VA (USA).
[2] Machacek, J., Z. Prochazka, J. Drapela. 2009. The Temperature Dependant Efficiency of Photovoltaic Modules - a Long Term Evaluation of Experimental Measurements, Renewable Energy,T J Hammons (Ed.), InTech, WEB: http://www.intechopen.com/books/.
[3] Markvart, T., L. Castañer. 2003. Practical Handbook of Photovoltaics: Fundamentals and Applications. Elsevier Ltd.

Koev K., et al.: Results From a Study on the Temperature.../Agr. Eng. (2014/1), 39 - 47 47
[4] Skolopaki, E., J. A. Palyvos. 2009. On the temperature dependence of photovoltaic module electrical performance: A review of efficiency/power correlations. Solar Energy, issue 83, pp. 614-624.
[5] Köhl, M. 2011. From Climate Data to Accelerated Test Conditions. Fraunhofer Institute for Solar Energy Systems, Freiburg, Germany, presented at the PVMRW, Golden (Colorado, USA), WEB: http://www1.eere.energy.gov/solar/pdfs/pvmrw2011_05_plen_kohl.pdf.
[6] Коев, K. 2011. Моделиране влиянието на някои фактори върху температурата на фотоволтаични модули. Енергетика, 3, стр. 41-46.
[7] Koev, K., A. Krasteva, R. Ivanov. 2012. Potential of the renewable energy resources and their energy in Bulgaria. Journal Ecology and Future 2, p. 3-14.
[8] Nordmann, T., L. Clavadetscher. 2003. Understanding temperature effects on PV system performance. Photovoltaic Energy Conversion. Proceedings of 3rd World Conference (Volume 3), 18-18 May, Osaka, Japan, pp. 2243 – 2246.
[9] Недев, Н., К. Коев. 2012. Изследване производителността на фотоволтаични модули. В: Научни трудове на Русенски университет “Ангел Кънчев", Русе, том 51, серия 3.1, стр. 35-39.
[10] Коев К., Н. Недев, К. Андонов, Кр. Мартев. 2011. Изследване влиянието на някои фактори върху производството на електрическа енергия от фотоволтаични модули. Енергетика, 6, стр. 27-30.
REZULTATI ISPITIVANJA TEMPERATURE SOLARNIH MODULA
Konstantin Koev, Krasimir Martev
Univerzitet “Angel Kančev”, Fakultet za elektroniku, elektrotehniku i automatizaciju, Institut za električne pogone, Ruse, Bugarska
Sažetak: Prikazani su rezultati istraživanja uticaja temperature stacionarnih fotonaponskih modula na proizvodnju energije. Moduli su povezani u grupe, sa ukupnim maksimalnim instalisanim kapacitetom od 117.24 kWp. Postavljeni su na krov zgrade u nenaseljenom području. Istraživanje je izvedeno tokom nekoliko tipičnih meseci, u periodu januar 2009 - decembar 2012. Proizvedena električna energija se menja u intervalu 0 - 25.55 kWh, za temperatursku razliku između fotonaponskih modula i okoline u intervalu od -5 do +30°C.
Ključne reči: fotonaponski moduli, temperatura modula, električna energija, pregrevanje, hlađenje
Prijavljen: Submitted: 29.07.2013.
Ispravljen: Revised:
Prihvaćen: Accepted: 07.10.2013.

Koev K., et al.: Rezultati ispitivanja temperature solarnih.../Polj. tehn. (2014/1), 39 - 47 48

Univerzitet u Beogradu Poljoprivredni fakultet Institut za poljoprivrednu tehniku Naučni časopis POLJOPRIVREDNA TEHNIKA Godina XXXIX Broj 1, 2014. Strane: 49 – 59
University of Belgrade Faculty of Agriculture
Institute of Agricultural Engineering Scientific Journal
AGRICULTURAL ENGINEERING Year XXXIX No. 1, 2014. pp: 49 – 59
UDK: 664.933 Originalni naučni rad Original scientific paper
MODIFIED ATMOSPHERIC PACKAGING STRATEGIES TO PROLONG SHELF LIFE
OF CHICKPEA (Cicer arietinum L.) SPROUTS
Ranjeet Singh1*, Ashok Kumar2, Sitaram D. Kulkarni1
1Central Institute of Agricultural Engineering, Agro-Produce Processing Division, Nabi Bagh, Bhopal, India
2Department of Processing & Food Engineering, Punjab Agricultural University, Ludhiana, India
Abstract: The physicochemical and microbial changes in fresh chickpea sprouts during MA storage at 10°C temperatures and 75 % RH and ambient were examined by monitoring chickpea sprouts weight loss, pH, hypocotyl color changes, texture in terms of hardness, supported by overall visual quality evaluation and microbial infection by yeast and mold enumeration. Under MA storage, chickpea sprouts having different void volume in PP and LDPE polymeric films were stored for a week at 10°C temperature under MAP. In-pack gaseous composition was least in PP as compared with LDPE polymeric films. The PLW (%) was significantly lesser in 200g pack followed by 100; 150 g of sprouted chickpea samples packed PP films than those in LDPE polymeric film packs. Best hardness was maintained by 200g PP and 150g LDPE packaging treatment. Visual evaluation indicates that chickpea sprouts sample packed in 200g PP package received highest significant score. Yeast and mold growth appears to significantly contribute to microbial spoilage of chickpea sprouts, using modified atmosphere may restrict the spoilage problems caused by molds and yeast. Chickpea sprouts packed in Polypropylene (PP) was highly effective in maintaining the physic-textural and microbial analysis as evident by visual evaluation. The LDPE film package did not favorably affect the storage life of chickpea sprouts.
Key words: Chickpea, modified atmosphere packaging (MAP), Polypropylene (PP), low-density polyethylene (LDPE), microbial and visual quality parameters
* Corresponding author. E-mail: [email protected]

Singh R., et al.: Postupci pakovanja u modifikovano .../ Polj. tehn. (2014/1), 49 - 59 50
INTRODUCTION
Chickpea sprouts are the major seed sprouts in most Asian countries. Chickpea seeds can be stored for long periods of time and sprouts can be easily obtained by germinating the seeds in the dark for up to four days [10]. This process has been used by the Asian countries for centuries. Sprouts are a cheap source of certain vitamins in the diet and some vitamins are synthesized in the germinating seeds. The sprouting process results in an improvement in the vitamin content [6].
Though it is easy to grow sprout but the main drawback are shortage of time for sprouting as in most of the families both husband and wife are working. In western countries, china etc. sprouts are grown commercially and made available to consumers [2]. But in India the same trend has been started with the opening of food/vegetable malls. Sprouts are highly perishable in nature and get spoiled if not stored properly. Due to a short shelf life, sprouts are susceptible to get spoiled during distribution or in supermarket [12]. One of the primary causes of spoilage is visible mold growth and/or musty smell from the sprouts. Spoilage occurs sooner and more frequent when sprouts are not refrigerated in the supermarket and/or during distribution. Sprout can be easily bruised and readily infected with various bacteria, mold and yeast during handling and transportation. Sprouts cannot be stored for longer time under ambient conditions. So a method to increase the shelf life of sprout would be advantageous to producers as well as to the consumers and one of the options to increase the shelf life of sprouted chickpea is design and development of a suitable modified atmospheric packaging system. Keeping this in view the study is designed to extend the shelf life of sprouts using suitable polymeric films based on the modified atmosphere packaging under different storage condition.
MATERIAL AND METHODS
Plant Materials
The chickpea seeds (PBG-5) were washed and rinsed with Ca (OCl)2 at 20.000 ppm for 15 min for sterilization. The sterilized seeds were soaked in clean water (1: 3, w/v) for 12 h overnight at ambient room temperature. In the morning, the water is drained and the soaked seeds were rinsed with clean fresh water free from any contamination. The washed seeds (soaked) were then shifted to clean sterile muslin cloth and placed in dark at ambient temperature for sprout growth. After 36-48 h the sprouts were harvested for experimentation.
Measurement of In-pack Gaseous Composition
The in-pack gaseous composition measurement of sprouts was done as per the method adopted by Singh, 2012. A single hole covered with silicon septum was made in polymeric package for measurement of gas concentrations directly with gas analyzer (Model 902 D DualTrak O2/CO2 Analyzer, USA) at each day and gaseous composition O2/CO2 was recorded [3].

Singh R., et al.: Modified Atmospheric Packaging.../Agr. Eng. (2014/1), 49 - 59 51
Physiological Loss in Weight (PLW) The weight loss of chickpea sprout samples packed in PP and LDPE polymeric
package under MAP and having 100, 150 and 200g weight was determined by weighing the individual package initially and on day of observation using a laboratory level weighing scale (Model CX 504, Scaltec Instruments GmbH, Germany) having least count 0.001g [4].
100weightInitial
weightFinalweightInitial(%)PLW Χ−
= (1)
where, PLW [%] - Physiological loss in weight.
pH Analysis
The sprouted chickpea mixture to measure pH was prepared [1] using 1:1 of product
and distilled water. Ten grams of chickpea sprout mixture were blended for 2 min with 10 ml of distilled water (pH 7). Observation (pH) was then taken of the prepared mixture using a portable pH meter (H160G portable pH meter), which was antecedently calibrated using buffer solutions of pH 4 and 7. The pH of the freshly harvested sprouts was measured before packaging and later on each day of analysis from each of the 3 replicates of each treatment stored at 10oC temperature. Three samples per replicate were taken to measure pH.
Evaluation of Color Indices The change in color can act as an analysis parameter to judge the freshness and
quality of sprouted chickpea sprouts while storage [5]. The color of the sprouted chickpea was measured using a Hunter Lab Colorimeter (Miniscan XE plus, Hunter associates, USA) with “L”, “a”, “b” parameters. On each day of storage, the ‘L’, ‘a’ and ‘b’ values were noted using a Hunter Labscan (Model Miniscan XE plus, Hunter associates, USA). Color of the sprouts hypocotyl was measured on each day of analysis from each of the three replicates of each treatment stored at 10°C and control sample. The mean was taken for color indices.
Texture Texture was determined as tenderness/hardness [7]. The freshly harvested sprouted
chickpea sprouts are tender and, as they dry, out they become hard. As we were doing modified atmosphere packaging of the sprouts, we expected the sprouts to maintain the fresh, tenderness characteristic. Texture analysis was done on 10 fresh chickpea sprouts from each of the 3 replicates of each treatment stored at 10°C. The force necessary to compress the sprouts was measured using Texture Analyzer-Stable Micro System Model TA-XT2 (Hamilton, MA). The instrument was calibrated using the protocol provided by the manufacturer as discussed above before starting with the analysis.

Singh R., et al.: Postupci pakovanja u modifikovano .../ Polj. tehn. (2014/1), 49 - 59 52
Visual Quality The visual quality evaluation was carried out for off odors of the sprout,
discoloration, size of sprout and overall acceptance using a 10 point hedonic scale with the help of a test panel consisting of five panelists of different age groups and having different eating habits [8]. The sprouted chickpea was served raw and the average indices (A.I.) of all the panelists were computed for different samples.
evaluatorsof.NoScoresTotalI.A = (2)
Microbiological Analysis
Mold and yeast analysis for chickpea sprout samples in MA storage and control
samples packed in PP and LDPE polymeric film, from each packaging modification during storage on day 0, 1, 2, 3, 4, 5, 6, and 7, was performed (USFDA 1999). Twenty-five g of each sample of serial dilutions were plated onto Potato Count Agar (PCA) which contained 100 µg·ml-1 chloramphenicol (Sigma Chemical, St. Louis, Mo., U.S.A.), and were incubated in the dark for 5 d at room temperature. After incubation, mold and yeast colonies were counted with the assistance of a colony counter [10].
RESULTS AND DISCUSSION
In-pack Gaseous Composition
The average amount of in-pack headspace gaseous composition of oxygen (O2) and carbon- dioxide (CO2) for the safe storage of chickpea sprouts under MAP in perforated polymeric film PP and LDPE is shown in Fig. 1. It is clear from the Fig. 1 that the amount of head space gaseous composition decreased and remained unstable with duration of storage up-to 1st day and then maintained steady state thereafter. The effect of package weights on the gaseous concentration was clearly evident as these were varied between 21.60 to 15.63 %, 21.60 to 14.45 % and 21.60 to 12.15 % for O2 and 0.03 to 8.59 %, 0.03 to 11.08 % and 0.03 to 14.19 for CO2 in PP package having 100, 150 and 200 g of chickpea sprouts.
Figure 1. Package headspace gas composition (O2/CO2) storage under modified atmosphere

Singh R., et al.: Modified Atmospheric Packaging.../Agr. Eng. (2014/1), 49 - 59 53
Similarly, the range for steady state headspace gas composition in LDPE package varied between 21.60 to 14.20 %, 21.60 to 12.39 % and 21.60 to 10.03 % for O2 and 0.03 to 10.57 %, 0.03 to 13.57 % and 0.03 to 16.05 for CO2 having package weight of 100, 150 and 200 g of chickpea sprouts. From this it is clear that in-pack gaseous composition was least in PP as compared with LDPE polymeric films. The effect of different weights on the gaseous composition was very much evident in both the PP and LDPE polymeric film package containing 100, 150 and 200 g of chickpea sprouts.
The headspace gas composition was found to be significant at 5 % level of significance (p≤0.05) influenced by all the factors including type of polymeric film, sample weight and duration of storage.
Physiological Loss in Weight (PLW) The physiological loss in weight can be restored by bounding atmospheric storage
temperature, relative humidity and also by using suitable designed package [9]. It is quite evident from Fig. 2 that the percent physiological loss in weight after 7th day of storage was comparatively lesser in PP film packages than in packages of LDPE polymeric films although the difference in mean values was significant. There was significant (p ≤ 0.05) loss in weight was reported in initial values among the packaging films. PLW percentage increased at slow and steady rate with the duration of storage and rate of loss of weight. The PLW (%) was most in control sprout samples. However, the maximum weight loss was observed to be 0.982 % in LDPE 200g among all the polymeric film packages having different weights of chickpea sprouts. Sealed samples showed very marginal loss in weight as compared to unsealed control samples which recorded initial weight loss up to 6.49 % by the end of last day of storage period. It can be inferred from the trends that the PLW (%) was relatively lesser in 200g pack followed by 100; 150 g of sprouted chickpea samples packed and stored in PP films than those in LDPE polymeric film packs and the mean value difference was significant. Also, the effect of void volume showed significant effect on PLW (%) of sprouted samples sealed in different polymeric films.
Figure 2. Physiological loss in weight (PLW) of chickpea sprout under modified atmosphere
pH of Sprouted Chickpea
The pH values of freshly packed chickpea sprout was alkaline in nature having pH
value more than 7.0. It was observed that the pH value decline gradually in all the

Singh R., et al.: Postupci pakovanja u modifikovano .../ Polj. tehn. (2014/1), 49 - 59 54
packaging treatments during storage. The overall decline was much higher and rapid in LDPE film as compared with PP polymeric film. The cause behind decline in pH would be accumulation of more gaseous concentration inside the LDPE film causing increase in lactate content of packed sprouts during storage. The cause may be satisfying the low pH association with the accumulation of lactate and to a lesser extent of acetate [12] during sprouting. The effect on gaseous concentration caused due to different weight of the sample was very much evident having pH value observed to be 8.27, 8.25 and 8.55 on last day of storage in PP polymeric film. However, the pH of sprouted chickpea packed in LDPE was observed to be 7.85, 6.99 and 5.98 on last 7th day of storage in 100, 150 and 200 g package, respectively. A shift in pH value from alkaline to acidic (9.28 to 5.28) was observed in control sample paced in LDPE film (Fig 3). The cause clearly indicates that the lowering of pH was due to excessive and different gaseous composition developed inside the package containing different weight of chickpea sprout samples. The statistical analysis showed a significant difference between the means of pH value of PP, LDPE and control treatments (p≤ 0.05). The pH of the freshly harvested and packed chickpea sprout sample in PP and LDPE polymeric films sustain alkalinity in nature throughout the storage period.
Figure 3. pH (%) content of chickpea sprouts under modified atmosphere
Color (L-value)
The hypocotyl color of chickpea sprouts is the important quality indices to
determine the freshness of the product for greater acceptability and satisfactory purchase [11]. Deterioration in L value reflects loss in lightness of the sprouts and become off dated. The initial average ‘L’ value of chickpea hypocotyl was 67.68. The average decrease in ‘L’ value on 7th day of storage period was 38.50, 37.67 and 43.07 for PP package and 28.64, 32.59 and 38.57 for LDPE package containing 100, 150 and 200g of samples, respectively. The maximum hypocotyl color retention (Lightness) was observed in 200g PP package followed by 200g LDPE and 100g PP packages. The control sample showed poor off white color retention in both PP and LDPE package having 16.16 and 11.56 ‘L’ value of hypocotyl, respectively. The significant decrease in ‘L’ value of indicated that control sample hypocotyl become darker as compared to other treatment over the entire storage period. It can be concluded that modified atmosphere packaging restore the darkening of the hypocotyl of chickpea sprout samples as well stored in PP and LDPE polymeric packs in different weights (Fig 4).

Singh R., et al.: Modified Atmospheric Packaging.../Agr. Eng. (2014/1), 49 - 59 55
Figure 4. Hypocotyl color ‘L’ value of chickpea
sprouts storage under modified atmosphere
Hardness
The maximum hardness of sprouted chickpea was observed 80.17 kgf on initial day of packaging for storage. A continues significant decline in texture in terms of hardness value of chickpea sprout was observed in all treatments as on 7th day of storage. The percent decline in hardness value was 16.68, 15.10 and 10.24 in PP packages containing 100, 150 and 200 g of sprouted chickpea, respectively on 7th day on modified storage. Similarly the decrease in hardness value was 24.80, 13.48 and 17.02 in LDPE packages containing 100, 150 and 200g of sprouted chickpea on 7th day on modified storage (Fig. 5).
Figure 5. Hardness of chickpea sprouts storage under modified atmosphere at 10°C temperature and 75%
relative humidity
Visual Quality The mean visual score based on overall acceptance was observed maximum for 200g PP
package followed by 150g PP and 150g LDPE packages during the storage period (Fig. 6). Both the controlled samples of PP and LDPE samples being exposed to air and had least overall scores followed by 200g and 100g LDPE package which indicates that chickpea sprouts sample packed in 200g PP package received highest significant sensory score. The optimal storage atmosphere observed based upon visual score was (O2 6-7%; CO2 9-10%) resulted in better maintenance of overall visual properties. The subjective and objective measures are in close agreement with each other.

Singh R., et al.: Postupci pakovanja u modifikovano .../ Polj. tehn. (2014/1), 49 - 59 56
Figure 6. Overall acceptability value of chickpea sprouts
under MAP Storage
Yeast and Mold Mold and yeast counts of chickpea sprouts were variable during storage in the
different packaging systems. The mold and yeast count of fresh sprouts were well below 1 log10 CFU/g. The mold and yeast count was 3.37, 4.22 and 2.03 log10 CFU/g in PP package and 5.53, 6.61 and 9.43 log10 CFU/g in LDPE package in different treatments. Sprouts packaged in PP had significant increases (P > 0.05) in yeast and mold counts after 7 day of storage. It was also observed in sprouts packaged in PP package had no visible/physical signs of spoilage after 7 day of MAP storage having varied weight (Fig. 7). However, sprouts packed in LDPE packages had significant increases in amounts of yeast and molds during storage period. Conversely, sprouts in control samples had significantly more yeast and molds after the 7 days of storage period. In control sample the yeast and mold count of 38.61 log10 CFU/g in PP and 52.01 log10 CFU/g in LDPE package was observed on 7th day of storage. On day 2, control sprouts had small amounts of visible mold growth and a musty odor and after 4th day, both control samples had obvious physical signs of spoilage and unfit become for consumption. The yeast and mold counts in LDPE package were significantly higher than the counts on sprouts packaged in PP package because the gas composition inside the package may have reduced the presence of competitive micro-flora on the sprouts.
Figure 7. Yeast and mold enumeration of chickpea sprouts
storage under modified atmosphere

Singh R., et al.: Modified Atmospheric Packaging.../Agr. Eng. (2014/1), 49 - 59 57
Shelf-life of Chickpea Sprouts
Comparison of the most important characteristics of chickpea sprouts packed in polymeric film containing different weight of chickpea sprout were showed in Tab. 1. It is evident from the Tab. 1. that for both the subjective and objective measures of chickpea sprouts packed in PP film has better results as compeered with LDPE packed samples having different void volume. The chickpea sprouts paced in 200g PP film was best followed by PP packed in 100g and 150g respectively. The chickpea sprouts packed in PP film packages were also brighter and firm without decay after 7 days of storage then the other treatments as it shown in Tab. 1.
Table 1. Comparison of the most important characteristics of chickpea sprouts packed in
polymeric film containing different weight of chickpea sprout
MAP Subjective measures Objective measures (9-1)
HS Gas, (%) PLW
pH
Hypocotyl Color
HardnessBetter
Overall acceptability
Yeast and mold O2 CO2
PP 100 15.63 8.59 Less Alkaline Better Tender Better Less PP 150 14.45 11.08 Less Alkaline Good Tender Good Less PP 200 12.15 14.19 Least Alkaline Best Firm Best Least LDPE 100 14.20 10.57 Less Alkaline Good Tender Better Less LDPE 150 12.39 14.43 More Alkaline Good Tender Good More LDPE 200 10.03 16.05 More Acidic Better Tender Good More Control - - Most Acidic Bad Soft Bad Most
CONCLUSIONS
Packaging of sprouts in PP film under MAP conditions was effective in maintaining the physico-textural and microbiological quality of produce. The sprouts package head space gaseous composition of 12.53 % O2 and 14.19 % CO2 was found suitable for shelf life extension in PP polymeric package. The fresh sprouts having pack size of 200g and lightness matching to Lh-value (color of hypocotyl) of 43 was successful in extending the postharvest life of chickpea sprouts for more than 7 days stored under modified atmosphere at 10°C temperature and 75% relative humidity with no development of off-odors. Subjective properties such as PLW, pH and color of sprout hypocotyls and hardness were suitably protected in PP polymeric packages and also received the highest objective measure of overall acceptability. The yeast and mold count on all MAP stored sprouts in PP and LDPE packaging increased during storage. However, in spite of marginal and significant increase, sprouts packed in PP film were effective in limiting yeast and mold growth.
BIBLIOGRAPHY
[1] Barry-Ryan, C., O’Beirne, D. 1998. Effects of slicing method on the quality and storage-life of modified atmosphere packaged carrot discs. Journal of Food Science, 63 (5), 851 - 856.

Singh R., et al.: Postupci pakovanja u modifikovano .../ Polj. tehn. (2014/1), 49 - 59 58
[2] Deepak, R. R., Shashi, P. 2007. Transient state in-pack respiration rates of mushroom under modified atmosphere packaging based on enzyme kinetics. Postharvest Technology, 98 (12), 319-326.
[3] Del, M. A., Baiano, A. 2006. Respiration rate of minimally processed lettuce as affected by packaging. Journal of Food Engineering, 74 (19), 60-69.
[4] Lee, D. S., Heggar, P. E., Lee, J., Yam, K. L. 1991. Model for fresh produce respiration in modified atmospheres based upon the principle of enzyme kinetics. Journal of Food Science, 56, 1580-1585.
[5] Lee, D. S., Song, Y., Yam, K. L. 1996. Application of an enzyme kinetics based respiration model to permeable system experiment of fresh produce. Journal of Food Engineering, 27(3), 297-310.
[6] Magaram, M. F., Stotts, C. L., Chen, T. S., Smith, C. H., Kirsch, A. J. 1985. Folacin content of alfalfa and mung bean sprouts: the effect of extraction procedures and maturity. Journal Sci Food Agri. 36, 1155-60.
[7] McLaughlin, C. P., Beirne, D. 1999. Respiration rate of a dry coleslaw mix as affected by storage temperature and respiratory gas concentrations. Journal of Food Science, 64, 116-119.
[8] Ranganna, S. 1977. Manual of Analysis of Fruit and Vegetable Products. Tata -McGraw-Hill, New Delhi, USA.
[9] Rocculi, P., Del, M. A., Romani, S. 2006.Use a simple mathematical model to evaluate dipping and MAP effects on aerobic respiration of minimally processed apples. Journal of Food Engineering, 76 (34), 334-340.
[10] Soylemez, G., Brashears, M. M., Smith, D. A., Cuppett, S. L. 2001. Microbial quality of alfalfa seeds and sprouts after a chlorine treatment and packaging modifications. Journal of Food Science, 66 (1), 153-157.
[11] Susanna, C. F., Fernanda, A. R., Jeffrey, K. B. 2002. Modeling respiration rate of fresh fruits and vegetables for modified atmosphere packages: a review, Journal of Food Engineering, 52, 99–119.
[12] Singh, R. 2012. Design, evaluation and modeling of chickpea sprouts in modified atmosphere packaging. PhD Thesis, PAU, Ludhiana.
POSTUPCI PAKOVANJA U MODIFIKOVANOJ ATMOSVERI RADI PRODUŽENJA VREMENA SKLADIŠTENJA
KLICA LEBLEBIJA (Cicer arietinum L.)
Ranjeet Singh1, Ashok Kumar2, Sitaram D. Kulkarni1
1 Centralni institut za poljoprivrednu tehniku, Odsek za preradu poljoprivrednih proizvoda, Nabi Bagh, Bhopal, India
2 Poljoprivredni Univerzitet Punjab, Institut za preradu i inženjering prehrambenih proizvoda, Ludhiana, Punjab, India
Sažetak: Fiziko-hemijske i mikrobiološke promene na svežim klicama leblebija tokom MA skladištenja na temperaturi od 10°C i vlažnosti od 75 % su ispitivane praćenjem gubitka mase, pH, promene boje i tvrdoće, uz opštu vizuelnu procenu

Singh R., et al.: Modified Atmospheric Packaging.../Agr. Eng. (2014/1), 49 - 59 59
kvaliteta i mikrobiološke infekcije brojem kvasaca i plesni. Klice leblebija različitih zapremina su držane u PP i LDPE polimer filmovima sedam dana na 10°C u MAP uslovima. Sastav gasova u pakovanju je bio najmanji u PP u poređenju sa LDPE polimer filmovima. PLW (%) je značajno niža u pakovanjima od 200g, 100g i 150g (redom) od PP filma nego onih u pakovanju od LDPE filma. Tvrdoća je najbolje očuvana kod pakovanja 200g PP i 150g LDPE. Vizuelnom procenom najbolji rezultat je dobio uzorak iz pakovanja 200g PP. Porast kvasaca i plesni značajno doprinosi mikrobiološkom kvarenju klica, a upotreba modifikovane atmosvere može da redukuje ove efekte. Pakovanje od polipropilena (PP) veoma efikasno je održavalo fizičke i mikrobiološke osobine i teksturu klica, što je i vizuelno potvrđeno. LDPE pakovanje nije značajno uticalo na smanjenje vremena skladištenja klica leblebija.
Ključne reči: Leblebije, modifikovana atmosvera pakovanja (MAP), polipropilen (PP), polietilen male gustine (LDPE), mikrobiološki i vizuelni parametri kvaliteta
Prijavljen: Submitted: 12.8.2013
Ispravljen: Revised:
Prihvaćen: Accepted: 10.03.2014.

Singh R., et al.: Postupci pakovanja u modifikovano .../ Polj. tehn. (2014/1), 49 - 59 60

Univerzitet uPoljoprivredInstitut za pNaučni časoPOLJOPRIGodina XXXBroj 1, 2014Strane: 61 –
UDK: 622.2
INSIDINC
SYM
TechT
Abstrahuman actlosing of tdeficiency effects, wharticle deaoverpressuappropriatelayout of evalues of ina possible we can pre
Key w
The stmachines engineers edirects to m
* Corre
u Beogradu dni fakultet oljoprivrednu teopis IVREDNA TEHNXIX 4. – 70
244
DE OVERPCREASINMMETRIC
nical UniversTechnology, D
act: The memtivities. If metheir stabilitywith not exte
hich will be oals with theoure. It describee formulas aneffect stressesnside overpreway of memb
edict favourab
words: buckling
training of mein agricultureeffort to creatmaking a slen
esponding autho
ehniku
NIKA
PRESSUREG AT THE
CAL SHEL
Stanislav K
sity in Zvolen, Department of
Zvole
mbers, strainedembers have a. One of the ending its paroperate again
oretical possibes allocation and solves concs and satisfacessure and geobers stability
ble future of th
g, stability, sh
IN
embers by axie, forestry, ate members w
nder struts, wh
or. E-mail: stan
E UTILIZAE THIN-WALL STRAIN
otšmíd*, Mar
Faculty of En
f Mechanics anen, Slovak Rep
d by axial fora big slendernpossibilities,
rameters and nst to force efbility of staband interactiocrete sample. ction of stabilometrical paraincreasing an
his.
hell, overpress
TRODUCTI
ial force is oftarchitecture a
with a small mhich can succu
nislav.kotsmid@
Institute
AGRIC
ATION FOALLED RONED BY AX
rián Minárik
nvironmental and Mechanicapublic
rce, are used ness, it can tohow can be of course its ffects making
bility increasinn of effectedLast but not
lity condition ameters of memnd in case of e
sure
ON
ften occurred iand engineerin
mass and a highumb losing of
@gmail.com
UniversityFaculty o
e of Agricultural Scie
CULTURAL EN
OriginalnOriginal sci
R A STABOTATIONXIAL FOR
and Manufactal Engineering
in the differeo origin a propartially elimmass, is addi
g of stability lng by addingstresses accorleast, it showwith regard
mbers. The arexperimental
in the differenng. In the prh carrying capthe shape stab
y of Belgrade of Agriculture
Engineering ntific Journal
NGINEERING Year XXXIX No. 1, 2014. pp: 61 – 70
ni naučni rad ientific paper
BILITY NAL RCE
turing g,
ent areas of oblem with
minated this ing of force losing. The g of inside rding to the
ws graphical to different rticle brings verification
nt industrial ractice, the pacity, so it bility under

Kotšmíd S., et al.: Upotreba unutrašnjeg nadpritiska.../Polj. tehn. (2014/1), 61 - 70 62
axial force loading. Losing of stability is a status of strut, where are created conditions for solid transition from stable to unstable position, when this transition is characterised by changing of solid shape.
While the value of force, which causes the pressure stress in the strut, is not higher than critical value, which is dependent on the strut connecting, the strut is straight and it is strained on pressure only. If the critical value is exceeded, deformation of the strut increases until its destruction. This critical value is called critical buckling force, which characterises losing of stability.
By this value can be solved critical stress in struts. In depending on connecting condition, geometrical parameters and strut material, this stress can be much less than the yield value, so material is not utilized in sufficient degree. Here is created question, how can be increased utilization of strut, if we do not want to extend its geometrical parameters and its mass of course. We assume, one of the way is adding of the force effect, which will be operate against to force effect making pressure.
MATERIAL AND METHODS
There can be determined critical buckling force for prismatic, centric pressured strut by procedure, which was elaborated by Leonhard Euler. If we suppose homogeny material of the strut and unlimited validity of the Hook law, the strut is stable and has straight shape at small axial force.
If this axial force achieves critical value, the strut is in indifferent balance and it stays in new deformed shape with bended axis (Fig. 1) [1, 3, 6, 7].
Figure 1. Deformation of the strut by axial force F
The computing of critical buckling force can be deduced by procedure, which is
described in literature [6]. Final formula for computing of this force is:
( )2min
22
lJEn
Fkrit⋅
⋅⋅⋅=
βπ
(1)
Where: n [-] - constant, which determines shape of bended line, E [Pa] - Young modulus of elasticity,

Kotšmíd S.,
Jmin β l
The cr
Where A
Let invoverpressu
At theas membersome casecontact for
For usshell (thickAlone forcStraining omust be stand torsion
In the middle surwhich is pP (Fig. 3) [
et al.: Inside O
[m4] - m[-] - b[m] - le
ritical stress in
e: [m2] - cr
vestigate, whaure except axia
Figure 2. T
e shells (ratio rs of the plans. This theoryrce, so it makesing of this thekness, radius oces, which straof the shell datically determn moments the
shell can be rface, the meerpendicular o[2, 3, 6].
Overpressure U
minimum quaduckling coeffiength of strut.
n strut is comp
ross section ar
at will happenal force (Fig. 2
The shell strain
of the inside dnar character, y ignores effees solution of eory must be of curvature, ain of the she
does not haveminate. If anyere, what makcreated three
eridian plane on previous tw
Utilization.../Agr
dratic momentficient,
puted as:
AFkrit
krit =σ
rea.
n, if strut, con2).
ed by axial forc
diameter and can be used
ect of bendingproblem easiemet next condcentre of curv
ell, must operae to be changy from these rkes solution of
planes througin which is swo. Let extrac
r. Eng. (2014/1)
t of strut cross
nstructed as sh
ce and inside ov
the wall thicka membrane g and torsion er [1, 4, 5]. ditions. Geomvature) must bate in contact ed suddenly.
rules is not rigf task harder [gh some poinsituated axis ct infinity sm
), 61 - 70
s section,
hell, is straine
verpressure
kness is smalletheory for comoments, an
metrical parambe changed coplane to middConnecting o
ght, it can cau1, 4, 6].
nt P; the contaof symmetry
mall element ne
63
(2)
ed by inside
er than 0.1) omputing in nd feed and
meters of the ontinuously. dle surface. of the shell use bending
act plane to and plane,
ear to point

64
In theoverpressuthe normal
Where p
h σm σt dsm dst dm dt ρm ρt
After p
This f
overpressuNext n
which is cu
Kotšmíd S.
e places of ure p operatesl n to middle s
⋅⋅ tm dsdsp
e: [Pa] - in[m] - th[Pa] - m[Pa] - ta[m] - el[m] - el[º] - an[º] - an[m] - ra[m] - ra
putting and re
formula givesure p and geomneeded formuutting by the p
, et al.: Upotre
element opes there, conditsurface has for
2 ⋅⋅⋅− mt dhσ
nside overpreshickness of the
meridian stressangent stress,lement heightlement width,ngle of elemengle of elemeadius of elemeadius of eleme
Figure
emoving of the
s relation ammetrical paramula for solutioplane, perpend
eba unutrašnjeg
erate only ntion of static rm:
22
sin −⋅ mt
dds ϑ
ssure in the she wall, s,
t, , nt curvature innt curvature inent curvature ient curvature i
3. Element of t
e special part
hp
t
t
m
m =+ρσ
ρσ
mong tangent meters h, ρm anon is conditiondicular on the
g nadpritiska.../P
ormal stresseat the elemen
2 ⋅⋅⋅⋅ mt dshσ
hell,
n meridian dirn tangent direin meridian diin tangent dire
the shell
in formula wep
stress σt, mend ρt. n of equilibriuaxis of rotatio
/Polj. tehn. (201
es σm and σtnt balance in d
02
sin =tdϑ
rection, ection, irection, ection.
e get Laplace
eridian stress
um for part oon.
14/1), 61 - 70
. If inside direction of
(3)
formula:
(4)
σm, inside
of the shell,

Kotšmíd S., et al.: Inside Overpressure Utilization.../Agr. Eng. (2014/1), 61 - 70 65
020 2 =⋅⋅⋅⋅−⋅⋅=∑ hrrpF mix πσπ (5) Where: r [m] - shell radius. After putting ρt = r and ρm = ∞ we get for σm and σt formulas:
h
rpt
⋅=σ (6)
hrp
m ⋅⋅
=2
σ (7)
This theory predicts operating of stresses in tangent and meridian direction, what is
stress operated in the shell axial direction. It is tensile stress and wants to stretch the shell in axial direction. As we have written, axial force causes compression stress. Both stresses operate in the same direction and in the same plane so they can be algebraic summed up and from this sum and tangent stress can be made up reduce stress according to one of the strength theories. There can be different results of this sum. If there will be zero compression stress, only meridian stress will be operate in axial direction. If there will be compression stress equal to meridian stress, no stress will be operate in axial direction. If there will be compression stress higher than meridian stress, pressure will be operate in axial direction and after exceeding of the critical value, losing of stability come soon. So stability condition can have this form:
0>+− krittlm σσσ (8) Where: σtl [Pa] - compression stress caused by axial force F.
For computing of reduce stress can be used theory HMH. Formula has next form
( ) ( ) tdmtdmHMHred σσσσσσσ ⋅−−+−= 22 (9)
On the basic of previous ideas, let solve next task, where will be investigated the
shape stability of pipe strained by axial force. Pipe will be strained by force F = 5 000 N, on the both ends will be connected by a joint and will have outside diameter D = 17 mm, wall thickness h = 1 mm and length l = 1 m. Material of pipe is chosen with yield value Re = 180 MPa and safety coefficient k = 2.
We can use Euler formula (1) and formulas for computing of critical buckling and compression stress.
( )
( )NFkrit 82,3346
1164
015,0017,0101,212
441122
=⋅
−⋅⋅⋅⋅⋅
=
ππ
( ) MPakrit 58,66
4015,0017,0
82,334622 =
−⋅=π
σ

Kotšmíd S., et al.: Upotreba unutrašnjeg nadpritiska.../Polj. tehn. (2014/1), 61 - 70 66
( ) MPatl 47,99
4015,0017,0
500022 =
−⋅=π
σ
Next we add the inside overpressure in pipe p = 10 MPa. Then tangent and meridian stresses have values:
MPat 801
810=
⋅=σ
MPam 4012810=
⋅⋅
=σ
According to formula (8) for stability condition we get:
011,758,6647,9940 >=+−
what means, there is no losing of stability. Reduce stress has value:
( ) ( ) MPaHMHred 728047,99408047,9940 22 =⋅−−+−=σ
RESULTS AND DISCUSSION
As we can see from computed values in previous part, computed Fkrit is smaller than axial force F. According to this, the pipe can lose its stability. Compression stress is higher than critical buckling stress too. Pipe does not meet stability condition.
Table 1. Dependence of stresses and stability condition of pipe according to
the inside overpressure value
p (MPa) σm (MPa) σt (MPa) σtl (MPa) σred (MPa) σm - σtl + σkrit (MPa) 0 0 0
99,47
99,47 -32,89 1 4 8 91,73 -28,89 2 8 16 84,61 -24,89 3 12 24 78,28 -20,89 4 16 32 72,94 -16,89 5 20 40 68,83 -12,89 6 24 48 66,16 -8,89 7 28 56 65,13 -4,89 8 32 64 65,80 -0,89 9 36 72 68,14 3,11 10 40 80 71,97 7,11 11 44 88 77,07 11,11 12 48 96 83,21 15,11 13 52 104 90,18 19,11
With straining of pipe by inside overpressure was created meridian stress in the
wall, which operates against to compression stress. The pipe after application meets stability condition and reduce stress is smaller than permissible stress too. Table 1 shows

Kotšmíd S., et al.: Inside Overpressure Utilization.../Agr. Eng. (2014/1), 61 - 70 67
how these stresses and stability condition are changed according to value of inside overpressure.
From this table we can see that under value 8 MPa of inside overpressure, last column is negative. It means inside overpressure is too small for compensation of the pressure caused by axial force F. Only when value is equals 8.22 MPa, it can be met stability condition. When there are higher values of inside overpressure, stability condition is met. There is meridian stress still smaller than compression stress caused by axial force F.
From the table we can see that values of reduce stress reaches permissible stress before value 13 MPa of inside overpressure, but meridian stress is still smaller than compression stress. It is caused by increasing of tangent stress. It brings idea that inside overpressure cannot be increased without control.
Fig. 4 shows activity of stresses in pipe and fact, that we get the smallest reduce stress, when inside overpressure is on the limit of stability.
Figure 4. Dependence of stresses according to the inside overpressure changing
Fig. 5 shows, how reduce stress in the pipe is changed according to inside
overpressure and outside diameter. In this case can be said, with decreasing of inside overpressure is needed increasing of geometrical parameters for decreasing of reduce stress, and inside out.
Fig. 6 shows to meet stability condition according to pipe outside diameter and inside overpressure changing. We can see, at value of outside diameter 15 mm is all interval of stability values for inside overpressure 0 – 15 MPa in negative values. It means, any shown value of inside overpressure do not compensate compressive stress for no losing of stability. On the other hand, in value of outside diameter 20 mm is all values in positive interval, so inside overpressure is not needed there, but it can helps to

Kotšmíd S., et al.: Upotreba unutrašnjeg nadpritiska.../Polj. tehn. (2014/1), 61 - 70 68
decreasing of reduce stress. From this we can bring idea, with increasing of pipe outside diameter is needed smaller inside overpressure to stability safety.
Figure 5. Dependence of reduce tension according to pipe diameter and inside
overpressure changing
Figure 6. Dependence of meet condition according to pipe outside diameter and inside
overpressure changing

Kotšmíd S., et al.: Inside Overpressure Utilization.../Agr. Eng. (2014/1), 61 - 70 69
CONCLUSIONS
In the present, when the utilization of materials is increased, research and development is oriented on new materials like the composites. Yield value of materials and of course their utilization can be increased by suitable structure and constitution of materials. The next way is to better know the character and the straining of forces and create the way, how these force effects can be partially eliminated by their allocation, or adding of force effects which will operate in the opposite direction.
In the article is shown elimination of origin force effects by adding of another force effects operated in opposite direction. Computation shows, that this way can have invocation in future. Except of experimental verification, there will have to be solved another aspects for implementation of this way to the practise.
One of the aspects is the shape of heads and technology of their connecting. In a pressure vessels is often used a plate circular head, which is welded to the shell. This simple solution causes existence of superior stress, so there might be create relieve by means a race around all circuit and thickness of the head might be higher than thickness of the shell.
The next aspect is an assurance of the clear membrane state in inside forces, what means the assurance of necessary deformation and static equilibrium only through membrane forces. In the practise it means to solve suitable location. At last but not least will be necessary to see on safety at escape of inside overpressure from the pipe.
We suppose that after solving previous aspects, this way of material efficiency increasing can have favourable future.
BIBLIOGRAPHY
[1] Bischoff, M., Bletzinger, K. U., Wall, W. A., Ramm, E. 2004. Models and finite elements for thin-walled structures In: Encyclopedia of computational mechanics. USA: John Wiley & Sons, Inc.
[2] Bodnár, F., Minárik, M. 2009. Pružnosť a pevnosť II. Zvolen: Technická univerzita vo Zvolene.
[3] Hájek, E., Reif, P., Valenta, F. 1988. Pružnost a pevnost I. Praha: SNTL. [4] Riley, W. F., Strurges, L. D. 1993. Engineering mechanics – Statics I. USA: John Wiley &
Sons, Inc. [5] Schafer, B. 2002. Local, distortional, and Euler buckling of thin-walled columns. Journal of
structural engineering. Volume 128. Issue 3. 10 pages. [6] Trebuňa, F., Jurica, V., Šimčák, F. 2000. Pružnosť a pevnosť II. Košice: Vienala. [7] Trebuňa, F., Šimčák, F. 1999. Tenkostenné nosné prvky a konštrukcie. Košice: Vienala.

Kotšmíd S., et al.: Upotreba unutrašnjeg nadpritiska.../Polj. tehn. (2014/1), 61 - 70 70
UPOTREBA UNUTRAŠNJEG NADPRITISKA ZA POVEĆANJE STABILNOSTI TANKOG ZIDA ROTACIONE SIMETRIČNE OPLATE OPTEREĆENE
AKSIJALNOM SILOM
Stanislav Kotšmíd, Marián Minárik
Tehnički univerzitet u Zvolenu, Fakultet za životnu sredinu proizvodnu tehnologiju, Institut za mehaniku i mašinstvo, Zvolen, Republika Slovačka
Sažetak: Elementi, opterećeni aksijalnom silom, se koriste u raznim oblastima. Ako su savitljivi, mogu izgubiti svoju stabilnost. Jedna od mogućnosti za delimično otklanjanje ovog nedostatka, bez ojačavanja i povećanja mase, je dodavanje sile koja će delovati suprotno tako da uravnoteži opterećeni element. Ovaj rad obrađuje teorijsku mogućnost povećanja stabilnosti dodavanjem unutrašnjeg nadpritiska. Opisan je položaj i interakcija opterećenja odgovarajućim jednačinama i dobijeno rešenje konkretnog problema. Pokazan je i grafički prikaz dobijenog efekta i zadovoljenje uslova stabilnosti u odnosu na različite vrednosti unutrašnjeg nadpritiska i geometrijskih parametara elemenata. U radu je dat i poseban način povećanja stabilnosti elemenata i eksperimentalne verifikacije daljih postupaka.
Ključne reči: izvijanje, stabilnost, oplata, nadpritisak
Prijavljen: Submitted: 15.08.2013.
Ispravljen: Revised:
Prihvaćen: Accepted: 12.02.2014.


CIP – Каталогизација у публикацији Народна библиотека Cрбије, Београд
631(059)
ПОЉОПРИВРЕДНА техника : научни часопис = Agricultural engineering : scientific journal / главни и одговорни уредник Горан Тописировић. – Год. 1, бр. 1 (1963)- . - Београд; Земун : Институт за пољопривредну технику, 1963- (Београд : Штампарија ”Академска издања”) . – 25 cm Тромесечно. – Прекид у излажењу од 1987-1997. године ISSN 0554-5587 = Пољопривредна техника COBISS.SR-ID 16398594