population growth trends, projections, challenges
TRANSCRIPT

POPULATION GROWTH
TRENDS, PROJECTIONS, CHALLENGES AND OPPORTUNITIES.
INTRODUCTION
Human beings evolved under conditions of high mortality due to famines, accidents, illnesses, infections and war and therefore the relatively high fertility rates were essential for species survival. In spite of the relatively high fertility rates it took all the time from evolution of mankind to the middle of the 19th century for the global population to reach one billion. The twentieth century witnessed an unprecedented rapid improvement in health care technologies and access to health care all over the world; as a result there was a steep fall in the mortality and steep increase in longevity. The population realized these changes and took steps to reduce their fertility but the decline in fertility was not so steep. As a result the global population has undergone a fourfold increase in a hundred years and has reached 6 billion.
DEMOGRAPHIC TRANSITION
Demographers refer to these changes from stable population with high fertility and mortality to a new stability in population due to low fertility and mortality patterns as demographic transition. Demographic transition occurs in four phases; of these the first three phases are characterized by population growth. In the first phase there is a fall in death rate and improvement in longevity; this leads to population growth. In the second phase there is a fall in birth rate but fall is less steep than fall in death rates and consequently there is population growth. In the third phase death rates plateau and replacement level of fertility is attained but the population growth continues because of the large size of population in reproductive age group. The fourth phase is characterized by fall in birth rate to below replacement level and reduction in the proportion of the population in reproductive age group; as a result of these changes population growth ceases and population stabilizes. Experience in some of the developed countries suggest that in some societies even after attainment of stable population there may be a further decline in fertility so that there is a further reduction in the population- so called negative population growth phase of the demographic transition. Different countries in the world have entered the demographic transition at different periods of time; there are also substantial differences in the rate of demographic transition and time taken to achieve population stabilization.
Global Population Scenario
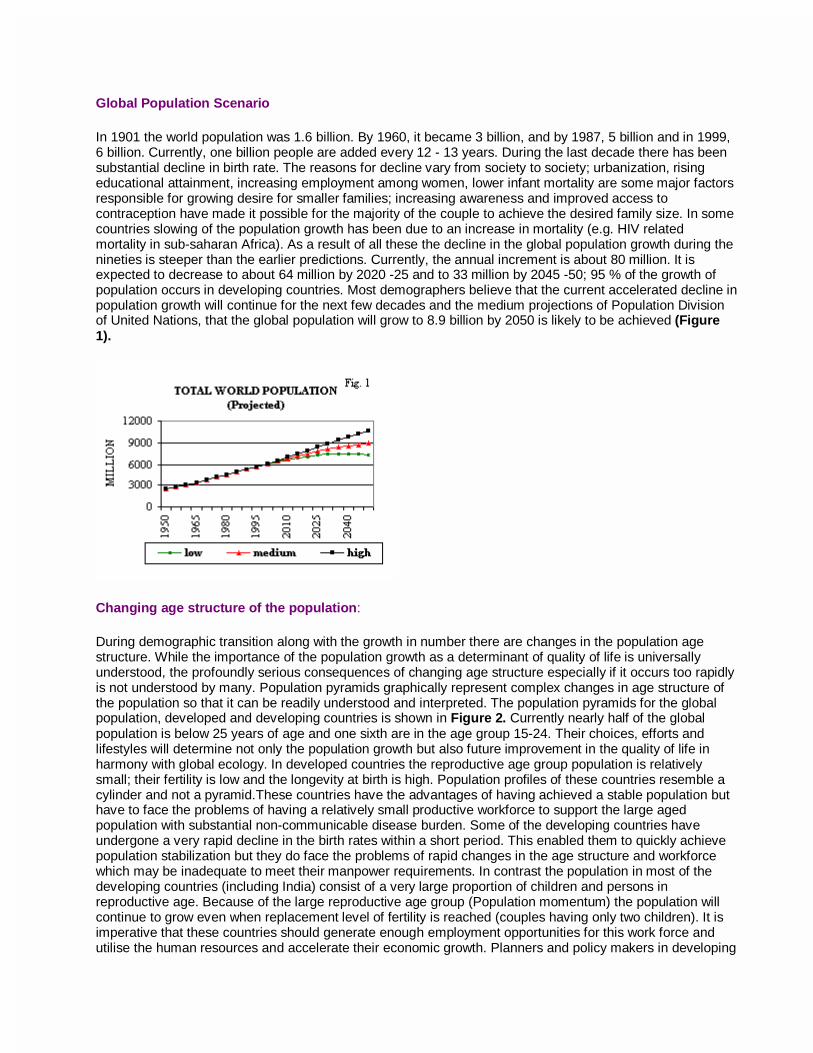
In 1901 the world population was 1.6 billion. By 1960, it became 3 billion, and by 1987, 5 billion and in 1999, 6 billion. Currently, one billion people are added every 12 - 13 years. During the last decade there has been substantial decline in birth rate. The reasons for decline vary from society to society; urbanization, rising educational attainment, increasing employment among women, lower infant mortality are some major factors responsible for growing desire for smaller families; increasing awareness and improved access to contraception have made it possible for the majority of the couple to achieve the desired family size. In some countries slowing of the population growth has been due to an increase in mortality (e.g. HIV related mortality in sub-saharan Africa). As a result of all these the decline in the global population growth during the nineties is steeper than the earlier predictions. Currently, the annual increment is about 80 million. It is expected to decrease to about 64 million by 2020 -25 and to 33 million by 2045 -50; 95 % of the growth of population occurs in developing countries. Most demographers believe that the current accelerated decline in population growth will continue for the next few decades and the medium projections of Population Division of United Nations, that the global population will grow to 8.9 billion by 2050 is likely to be achieved (Figure 1).
Changing age structure of the population:
During demographic transition along with the growth in number there are changes in the population age structure. While the importance of the population growth as a determinant of quality of life is universally understood, the profoundly serious consequences of changing age structure especially if it occurs too rapidly is not understood by many. Population pyramids graphically represent complex changes in age structure of the population so that it can be readily understood and interpreted. The population pyramids for the global population, developed and developing countries is shown in Figure 2. Currently nearly half of the global population is below 25 years of age and one sixth are in the age group 15-24. Their choices, efforts and lifestyles will determine not only the population growth but also future improvement in the quality of life in harmony with global ecology. In developed countries the reproductive age group population is relatively small; their fertility is low and the longevity at birth is high. Population profiles of these countries resemble a cylinder and not a pyramid.These countries have the advantages of having achieved a stable population but have to face the problems of having a relatively small productive workforce to support the large aged population with substantial non-communicable disease burden. Some of the developing countries have undergone a very rapid decline in the birth rates within a short period. This enabled them to quickly achieve population stabilization but they do face the problems of rapid changes in the age structure and workforce which may be inadequate to meet their manpower requirements. In contrast the population in most of the developing countries (including India) consist of a very large proportion of children and persons in reproductive age. Because of the large reproductive age group (Population momentum) the population will continue to grow even when replacement level of fertility is reached (couples having only two children). It is imperative that these countries should generate enough employment opportunities for this work force and utilise the human resources and accelerate their economic growth. Planners and policy makers in developing

countries like India have to take into account the ongoing demographic changes (number and age structure of the population) so that available human resources are optimally utilised as agents of change and development to achieve improvement in quality of life.
Demographic Transition in India
Over the last four decades there has been rapid fall in Crude Death Rate (CDR) from 25.1 in 1951 to 9.8 in 1991 and less steep decline in the Crude Birth Rate (CBR) from 40.8 in 1951 to 29.5 in 1991. The annual exponential population growth rate has been over 2% in the period 1961-90. During the nineties the decline in CBR has been steeper than that in the (CDR) and consequently, the annual population growth rate has fallen below 2% (Figures 3 & 4). The rate of decline in population growth is likely to be further accelerated during the next decade. The changes in the population growth rates have been relatively slow, steady and sustained. As a result the country was able to achieve a relatively gradual change in the population numbers and age structure (Figure 5). The short and long term adverse consequences of too rapid decline in birth rates and change in age structure on the social and economic development were avoided and the country was able to adapt to these changes without massive disruptions of developmental efforts.
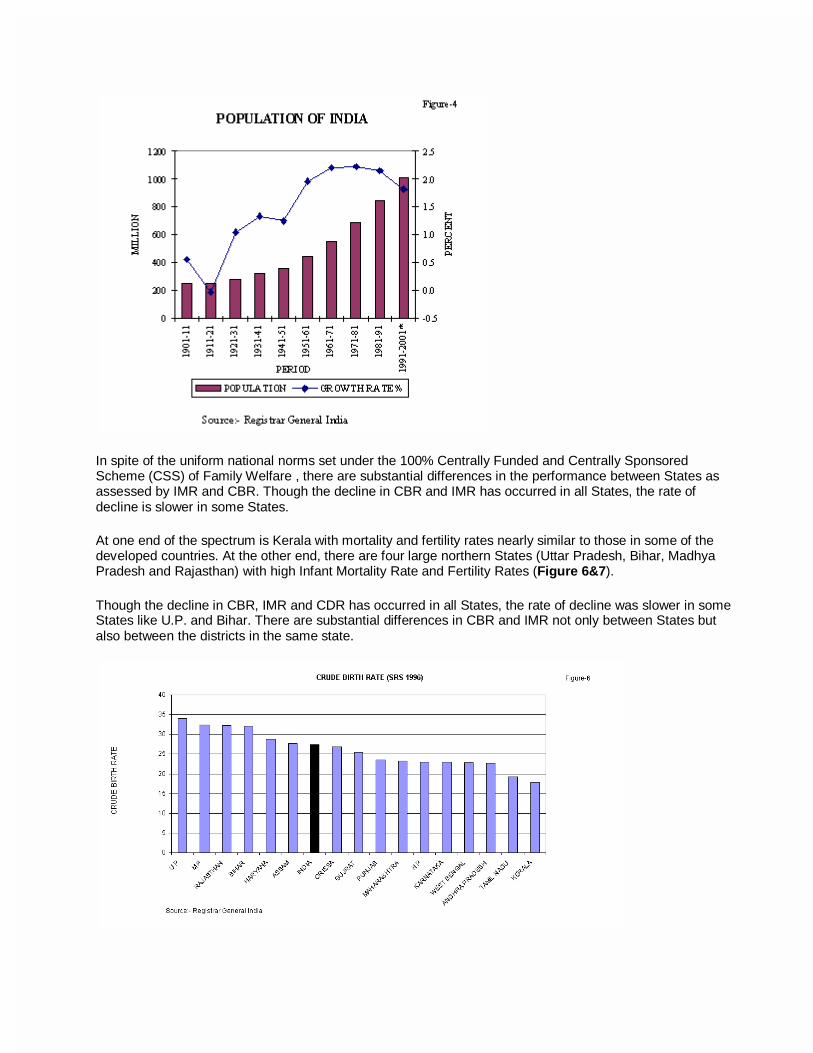
In spite of the uniform national norms set under the 100% Centrally Funded and Centrally Sponsored Scheme (CSS) of Family Welfare , there are substantial differences in the performance between States as assessed by IMR and CBR. Though the decline in CBR and IMR has occurred in all States, the rate of decline is slower in some States.
At one end of the spectrum is Kerala with mortality and fertility rates nearly similar to those in some of the developed countries. At the other end, there are four large northern States (Uttar Pradesh, Bihar, Madhya Pradesh and Rajasthan) with high Infant Mortality Rate and Fertility Rates (Figure 6&7).
Though the decline in CBR, IMR and CDR has occurred in all States, the rate of decline was slower in some States like U.P. and Bihar. There are substantial differences in CBR and IMR not only between States but also between the districts in the same state.

In view of these findings, the NDC Committee on Population recommended that efforts should be made to provide reproductive and child health services at district level and undertake decentralized area-specific micro planning and implementation of appropriate interventions. In response to this recommendation Dept of Family Welfare has abolished the practice of fixing targets for individual contraceptives by the Central Government from April 1996 and had initiated decentralized district based, planning (based on community need assessment), implementation, monitoring and midcourse corrections of FW programme.
The experience of states with district based planning, implementation and the impact are being closely monitored.
CONSEQUENCES OF POPULATION GROWTH
Environmental and ecological consequences
The already densely populated developing countries contribute to over 95% of the population growth and rapid population growth could lead to environmental deterioration. Developed countries are less densely populated and contribute very little to population growth; however, they cause massive ecological damage by the wasteful, unnecessary and unbalanced consumption the consequences of which could adversely affect both the developed and the developing countries. The review on "Promotion of sustainable development: challenges for environmental policies" in the Economic Survey 1998-99 had covered in detail the major environmental problems, and policy options for improvement; the present review will only briefly touch upon some of the important ecological consequences of demographic transition.
In many developing countries continued population growth has resulted in pressure on land, fragmentation of land holding, collapsing fisheries, shrinking forests, rising temperatures, loss of plant and animal species. Global warming due to increasing use of fossil fuels (mainly by the developed countries) could have serious effects on the populous coastal regions in developing countries, their food production and essential water supplies. The Intergovernmental Panel on Climate Change has projected that, if current greenhouse gas emission trends continue, the mean global surface temperature will rise from 1 to 3.5 degrees Celsius in the next century. The panel's best estimate scenario projects a sea-level rise of 15 to 95 centimeters by 2100. The ecological impact of rising oceans would include increased flooding, coastal erosion, salination of aquifers and coastal crop land and displacement of millions of people living near the coast. Patterns of precipitation are also likely to change, which combined with increased average temperatures, could
substantially alter the relative agricultural productivity of different regions. Greenhouse gas emissions are closely linked to both population growth and development. Slower population growth in developing countries and ecologically sustainable lifestyles in developed countries would make reduction in green house gas emission easier to achieve and provide more time and options for adaptation to climate change.
Rapid population growth, developmental activities either to meet the growing population or the growing needs of the population as well as changing lifestyles and consumption patterns pose major challenge to preservation and promotion of ecological balance in India. Some of the major ecological adverse effects reported in India include:
• severe pressure on the forests due to both the rate of resource use and the nature of use. The per capita forest biomass in the country is only about 6 tons as against the global average of 82 tons.
• adverse effect on species diversity: • conversion of habitat to some other land use such as agriculture, urban development, forestry
operation. Some 70-80 % of fresh water marshes and lakes in the Gangetic flood plains has been lost in the last 50 years.
• Tropical deforestation and destruction of mangroves for commercial needs and fuel wood. The country’s mangrove areas have reduced from 700,000 ha to 453,000 ha in the last 50 years.
• Intense grazing by domestic livestock • Poaching and illegal harvesting of wildlife. • Increase in agricultural area, high use of chemical fertilizers pesticides and weedicides; water
stagnation, soil erosion, soil salinity and low productivity. • High level of biomass burning causing large-scale indoor pollution. • Encroachment on habitat for rail and road construction thereby fragmenting the habitat. increase in
commercial activities such as mining and unsustainable resource extraction. • Degradation of coastal and other aquatic ecosystems from domestic sewage, pesticides, fertilizers
and industrial effluents. • Over fishing in water bodies and introduction of weeds and exotic species. • Diversion of water for domestic, industrial and agricultural uses leading to increased river pollution
and decrease in self-cleaning properties of rivers. • Increasing water requirement leading to tapping deeper aquifers which have high content of arsenic
or fluoride resulting health problems. • Disturbance from increased recreational activity and tourism causing pollution of natural ecosystems
with wastes left behind by people.
The United Nations Conference on Environment and Development (1992) acknowledged population growth, rising income levels, changing technologies, increasing consumption pattern will all have adverse impact on environment. Ensuring that there is no further deterioration depends on choices made by the population about family size, life styles, environmental protection and equity. Availability of appropriate technology and commitment towards ensuring sustainable development is increasing throughout the world. Because of these, it might be possible to initiate steps to see that the natural carrying capacity of the environment is not damaged beyond recovery and ecological balance is to a large extent maintained. It is imperative that the environmental sustainability of all developmental projects is taken care of by appropriate inputs at the planning, implementation, monitoring and evaluation stages.
Urbanization
The proportion of people in developing countries who live in cities has almost doubled since 1960 (from less than 22 per cent to more than 40 per cent), while in more developed regions the urban share has grown from 61 per cent to 76 per cent. Urbanization is projected to continue well into the next century. By 2030, it is expected that nearly 5 billion (61 per cent) of the world's 8.1 billion people will live in cities. India shares this global trend toward urbanisation (Figure 8).

Globally, the number of cities with 10 million or more inhabitants is increasing rapidly, and most of these new "megacities" are in developing regions. In 1960, only New York and Tokyo had more than 10 million people. By 1999, the number of megacities had grown to 17(13 in developing countries). It is projected that there will be 26 megacities by 2015, (18 in Asia; of these five in India); more than 10 per cent of the world's population will live in these cities (1.7% in 1950). India’s urban population has doubled from 109 million to 218 million during the last two decades and is estimated to reach 300 million by 2000 AD. As a consequence cities are facing the problem of expanding urban slums.
Like many other demographic changes, urbanization has both positive and negative effects. Cities and towns have become the engines of social change and rapid economic development. Urbanisation is associated with improved access to education, employment, health care; these result in increase in age at marriage, reduction in family size and improvement in health indices. As people have moved towards and into cities, information has flowed outward. Better communication and transportation now link urban and rural areas both economically and socially creating an urban-rural continuum of communities with improvement in some aspects of lifestyle of both. The ever increasing reach of mass media communicate new ideas, points of reference, and available options are becoming more widely recognized, appreciated and sought. This phenomenon has affected health care, including reproductive health, in many ways. For instance, radio and television programmes that discuss gender equity, family size preference and family planning options are now reaching formerly isolated rural populations. This can create demand for services for mothers and children, higher contraceptive use, and fewer unwanted pregnancies, smaller healthier families and lead to more rapid population stabilisation.
But the rapid growth of urban population also poses some serious challenges. Urban population growth has outpaced the development of basic minimum services; housing, water supply, sewerage and solid waste disposal are far from adequate; increasing waste generation at home, offices and industries, coupled with poor waste disposal facilities result in rapid environmental deterioration. Increasing automobiles add to air pollution. All these have adverse effect on ecology and health. Poverty persists in urban and peri-urban areas; awareness about the glaring inequities in close urban setting may lead to social unrest.
Rural population and their development
Over seventy per cent of India’s population still lives in rural areas. There are substantial differences between the states in the proportion of rural and urban population (varying from almost 90 per cent in Assam and Bihar to 61 per cent in Maharashtra). Agriculture is the largest and one of the most important sector of the rural economy and contributes both to economic growth and employment. Its contribution to the Gross Domestic Product has declined over the last five decades but agriculture still remains the source of livelihood for over 70 per cent of the country’s population. A large proportion of the rural work force is small and consists of marginal farmers and landless agricultural labourers. There is substantial under employment among these people; both wages and productivity are low. These in turn result in poverty; it is estimated that 320 million people are still living below the poverty line in rural India.
Though poverty has declined over the last three decades, the number of rural poor has in fact increased due to the population growth. Poor tend to have larger families which puts enormous burden on their meagre resources, and prevent them from breaking out of the shackles of poverty. In States like Tamil Nadu where replacement level of fertility has been attained, population growth rates are much lower than in many other States; but the population density is high and so there is a pressure on land. In States like Rajasthan, Uttar Pradesh, Bihar and Madhya Pradesh population is growing rapidly, resulting in increasing pressure on land and resulting land fragmentation. Low productivity of small land holders leads to poverty, low energy intake and under nutrition, and this, in turn, prevents the development thus creating a vicious circle. In most of the states non-farm employment in rural areas has not grown very much and cannot absorb the growing labour force. Those who are getting educated specially beyond the primary level, may not wish to do manual agricultural work. They would like better opportunities and more remunerative employment. In this context, it is imperative that programmes for skill development, vocational training and technical education are taken up on a large scale in order to generate productive employment in rural areas. The entire gamut of existing poverty alleviation and employment generation programmes may have to be restructured to meet the newly emerging types of demand for employment.
Rural poor have inadequate access to basic minimum services, because of poor connectivity, lack of awareness, inadequate and poorly functional infrastructure. There are ongoing efforts to improve these, but with the growing aspirations of the younger, educated population these efforts may prove to be inadequate to meet the increasing needs both in terms of type and quality of services.
Greater education, awareness and better standard of living among the growing younger age group population would create the required consciousness among them that smaller families are desirable; if all the felt needs for health and family welfare services are fully met, it will be possible to enable them to attain their reproductive goals, achieve substantial decline in the family size and improve quality of life.
Water Supply:
In many parts of developed and developing world, water demand substantially exceeds sustainable water supply. It is estimated that currently 430 millions (8% of the global population) are living in countries affected by water stress; by 2020 about one fourth of the global population may be facing chronic and recurring shortage of fresh water. In India, water withdrawal is estimated to be twice the rate of aquifer recharge; as a result water tables are falling by one to three meters every year; tapping deeper aquifers have resulted in larger population groups being exposed to newer health hazards such as high fluoride or arsenic content in drinking water. At the other end of the spectrum, excessive use of water has led to water logging and increasing salinity in some parts of the country. Eventually, both lack of water and water logging could have adverse impact on India's food production. There is very little arable agricultural land which remains unexploited and in many areas, agricultural technology improvement may not be able to ensure further increase in yield per hectare. It is, therefore, imperative that research in biotechnology for improving development of foodgrains strains that would tolerate salinity and those which would require less water gets high priority. Simultaneously, a movement towards making water harvesting, storage and its need based use part of every citizens life should be taken up.

Food security:
Technological innovations in agriculture and increase in area under cultivation have ensured that so far, food production has kept pace with the population growth. Evolution of global and national food security systems have improved access to food. It is estimated that the global population will grow to 9 billion by 2050 and the food production will double; improvement in purchasing power and changing dietary habits (shift to animal products) may further add to the requirement of food grains. Thus, in the next five decades, the food and nutrition security could become critical in many parts of the world especially in the developing countries and pockets of poverty in the developed countries.
In India one of the major achievements in the last fifty years has been the green revolution and self-sufficiency in food production. Food grain production has increased from 50.82 in 1950-51 to 200.88 million tons in 1998-99 (Prov.).
It is a matter of concern that while the cereal production has been growing steadily at a rate higher than the population growth rates, the coarse grain and pulse production has not shown a similar increase (Table I, Figure 9, Figure 10). Consequently there has been a reduction in the per capita availability of pulses (from 60.7 grams in 1951 to 34 grams per day in 1996) and coarse grains.
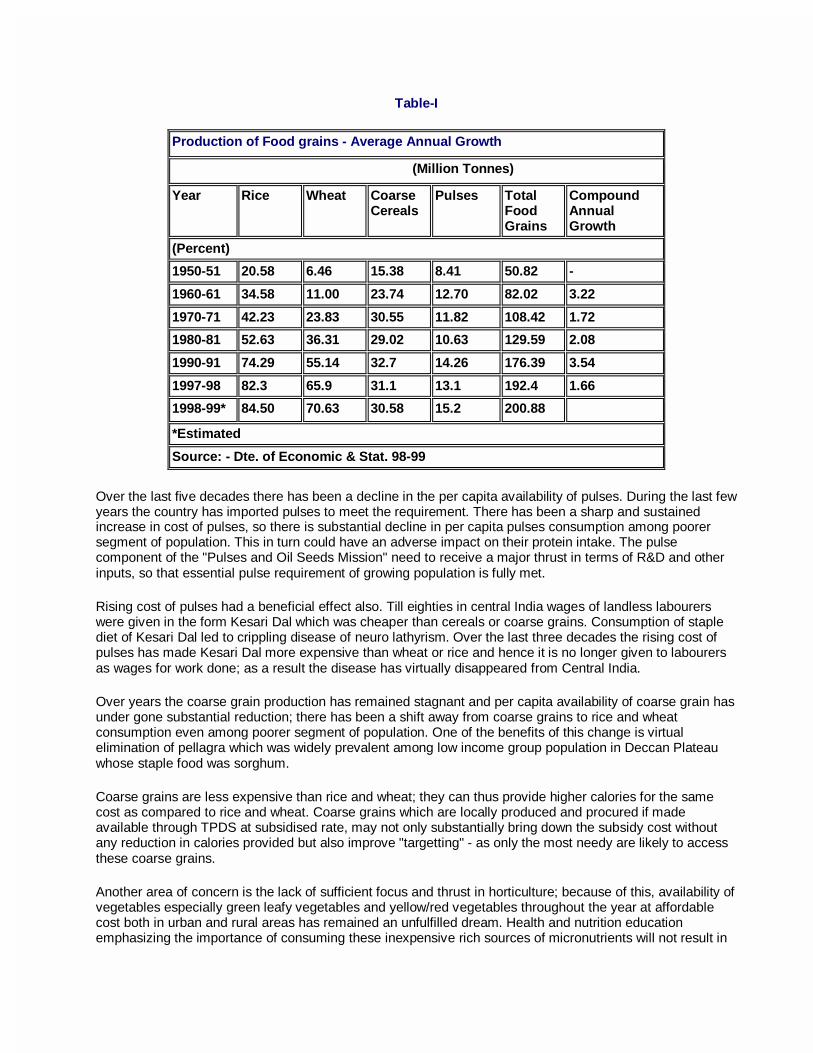
Table-I
Production of Food grains - Average Annual Growth
(Million Tonnes)
Year Rice Wheat Coarse Cereals
Pulses Total Food Grains
Compound Annual Growth
(Percent)
1950-51 20.58 6.46 15.38 8.41 50.82 -
1960-61 34.58 11.00 23.74 12.70 82.02 3.22
1970-71 42.23 23.83 30.55 11.82 108.42 1.72
1980-81 52.63 36.31 29.02 10.63 129.59 2.08
1990-91 74.29 55.14 32.7 14.26 176.39 3.54
1997-98 82.3 65.9 31.1 13.1 192.4 1.66
1998-99* 84.50 70.63 30.58 15.2 200.88
*Estimated
Source: - Dte. of Economic & Stat. 98-99
Over the last five decades there has been a decline in the per capita availability of pulses. During the last few years the country has imported pulses to meet the requirement. There has been a sharp and sustained increase in cost of pulses, so there is substantial decline in per capita pulses consumption among poorer segment of population. This in turn could have an adverse impact on their protein intake. The pulse component of the "Pulses and Oil Seeds Mission" need to receive a major thrust in terms of R&D and other inputs, so that essential pulse requirement of growing population is fully met.
Rising cost of pulses had a beneficial effect also. Till eighties in central India wages of landless labourers were given in the form Kesari Dal which was cheaper than cereals or coarse grains. Consumption of staple diet of Kesari Dal led to crippling disease of neuro lathyrism. Over the last three decades the rising cost of pulses has made Kesari Dal more expensive than wheat or rice and hence it is no longer given to labourers as wages for work done; as a result the disease has virtually disappeared from Central India.
Over years the coarse grain production has remained stagnant and per capita availability of coarse grain has under gone substantial reduction; there has been a shift away from coarse grains to rice and wheat consumption even among poorer segment of population. One of the benefits of this change is virtual elimination of pellagra which was widely prevalent among low income group population in Deccan Plateau whose staple food was sorghum.
Coarse grains are less expensive than rice and wheat; they can thus provide higher calories for the same cost as compared to rice and wheat. Coarse grains which are locally produced and procured if made available through TPDS at subsidised rate, may not only substantially bring down the subsidy cost without any reduction in calories provided but also improve "targetting" - as only the most needy are likely to access these coarse grains.
Another area of concern is the lack of sufficient focus and thrust in horticulture; because of this, availability of vegetables especially green leafy vegetables and yellow/red vegetables throughout the year at affordable cost both in urban and rural areas has remained an unfulfilled dream. Health and nutrition education emphasizing the importance of consuming these inexpensive rich sources of micronutrients will not result in

any change in food habits unless there is harnessing and effective management of horticultural resources in the country to meet the growing needs of the people at affordable cost. States like Tamil Nadu and Himachal Pradesh have initiated some efforts in this direction; similar efforts need be taken up in other states also.
Nutrition
At the time of independence the country faced two major nutritional problems; one was the threat of famine and acute starvation due to low agricultural production and lack of appropriate food distribution system. The other was chronic energy deficiency due to poverty, low-literacy, poor access to safe-drinking water, sanitation and health care; these factors led to wide spread prevalence of infections and ill health in children and adults. Kwashiorkor, marasmus, goitre, beri beri, blindness due to Vitamin-A deficiency and anaemia were major public health problems. The country adopted multi-sectoral, multi-pronged strategy to combat the major nutritional problems and to improve nutritional status of the population.
During the last 50 years considerable progress has been achieved. Famines no longer stalk the country. There has been substantial reduction in moderate and severe undernutrition in children and some improvement in nutritional status of all segments of population. Kwashiorkor, marasmus, pellagra, lathyrism, beri beri and blindness due to severe Vitamin-A deficiency have become rare. However, it is a matter of concern that milder forms of Chronic Energy Deficiency (CED) and micronutrient deficiencies continue to be widely prevalent in adults and children. In view of the fact that population growth in India will continue for the next few decades, it is essential that appropriate strategies are devised to improve food and nutrition security of families, identify individuals/families with severe forms of CED and provide them assistance to over come these problem
Operational strategy to improve the dietary intake of the family and improve nutritional status of the rapidly growing adult population would include:
• Ensuring adequate agricultural production of cereals, pulses, vegetables and other foodstuffs needed to fully meet the requirement of growing population.
• Improving in purchasing power through employment generation and employment assurance schemes;
• Providing subsidised food grains through TPDS to the families below poverty line. • Exploring feasibility of providing subsidized coarse grains to families Below Poverty Line (BPL)
Operational strategies to improve health and nutritional status of the growing numbers of women and children include:

1) Pregnant and lactating women - screening to identify women with weight below 40 Kgs and ensuring that they/ their preschool children receive food supplements through Integrated Child Development Services Scheme (ICDS); adequate antenatal intrapartum and neonatal care.
2) 0-6 months infants - Nutrition education for (a) early initiation of lactation (b) protection and promotion of universal breast feeding (c) exclusive breast feeding for the first six months; unless there is specific reason supplementation should not be introduced before 6 months (d) immunisation, growth monitoring and health care.
3) Well planned nutrition education to ensure that the infants and children do a) continue to get breasted; b) get appropriate cereal pulse - vegetable based supplement fed to them at least 3 - 4 times a day – appropriate help in ensuring this through family/community/work place support; c) immunisation and health care.
4) Children in the 0 - 5 age group; a) screen by weighment to identify children with moderate and severe undernutrition b) provide double quantity supplements through ICDS; c) screening for nutrition and health problems and appropriate intervention.
5) Primary school children: a) weigh and identify those with moderate and severe chronic energy deficiency; b) improve dietary intake to these children through the mid-day meal.
6) Monitor for improvement in the identified undernourished infants, children and mothers; if no improvement after 2 months refer to physician for identification and treatment of factors that might be responsible for lack of improvement;
7) Nutrition education on varying dietary needs of different members of the family and how they can be met by minor modifications from the family meals. Intensive health education for improving the life style of the population coupled with active screening and management of the health problems associated with obesity.
POPULATION PROJECTIONS FOR INDIA AND THEIR IMPLICATIONS
Right from 1958 the Planning Commission has been constituting an Expert Group on Population Projections prior to the preparation of each of the Five Year Plans so that the information on the population status at the time of initiation of the Plan and population projections for future are available during the preparation of the Plan. Population projections have been utilised not only for planning to ensure provision of essentials necessities such as food, shelter and clothing but also prerequisites for human development such as

education, employment and health care. Over the years there has been considerable refinement in the methodology used for population projections and substantial improvement in the accuracy of predictions. The projections made by the Standing Committee on Population Projection in 1988 for the year 1991 was 843.6 million; this figure was within 0.3% of the 846.3 million reported in the Census 1991. In 1996, Technical Group on Population Projections, had work out the population projections for the country and the states for the period 1996 to 2016 on the basis of census 1991 and other available demographic data. Population pyramids for the period 1971 to 2016 (drawn on the basis of census figures for 1971,1981 and 1991 and on the basis of population projections for the period from 1996-2016) are shown in Figure 5.
Economic Implications:
Population growth and its relation to economic growth has been a matter of debate for over a century. The early Malthusian view was that population growth is likely to impede economic growth because it will put pressure on the available resources, result in reduction in per capita income and resources; this, in turn, will result in deterioration in quality of life. Contrary to the Malthusian predictions, several of the East Asian countries have been able to achieve economic prosperity and improvement in quality of life inspite of population growth. This has been attributed to the increase in productivity due to development and utilisation of innovative technologies by the young educated population who formed the majority of the growing population. These countries have been able to exploit the dynamics of demographic transition to achieve economic growth by using the human resources as the engine driving the economic development; improved employment with adequate emoluments has promoted saving and investment which in turn stimulated economic growth.
However, not all countries, which have undergone demographic transition, have been able to transform their economies. Sri Lanka in South Asia underwent demographic transition at the same time as South East Asian countries but has not achieved the economic transition. It is now realized that population growth or demographic transition can have favourable impact on economic growth only when there are optimal interventions aimed at human resource development (HRD) and appropriate utilisation of available human resources. For India the current phase of demographic transition with low dependency ratio and high working age group population, represents both a challenge and an opportunity. The challenge is to develop these human resources through appropriate education and skill development and utilise them fully by giving them appropriate jobs with adequate emoluments; if this challenge is met through well planned schemes for HRD and employment generation which are implemented effectively, there will be improved national productivity and personal savings rates; appropriate investment of these savings will help the country to achieve the

economic transition from low economic growth - low per capita income to high economic growth - high per capita income. It is imperative to make the best use of this opportunity so as to enable the country and its citizens to vault to the high income- high economic growth status and stabilize at that level.
Interstate differences:
The projected values for the total population in different regions is shown in Figure 11. There are marked differences between States in size of the population and population growth rates (Table II), the time by which replacement level of fertility (TFR of 2.1) is to be achieved and age structure of the population (Figure 2). If the present trend continues, most of the Southern and the Western States are likely to achieve TFR of 2.1 by 2010. Urgent energetic steps to assess and fully meet the unmet needs for maternal and child health (MCH) care and contraception through improvement in availability and access to family welfare services are needed in the States of UP, MP, Rajasthan and Bihar in order to achieve a faster decline in their mortality and fertility rates.
The five states of Bihar, Uttar Pradesh, Madhya Pradesh, Rajasthan and Orissa, which constitute 44% of the total population of India in 1996, will constitute 48% of the total population of India in 2016. These states will

contribute 55% of the total increase in population of the country during the period 1996-2016 (Figure-12). In all the states performance in the social and economic sector has been poor. The poor performance is the outcome of poverty, illiteracy and poor development which co-exist and reinforce each other. The quality and coverage under health services is poor and the unmet need for FW services is about 30%. Urgent energetic steps are required to be initiated to assess and fully meet the unmet needs for maternal and child health (MCH) care and contraception through improvement in availability and access to family welfare services in the states of UP, MP, Rajasthan and Bihar in order to achieve a faster decline in their mortality and fertility rates. The performance of these states would determine the year and size of the population at which the country achieves population stabilisation.
There are also marked differences between States in socio-economic development (Table II). Increasing investments and rapid economic development are likely to occur in the States where literacy rates are high; there is ready availability of skilled work force and adequate infrastructure.
In these States, population growth rates are low. If equitable distribution of the income and benefits generated by development is ensured, substantial increase in per capita income and improvement in quality of life could occur in these States in a relatively short time.
In majority of States with high population growth rates, the performance in the social and economic sector has been poor. The poor performance could be the outcome of a variety of factors including paucity of natural, financial or human resources. Poverty, illiteracy and poor development co-exist and aggravate each other. In order to promote equity and reduce disparity between States, special assistance has been provided to the poorly performing States. The benefits accrued from such assistance has to a large extent depended upon:
• the States' ability to utilise the available funds; improve quality & coverage of services and facilities, increase efficiency and improve performance
• community awareness and ability to utilise the available services.

In spite of the additional assistance provided, improvement in infrastructure, agriculture and industry have been sub-optimal and the per capita income continues to be low in most of the poorly performing States. These States also have high birth rates and relatively low literacy rates. It is imperative that special efforts are made during the next two decades to break this vicious self perpetuating cycle of poor performance, poor per capita income, poverty, low literacy and high birth rate so that the further widening of disparities between States in terms of per capita income and quality of life is prevented.
The higher population growth rates and low per capita income in poorly performing States are likely to have a major impact on several social sector programmes. The health status of the population in these States is poor; the health sector programme will require inputs not only for improving infrastructure and manpower, but also increasing efficiency and improving performance. The Family Welfare Programme has to address the massive task of meeting all the unmet needs for MCH and contraception so that there is a rapid decline in mortality and fertility rates. Due to high birth rate, the number of children requiring schooling will be large. The emphasis in the education sector on primary education is essential to ensure that the resource constraints do not result in an increase in either proportion or number of illiterates. Emphasis on prevocational and vocational training in schools will enable these children to acquire skills through which they will find gainful employment later.
Migration:
The available data from census shows that until 1991 both internal and international migration has been negligible. The Technical Group while computing the population projection upto 2016, has assumed that the component of migration between major States and from India will be negligible. This assumption may not be valid if there is further widening of the disparity between States in terms of economic growth and employment opportunity. Given the combination of high population growth, low literacy and lack of employment opportunities in the poorly performing States, there may be increasing rural to urban migration as well as interstate migration especially of unskilled workers. Such migration may in the short run assist the migrants in overcoming economic problems associated with unemployment. However, the migrant workers and their families may face problems in securing shelter, education and health care. It is essential to build up a mechanism for monitoring these changes. Steps will have to be taken to provide for the minimum essential needs of the vulnerable migrant population.
Labour, employment and manpower:
Population, which is engaged in any economic activity (employed persons) and population seeking work (unemployed) constitute Labour Force. India has the second largest labour force in the world. Projection of labour force is pre-requisite ensuring optimal utilisation of available human resources. Manpower development is then taken up to provide adequate labour force, of appropriate skills and quality to different sectors so that there is rapid socioeconomic development and there is no mismatch between skills required and skills available. Planning also attempts to provide enabling environment for employment generation (both self employment and wage employment) in public, private and voluntary sectors in urban and rural areas.
Table- III Population and Labour force Projections: 1997-2012.
1997 2002 2007 2012 Population (Millions)
951.18 1028.93 1112.86 1196.41
Labour Force (Millions)
397.22 449.62 507.94 562.91
Labour force in India will be increasing by more than 10 million per annum during 1997-2012. It will be imperative to plan for and achieve adequate agricultural and industrial growth to absorb this work force. Most of the persons entering the labour force will be educated and have some skills. Increasing literacy and

decreasing birth rates may result in more women seeking economically productive work outside home. It will be important to generate appropriate and renumerative employment at places where labour force are available so as to reduce interstate and urban migration in search of employment. Attempts should be made to eliminate bonded labour, employment of children and women in hazardous industries and minimising occupational health hazards.
Planners face the challenge to have sustained high economic growth rate in sectors that are labour-intensive to ensure adequate employment generation for productively utilising this massive work force. If the massive work force of literate, skilled, aware men and women in age-group 20-60 years get fully employed and adequately paid they could trigger off a period of rapid economic development. As they have very few dependant children and elders there will be increased savings and investments at household level; this in turn will improve the availability of resources for accelerating economic growth. The current stage of demographic transition thus provides the country with the opportunity window for using human resources as the engine to power economic development and improving the quality of life of all the citizens.
Sex Ratio
The reported decline in the sex ratio during the current century has been a cause for concern (Figure 13). The factors responsible for this continued decline are as yet not clearly identified. However, it is well recognised that the adverse sex ratio is a reflection of the gender disparity. Higher childhood mortality in girl children is yet another facet of the existing gender disparities and consequent adverse effect on survival.
In the reproductive age group the mortality rates among women are higher than those among men. The continued high maternal mortality is one of the major factors responsible for this. Effective implementation of the Reproductive and Child Health Programme is expected to result in a substantial reduction in maternal mortality. At the moment, the longevity at birth among women is only marginally higher than that among men. However over the next decade life expectancy among women will progressively increase. Once the reproductive age group is crossed, the mortality rates among women are lower as women outlive and outnumber men in the age group 65 and above (Figure 5). The needs especially of the widowed women have to be met so that quality of life does not deteriorate. The census 2001 will collect and report vital data on sex disaggregated basis; this will be of help in identifying and taking up appropriate interventions in correcting gender disparity; continued collection, collation, analysis and reporting of sex disaggregated data from all social sectors will also provide a mechanism to monitor whether girls and women have equal access to services.

There are substantial differences in sex ratio at birth and in different age groups between states (Table II). The SRS based estimates of average sex ratio at birth for the period 1981-90 for the major States and India are given in Figure 14. The observed sex ratio of 110 is higher than the internationally accepted sex ratio at birth of 106. There are substantial differences among states in the reported sex ratio at birth. There had been speculations whether female infanticide, sex determination and selective female foeticide are at least in part responsible for this. The Government of India has enacted a legislation banning the prenatal sex determination and selective abortion. Intensive community education efforts are under way to combat these practices, especially in pockets from where female infanticide and foeticide have been reported.
Increasing Longevity
The projected populations of India in the three major age groups (less than 15, 15-59, 60 years or above) are shown in Figure 15.

Over the coming decades the country will be facing a progressive increase both in the proportion and number of persons beyond 60 years of age (Figure 5 & 15). Over the next 20 years the population of more than 60 years will grow form 62.3 million to 112.9 million; the subsequent decades will witness massive increase in this age group. Increasing longevity will inevitably bring in its wake increase in the prevalence of non-communicable diseases. The growing number of senior citizens in the country poses a major challenge and the cost of providing socio-economic security and health care to this population has to be met. Currently several region and culture specific innovative interventions to provide needed care to this population are underway; among these are efforts to reverse the trend of break up of joint families. If these efforts succeed, it will be possible to provide necessary care for rapidly increasing population of senior citizens in the subsequent two decades within the resources of the family and the country.
Majority of the people in their sixties will be physically and psychologically fit and would like to participate both in economic and social activities. They should be encouraged and supported to lead a productive life and contribute to the national development. Senior citizens in their seventies and beyond and those with health problems would require assistance. So far, the families have borne major share in caring for the elderly. This will remain the ideal method; however, there are growing number of elderly without family support; for them, alternate modes for caring may have to be evolved and implemented. Improved health care has "added years to life". The social sectors have to make the necessary provisions for improving the quality of life of these senior citizens so that they truly " add life to years."
Health Implication of the demographic transition
It was earlier assumed that population growth during demographic transition will lead to overcrowding, poverty, undernutrition, environmental deterioration, poor quality of life and increase in disease burden. Experience in the last few decades have shown that this may not always be correct. India is currently in the phase of demographic transition when the increase in population is mainly among younger, better educated and healthy population with low morbidity and mortality rate (Figure 15). The challenge for the health sector is to promote healthy life styles, improve access to and utilisation of health care so that the country can achieve substantial reduction in mortality and morbidity. Occupational health and environmental health programme need be augmented to ensure that working population remain healthy and productive. If these challenges are fully met, it is possible to accelerate reduction in morbidity and mortality rate in this age group and improve health indices of the country.
With growing number of senior citizens there may be substantial increase in health care needs especially for management of non-communicable diseases. Increasing availability and awareness about technological advances for management of these problems, rising expectations of the population and the ever escalating cost of health care are some of the problems that the health care system has to cope with. Health care

delivery systems will have to gear up to taking up necessary preventive, promotive, curative and rehabilitative care for growing population of senior citizens.
Population projections and their implications for the FW programme
There will be a marginal decline in the population less than 15 years of age (352.7 million to 350.4 million). The health care infrastructure will therefore be not grappling with ever increasing number of children for providing care and they will be able to concentrate on:
a. improving quality of care; b. focus on antenatal, intranatal and neonatal care aimed at reducing neonatal morbidity and mortality; c. improve coverage and quality of health care to vulnerable and underserved adolescents; d. promote intersectoral coordination especially with ICDS programme so that there is improvement in
health and nutritional status; e. improve coverage for immunization against vaccine preventable diseases.
The economic challenge is to provide needed funds so that these children have access to nutrition, education and skill development. The challenge faced by the health sector is to achieve reduction in morbidity and mortality rate in infancy and childhood, to improve nutritional status and eliminate ill-effects of gender bias.
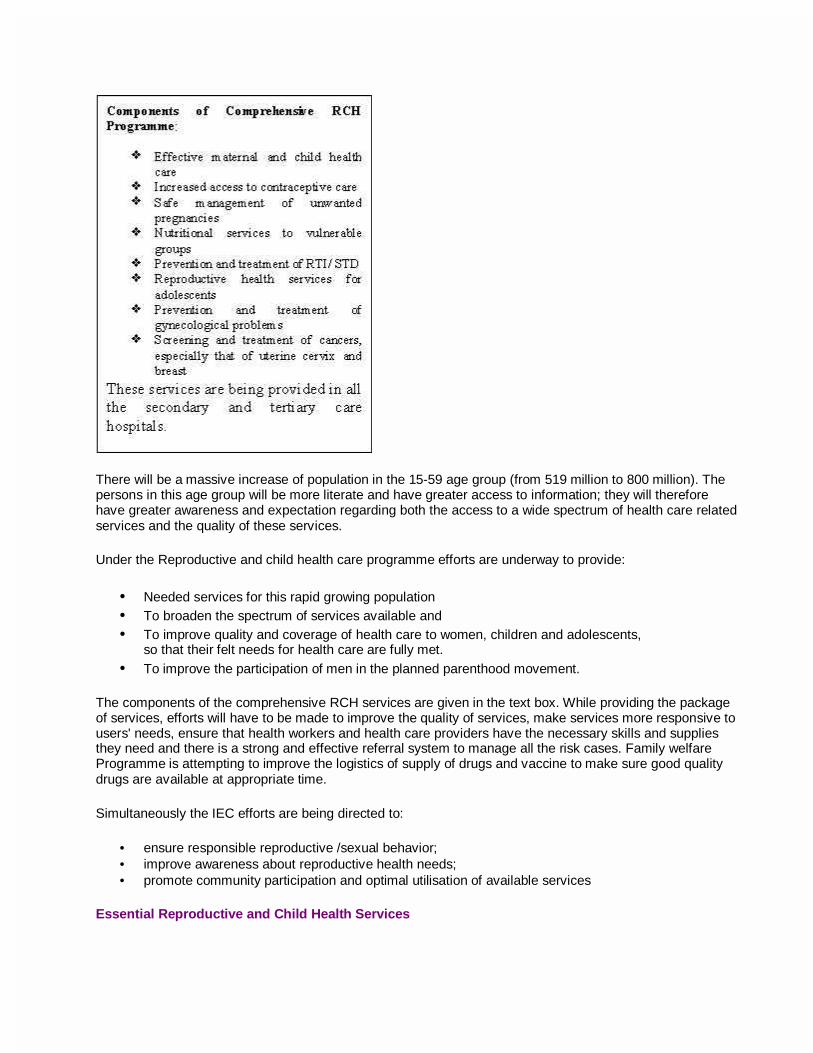
There will be a massive increase of population in the 15-59 age group (from 519 million to 800 million). The persons in this age group will be more literate and have greater access to information; they will therefore have greater awareness and expectation regarding both the access to a wide spectrum of health care related services and the quality of these services.
Under the Reproductive and child health care programme efforts are underway to provide:
• Needed services for this rapid growing population • To broaden the spectrum of services available and • To improve quality and coverage of health care to women, children and adolescents,
so that their felt needs for health care are fully met. • To improve the participation of men in the planned parenthood movement.
The components of the comprehensive RCH services are given in the text box. While providing the package of services, efforts will have to be made to improve the quality of services, make services more responsive to users' needs, ensure that health workers and health care providers have the necessary skills and supplies they need and there is a strong and effective referral system to manage all the risk cases. Family welfare Programme is attempting to improve the logistics of supply of drugs and vaccine to make sure good quality drugs are available at appropriate time.
Simultaneously the IEC efforts are being directed to:
• ensure responsible reproductive /sexual behavior; • improve awareness about reproductive health needs; • promote community participation and optimal utilisation of available services
Essential Reproductive and Child Health Services

Though it is desirable that the entire package of services indicated under comprehensive RCH care is made available to all those who need it, it will not be possible to immediately implement such a comprehensive package at primary health care level on a nationwide basis. After consultation with experts a package of essential reproductive health services for nationwide implementation at primary health care settings has been identified. Essential components recommended for nationwide implementation include:
• Prevention and management of unwanted pregnancy, • Services to provide antenatal, intra-natal and post-natal, and neo-natal care • Services to promote child health and survival, • Prevention and treatment of RTI/STD.
Most of these services are already being delivered under the Family Welfare Programme. However, there are wide variations in the quality and coverage of services not only between states but also between districts in the same state. The focus under RCH Programme is therefore on the improvement in the quality and coverage of the services over and above the existing level in all districts/states in an incremental manner so that there is over all improvement maternal and child health indices.
FAMILY WELFARE PROGRAMME IN INDIA
India, the second most populous country in the world, has no more than 2.5% of global land but is the home of 1/6th of the world's population. The prevailing high maternal, infant, childhood morbidity and mortality, low life expectancy and high fertility and associated high morbidity had been a source of concern for public health professionals right from the pre-independence period. The Bhore Committee Report (1946) which laid the foundation for health service planning in India, gave high priority to provision of maternal and child health services and improving their nutritional and health status. It is noteworthy that this report which emphasized the importance of providing integrated preventive, promotive and curative primary health care services preceded the Alma Ata declaration by over three decades. Under the Constitution of India elimination of poverty, ignorance and ill health are three important goals.
In 1951, the infant republic took stock of the existing situation in the country and initiated the first Five Year Development Plan. Living in a resource poor country with high population density, the Planners recognised in the census figures of 1951, the potential threat posed by population explosion and the need to take steps to avert it. It was recognised that population stabilisation is an essential prerequisite for sustainability of development process so that the benefits of economic development result in enhancement of the well being of the people and improvement in quality of life. India became the first country in the world to formulate a National Family Planning Programme in 1952, with the objective of "reducing birth rate to the extent necessary to stabilise the population at a level consistent with requirement of national economy". Thus, the key elements of health care to women and children and provision of contraceptive services have been the focus of India’s health services right from the time of India’s independence. Successive Five Year Plans have been providing the policy framework and funding for planned development of nationwide health care infrastructure and manpower. The Centrally Sponsored and 100% centrally funded Family Welfare Programme provides additional infrastructure, manpower and drugs, vaccines contraceptives and other consumables needed for improving health status of women and children and to meet all the felt needs for fertility regulation.
Basic premises of the Family Welfare Programme are:
• Acceptance of FW services is voluntary, • FW programme will provide:
• Integrated Maternal and Child Health (MCH) & FP services • Effective IEC to improve awareness • Ensure easy and convenient access to FW services free of cost
Progress under the FW programme
Contraception:
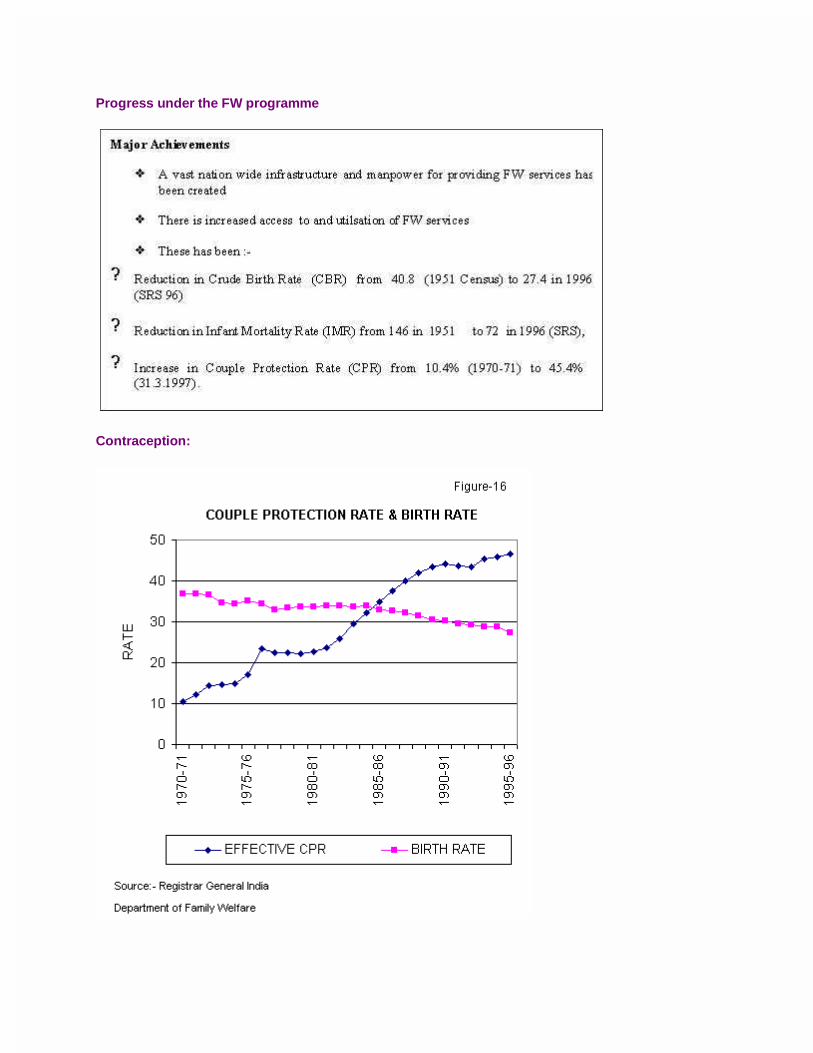
Over the last four decades there has been substantial improvement in the availability and utilization of the and access to FW services and a progressive increase in the acceptance of contraception and couple protection rates (Figure 16) In the initial fifteen years, the rise in the couple protection rate has been steep. The reduction in the CBR was however not commensurate with the increase in couple protection rates. In the last ten years, the rise in CPR is less steep, but the fall in CBR has been steeper than in the earlier years.
The age and parity of the acceptors of contraception, and the continuation rates of temporary methods of contraception are some of the important factors that determine birth rates. The trends in CPR and CBR over the last 25 years suggest that over the years there has been an improvement in the acceptance of appropriate contraception at appropriate time. Currently the FW Programme is focusing its attention on need assessment, balanced presentation of advantages and disadvantages about all the available methods of contraception counseling, provision of appropriate contraceptive at the right time and good follow up services. Effective implementation of the FW programme and ensuring that all the unmet needs for contraception are met will result in substantial improvement in CPR and enable rapid reduction in CBR.
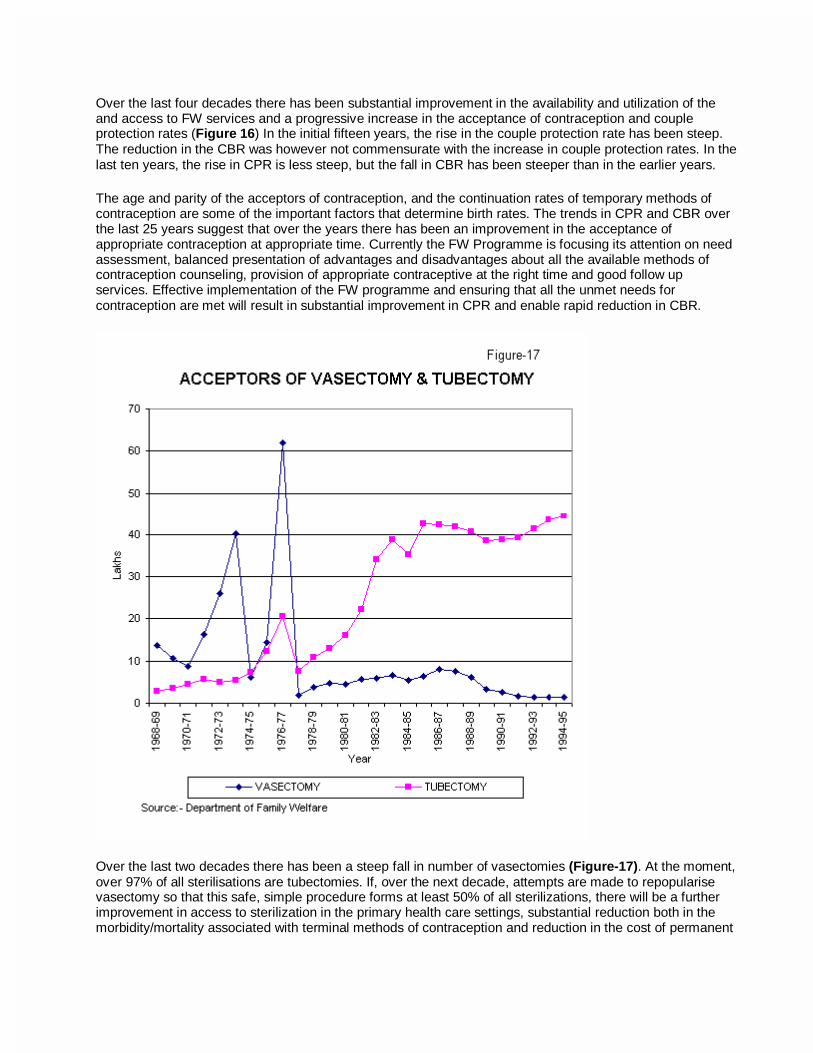
Over the last two decades there has been a steep fall in number of vasectomies (Figure-17). At the moment, over 97% of all sterilisations are tubectomies. If, over the next decade, attempts are made to repopularise vasectomy so that this safe, simple procedure forms at least 50% of all sterilizations, there will be a further improvement in access to sterilization in the primary health care settings, substantial reduction both in the morbidity/mortality associated with terminal methods of contraception and reduction in the cost of permanent
methods of contraception. In addition this would be one of the efforts to improve participation of men in planned parenthood.
In the past demographers have assumed that access to a wide spectrum of spacing and permanent methods of contraception and achievement of contraceptive prevalence of atleast 60% are essential for achievement of replacement level of fertility. In Kerala and Tamil Nadu sterilisation is the most commonly utilised method of contraception; these States have been able to achieve replacement level of fertility (Total Fertility Rate (TFR) of 2.1) long before there was improved access to a wide spectrum temporary methods of contraception and Couple protection rate of 60% has been achieved. The National FW programme statistics as well as National Family Health Survey have shown in all the states in India sterilization is the most widely accepted method of contraception. Given the fact that most couples in India complete their family by the time they are in their mid-20s and marriage is a stable institution, sterilisation is the most logical, safe and cost effective contraception to protect these young couples against unwanted pregnancies for the next two decades.
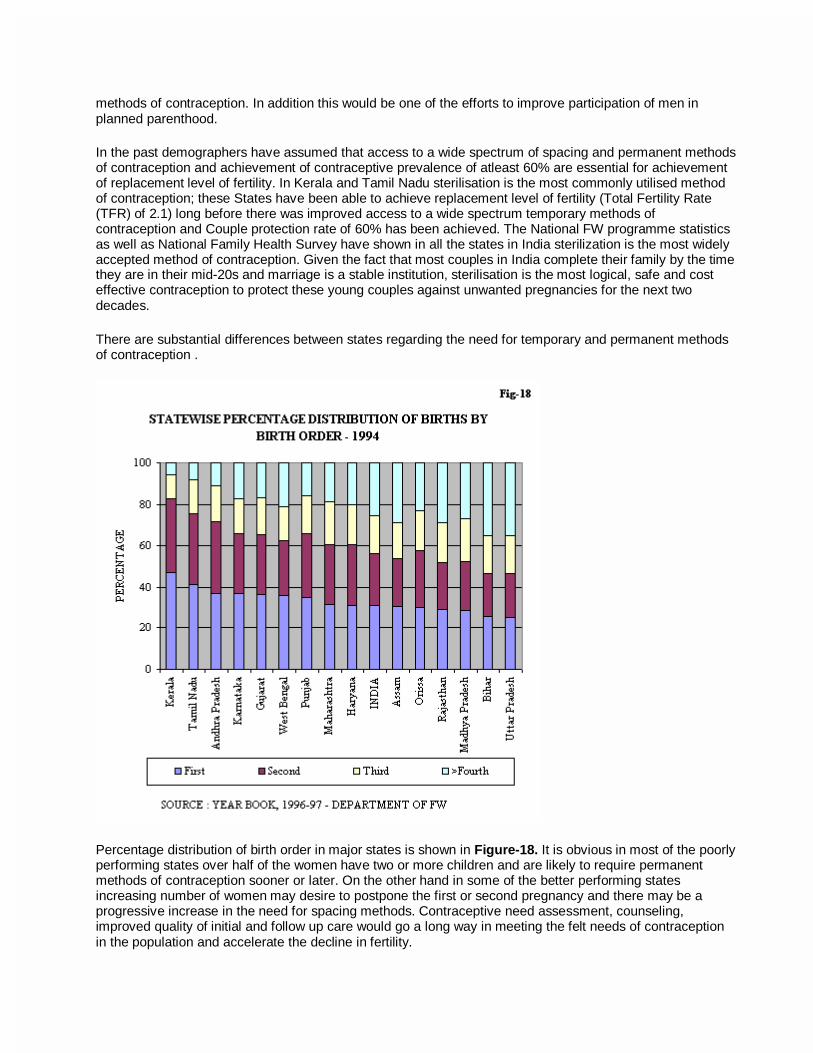
There are substantial differences between states regarding the need for temporary and permanent methods of contraception .
Percentage distribution of birth order in major states is shown in Figure-18. It is obvious in most of the poorly performing states over half of the women have two or more children and are likely to require permanent methods of contraception sooner or later. On the other hand in some of the better performing states increasing number of women may desire to postpone the first or second pregnancy and there may be a progressive increase in the need for spacing methods. Contraceptive need assessment, counseling, improved quality of initial and follow up care would go a long way in meeting the felt needs of contraception in the population and accelerate the decline in fertility.

Maternal and child health
Reduction in the infant and child mortality indices between 1951 -1997 is shown in Figure-19. Even though the decline in IMR and CDR are substantial, it is noteworthy that maternal, perinatal, neonatal mortality rates continue to remain high. This is because the antenatal, intrapartum and neonatal care programmes have, till now, not aimed at screening of all pregnant women for risk factors, identification and appropriate referral of the `at risk' individuals. Improvement in the contents and quality of antenatal and paediatric care at primary health care level is receiving focussed attention under the RCH programme.
Inter -State/ intra-State differences in Fertility and Mortality
As the availability and utilisation of family welfare services is the critical determinant of performance in Family Welfare Programme, achievements in terms of reduction in IMR and CBR go hand in hand in most States (Table-II). However, there are exceptions; both Punjab and Tamil Nadu have good primary health care infrastructure; IMR in both the States are identical and the age at marriage in these States is similar; TFR in Tamil Nadu is 2.1 and in Punjab it is 2.9. In Bihar, IMR is 72 and TFR is 4.6 but Assam with IMR of 75 has a TFR of 3.8. Efforts will have to be made to identify the factors responsible for poor achievements in terms of IMR and TFR and area specific remedial measures have to be planned and implemented in the States.
District wise data on CBR and IMR computed on the basis of Census 1991 show that there are marked differences in these indices not only between States but also between districts in the same State. Census 1991 has confirmed that even in Kerala there are districts where IMR (Idikki) and CBR (Mallapuram) are higher than national levels. There are districts in UP with IMR (Almora) and CBR (Kanpur -Urban) lower than national levels. The Family Welfare Programme, therefore, has been re-oriented to
a. remove or minimise the inter and intra-state differences, b. undertake realistic PHC based decentralised area-specific microplanning tailored to meet the
local needs and c. involve Panchayati Raj institutions in microplanning and monitoring at local level to effective
implementation of the programme and ensuring effective community participation.

Under the Reproductive Child Health programme efforts are under way to improve the quality and coverage of FW services in all states. In each state, the success achieved by the better performing districts will have be replicated in poorly performing districts; in addition efforts will have to be made to achieve incremental improvement in performance in all districts so that the performance in the state improves.
States like Kerala and Tamil Nadu have achieved low CBR and IMR at relatively low cost (Table-IV). On the other hand, States like Haryana and Punjab have not achieved any substantial reduction in CBR in spite of higher expenditure per eligible couple. In States like Bihar and Uttar Pradesh the expenditure is low and performance is poor. In between these extreme categories are States like Orissa and Andhra Pradesh with average or below average expenditure and average or below average performance in MCH or family planning. In some States like Orissa and West Bengal the performance in family planning is better than the performance in MCH or vice versa. Deptt. of Family Welfare is attempting to implement the recommendation of the NDC Committee on Population, that factors responsible for observed differences in utilisation of funds as well as impact of the programme are to be studied and existing lacunae identified and rectified at the district level.
The last five decades have shown that different states used different approaches to achieve improvement in MCH care and improve performance in FW programme. Some of these efforts have been path breaking and have disproved many theories on the essential prerequisites for rapid achievement of decline fertility and mortality. Some examples of these experiences are indicated below:
• Goa with relatively high income, literacy and good health care infrastructure was the first administrative unit to achieve the replacement level of fertility. This fitted the classical theory; Goa and Pondicherry have been having less than replacement level fertility for over a decade.
• Kerala, the first State to achieve replacement level of fertility (TFR of 2.1) did so in spite of relatively low per capita income proving that in the Indian context economic development is not an essential prerequisite for the achieving small family. High status of women, female literacy, age at marriage and low infant mortality were thought to be the factors behind the rapid fall in fertility in Kerala
• Tamil Nadu which was the second state to achieve replacement level of fertility did so in spite of low PCI, higher IMR and lower female literacy rate than Kerala. This is attributed to the strong social and political commitment, backed by good administrative support and ready availability of Family Welfare Services. There have been speculations whether the low PCI in the aware population desiring improvement in quality of care had also acted as factor that accelerated the decline in fertility.
• Andhra Pradesh is likely to achieve replacement level of fertility in the next two years. The State has shown a steep decline in fertility in spite of relatively lower age at marriage, low literacy and poorer outreach of primary health care infrastructure. It has been suggested that the major factors responsible for the success include caring attitude of the government and strong sustained movement to empower women.
• In the North-eastern States of Tripura, Manipur, Mizoram there is substantial difficulty in accessing primary health care facilities, but these States have achieved not only low fertility rates but also low infant mortality, suggesting thereby that a literate aware population can successfully overcome difficulties in access to and availability of primary health care infrastructure.

Unmet needs for Family Welfare services
The National Family Health Survey (NFHS) 1992-93 had provided an independent nation wide evaluation of the progress and problems in delivery of Family Welfare services in the country. The survey confirmed that in spite of obvious constraints and inadequacies, the governmental network can, and does, provides most of the MCH and contraceptive care (Figure 20);
Data from the NFHS showed that:
• There is universal awareness about contraception
• 40.6% of currently married women use contraceptives
• Wanted fertility is lower than the actual fertility
• There is a large unmet need for contraception: - o 11.0% for birth spacing methods and o 8.5% for terminal method.
• Unmet needs for health and contraceptive care exist in all regions and in all segments of the population irrespective of religion, caste, education and income status.
Lessons learnt during implementation of Family Welfare Programme:
• Governmental network provides most of the MCH and contraceptive care • Adequate functional health infrastructure is an essential prerequisites for the success of the
programme • Providing efficient and effective integrated MCH and contraceptive care helps in building up rapport
with the families • IEC activities are powerful tools for promoting the small family norm; • The population is conservative but responsible, responsive and mature; their response is slow but
rational and sustained.
There is a popular belief that the population growth is due to poor performance in the health sector. This is not correct. The population growth that the country (and the world) had witnessed in the last five decades is
mainly because of rapid reduction in the death rates due to health care and is inevitable during the frist three phases of demographic transition. India’s progress in demographic transition has been a slow but sustained; unlike some other developing countries India’s population growth never exceeded 2.2% even at its peak; the decline in population growth once started has been sustained. This orderly progression has been achieved through improving access to family welfare services and ensuring peoples participation.
Concern has been expressed by some groups that the RCH programme which essentially aims at improving quality and coverage of the already ongoing maternal and child health and contraceptive care may not be successful in accelerating the decline in fertility and help the country to achieve rapid population stabilization and that there is a need for new path breaking innovations. Ongoing evaluations, however, do not suggest that there is a need for change in policy, strategy and programme content; all these studies have emphasized that there is a huge unmet need for services and there is an urgent need to improve access to good quality services to meet this need, the focus of the RCH initiative is on this task.
Approach to FW Programme during the Ninth Plan
Reduction in Population growth is one of the major objectives in the Ninth Plan .
The current high population growth rate is due to:
• the large size of the population in the reproductive age-group (estimated contribution 60%); • higher fertility due to unmet need for contraception (estimated contribution 20%); and • high wanted fertility due to prevailing high IMR (estimated contribution about 20%).
Rapid reduction in the population growth rate can be achieved by:
• meeting all the felt-needs for contraception; and • reducing the infant and maternal morbidity and mortality so that there is a reduction in the desired
level of fertility .
The Ninth Plan strategies for achieving these objectives are:
• To assess the needs for reproductive and child health at PHC level and undertake area- specific micro planning; and
• To provide need-based, demand-driven high quality, integrated reproductive and child health care.
Efforts of the Family Welfare Programme are being directed towards:
• Bridging the gaps in essential infrastructure and manpower through a flexible approach and improving operational efficiency through investment in social, behavioural and operational research
• Providing additional assistance to poorly performing districts identified on the basis of the 1991 census to fill existing gaps in infrastructure and manpower.
• Ensuring uninterrupted supply of essential drugs, vaccines and contraceptives, adequate in quantity and appropriate in quality
• Promoting male participation in the Planned Parenthood movement and increasing the level of acceptance of vasectomy.
Under the RCH Programme the focus is on enhancing the quality and coverage of family welfare services through:
• Increasing participation of general medical practitioners working in voluntary, private, joint sectors and the active cooperation of practitioners of ISM&H;
• Involvement of the Panchayati Raj Institutions for ensuring inter-sectoral coordination and community participation in planning, monitoring and management;
• Involvement of the industries, organised and unorganised sectors, agriculture workers and labour representatives.
Goals to be achieved
The performance under the Family Welfare Programme will depend upon :
• Programme initiatives during the Ninth Plan
• Financial resources available;
• Capability and effectiveness of the infrastructure and manpower to carry out the programme;
• Literacy and economic status of the families particularly of the women;
• Policy support by opinion leaders and the society.
The Deptt. of Family Welfare has launched the RCH intiative during the Ninth Plan. Under the Special Action Plan an additional sum of Rs 4700 crores had been provided to the Family Welfare Deptt. and the toal outlay provided the Department of Family Welfare was raised to Rs. 15120.20 crores for the Ninth Plan period to enable the Dept to implement the RCH programme.
In view of the marked differences in the availability and utilisation of family welfare services and IMR CBR and CPR between States and districts within the states, a differential area specific approach to the implementation of Family Welfare Programme is being used. State specific Expected Level of Achievement in terms of process and impact indicators have been worked out for effective monitoring of the programme.
Projection of expected levels of achievement for process and impact indicators at the end of the Ninth Plan have taken into consideration the pace of improvement in these indicators during the Eighth Plan and the additional policy and programme measures envisaged to accelerate the pace of achievement during the Ninth Plan and the additional funding being provided under the Programme. The State- specific projections have been worked out at two different levels of achievement, one on the basis of the assumption that the trend observed with regard to these parameters in the last 15 years will continue during the Ninth Plan period and the second on the assumption that the additional policy and programme initiatives provided during the Ninth Plan period will result in the acceleration of the pace and result in more substantial improvement during the Ninth Plan period. The expected levels of achievement under both these assumptions have been computed State wise The expected levels of achievement at the national level by the terminal year of Ninth Plan (2002) are given below:
Indicator If current trend continues If acceleration envisaged in the Ninth Five Year Plan is achieved
C B R 24/1000 23/1000
I M R 56/1000 50/1000 T F R 2.9 2.6 C P R 51% 60% NNM R 35/1000 M M R 3/1000
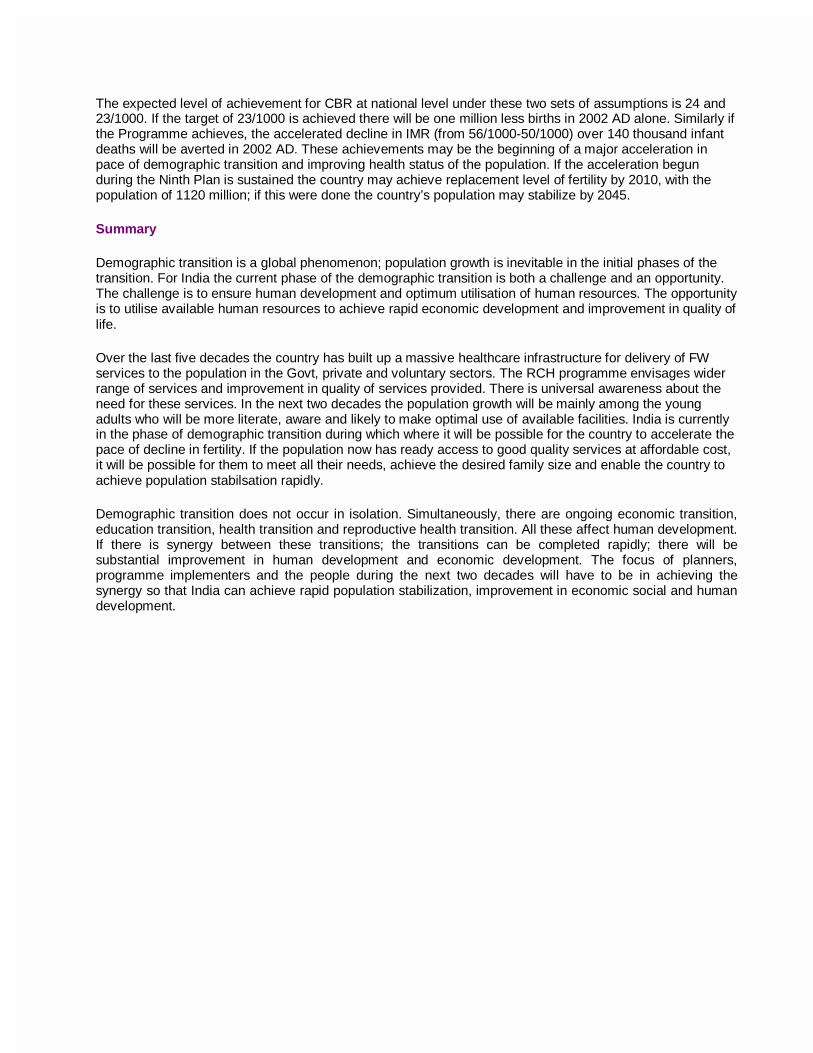
The expected level of achievement for CBR at national level under these two sets of assumptions is 24 and 23/1000. If the target of 23/1000 is achieved there will be one million less births in 2002 AD alone. Similarly if the Programme achieves, the accelerated decline in IMR (from 56/1000-50/1000) over 140 thousand infant deaths will be averted in 2002 AD. These achievements may be the beginning of a major acceleration in pace of demographic transition and improving health status of the population. If the acceleration begun during the Ninth Plan is sustained the country may achieve replacement level of fertility by 2010, with the population of 1120 million; if this were done the country’s population may stabilize by 2045.
Summary
Demographic transition is a global phenomenon; population growth is inevitable in the initial phases of the transition. For India the current phase of the demographic transition is both a challenge and an opportunity. The challenge is to ensure human development and optimum utilisation of human resources. The opportunity is to utilise available human resources to achieve rapid economic development and improvement in quality of life.
Over the last five decades the country has built up a massive healthcare infrastructure for delivery of FW services to the population in the Govt, private and voluntary sectors. The RCH programme envisages wider range of services and improvement in quality of services provided. There is universal awareness about the need for these services. In the next two decades the population growth will be mainly among the young adults who will be more literate, aware and likely to make optimal use of available facilities. India is currently in the phase of demographic transition during which where it will be possible for the country to accelerate the pace of decline in fertility. If the population now has ready access to good quality services at affordable cost, it will be possible for them to meet all their needs, achieve the desired family size and enable the country to achieve population stabilsation rapidly.
Demographic transition does not occur in isolation. Simultaneously, there are ongoing economic transition, education transition, health transition and reproductive health transition. All these affect human development. If there is synergy between these transitions; the transitions can be completed rapidly; there will be substantial improvement in human development and economic development. The focus of planners, programme implementers and the people during the next two decades will have to be in achieving the synergy so that India can achieve rapid population stabilization, improvement in economic social and human development.

Figure - 2
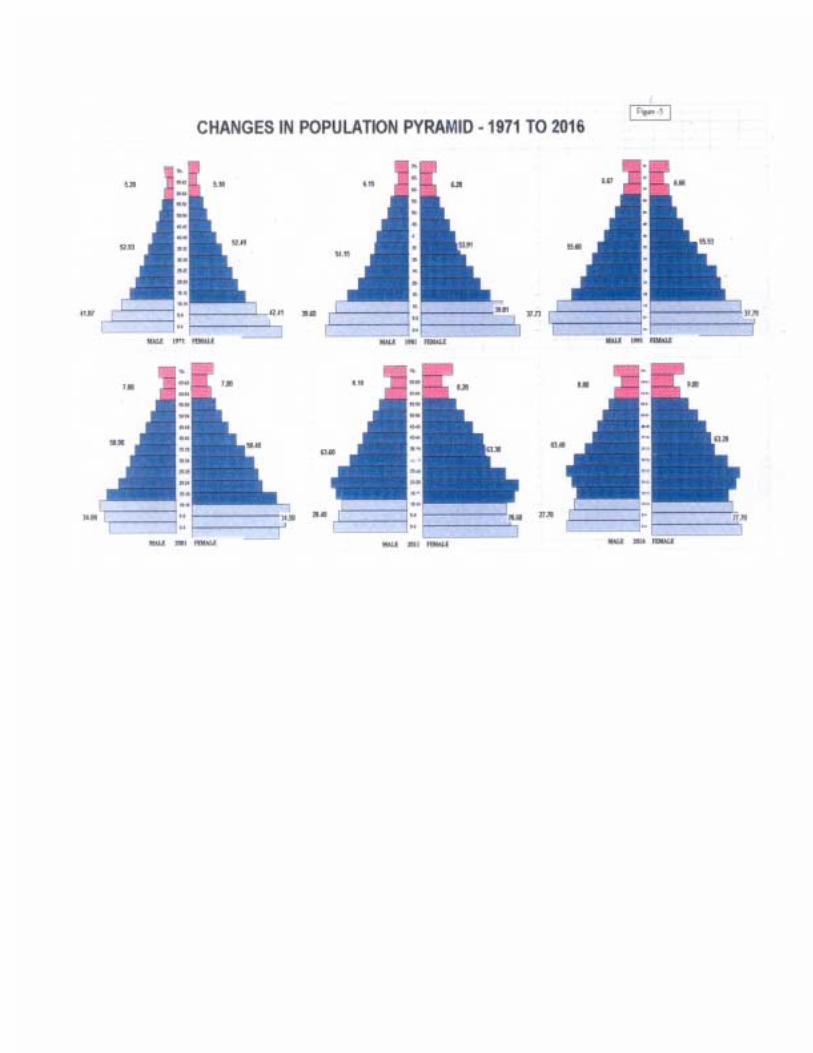
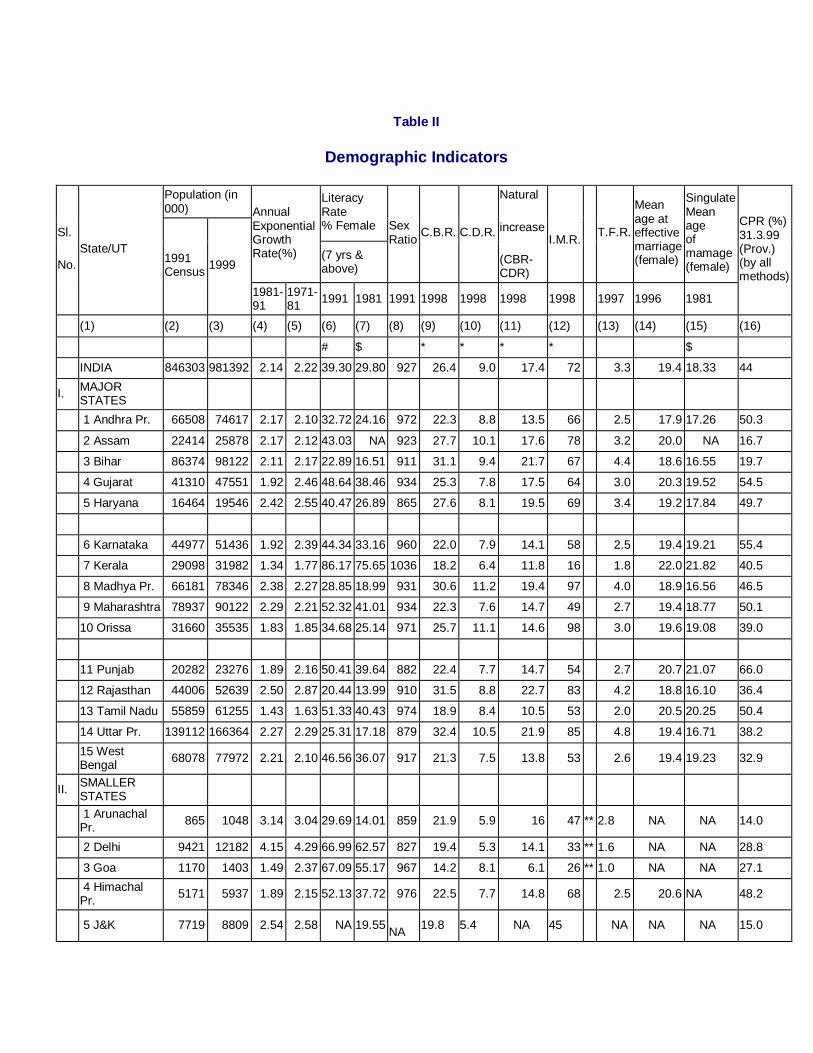
Table II
Demographic Indicators
Population (in 000)
Literacy Rate % Female
Annual Exponential Growth Rate(%) (7 yrs &
above)
Sex Ratio
C.B.R. C.D.R.
Natural
increase
(CBR-CDR)
I.M.R.
T.F.R.
Mean age at effective marriage (female)
Singulate Mean age of mamage (female)
Sl.
No. State/UT
1991 Census
1999
1981-91
1971-81
1991 1981 1991 1998 1998 1998 1998 1997 1996 1981
CPR (%) 31.3.99 (Prov.) (by all methods)
(1) (2) (3) (4) (5) (6) (7) (8) (9) (10) (11) (12) (13) (14) (15) (16)
# $ * * * * $
INDIA 846303 981392 2.14 2.22 39.30 29.80 927 26.4 9.0 17.4 72 3.3 19.4 18.33 44
I. MAJOR STATES
1 Andhra Pr. 66508 74617 2.17 2.10 32.72 24.16 972 22.3 8.8 13.5 66 2.5 17.9 17.26 50.3
2 Assam 22414 25878 2.17 2.12 43.03 NA 923 27.7 10.1 17.6 78 3.2 20.0 NA 16.7
3 Bihar 86374 98122 2.11 2.17 22.89 16.51 911 31.1 9.4 21.7 67 4.4 18.6 16.55 19.7
4 Gujarat 41310 47551 1.92 2.46 48.64 38.46 934 25.3 7.8 17.5 64 3.0 20.3 19.52 54.5
5 Haryana 16464 19546 2.42 2.55 40.47 26.89 865 27.6 8.1 19.5 69 3.4 19.2 17.84 49.7
6 Karnataka 44977 51436 1.92 2.39 44.34 33.16 960 22.0 7.9 14.1 58 2.5 19.4 19.21 55.4
7 Kerala 29098 31982 1.34 1.77 86.17 75.65 1036 18.2 6.4 11.8 16 1.8 22.0 21.82 40.5
8 Madhya Pr. 66181 78346 2.38 2.27 28.85 18.99 931 30.6 11.2 19.4 97 4.0 18.9 16.56 46.5
9 Maharashtra 78937 90122 2.29 2.21 52.32 41.01 934 22.3 7.6 14.7 49 2.7 19.4 18.77 50.1
10 Orissa 31660 35535 1.83 1.85 34.68 25.14 971 25.7 11.1 14.6 98 3.0 19.6 19.08 39.0
11 Punjab 20282 23276 1.89 2.16 50.41 39.64 882 22.4 7.7 14.7 54 2.7 20.7 21.07 66.0
12 Rajasthan 44006 52639 2.50 2.87 20.44 13.99 910 31.5 8.8 22.7 83 4.2 18.8 16.10 36.4
13 Tamil Nadu 55859 61255 1.43 1.63 51.33 40.43 974 18.9 8.4 10.5 53 2.0 20.5 20.25 50.4
14 Uttar Pr. 139112 166364 2.27 2.29 25.31 17.18 879 32.4 10.5 21.9 85 4.8 19.4 16.71 38.2
15 West Bengal
68078 77972 2.21 2.10 46.56 36.07 917 21.3 7.5 13.8 53 2.6 19.4 19.23 32.9
II. SMALLER STATES
1 Arunachal Pr.
865 1048 3.14 3.04 29.69 14.01 859 21.9 5.9 16 47 ** 2.8 NA NA 14.0
2 Delhi 9421 12182 4.15 4.29 66.99 62.57 827 19.4 5.3 14.1 33 ** 1.6 NA NA 28.8
3 Goa 1170 1403 1.49 2.37 67.09 55.17 967 14.2 8.1 6.1 26 ** 1.0 NA NA 27.1
4 Himachal Pr.
5171 5937 1.89 2.15 52.13 37.72 976 22.5 7.7 14.8 68 2.5 20.6 NA 48.2
5 J&K 7719 8809 2.54 2.58 NA 19.55 NA
19.8 5.4 NA 45 NA NA NA 15.0

6 Manipur 1837 2214 2.57 2.83 47.60 34.61 958 19.0 5.3 13.7 21 ** 2.4 NA NA 20.1
7 Meghalaya 1775 2140 2.84 2.80 44.85 37.15 955 29.2 9.0 20.2 53 ** 4.0 NA NA 4.6
8 Mizoram 690 837 3.34 3.99 78.60 68.60 921 15.8 5.6 NA 25.0 NA NA NA 34.6
9 Nagaland 1209 1479 4.45 4.09 54.75 40.28 886 NA NA NA NA ** 1.5 NA NA 7.8
10 Sikkim 406 491 2.51 4.14 46.69 27.35 878 20.9 6.1 14.8 51 ** 2.5 NA NA 21.9
11 Tripura 2757 3325 2.95 2.79 49.65 38.01 945 17.6 6.1 11.5 47 ** 3.9 NA NA 25.2
III. UNION TERRITORIES
1 A&N Islands 281 339 3.97 4.98 65.46 53.15 818 17.70 4.6 13.1 28 ** 1.9 NA NA 39.9
2 Chandigarh 642 781 3.52 5.67 72.34 69.31 790 17.9 4.1 13.8 28 ** 2.1 NA NA 35.0
3 D&N Haveli 138 167 2.89 3.38 26.98 20.38 952 34.1 7.7 26.4 63 ** 3.5 NA NA 29.1
4 Daman & Diu
102 123 2.52 2.32 59.40 46.51 969 21.5 7.0 14.5 54 ** 2.5 NA NA 30.2
5 Lakshadweep
52 62 2.51 2.37 72.89 55.32 943 22.9 6.2 16.7 37 ** 2.8 NA NA 9.1
6 Pondicherry 808 976 2.90 2.50 65.63 53.03 979 18.0 7.8 10.2 26 ** 1.8 NA NA 56.9
Sex rario - Females per 1000 males
Col. 2,4 to 7 - 1991 census:
Col. 9 to 14 - SRS Estimates: Col. 15 - 1981 Census: Col.16-Deptt. of FW
#: Excludes J&K and Mizoram
$: Excludes Assam: **: for 1993
Source -
NA : Not Available Note:IMR and TFR for smaller States and UTs are Three years
moving average(1995-97)

Table - IV
PLAN EXPENDITURE PER ELIGIBLE COUPLE UNDER FAMILY WELFARE PROGRAMME IN MAJOR STATES
ELIGIBLE COUPLES
** (MARCH
1993)
EXPENDITURE ON F.W. 1992-93
EXPENDITURE ON FW PER ELIGIBLE COUPLE
METHOD WISE COUPLE PROTECTION RATE (EFFECTIVE)
(31st March 1993) CBR 1994
(MILLION) (Rs. CRORES) (Rs.) STERILISATION IUD CC OP TOTAL
1 2 3 4 5 6 7 8 9
MAJOR STATES
Andhra Pradesh 23.8 12.80 82.40 64.38 36.4 4.2 3.3 1.4 45.3
Assam 30.8 3.50 21.01 60.03 22.9 1.5 0.5 0.3 25.2
Bihar 32.5 16.70 75.88 45.44 21.2 2.3 0.3 0.2 24.0
Gujarat 27.1 7.35 57.92 78.80 38.2 10.0 5.1 1.2 54.5
Haryana 30.8 2.83 27.53 97.28 33.2 10.8 7.5 1.1 52.7
Karnataka 25.0 7.73 47.19 61.05 39.6 5.8 1.7 1.1 48.2
Kerala 17.4 4.47 35.03 78.37 44.5 4.9 3.2 0.8 53.4
Madhya Pradesh 33.0 12.47 79.06 63.40 26.6 5.1 4.6 1.6 37.9
Maharashtra 25.1 14.22 94.98 66.79 40.9 6.6 3.9 1.8 53.2
Orissa 28.0 5.51 39.71 72.07 29.5 5.4 2.4 0.8 38.1
Punjab 25.0 3.15 37.74 119.81 37.9 23.1 8.1 1.9 70.9
Rajasthan 33.7 8.17 59.07 72.30 22.1 4.2 2.4 0.6 29.3
Tamil Nadu 19.2 9.91 72.21 72.87 44.9 8.4 1.2 1.0 54.5
Uttar Pradesh 35.4 25.44 171.04 67.23 19.2 9.4 3.6 0.9 33.2
West Bengal 25.2 11.65 66.60 57.17 28.6 2.6 1.6 1.5 34.3
India 28.7 151.72 1190.40 78.46 30.3 6.3 4.9 2.0 43.5
SOURCE: DEPTT OF FAMILY WELFARE
**- AS PROJECTED BY DEPTT. OF FAMILY WELFARE YEAR BOOK 1992-93