polymerization and polymer characterization of n ... · polymerization and polymer characterization...
TRANSCRIPT
POLYMERIZATION AND POLYMER CHARACTERIZATION OF
N-VINYLCAPROLACTAM
A THESIS SUBMITTED TO THE GRADUATE SCHOOL OF NATURAL AND APPLIED SCIENCES
OF MIDDLE EAST TECHNICAL UNIVERSITY
BY
ÖZLEM POLAT
IN PARTIAL FULFILMENT OF THE REQUIREMENTS FOR
THE DEGREE OF MASTER OF SCIENCE IN
POLYMER SCIENCE & TECHNOLOGY
SEPTEMBER 2005

Approval of the Graduate School of Natural and Applied Sciences
Prof. Dr. Canan Özgen Director
I certify that this thesis satisfies all the requirements as a thesis for the degree of Master of Science.
Prof. Dr.Ali Usanmaz Head of Department This is to certify that we have read this thesis and that in our opinion it is fully adequate, in scope and quality, as a thesis for the degree of Master of Science.
Prof. Dr. Ali Usanmaz Supervisor Examining Committee Members
Prof. Dr. Duygu Kısakürek (METU,CHEM)
Prof. Dr. Ali Usanmaz (METU,CHEM)
Prof. Dr. Zuhal Küçükyavuz (METU,CHEM)
Prof. Dr.Jale Hacaloğlu (METU,CHEM)
Asst.Prof. H. Nur Testereci (Kırıkkale U,CHEM)
iii
I hereby declare that all information in this document has been obtained and presented in accordance with academic rules and ethical conduct. I also declare that, as required by these rules and conduct, I have fully cited and referenced all material and results that are not original to this work. Name, Last name :
Signature :
iv
ABSTRACT
POLYMERIZATION AND POLYMER CHARACTERIZATION OF
N-VINLYCAPROLACTAM
Polat, Özlem
M.S., Department of Polymer Science and Technology
Supervisor : Prof. Dr. Ali Usanmaz
September 2005, 78 pages
In this study, N-vinylcaprolactam was polymerized by radiation in the solid
state. The polymerization was carried out at room temperature under vacuum and
open to atmosphere respectively. The polymerization mechanism showed
autoacceleration and the rate of polymerization was higher in the presence of oxygen.
However the limiting conversion was 100% under vacuum conditions and 90% in the
present of oxygen. This is due to the low molecular weight oligomer formation in the
presence of oxygen. The polymers were characterized by FT-IR, NMR, DSC, TGA,
Light Scattering, GPC, Viscosity, X-Ray and mass spectrometry methods. FT-IR and
NMR results showed that polymerization proceded through the vinyl groups and
caprolactam is a pendent group. DSC results show that the polymer produced could
be polymerized further or crosslink by heat treatment. The Tg value for the polymer
obtained from radiation induced polymerization was about 147 0C. It increased to
174 0C after thermal treatment. Solution properties were studied by Light Scattering ,
GPC and viscosity measurements. The solution behavior of the polymer was highly
dependent on the molecular weight of the polymer. This effect was also the
v
conformation of polymer in solution and the viscosity properties. Since the polymer
obtained had low molecular weight a regular relation could not be obtained for the
radius of gyration, hydrodynamic radius and viscosity. X-ray diffraction studies
showed that the monomer structure was retained up to about 86% conversion of
monomer to polymer. The chain structure of the polymer was confirmed further by
mass spectroscopic results.
Keywords: Solid state polymerization, N-vinylcaprolactam, radiation polymerization,
characterization.
vi
ÖZ
N-VİNİLKAPROLAKTAM POLİMERLEŞTİRİLMESİ VE
POLİMER KARAKTERİZASYONU
Polat, Özlem
Yüksek Lisans, Polimer Bilimi ve Teknolojisi Bölümü
Tez Yöneticisi : Prof. Dr. Ali Usanmaz
Eylül 2005, 78 sayfa
Bu çalışmada, N-vinylcaprolactamın katı hal polimerizasyonu radyasyon ile
gerçekleştirilmiştir. Polimerleşme tepkimesi, açık havada ve vakum altında oda
sıcaklığında yapılmıştır. Polimerleşme kendi kendine hızlanan bir mekanizma takip
etmektedir. Polimerleşme hızı oksijenli ortamda daha yüksektir. Vacum altında
polimerleşmeye limit dönüşüm %100, oksijenli ortamda ise %90’dır. Ancak
oksijenli ortamda düşük molekül ağırlıklı oligomerler oluşmaktadır. Elde edilen
polimer örnekleri FT-IR, NMR, DSC, TGA, Light Scattering, GPC, Viscosity, X-
Ray ve Mass spektroskopik methodları ile karakterize edilmiştir. FT-IR ve NMR
sonuçları polimerleşme mekanizmasının kaprolaktam yan grup bağlı vinil grupları
üzerinden yürüdüğünü göstermektedir. DSC sonuçları ise ısı ile muamele sonucu
polimerizasyonun devam ettiğini veya çapraz bağların oluştuğunu göstermektedir.
Radyasyonla polimerleştirme sonucu elde edilen Tg değeri yaklaşık 1470C iken,
polimerin ısı ile etkileşimi sonucunda Tg yaklaşık 1740Cye çıkmaktadır. Ayrıca
çözelti özellikleri, Light Scattering , GPC ve viskozite ölçümleriyle incelenmiştir.

vii
Çözelti davranışlarının molekül ağırlığına önemli ölçüde bağımlı olduğu ve
polimerin konformasyonunun değiştiği saptanmıştır. Bunun sonucu olarak viskozite
ölçümleri molekül ağırlığına bağlı olarak düzenli değişen değerler vermemektedir.
Elde edilen düşük molekül ağırlıklı polimerlerde molekül ağırlığı ile yumaklaşma
yarıçapı ( radius of gyration), hidrodinamik yarıçapı (hydrodynamic radius) ve
viskosite arasında düzenli bir ilişki görülmemiştir. X-Işın çalışmaları, monomerin
polimerleşmenin %86 oluncaya kadar yapısını koruduğunu ancak bu dönüşümden
sonra monomer yapısının bozulduğunu göstermiştir. Kütle spektroskopik (Mass)
çalışmaları ise elde edilen polimer zincir yapısını onaylamaktadır.
Anahtar Kelimeler: Katı hal polimerleşmesi, N-Vinylkaprolaktam, radyasyonla
polimerleşme, karakterizasyon.

viii
TO THE MEMORY OF MY FATHER
ix
ACKNOWLEDGMENTS
I express my sincere appreciation to Prof. Dr. Ali Usanmaz for his guidance
throughout this study.
I would like to thank to Prof. Dr. Jale Hacaloğlu for her kindness help.
I wish to thank for the significant contributions of Leyla Molu who helped
during GPC and Light Scattering measurements. Thanks go to my friend Emir Argın
for her moral support and helps.
And my deep thanks are to my mother and my brothers for their
understanding, encouragement and patience.
x
TABLE OF CONTENTS PLAGIARISM.............................................................................................................iii ABSTRACT................................................................................................................iv ÖZ................................................................................................................................vi ACKNOWLEDGMENTS...........................................................................................ix TABLE OF CONTENTS.............................................................................................x CHAPTER
1. INTRODUCTION..............................................................................................1 1.1 Radiation Induced Solid State Polymerization.................................................1
1.2 Mechanism for Solid State Polymerization………………………………......5 1.3 Poly( N- vinylcaprolactam)…………………………………………………..8 1.4 Molecular Weight Determination ……………………………………...…..11 1.4.1 Viscosity Measurement……………………………………………….11 1.4.2 Light Scattering Measurements ……………………………………...12 1.4.3 Gel Permation Chromatography ……………………………….….…14 1.5 X-Ray Diffraction…………………………………………………………..15 1.6 Pyrolysis Mass Spectrometry………………………………………….……16 1.7 Aim of the Work……………..…………………….………………………17 2. EXPERIMENTAL…………………………………………………………....18 2.1 Chemicals……………………….…………………………………………...18 2.2 Instrumentation……………………………………………………………...18 2.3 Procedure……………………………………………………………………21

xi
3. RESULTS AND DISCUSSION……………………………………………......23 3.1 Solid State Polymerization of N-Vinylcaprolactam………………………...23 3.2 Molecular Weight Determination………………………………………...…28 3.3 Infrared Spectral Investigation………………………………………………33 3.4 Nuclear Magnetic Resonance Analysis………………………………...…...36 3.5 Diffrential Scanning Calorimetry…………………………………...………43 3.6 TGA Characterization ……………………………………………………....51 3.7 X-Ray Analysis……………………………………………………………...53 3.8 Mass Spectral Analysis……………………………………………………...65 4. CONCLUSION……………………………………………………………......73 REFERENCES…………………………………………………………………..74

xii
LIST OF TABLES TABLES Table 3.1 The % conversions versus time results for solid state polymerization of N-
vinylcaprolactam in vacuum at room temperature...............................................24 Table 3.2 The % conversions versus time results for solid state polymerization of N-
vinylcaprolactam in open atmosphere conditions................................................26 Table 3.3 Results Obtained from the GPC masurements..........................................28 Table 3.4 Results Obtained from the Light Scattering Results...................................28 Table 3.5 The 1H-NMR spectrum of monomer..........................................................36 Table 3.6 The 1H-NMR spectrum of polymer............................................................37 Table 3.7 The 13C-NMR spectrum of monomer.........................................................38 Table 3.8 The 13C-NMR spectrum of polymer...........................................................38 Table 3.9 X-Ray Analysis of monomer......................................................................56 Table 3.10 X-Ray Analysis of monomer-polymer (%1 PVCA) mixture...................58 Table 3.11 X-Ray Analysis of monomer-polymer (%10 PVCA) mixture.................60 Table 3.12 X-Ray analysis of monomer-polymer (%50 PVCA) mixture..................62 Table 3.13 The assigned fragments of monomer in mass spectrum………………...68
Table 3.14 The assigned fragments of polymer in mass spectrum at 290 °C….…....70 Table 3.12 The assigned fragments of polymer in mass spectrum at 445 °C….…....71

xiii
LIST OF FIGURES Figure 3.1 % Conversion versus time graph for solid state polymerization PVCA in vacuum at room temperature......................................................................................25 Figure 3.2 % Conversion versus time graph for solid state polymerization PVCA in vacuum at open atmosphere........................................................................................27 Figure 3.3 Guiner plot of % 50 N-vinylcaprolactam..................................................29 Figure 3.4 Dynamic Light Scattering Results of % 50 N-vinylcaprolactam..............29 Figure 3.5 Berry Plot of 81% N-vinylcaprolactam.....................................................30 Figure 3.6 Dynamic Light Scattering Results of %81 N-vinylcaprolactam...............30 Figure 3.7 Berry plot of %94 conversion to poly(n-vinylcaprolactam)......................31 Figure 3.8 Dynamic Light Scattering Results of N-vinylcaprolactam.......................31 Figure 3.9 Zimm plot of % 84 N-vinylcaprolactam...................................................32 Figure 3.10 Dynmic Light Scattering results of %84 N-vinylcaprolactam................32 Figure 3.11 IR spectrum of monomer.........................................................................34 Figure 3.12 IR spectrum of poly (N-Vinylcaprolactam)............................................35 Figure 3.13 The 1H-NMR spectrum of monomer.......................................................39 Figure 3.14 The 1H-NMR spectrum of polymer.........................................................40 Figure 3.15 The 13C-NMR spectrum of monomer......................................................41
Figure 3.16 The 13C-NMR spectrum of polymer........................................................42 Figure 3.17 DSC diagram of monomer.......................................................................44 Figure 3.18 DSC diagram of %1 conversion to poly(n-vinylcaprolactam)................45 Figure 3.19 DSC diagram of %10 conversion to poly(n-vinylcaprolactam)..............46

xiv
Figure 3.20 DSC diagram of %50 conversion to poly(n-vinylcaprolactam)..............47 Figure 3.21 DSC diagram of %94 conversion to poly(n-vinylcaprolactam)..............48 Figure 3.22 DSC diagram of %96 conversion to poly(n-vinylcaprolactam)..............49 Figure 3.23 DSC rerun diagram of %96 conversion to poly(n-vinylcaprolactam).....50 Figure 3.24 TGA spectrum of PVCA.........................................................................52 Figure 3.25 X-Ray spectrum of monomer..................................................................55 Figure 3.26 X-Ray spectrum of monomer-polymer (%1 PVCA) mixture.................57 Figure 3.27 X-Ray spectrum of monomer-polymer (%10 PVCA) mixture...............59 Figure 3.28 X-Ray spectrum of monomer-polymer (%50 PVCA) mixture...............61 Figure 3.29 X-Ray spectrum of monomer-polymer (%86 PVCA) mixture...............63 Figure 3.30 X-Ray spectrum of poly(n-vinylcaprolactam)........................................64 Figure 3.31 Mass spectrum of monomer....................................................................67 Figure 3.32 Mass spectrum of PVCA……………………………….........................69 Figure 3.33 The single ion pyrograms in selected products………….......................72
1
CHAPTER I
INTRODUCTION
1.1. Radiation Induced Solid-State Polymerization
The polymerization by radiation can be initiated either by a radical or an ion.
Although radiation produces ions and excited molecules as a primary act, most of the
polymerization reactions already studied have been found to proceed by a radical
mechanism (1).
The advantages of the radiation induced polymerization are as follows:
1. Some monomers that are difficult to polymerize by conventional methods can
be polymerized by radiation.
2. Penetrating radiation, in particular gamma radiation, ensures regular initiation
throughout the bulk of the solid monomer.
3. The polymers of high purity, containing no residues of initiators, catalysts,
etc can be obtained by radiation initiation.
4. It is possible to carry out polymerization “on site” for manufacturing polymer
as parts in the hard-to-reach places (2).
The solid state polymerization was reported for the first time by Schmitz and
Lawton in 1951(3). Adler et al. (4) found that acrylamide could be polymerized in
the solid state by radiation. It was expected that a well-oriented crystalline polymer
would be obtained after polymerization due to limited mobility of molecules in solid
matrix. However, resulting polymer was amorphous. This drew attention of scientist
to the study of the effect of crystal structure on solid state polymerization (5).In 1956
Restaino et al. published data on the gamma radiation-induced polymerization of a
wide range of solid monomers, including acrylic acid and its barium, calcium and
potassium salts which only melt at high temperatures. Lawton, Grubb and Baldwit

2
(1956) polymerized a cyclic siloxane (hexamethylcyclotrisiloxane) in the solid state
by electron irradiation. Radiation induced polymerization of acrylonitrile ( between
-83° C and -196 °C) in solid state has been carried out around melting point of the
monomer (6). The rate of polymerization of solid acrylonitrile was 30 to 40 times
faster than that in the liquid state. Polymer yield was higher for monomers
recrystallized by slow cooling. Because, slow cooling leads to the formation of large
and well oriented monomer crystallites. Polymerization of potassium acrylate in
crystalline state was reported by Morewetz and Rubin (7) at -78 C using Gamma-
Rays. Morawetz (8) showed that there is no clear correlation between solid-state
polymerization induced thermally and by radiation (9). Adler and Reams (10)
indicated that the polymerization would proceed at the interphase between monomer
and polymer of acrylamide after some polymer formed. It was supported by an
experiment in which acrylamide single crystal was divided into two parts, one part
was wrapped with aluminum foil, and other part was exposed to gamma radiation.
After some time, the sample photographed under polarized microscope. In the
photograph, the side polymerized was black, while other part was bright. Two sides
were clearly different from each other. So, Adler believed that the crystal structure of
acrylamide molecules exerted no influence on the polymerization because
polymerization proceeded at the interphase between monomer and polymer. Adler et
al.(11) explained that the reason for the formation of amorphous acrylamide polymer,
was due to the structure of monomer; the –C=C double bond (1.34 A°) opened and
the transformed to –C-C- single bonds (1.54 A°) during polymerization. However,
intermolecular distance between molecules decreased from Van der Walls distance
of about 3.75 A° to 1.54 A°, C-C single bond length. When both changes combined,
overall volume of the system was decreased about 12%. That volume reduction
created a strain in the crystal lattice. Therefore, the crystal structure broke down and
caused the polymer to be amorphous. The crystal structure effect and mechanism of
radiation induced solid state polymerization of acrylamide was well documented by
Usanmaz (12).
3
Eastmond et al.(13) found that when acrylic acid polymerization was initiated
with polarized UV radiation, the rate of polymerization in the initial stage showed
strong dependence on the angle between the plane of electric vector of radiation and
crystallographic axes, i.e. the rate of polymerization is maximum when electric
vector of radiation is parallel to a crystallographic axis. They suggested that this
feature was in accordance with other showing that absorption of radiation by vinyl
groups was ultimately responsible for radical formation. These facts indicate that the
molecular disposition has an important influence on the initial stage of
polymerization. However, in the crystal lattice , dimmers of acrylic acid are further
from each other than the possible interaction which has intermolecular vinyl C….C
distance of 3.52 A°. Therefore, all molecules have to be rearranged to be able for
combination of monomer molecules. The chain propagation is isotropic due to large
movements. The resulting polymer is atactic and amorphous. In general, vinyl
polymers can not be crystallized except a few cases, such as poly (vinylalcohol) (14),
poly (vinylchloride) (15), poly (vinylflouride) (16) . Atactic poly (vinylalcohol) is
highly crystalline, because hydrogen bonds are formed and stabilize the crystal
lattice even though the polymer chain is atactic. Fluorine atoms in poly
(vinylfluoride) are small enough to permit polymer crystallization, with short
syndiotactic-predominant sequences. In vinyl separate polymer, crystal structure is
formed from side chains in the form of layers. The distance between layers are 25.4
A°. So, polymer enchainment occurred along these layers and crystal structure of
polymer didn’t disrupt (8). This serves to yield crystalline polymer. Okamura and his
associates demonstrated that the structure of monomer lattice imposes an orientation
on polymers obtained by γ-irradiation of trioxane, β-propilactone, diketene. In the
case of polyoxymetylene obtained obtained by post polymerization irradiated large
crystals of trioxane (17) , β-propilactone (18), diketene (19). In the case of
polyoxymetylene obtained obtained by post the polymerization irradiated large
crystals of trioxane, the polymer was found to be highly ordered not only with
respect to the orientation of the fiber axis, but also in the manner in which the
polymer chains packed, so that the material resembled in a large single crystal.
4
A typical example of lattice control polymerization can be seen in four center
type of polymerization of 2, 5-distyrlpyrazine studied by Hasegawa and Suzuki (20).
Distyrlpyrazine has two crystalline modifications; plate like crystals which are
orthorhombic and needle like crystals which are monoclinic. Plate-like crystals
undergo prompt photopolymerization in the crystalline state under influence of UV
light or sunlight into high molecular weight crystalline polymer. However, needle
like crystals do not undergo any change with irradiation. Van der Waals distance of
plate like crystals is lower than 4 A°. So polymerization takes place with slight
rotations and translations. Therefore crystal structure of monomer is protected. This
type of polymerization is topotactic.
Usanmaz and Melad (21) polymerized 3-aminocrotonamide by radiation in
solid state. Polymerization occurred by a condensation process with evolution of
(2n-1)NH3 molecules for each 2n monomer molecules. The polymer formed was
similar in crystal structure to that of monomer. Thus, it gives a topotactic
polymerization by condensation. Structure and properties of polurethane and acrylate
prepolymer films, obtained by electron beam (EB) and UV, in solid state
polymerization examined to reveal the characteristic of these radiation
polymerizations (22). Although polyurethane and acrylate films from EB and UV
solid state polymerizations mainly consisted of amorphous and crystalline phases, it
was proved that the film obtained by 10 Mrad of EB radiations at 25˚C had higher
crystallinity and larger crystallite size than film from UV irradiation. This is assumed
to be due to the reason that EB irradiation below melting point of polyurethane-
acrylate can lead to crosslinking without the destruction of original crystal structure.
On the other hand, the UV polymerization proceeded around melting point of
crystalline structure by absorbing electromagnetic radiation other than the UV
absorbed by a photoinitiator.
The mechanism of polymerization is greatly influenced by monomer crystal
geometry in the solid state. The change in the crystal structure most probably orients
the molecules in more favorable arrangements for polymerization of allythiourea
5
(23). Leading to a higher maximum conversion. When IR spectrum of partially
polymerized monomer was investigated, it was seen that, although monomer peaks
were partially covered by broad amorphous polymer peak, the monomer molecules
still retained their crystalline structure at 46% conversion. The changes in relative
intensities of monomer peaks during polymerization were most probably due to
distortion of crystal morphology. The polymer was amorphous and isotropic; it
always looked dark between crossed polarizer, where the monomer was anisotropic
and looked bright except at extinction positions in polarizing microscope. The results
proved that polymerization did not proceed by a two phase mechanism like the
monomer-polymer interphase polymerization. The effect of oxygen on the
polymerization of allylthiourea was investigated by Usanmaz and Yılmaz (23). The
accelerating effect of oxygen was clear at conversions above 40%. This suggests that
the crystal structure becomes distorted with the formation of polymer to allow easier
diffusion of oxygen.
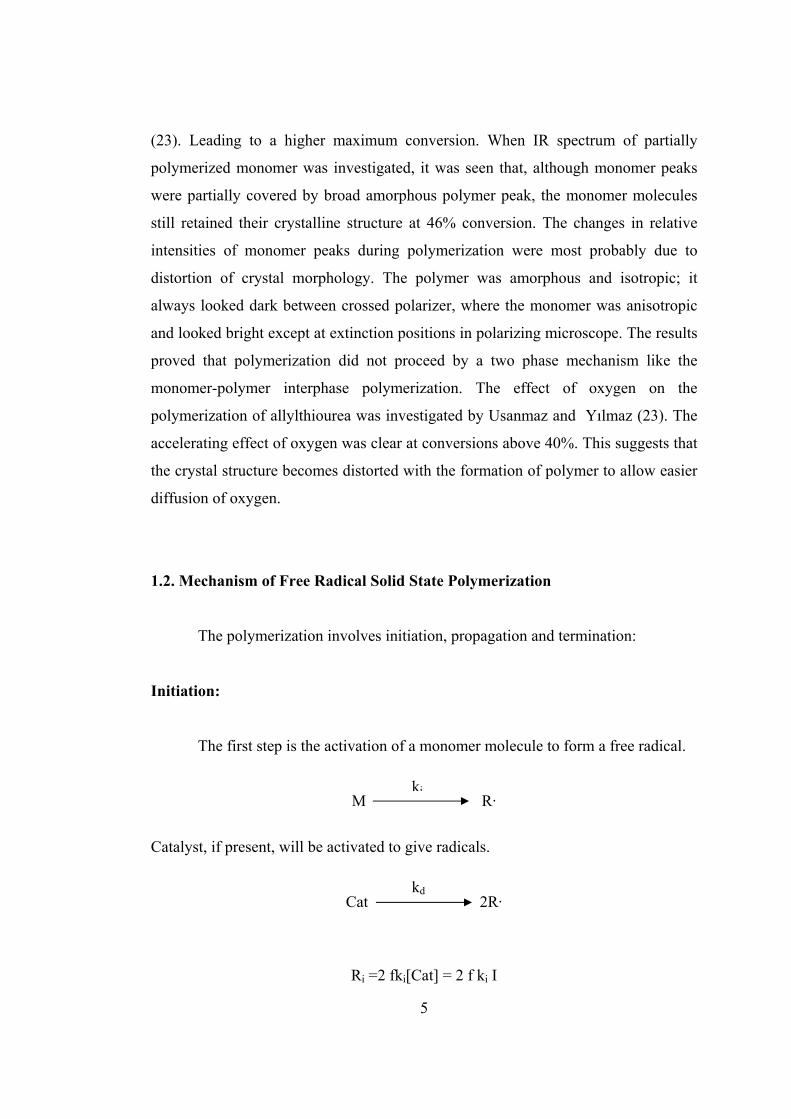
1.2. Mechanism of Free Radical Solid State Polymerization
The polymerization involves initiation, propagation and termination:
Initiation:
The first step is the activation of a monomer molecule to form a free radical.
M R·
Catalyst, if present, will be activated to give radicals.
Cat 2R·
Ri =2 fki[Cat] = 2 f ki I
ki
kd
6
Where f is the efficiency factor and ki is the initiation rate constant.
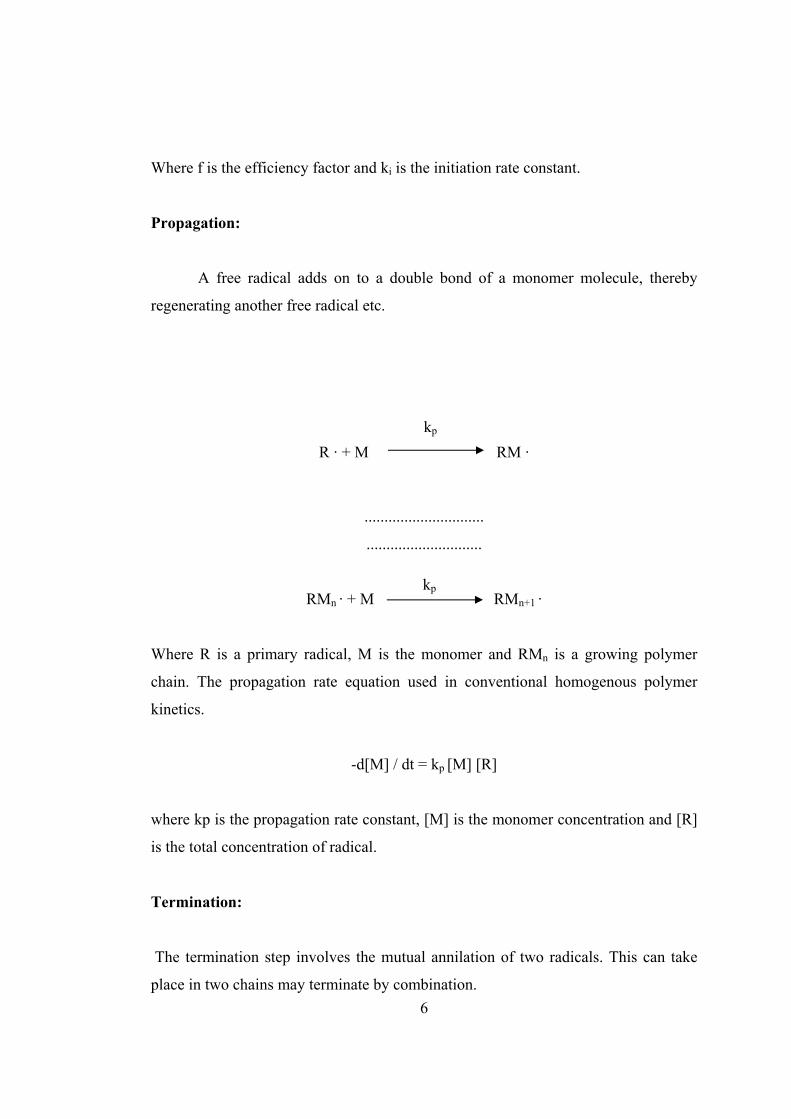
Propagation:
A free radical adds on to a double bond of a monomer molecule, thereby
regenerating another free radical etc.
R · + M RM ·
..............................
.............................
RMn · + M RMn+1 ·
Where R is a primary radical, M is the monomer and RMn is a growing polymer
chain. The propagation rate equation used in conventional homogenous polymer
kinetics.
-d[M] / dt = kp [M] [R]
where kp is the propagation rate constant, [M] is the monomer concentration and [R]
is the total concentration of radical.
Termination:
The termination step involves the mutual annilation of two radicals. This can take
place in two chains may terminate by combination.
kp
kp
7
RMn · + RMm · Pn+m
Or they may undergo disproportionation with the transfer of a hydrogen atom and the
formation of an unsaturated end group.
RMn + RMm Pn-CH2-CH3 + Pm-CH=CH2
The rate equation will be:
Rt = (ktc + ktd ) [ R ]2 = kt [R]2
Usually a steady state concentration of [R] is assumed at low conversions where the
rate of initiation and termination are equal:
Ri = Rt
2 f ki I = kt [R]2 where kt = ktc + ktd
The radical concentration will be:
[R] = (2fkiI / kt )1/2
Then the propagation rate is:
-d[M]/dt =kp[M]( 2 f ki I / kt)1/2
Thus, the integrated rate equation will be:
log([Mo]/[M])=kp.(ki.f.I/kt)1/2 t/4.606 = k I1/2 t
where I is a constant for any one series of experiments and Mo is initial
concentration of the monomer. Then a plot of log [Mo/M] versus t should give a
straight line with the slope of k
ktc
ktd
8
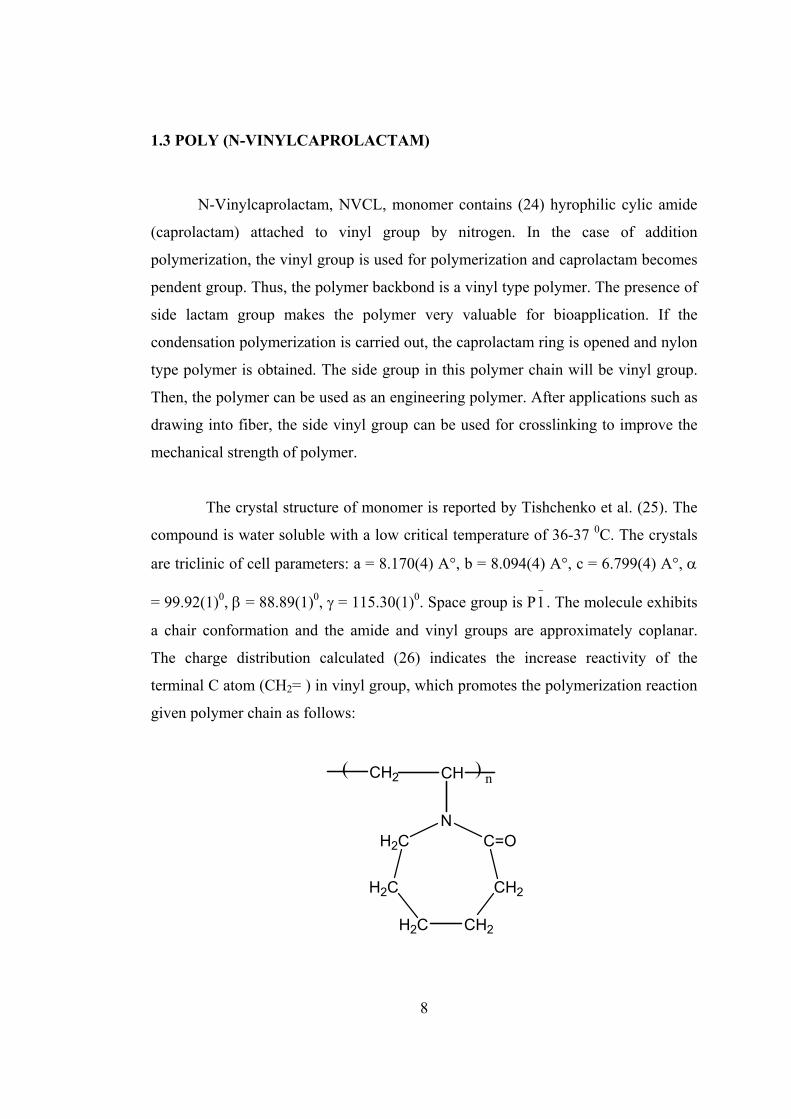
1.3 POLY (N-VINYLCAPROLACTAM)
N-Vinylcaprolactam, NVCL, monomer contains (24) hyrophilic cylic amide
(caprolactam) attached to vinyl group by nitrogen. In the case of addition
polymerization, the vinyl group is used for polymerization and caprolactam becomes
pendent group. Thus, the polymer backbond is a vinyl type polymer. The presence of
side lactam group makes the polymer very valuable for bioapplication. If the
condensation polymerization is carried out, the caprolactam ring is opened and nylon
type polymer is obtained. The side group in this polymer chain will be vinyl group.
Then, the polymer can be used as an engineering polymer. After applications such as
drawing into fiber, the side vinyl group can be used for crosslinking to improve the
mechanical strength of polymer.
The crystal structure of monomer is reported by Tishchenko et al. (25). The
compound is water soluble with a low critical temperature of 36-37 0C. The crystals
are triclinic of cell parameters: a = 8.170(4) A°, b = 8.094(4) A°, c = 6.799(4) A°, α
= 99.92(1)0, β = 88.89(1)0, γ = 115.30(1)0. Space group is P−
1. The molecule exhibits
a chair conformation and the amide and vinyl groups are approximately coplanar.
The charge distribution calculated (26) indicates the increase reactivity of the
terminal C atom (CH2= ) in vinyl group, which promotes the polymerization reaction
given polymer chain as follows:
H2C
H2C
H2C CH2
CH2
C=ON
CHCH2( ) n
9
The kinetic of N-vinylcaprolactam polymerization has not been reported in
literature. However, due to the interesting and unique solution properties, the
solution properties have been studied intensively. In polymer chain (PVCL), nitrogen
is directly attached to the hydrophobic carbon-carbon backbone chain (27).
Therefore, the hydrolysis of PVCL does not produce low molecular weight amines
(28). The appropriate balance of hydrophobicity and hydrophilicity in the polymer
chain is responsible for unusual properties of polymer. Cheng et al. (29) reported the
polymerization of NVCL by radiation in water. The effects of radiation dose and
total dose on the viscosity of polymer obtained and low critical solution temperature
were studied. They showed that the polymer obtained with radiation of 2-14 Gy/min
and total radiation a little larger then 2 kGy has good temperature sensitivity and
uniformity. Lozinsky et al (30) reported the polymerization of NVCL by emulsion
polymerization using water as solvent and ammonium persulphate/ tertiary amine
redox initiator. They have studied the molecular weight and molecular weight
distribution, their temperature-dependent solution behaviors and the thermodynamic
parameters of phase segregation process of polymer using SEC, DSC. Gao et al
(31) reported narrowly distributed spherical poly(N-vinylcaprolactam) (PVCL)
microgels prepared by precipitation polymerization in water using potassium
persulpate/ tertiary amine redox initiator. The effect of both anionic (sodium dodecyl
sulfate, SDS) and cationic (N-dodecylpyridinium bromide, DPB) surfactants on the
swelling and shrinking of the microgels were investigated by laser light scattering
(LLS). They showed that the microgels gradually shrank to the collapsed state when
the temperature increased from 20 to approx. 38°C. The addition of anionic
surfactant caused an extra swelling of the microgels and shifted the collapsing
temperature higher, whereas the addition of cationic surfactant has different effects
on the swelling and shrinking of the microgels prepared by using different initiators,
depending on whether the decomposed fragments of the initiator are ionic or neutral.
PVCL is one of the several nonionic synthetic polymer soluble in water and
exhibit thermosensitive properties in an aqueous solution (32), Peng (33), Ivanov
(34), Lozinsky (30). The relation of temperature-solubility of PVCL was first
10
reported in 1968 (35). When the aqueous solutions are heated, phase separations are
observed in the range of 32-38 °C (36); a low temperature transition (lower critical
solution temperature, LCST) at 32°C is attributed to a micro segregation of
hydrophobic domains and a higher temperature transition around 38°C,
corresponding to the gel volume collapse itself. Therefore, this polymer is considered
to be suitable materials for novel biotechnological applications such as in drug
delivery, bioseparation, diagnostics, etc. (29).
The radiation graft polymerization of N-vinylcaprolactam onto polypropylene
films was studied by Kudryavtsev et al. (37). The radiation graft polymerization was
performed with preirradiation in air (peroxide method) or using a direct method in
aqueous solutions and organic solvents. The effects of radiation dose, reaction time,
monomer concentration, and homopolymerization inhibitor on the radiation graft
polymerization were studied. They showed by DSC and equilibrium swelling in
water that the modified polymers of polypropylene with grafted poly( N-
vinylcaprolactam) chains exhibited thermoresponsive properties.
Kirsh and Yanul (26) studied structural transformations and water associate
interactions in poly-N-vinylcaprolactam-water system. They showed that (i) the
conformation type of a side seven-member ring deduced by quantum-chemical
calculations is the chair; (ii) the main chain of PVCL prepared by usual radical
polymerization has syndiotactic structure; (iii) the calculation of charge distribution
on a C=O oxygen atom in the analogue of PVCL chain link gives the large electron
density value being -0.362, (iv) the addition of water to PVCL changes Tg from
147˚C (dry polymer) to -17˚/ -38˚C at N (number of water molecules per unit) being
2.6/8.0.
Dynamic light scattering measurements have been performed for aqueous
solutions of thermosensitive linear poly(N-vinylcaprolactam) (PVCL)
macromolecules in the presence of NaCl and different water soluble amphiphilic
organic compounds: pyrogallol (neutral amphiphilic compound), cetylpyridinium
11
chloride (cationic surfactant) and sodium dodecylsulfate (anionic surfactant) (31)
(38). A decrease in the macromolecular hydrodynamic diameter is observed upon
addition of ionic surfactants (SDS, CPC) at low surfactant concentrations. (39)
Lebedev et al. (40) reported the results obtained by SANS and NSE around the coil-
globule transition (tc=32˚C) temperature. The increase of temperature causes the
collapse of coils.
1.4. MOLECULAR WEIGHT DETERMINATION
The molecular weight of polymers were measured by viscosity, light scattering
and GPC methods.
1.4.1. Viscosity Measurement
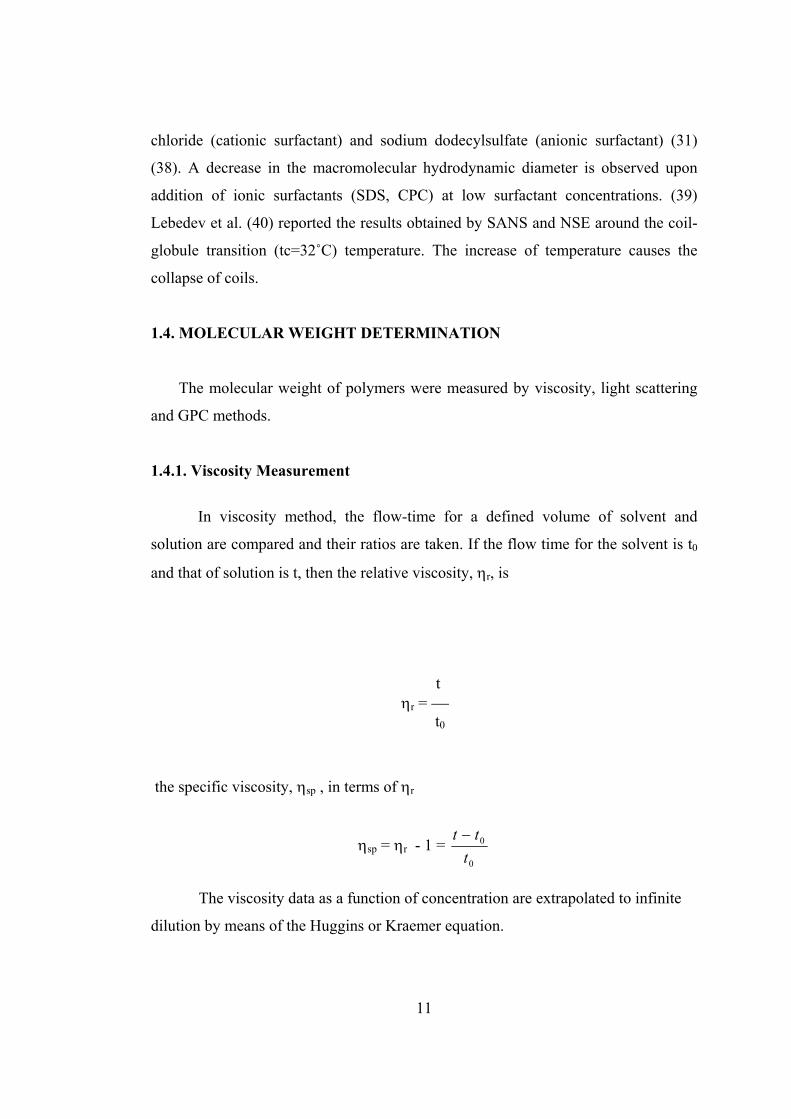
In viscosity method, the flow-time for a defined volume of solvent and
solution are compared and their ratios are taken. If the flow time for the solvent is t0
and that of solution is t, then the relative viscosity, ηr, is
t ηr = t0
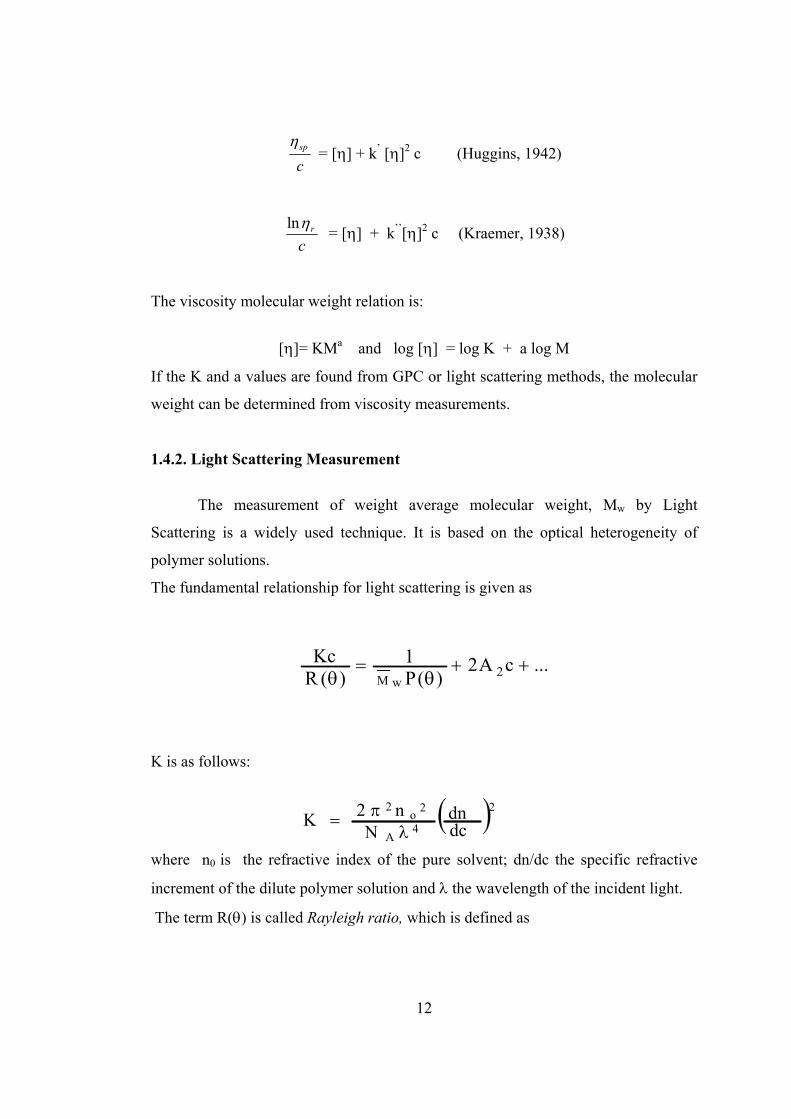
the specific viscosity, ηsp , in terms of ηr
ηsp = ηr - 1 = 0
0
ttt −
The viscosity data as a function of concentration are extrapolated to infinite
dilution by means of the Huggins or Kraemer equation.
12
cspη
= [η] + k’ [η]2 c (Huggins, 1942)
crηln = [η] + k’’[η]2 c (Kraemer, 1938)
The viscosity molecular weight relation is:
[η]= KMa and log [η] = log K + a log M
If the K and a values are found from GPC or light scattering methods, the molecular
weight can be determined from viscosity measurements.
1.4.2. Light Scattering Measurement
The measurement of weight average molecular weight, Mw by Light
Scattering is a widely used technique. It is based on the optical heterogeneity of
polymer solutions.
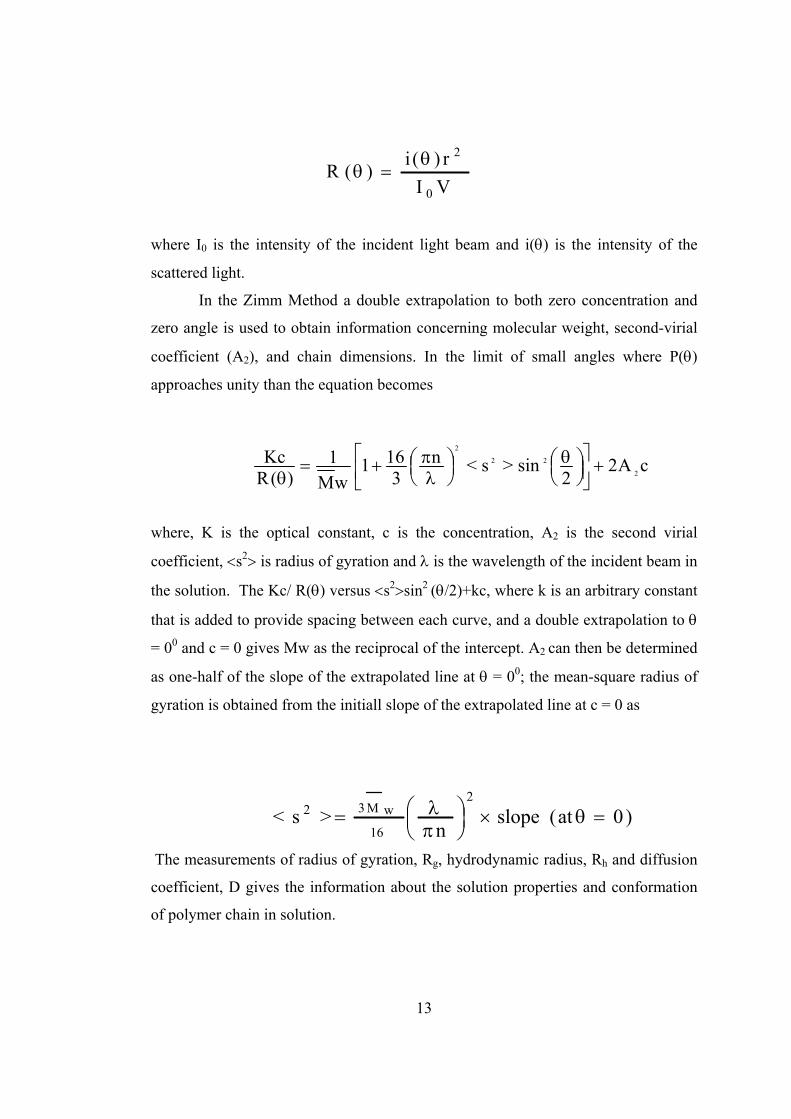
The fundamental relationship for light scattering is given as
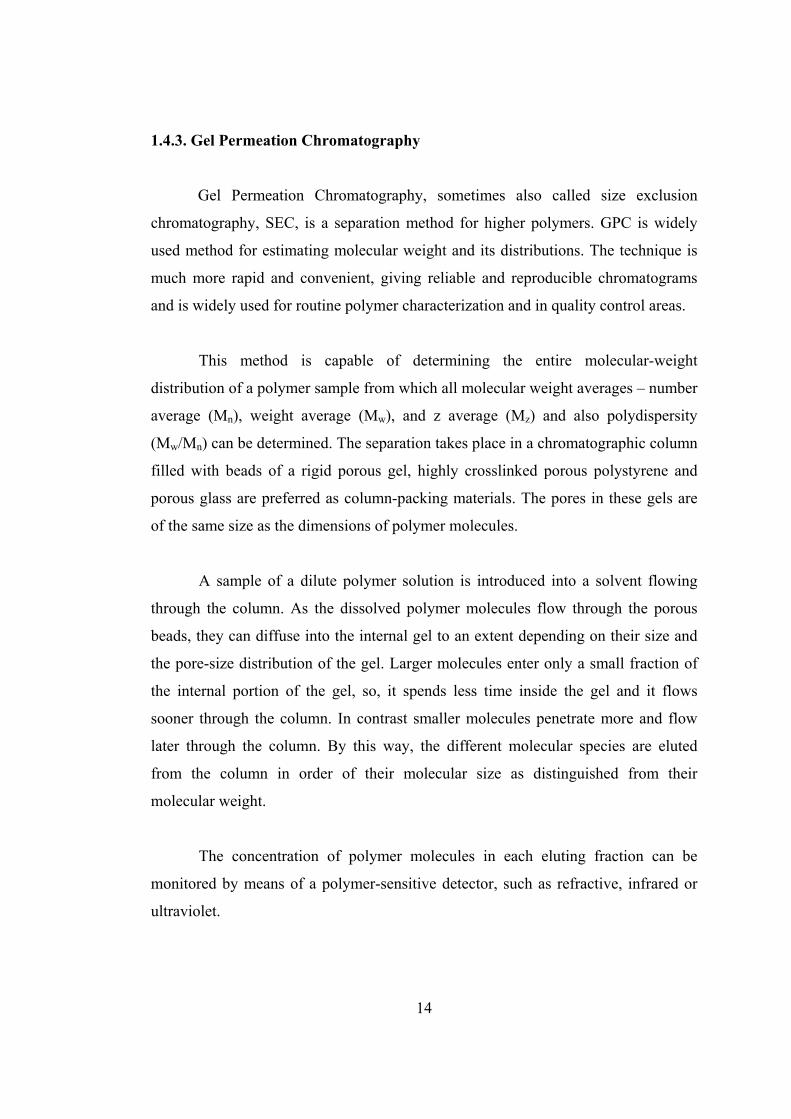
K is as follows:
where n0 is the refractive index of the pure solvent; dn/dc the specific refractive
increment of the dilute polymer solution and λ the wavelength of the incident light.
The term R(θ) is called Rayleigh ratio, which is defined as
...cA2)(P
1)(R
Kc2
wM++
θ=
θ
( )24A
2o2
dcdn
Nn2Kλ
π=
13
where I0 is the intensity of the incident light beam and i(θ) is the intensity of the
scattered light.
In the Zimm Method a double extrapolation to both zero concentration and
zero angle is used to obtain information concerning molecular weight, second-virial
coefficient (A2), and chain dimensions. In the limit of small angles where P(θ)
approaches unity than the equation becomes
where, K is the optical constant, c is the concentration, A2 is the second virial
coefficient, <s2> is radius of gyration and λ is the wavelength of the incident beam in
the solution. The Kc/ R(θ) versus <s2>sin2 (θ/2)+kc, where k is an arbitrary constant
that is added to provide spacing between each curve, and a double extrapolation to θ
= 00 and c = 0 gives Mw as the reciprocal of the intercept. A2 can then be determined
as one-half of the slope of the extrapolated line at θ = 00; the mean-square radius of
gyration is obtained from the initiall slope of the extrapolated line at c = 0 as
The measurements of radius of gyration, Rg, hydrodynamic radius, Rh and diffusion
coefficient, D gives the information about the solution properties and conformation
of polymer chain in solution.
cA22
sinsn3
161wM
1)(R
Kc2
22
2
+
θ
λπ+=
θ><
)0at(slopen
s2
16
wM32 =θ×
πλ=><
VIr)(i
)(R0
2θ=θ
14
1.4.3. Gel Permeation Chromatography
Gel Permeation Chromatography, sometimes also called size exclusion
chromatography, SEC, is a separation method for higher polymers. GPC is widely
used method for estimating molecular weight and its distributions. The technique is
much more rapid and convenient, giving reliable and reproducible chromatograms
and is widely used for routine polymer characterization and in quality control areas.
This method is capable of determining the entire molecular-weight
distribution of a polymer sample from which all molecular weight averages – number
average (Mn), weight average (Mw), and z average (Mz) and also polydispersity
(Mw/Mn) can be determined. The separation takes place in a chromatographic column
filled with beads of a rigid porous gel, highly crosslinked porous polystyrene and
porous glass are preferred as column-packing materials. The pores in these gels are
of the same size as the dimensions of polymer molecules.
A sample of a dilute polymer solution is introduced into a solvent flowing
through the column. As the dissolved polymer molecules flow through the porous
beads, they can diffuse into the internal gel to an extent depending on their size and
the pore-size distribution of the gel. Larger molecules enter only a small fraction of
the internal portion of the gel, so, it spends less time inside the gel and it flows
sooner through the column. In contrast smaller molecules penetrate more and flow
later through the column. By this way, the different molecular species are eluted
from the column in order of their molecular size as distinguished from their
molecular weight.
The concentration of polymer molecules in each eluting fraction can be
monitored by means of a polymer-sensitive detector, such as refractive, infrared or
ultraviolet.
15
The universal calibration curve is based on the proportionality of the product
[η]M to the hydrodynamic volume of a polymer molecule in solution. In calculation
of molecular-weight averages, the signal strength (peak height) is proportional to Wi
and if a proper calibration curve is available to relate Vi to the molecular weight (Mi)
of the calibration standard, the direct calculation of all molecular weights and
polydispersities can be available.
1.5. X-Ray
Information of polymer obtained from X-ray diffraction photograph as
follows:
- Identification of polymers
- Determination of the identify period
- Lateral ordering of polymeric chains
- Orientation of crystallites
- Crystalline size
- Crystalline content
- Unit cell data
- Determination of the point group
- Atomic positions within the unit cell
In order to index the powder x-ray pattern of a sample crystallized in triclinic unit
cell, the following equation is used.
d*2 = a*2h2 + b*2k2 + c*2l2 + 2hka*b*hk cosγ* + 2hla*c*cosβ* + 2klb*c*cosα*
where hkl are Miller indices, a*, b*, c* are reciprocal cell edges and α*, β*, γ*
reciprocal cell angles. If cell parameters are known the theoretical d*2 are calculated
for different hkl combination and compared to the experimentally calculated values:
d*2 = (2sinθ/λ )2
where λ is x-ray wavelength and θ is Bragg reflection angle. In this study , the
powder pattern of monomer and monomer- polymer mixtures after the radiation were

16
recorded to observed the changes in crystal structure of monomer during
polymerization. The indexing of diffraction of data were done by using the reported
cell parameter data given in literature (41).
1.6. Pyrolysis Mass Spectrometry
Pyrolysis is the thermal degradation of complex material in an inert
atmosphere or vacuum. It causes molecules to cleave at their weakest points to
produce smaller, volatile fragments called pyrolysate (42). Pyrolysis-mass
spectrometry (Py-MS) is a very fast and sensitive fingerprinting technique. Using
this method, the sample is placed in high vacuum and heated under controlled
conditions. The organic material undergoes rapid decomposition and the low
molecular weight products enter into a mass spectrometric device, where the
pyrolysate is quantified (43). Since pyrolysis mass spectrometry techniques are
carried out under high vacuum conditions, the possibility of secondary reactions is
minimized (44). Pyrolysis mass spectrometry techniques can be used to determine
not only the thermal behavior and decomposition products but also to investigate the
structure of the polymers (45).
Among the various pyrolysis mass spectrometry techniques direct pyrolysis
mass spectrometry technique allows the thermal decomposition products of the
polymer sample to be observed directly in the ion source of the mass spectrometer,
so that the evolving products are ionized and continuously detected by repetitive
mass scans almost simultaneously with their formation. Since pyrolysis is
accomplished under high vacuum, the thermal degradation fragments are removed
from the hot zone, thus molecular collisions have low probability the generation of
secondary reactions is reduced (46). It is a simple and quick method for structural
and thermal characterization of polymers .
17
1.7. Aim of the Work
In this work N-vinylcaprolactam will be polymerized in solid state by
radiation. The polymerization will be carried out in vacuum and open to atmosphere
conditions to observe the effect of oxygen on polymerization mechanism. The kinetic
of polymerization will be investigated. Polymer obtained will be characterized by
spectroscopic, thermal methods and X-Ray diffraction. Molecular weight
determination by Light scattering, GPC and viscosity methods will give information
about the solution properties of polymer. The molecular structure of polymer will be
investigated by FT-IR, NMR and Mass spectroscopy. The thermal properties of
monomer and polymer will be studied using the DSC. The crystal structure effect on
solid state polymerization of N-vinylcaprolactam will be investigated by XRD
method.

18
CHAPTER II
EXPERIMENTAL
2.1 CHEMICALS
N-Vinylcaprolactam: It was obtained from Aldrich. It was purified by
recrystallization in hexan.
Diethylether: Technical grade diethylether obtained from Riedel de-Haen.
Benzen: It was product of Baker Analyzed.
Deionised water was used in experiments.
2.2 INSTRUMENTATION
2.2.1 Polymerization Tubes
The tubes were 11 mm in diameter and 10 cm in length Pyrex tubes.
2.2.2 High Vacuum System
High vacuum system was used to evacuate the irradiation tubes in which the
solid monomer was present, down to10-4 -10-5 mmHg pressures.It was composed of
the following parts.
19
a) Duo-Seal Vacuum Pump
It is a product of “Sargent-Welch Scientific Co.” Model 1399 and capable of
pressure reduction down to 1.5x10⁻² mmHg
b) Mercury Diffusion Pump
It is a water-cooled one-stage diffusion pump with an approximate capacity of
200 ml of mercury. Mercury was heated by a 143 W metallic bond resistive heater
operating at 130 V, which is a product of "Pliz Co." Type 62.
c) Main Manifold
It was made up of a pyrex glass tube with diameter of 4.53 cm. and length of
110 cm. carriying one outlet tube with high vacuum stockcock for the connection of
irradiation tube.
d) Liquid Nitrogen Traps
Irradiation tube was connected a trap through a high vacuum stopcock. To
protect the pumbs from the chemicals evaporated at low pressures, two pyrex traps
were used. One of the traps was connected between the mercury diffusion pump and
the other was connected between the main and mercury diffusion pump.
2.2.3 Radiation Source
For the irradiation of sample by gama rays Gamma cell 220 (Atomic Energy
of Canada Ltd. Co.) The dose rate of the radiation source was about 13 krad/h.
20
2.2.3 Viscometer
Schott Gerate AVS 400 model automatic viscometer equipped with Schott
CT 1150 model thermostat was used to determine the viscosity of the polymers.
2.2.4 Infrared Spectrometer
Infrared Spectra of monomer and polymers obtained from KBr pellets by
using Perkin Elmer Spectrum-One FT-IR Spectrometer.
2.2.5 Differrential Scanning Calorimetry
The thermal analyses of the samples were recorded by TA-DSC 910 S
differential scanning calorimeter. Heating rate was 10˚C/min. From -50˚C to 300˚C
under nitrogen gas atmosphere.
2.2.6 Thermogravimetric Anaysis (TGA)
Thermal stability of PVCL was characterized by Dupont 951
Thermogravimetric Analyzer. Thermograms were recorded under N2 atmosphere in a
temperature range of 30˚C to 900˚C with 5˚C/min heating rate.
2.2.7 Nuclear Magnetic Resonance
The molecular structure of PVCL was determined by using Magnetic
Resonance Spectrometer, Ultrashield 400 MHz Digital NMR Bruker, with ¹H and
¹³C Spectrometers.

21
2.2.8 Light Scattering
Molecular weight determination of poly(vinylcaprolactam) was found by
light scattering method. The plots were obtained by using the Malvern CGS-3
System .
2.2.9 Gel Permation Chromatography
Molecular weight distributions were measured by size exclusion
chromatography (SEC) on a PL-GPC 220 integrated GPC system.
2.2.10 X-Ray Powder Diffractometer
X-Ray powder diffraction patterns (XRD) were taken by using Rigaku
Miniflex with Cu (Kα 30 kV, 15 mA, λ=1,54178 Ao) radiation.
2.2.11 Mass Spectrometer
Direct insertion probe pyrolysis mass spectrometry (DIP-MS) system consists
of a 5973 HP quadrupole mass spectrometer coupled to a JHP SIS direct insertion
probe. This system provides fast scanning, self-tuning of experimental parameters
and wide mass range. Mass spectra of the products was recorded at a scan rate of 2
scan/s in the mass range of 10-800 amu.
2.3 Procedure
2.3.1 Radiation Induced Solid State Polymerization of N-Vinylcaprolactam
The solid state polymerization of N-vinylcaprolactam initiated by Co-60 γ
rays was carried out under vacuum and in atmospheric air at room temperature.

22
About 3-5 g of monomer sample was put into the irradiation tube made up of pyrex
glass and connected to the high vacuum system, evacuated at 10-4-10-5 torr for about
4-5 hours with several times degassing. At the end of the evacuation; the tube was
sealed and they were irradiated by γ rays for desired period of time at room
temperature. For the polymerization in open air, similar amount of samples were
placed in the tubes and put into irradiation source without evacuation.
After the irradiation, the tubes were break open, the irradiated samples were
dissolved in a small amount of benzen and the polymer precipated in diethylether.
The polymer was filtered and dried to constant weight. The percent conversion of the
monomer to the polymer was calculated gravimetrically.

23
CHAPTER III
RESULT AND DISCUSSION
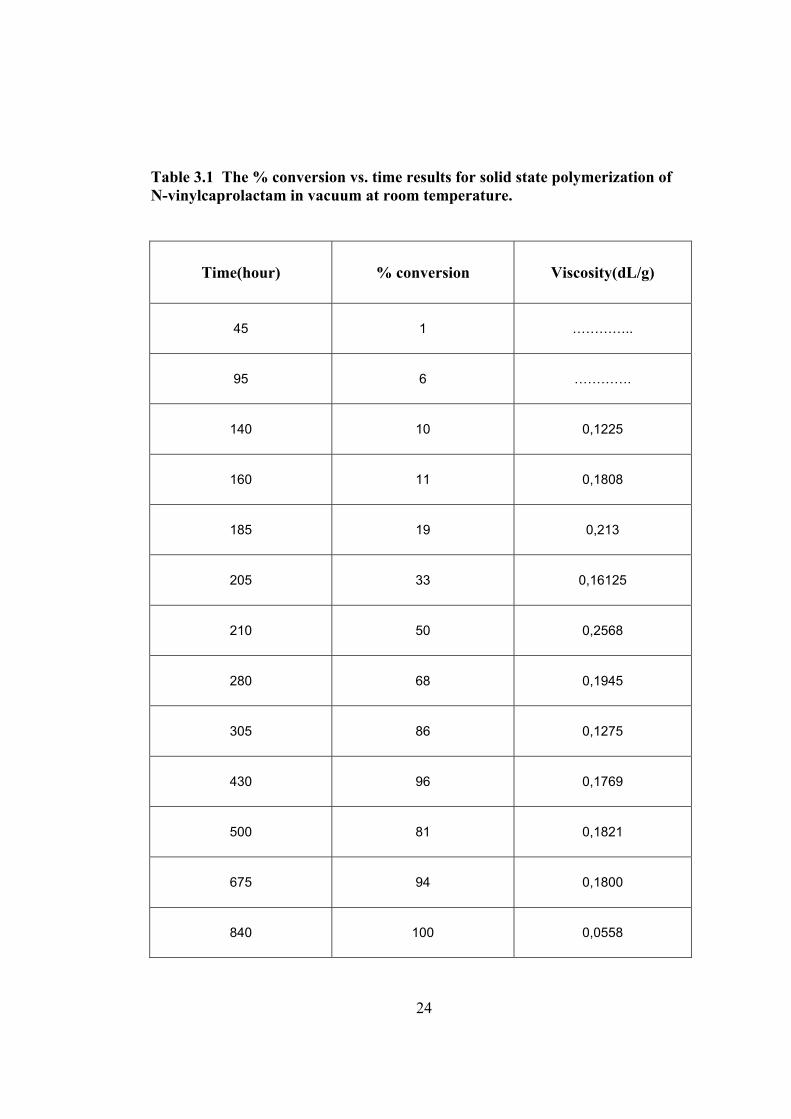
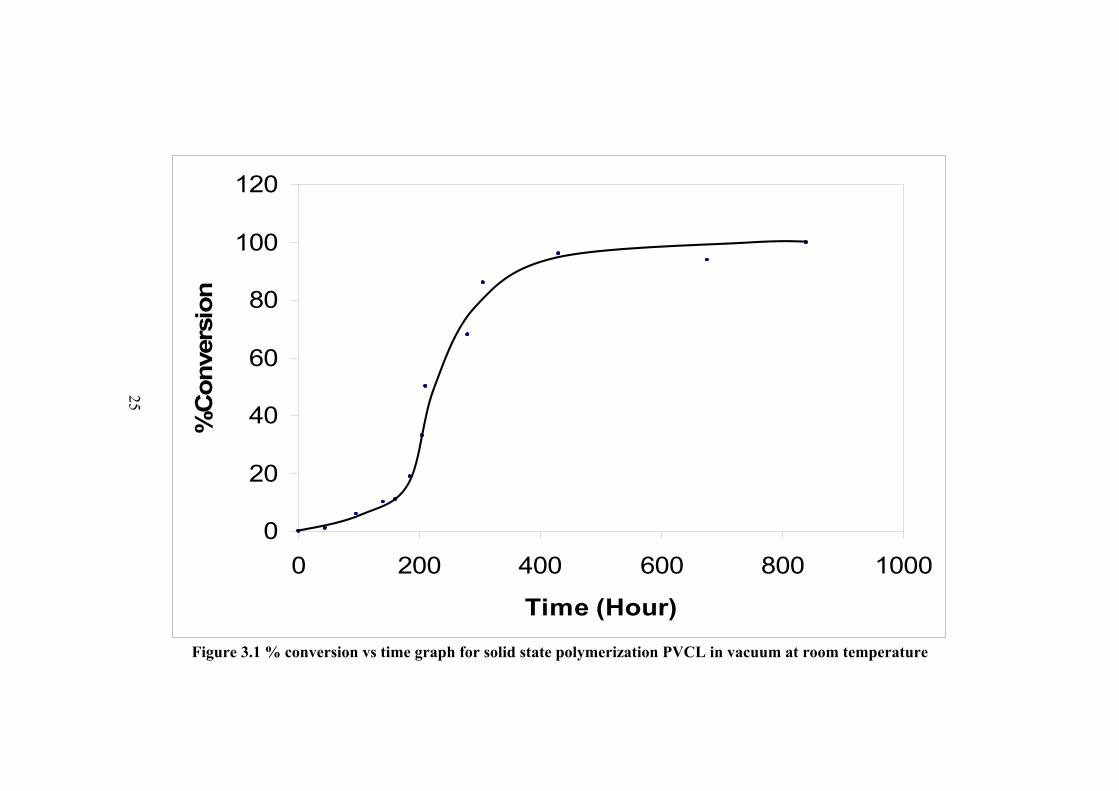
3.1 SOLID STATE POLYMERIZATION OF N-VINYLCAPROLACTAM The radiation induced solid state polymerization of N-vinylcaprolactam gave
gel type white polymer soluble in water and common organic solvents. The polymer
is very hygroscopic and absorb water in air. The percent polymerization values
agains time for the polymerizatiom under vacuum at room temperature, is plotted in
Figure 3.1 and the results tabulated in Table 3.1. The polymerization curve showed a
S-type behaviour. The initial rate is almost linear up to 10-12 %, then increases to
high rate showing an auto accelaritation mechanism. The polymerization limited at
100% conversion. The percent conversion against time plot for polymerization in
open atmosphere and at room temperature is shown in Figure 3.2 and the results are
tabulated in Table 3.2. The initial rate of polymerization is much higher for
polymerization in open atmosphere conditions compared to polymerization under
vacuum. When the viscosity for different polymerization conditions are compared, it
was observed that the moleculer weights of polymer are much lower for the
polymerization in open atmosphere conditions. Therefore, the polymer obtained in
open atmosphere conditions were soluble in ether also. The seperation of polymer
from monomer was very difficult. The percent polymer could not be safely obtained
for lower conversions in open atmosphere polymerization. However, the auto
accelaration behaviour is not observed and the limiting conversion is about 90% in
open atmosphere polymerization.The initial rate is linear up to about 70%
conversion. Around the limiting coversion the data scattering is also higher in this
case. This is again due to the termination of polymer chains in the presence of
oxygen. The low molecular weight (tellomers and oligomers) polymers can not be
seperated by precipitation method.
24
Table 3.1 The % conversion vs. time results for solid state polymerization of N-vinylcaprolactam in vacuum at room temperature.
Time(hour) % conversion Viscosity(dL/g)
45 1 …………..
95 6 ………….
140 10 0,1225
160 11 0,1808
185 19 0,213
205 33 0,16125
210 50 0,2568
280 68 0,1945
305 86 0,1275
430 96 0,1769
500 81 0,1821
675 94 0,1800
840 100 0,0558
25
0
20
40
60
80
100
120
0 200 400 600 800 1000
Time (Hour)
%C
onve
rsio
n
Figure 3.1 % conversion vs time graph for solid state polymerization PVCL in vacuum at room temperature
25

26
Table 3.2 Percent conversion vs. time results for the solid state polymerization of PVCL at open atmosphere
Time(hour) % conversion Viscosity(dL/g)
170 35 0,2451
336 53 ......
460 70 ......
600 83 .....
670 87 .....
890 84 0,093
1000 94 0,093
1080 88 0,0845
1200 84 0,0745
1220 90 0,0778
1350 91 ......
1440 88 ......

27
0102030405060708090
100
0 500 1000 1500 2000Time (Hour)
%C
onve
rsio
n
Figure 3.2 % conversion vs. time graph for solid state polymerization of PVCL at open atmosphere
27

28
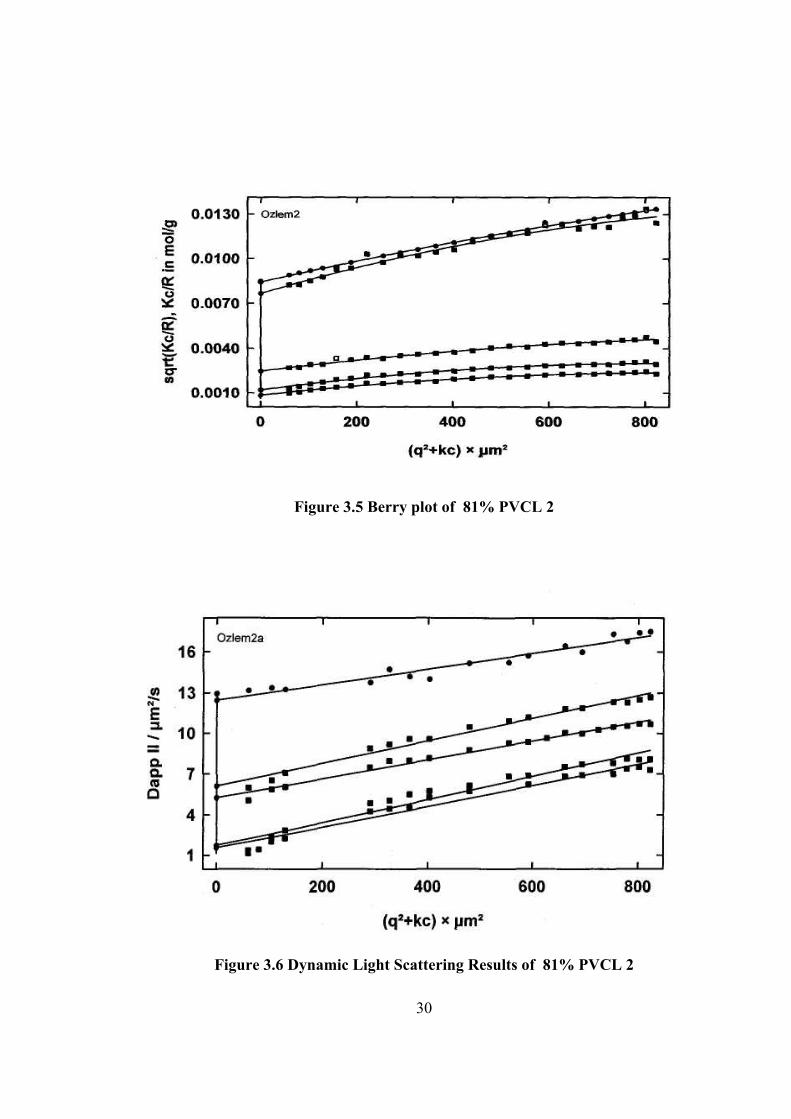
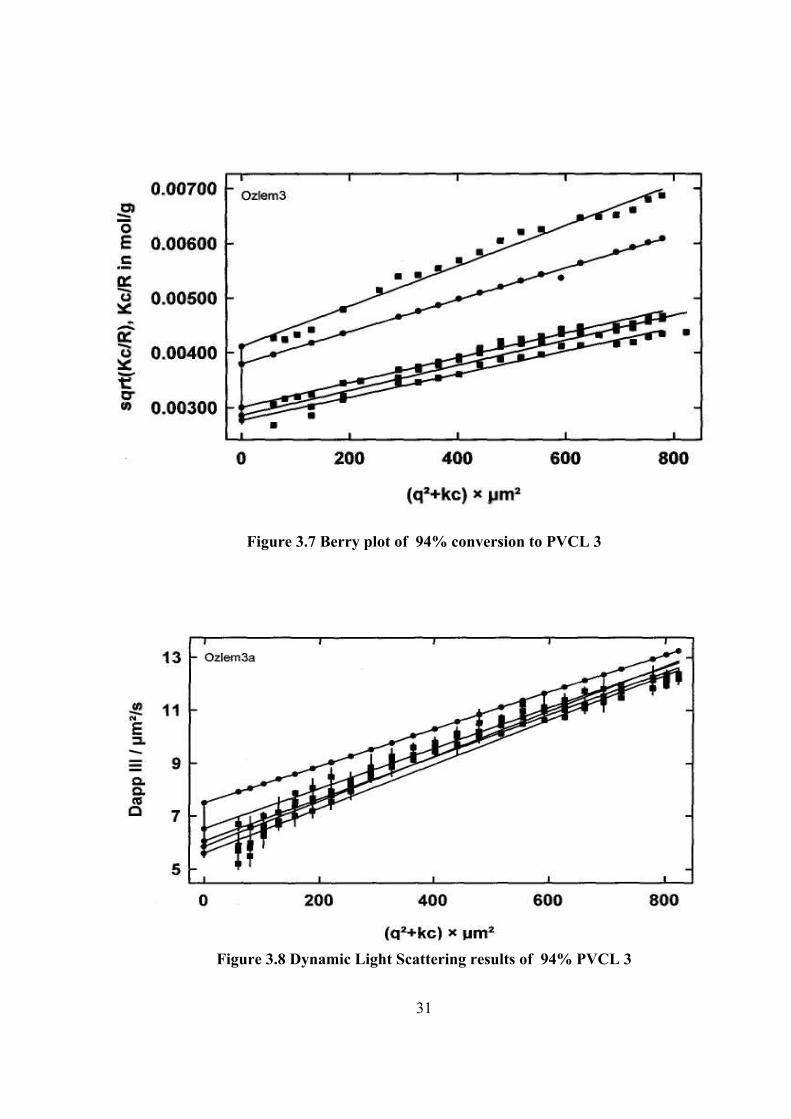
3.2 MOLECULAR WEIGHT DETERMINATION
The molecular weight determination of polymer was carried out by viscosity,
GPC and Light scattering methods. The results for the GPC are tabulated in Table
3.3 .The molecular weight distributions of four samples studied are in the range of
13000-116000. The dispersity index of polymers with molecular weight around
70000 is very close to 1. However the dispersity index for lower molecular weight is
very high (about 75) This is related to the conformation of polymer chain. In order to
understand it better, the hydrodynamic parameters of the same sample were
determined by light scattering methods. The light scattering plotting are given in
Figure 3.3 –8. The results are tabulated in Table 3.4. The hydrodynamic radius, Rh
and radius of gyration, Rg are expected to increase with molecular weight. In this
work there is no systematic change of Rg and Rh with molecular weight. This is due
to the different conformational behavior of polymer chains in the solution. The
viscosity measurement were also not compatible with obtain molecular weights. The
molecular weights of sample by GPC and light scattering are not much different from
each other. Therefore, it is mostly conformational differences rather than
experimental error in the simple relation of viscosity molecular weight. In this case,
the K and α values could not be computed because log(viscosity) versus
log(molecular weight) did not give a straight line. The intrinsic viscosity measured
are also given in the Table 3.1-2 for the conversion time relation.
Table 3.3 Results obtained from the GPC measurements
Sample Mw Mn Mz Mp D η (measured)PVCL 1 115.700 23.480 1.522.000 39.550 4.928 0.2568 PVCL 2 13.260 176 102.800 2.031 75.341 0,1821 PVCL 3 69.730 69.680 69.790 69.450 1.001 0,0930 PVCL 4 83.830 81.430 87.220 81.870 1.029 0,0745
Table 3.4 Results obtained from the Light Scattering measurements
Sample Mw (g.mole-1)
A2 (mole.dm3/g2) Rg/nm Rh/nm Dz Rg/Rh
PVCL 1 1.43 105 3.99 10-7 48.180 12.622 29.12 3.817 PVCL 2 1.41 104 -2.63 10-5 72.751 29.999 12.46 2.525 PVCL 3 6.93 104 -2.12 10-6 67.943 49.717 7.56 1.367 PVCL 4 7.73 104 -1.39 10-7 75.780 65.880 5.64 1.150

29
Figure 3.3 Guiner plot of 50% PVCL 1
Figure 3.4 Dynamic Light Scattering Results of 50% PVCL 1
30
Figure 3.5 Berry plot of 81% PVCL 2
Figure 3.6 Dynamic Light Scattering Results of 81% PVCL 2
31
Figure 3.7 Berry plot of 94% conversion to PVCL 3
Figure 3.8 Dynamic Light Scattering results of 94% PVCL 3

32
Figure 3.9 Zimm plot of 84% PVCL 4
Figure 3.10 Dynamic Light Scattering results of 84% PVCL 4
33
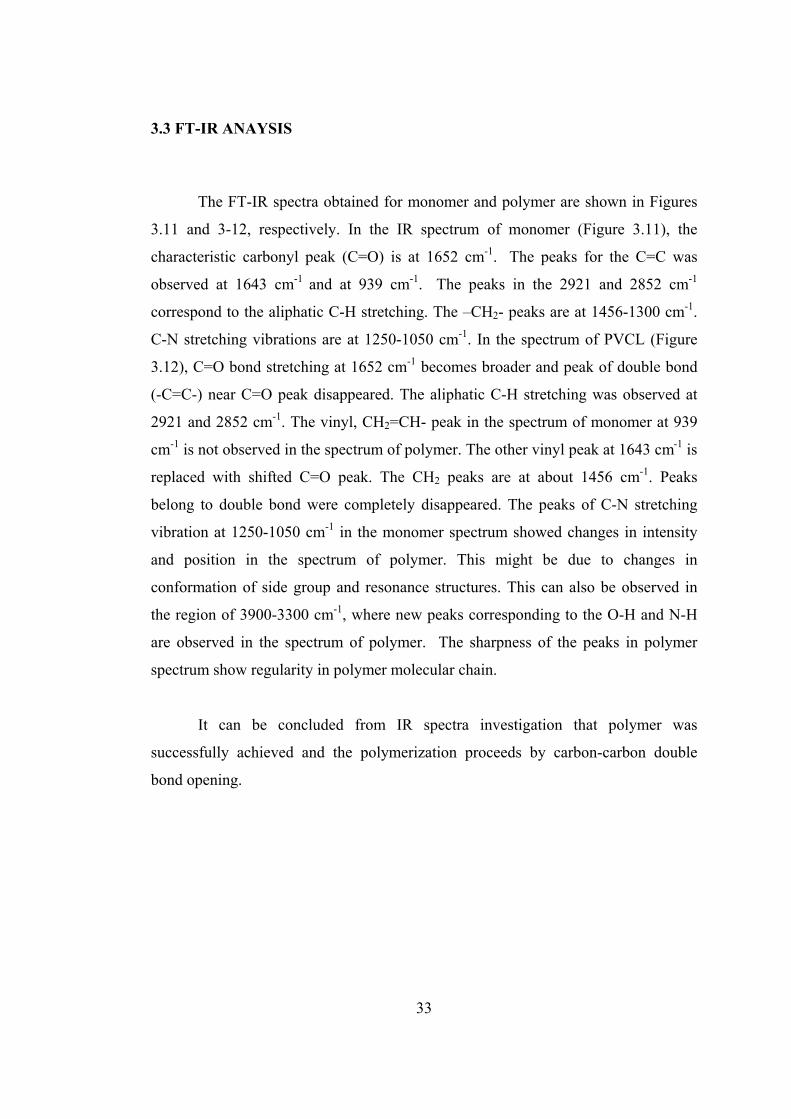
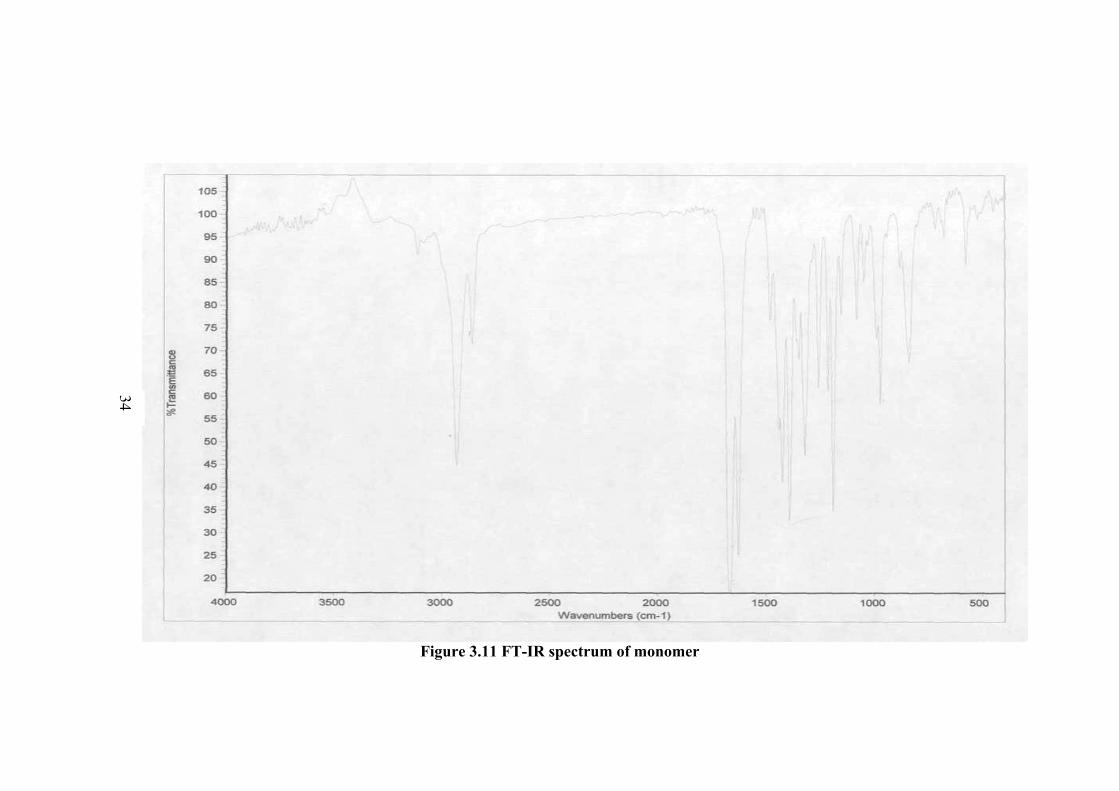
3.3 FT-IR ANAYSIS
The FT-IR spectra obtained for monomer and polymer are shown in Figures
3.11 and 3-12, respectively. In the IR spectrum of monomer (Figure 3.11), the
characteristic carbonyl peak (C=O) is at 1652 cm-1. The peaks for the C=C was
observed at 1643 cm-1 and at 939 cm-1. The peaks in the 2921 and 2852 cm-1
correspond to the aliphatic C-H stretching. The –CH2- peaks are at 1456-1300 cm-1.
C-N stretching vibrations are at 1250-1050 cm-1. In the spectrum of PVCL (Figure
3.12), C=O bond stretching at 1652 cm-1 becomes broader and peak of double bond
(-C=C-) near C=O peak disappeared. The aliphatic C-H stretching was observed at
2921 and 2852 cm-1. The vinyl, CH2=CH- peak in the spectrum of monomer at 939
cm-1 is not observed in the spectrum of polymer. The other vinyl peak at 1643 cm-1 is
replaced with shifted C=O peak. The CH2 peaks are at about 1456 cm-1. Peaks
belong to double bond were completely disappeared. The peaks of C-N stretching
vibration at 1250-1050 cm-1 in the monomer spectrum showed changes in intensity
and position in the spectrum of polymer. This might be due to changes in
conformation of side group and resonance structures. This can also be observed in
the region of 3900-3300 cm-1, where new peaks corresponding to the O-H and N-H
are observed in the spectrum of polymer. The sharpness of the peaks in polymer
spectrum show regularity in polymer molecular chain.
It can be concluded from IR spectra investigation that polymer was
successfully achieved and the polymerization proceeds by carbon-carbon double
bond opening.
34
Figure 3.11 FT-IR spectrum of monomer
34
35Figure 3.12 FT-IR Spectrum of PVCL
35

36
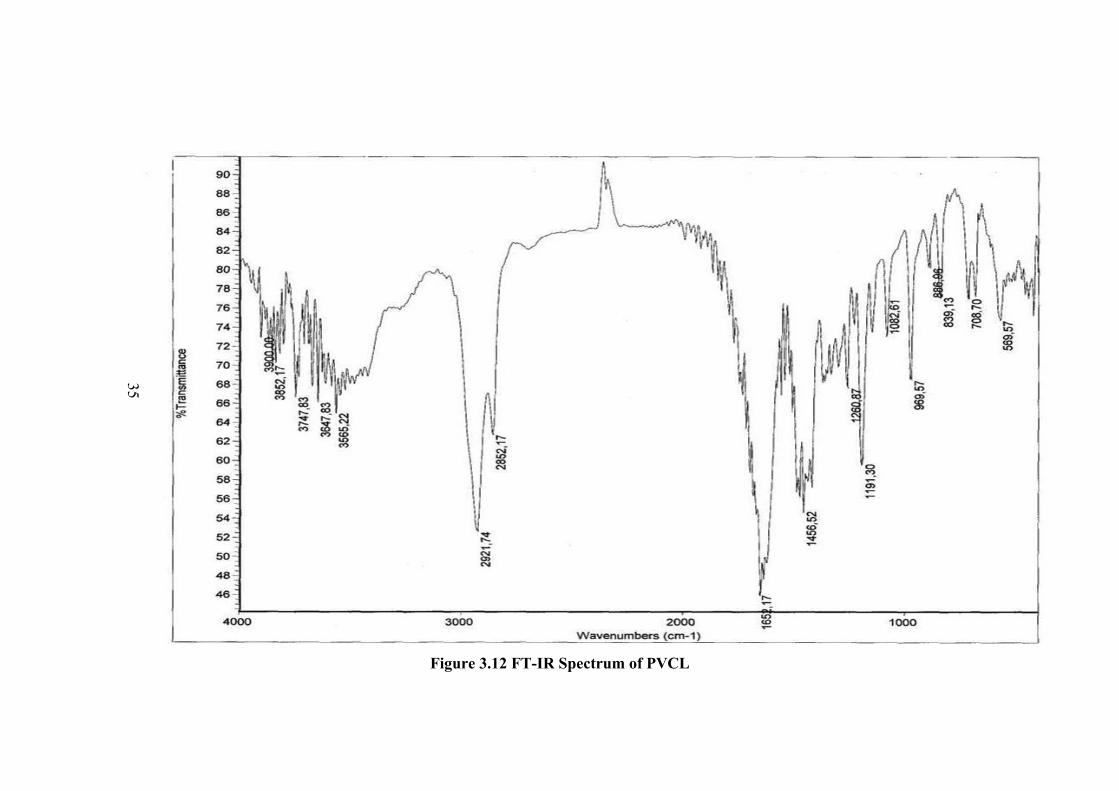
3.4 NUCLEAR MAGNETIC RESONANCE ANALYSIS The 1H-NMR and 13C-NMR spectra of N-vinylcaprolactam monomer and
polymer were investigated for the characterization of PVCL. The 1H-NMR of
monomer is shown in Figure 3.13. The peak assignments are shown on the formula
of the molecule and in the table as follows. The vinyl group corresponding to b and c
are in the 4.33 and 4.45 ppm, respectively. The CH2 groups in the ring as shown with
“a” are equivalent and appears at 1.66 ppm. The CH2 groups close to C=O, and N are
at 2.53 and 3.4 ppm, respectively. The peaks at 7.26 ppm correspond to solvent
(chloroform). These peaks show some changes in the spectrum of polymer as shown
Figure 3.14. The vinyl peaks are not completely disappeared upon polymerization
but becomes much broader. These peaks correspond to the chain end vinyl groups.
This also indicate the presence of oligomers in the polymer samples. When the
molecular weight is small, the end group analysis can easily be observed in the NMR
spectrum. The other peaks of monomer become much broader in the spectrum of
polymer. This is due to the changes in the chair conformation of lactam group in the
molecule after changing of intermolecular distance with polymerization.
H 2C
H 2C
H 2C C H 2
C H 2
C =ON
C H=C H 2
b c
d
aa
a
e
Table 3.5 The 1H-NMR spectrum of monomer
Proton Type Shift (ppm)
Ha CH2 1.66
Hb CH2 4.33
Hc =CH-N 4.45
Hd CH2 2.53
He CH2 3.4

37
H2C
H2C
H2C CH2
CH2
C=ON
CHCH2( ) n
da
b
a
a a
c
Table 3.6 The 1H-NMR spectrum of polymer
Proton Type Shift (ppm)
Ha CH2 1.64
Hb CH2 2.88
Hc =CH-N 2.42
Hd CH 4.16
13C-NMR spectrum of monomer is given in Figure 3.15. The monomer peaks
in the spectrum and the corresponding molecular formula are given as follows: The
peak at 77 ppm is due to chloroform. Similar spectrum of polymer is given in Figure
3.16. The CH2= at 93 ppm in the spectrum of monomer is not observed in the
spectrum of polymer. However, the methylene peak at 132.4 ppm in the monomer
spectrum shifts to 128.3 ppm in the polymer. The CH2 peaks of the monomer are not
changing their position in the spectrum of polymer but there intensity becomes much
smaller and the peak broadening becomes more. These changes are due to the
changes in the conformation of molecules upon polymerization. The preservation of
methylene peak at 132.4 ppm (changes to 128.3 ppm) is due to the presence of
nitrogen which causes resonance and forming double bond

38
H 2 C
H 2 C
H 2 C CH 2
CH 2
C=ON
CH=CH 2
8
6
5
4
2
1
3
7
Table 3.7 The 13C-NMR spectrum of monomer
C Type Shift (ppm) C1 C=O 174.680 C2 CH2 37.588 C3 CH2 27.602 C4 CH2 23.823 C5 CH2 29.810 C6 CH2 44.427 C7 CH2 132.423 C8 CH2 93.025
H 2C
H 2C
H 2C CH 2
CH 2
C=ON
CHCH 2( ) n
78
5
4 3
2
16
Table 3.8 The 13C-NMR spectrum of polymer
C (type) Shift (ppm) C1 C=O 176.104
C2 CH2 42.396
C3 CH2 29.911 C4 CH2 23.297 C5 CH2 37.482
C6 CH2 47.260 46.232
C7 CH 128.268
C8 CH2 29.310
39
Figure 3.13 1H-NMR spectrum of monomer
39
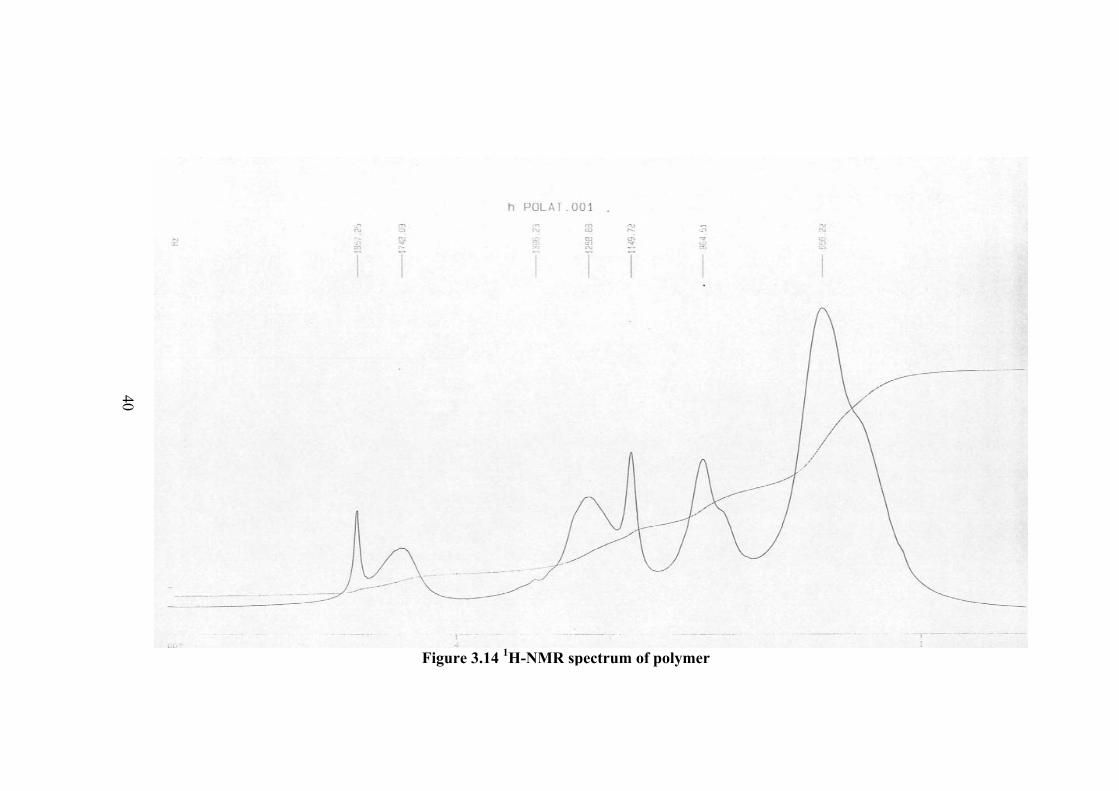
40 Figure 3.14 1H-NMR spectrum of polymer
40
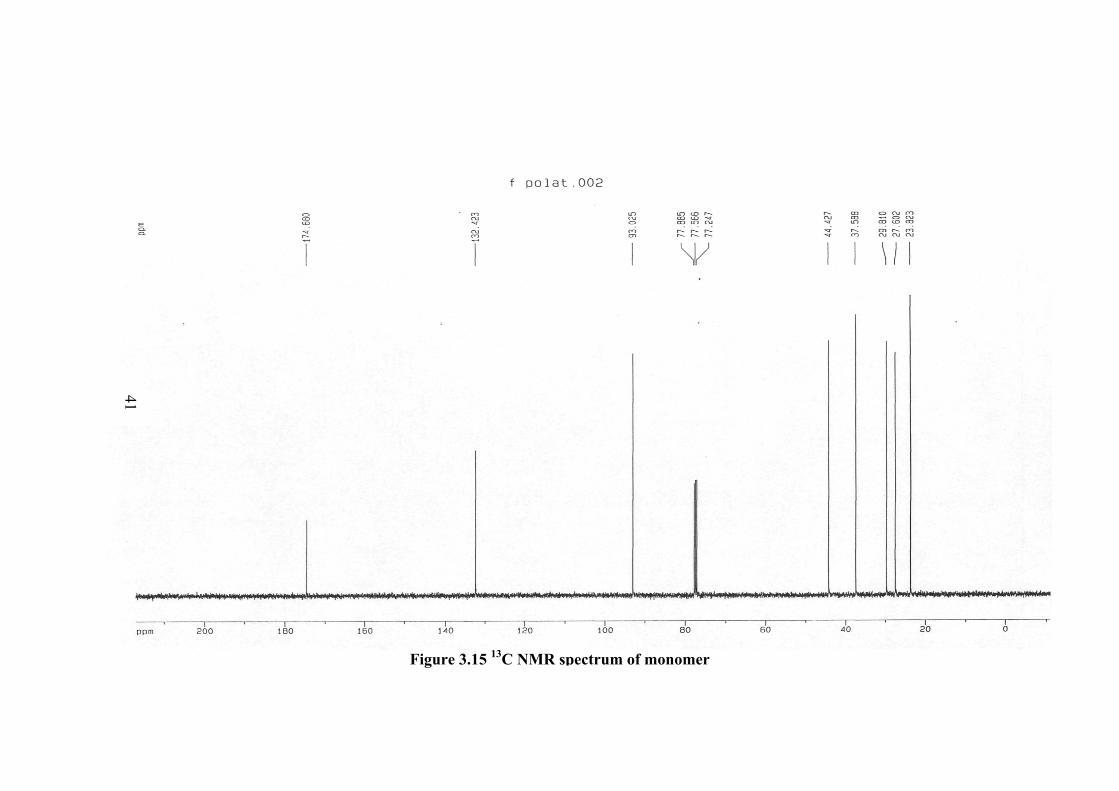
41Figure 3.15 13C NMR spectrum of monomer
41
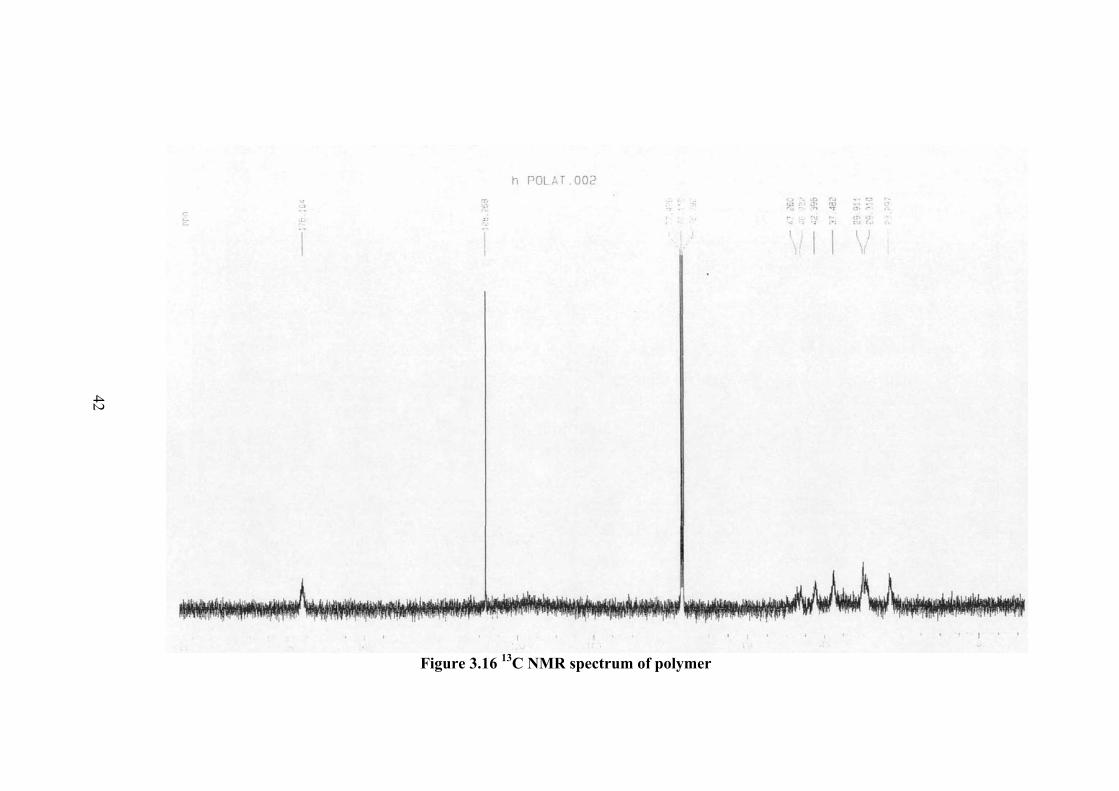
42 Figure 3.16 13C NMR spectrum of polymer
42

43
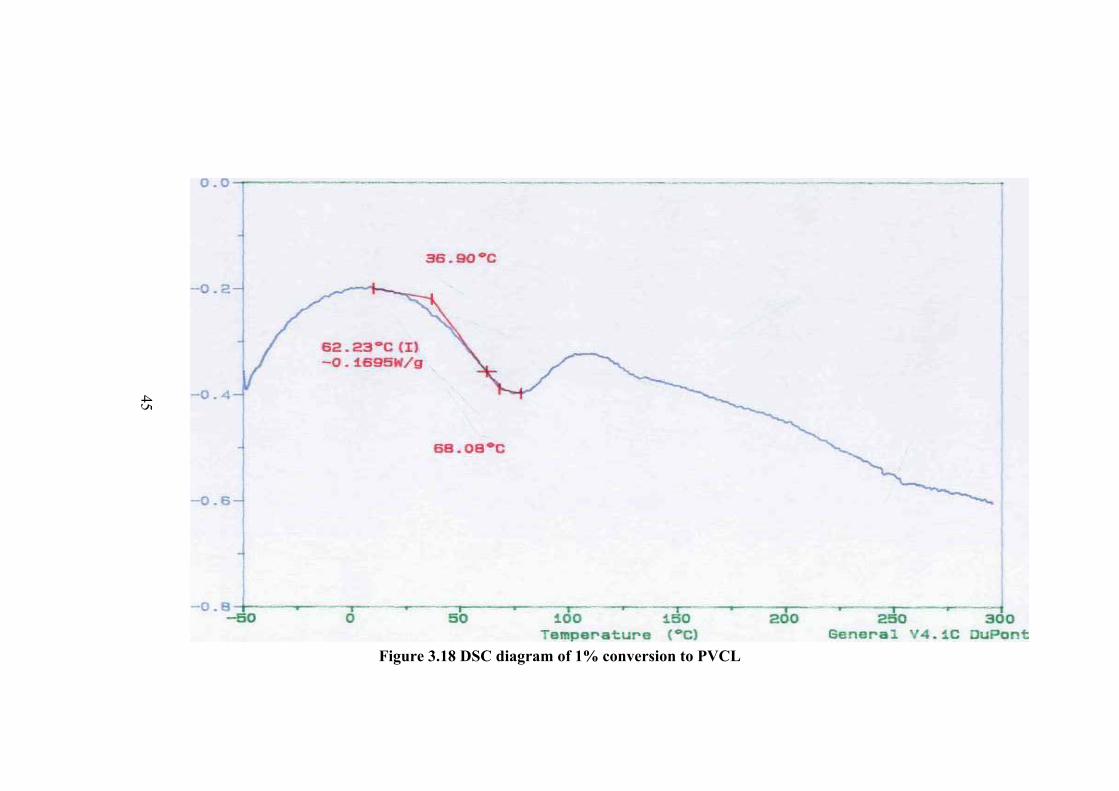
3.5 DIFFERENTIAL SCANNING CALORIMETRY The thermal properties of the monomer and polymers were investigated by
DSC method. The DSC thermogram of monomer is given in Figure 3.17. There is an
endothermic peak at 34.28oC corresponding to the melting point of monomer. The
thermogram is recorded in the temperature range of -50oC to +500C and no other
peaks were observed.
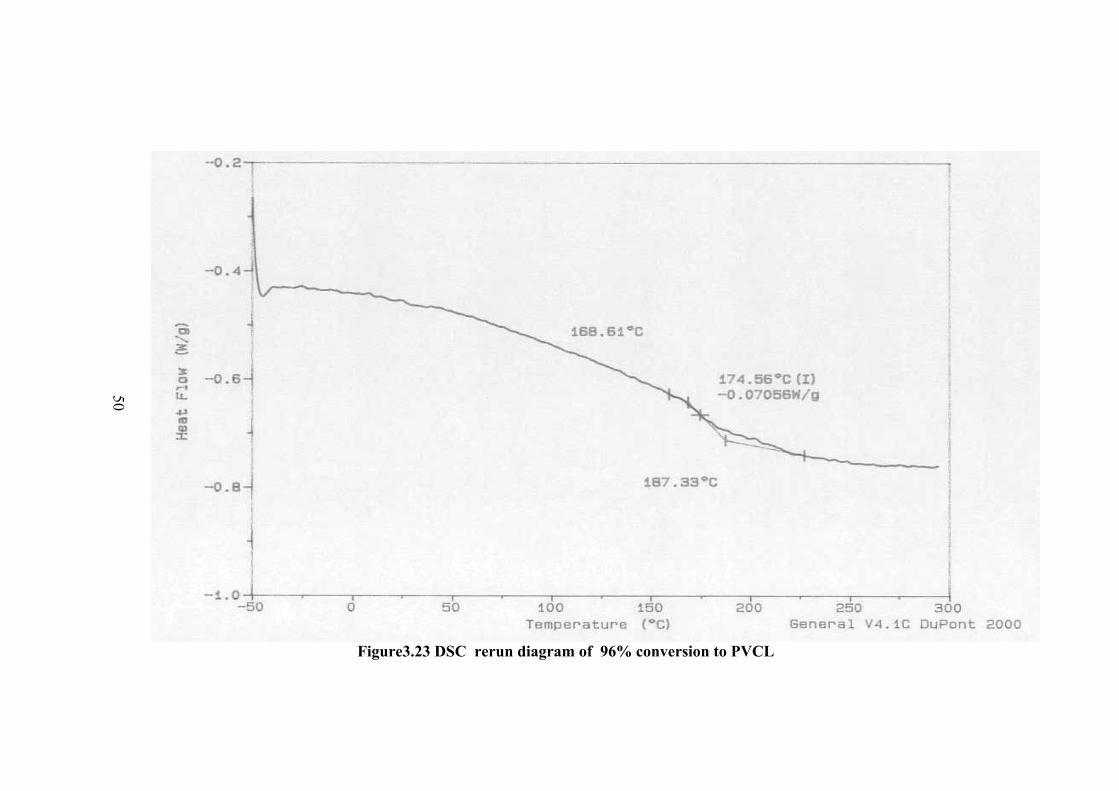
The DSC thermogram of the polymers are given in Figure 3.18-23 for
different conversion percent to polymer. In the thermogram there is a broad peak at
about 100 oC and less probable peak at about 147 oC which can be the Tg value.
However in order to be sure the sample was cooled and the thermogram of the same
sample was taken again. In this thermogram the first peak was disappeared and a new
peak of Tg was observed at about 174.6 oC. Therefore the observed peak at about
100oC is not Tg but corresponds to further polymerization of small molecular weight
fractions or crosslinking. The higher Tg compared to Tg observed before rerun of the
thermogram at about 147 oC is due to the increase of molecular weight.

44
Figure 3.17 DSC diagram of monomer
44
45
Figure 3.18 DSC diagram of 1% conversion to PVCL
45
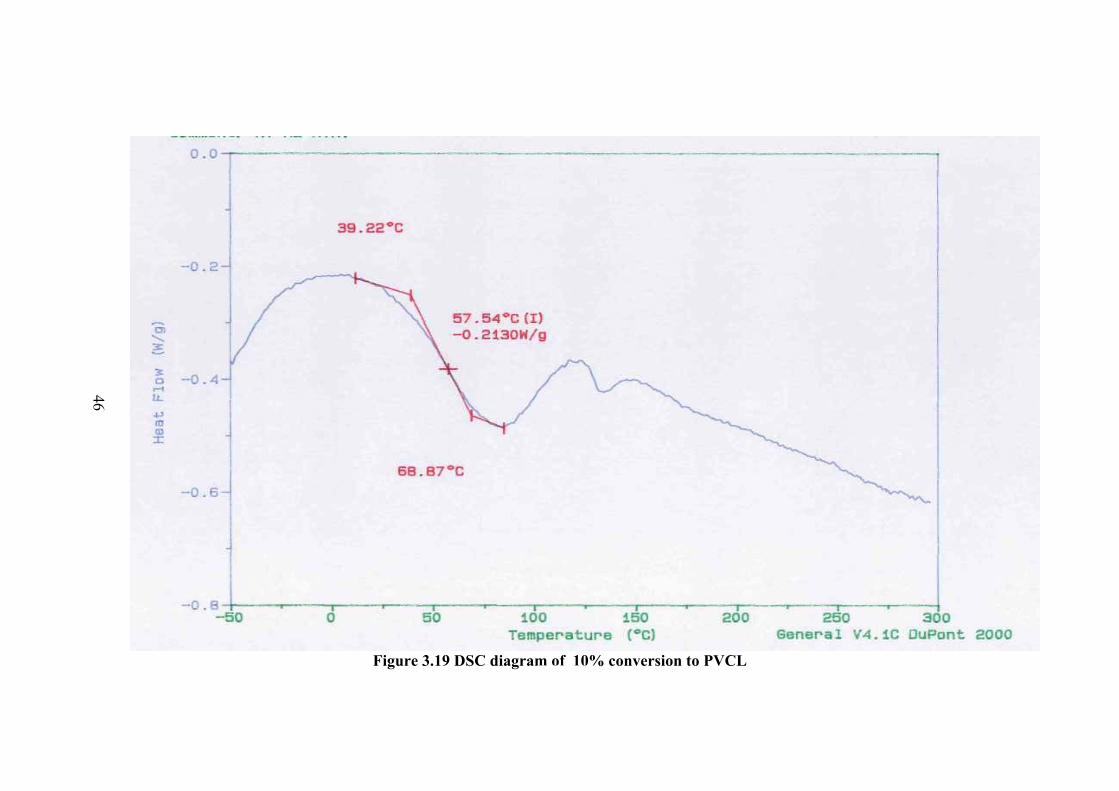
46Figure 3.19 DSC diagram of 10% conversion to PVCL
46
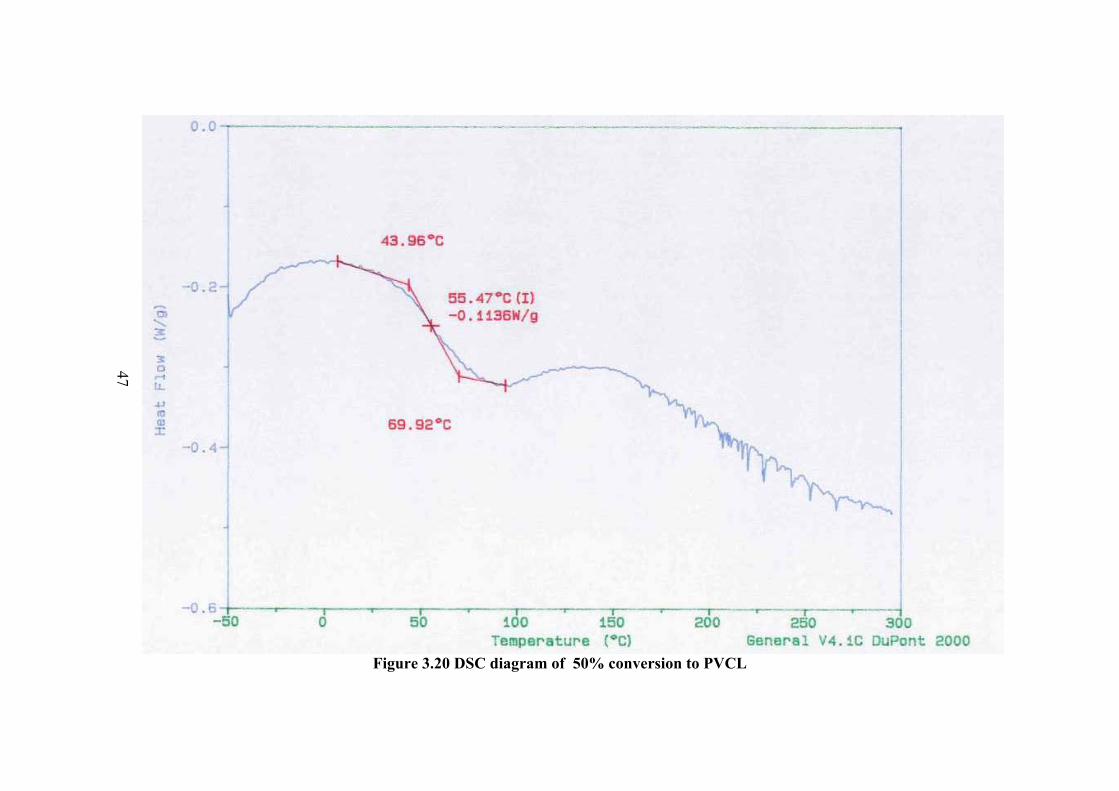
47Figure 3.20 DSC diagram of 50% conversion to PVCL
47

48Figure 3.21 DSC diagram of 94% conversion to PVCL
48
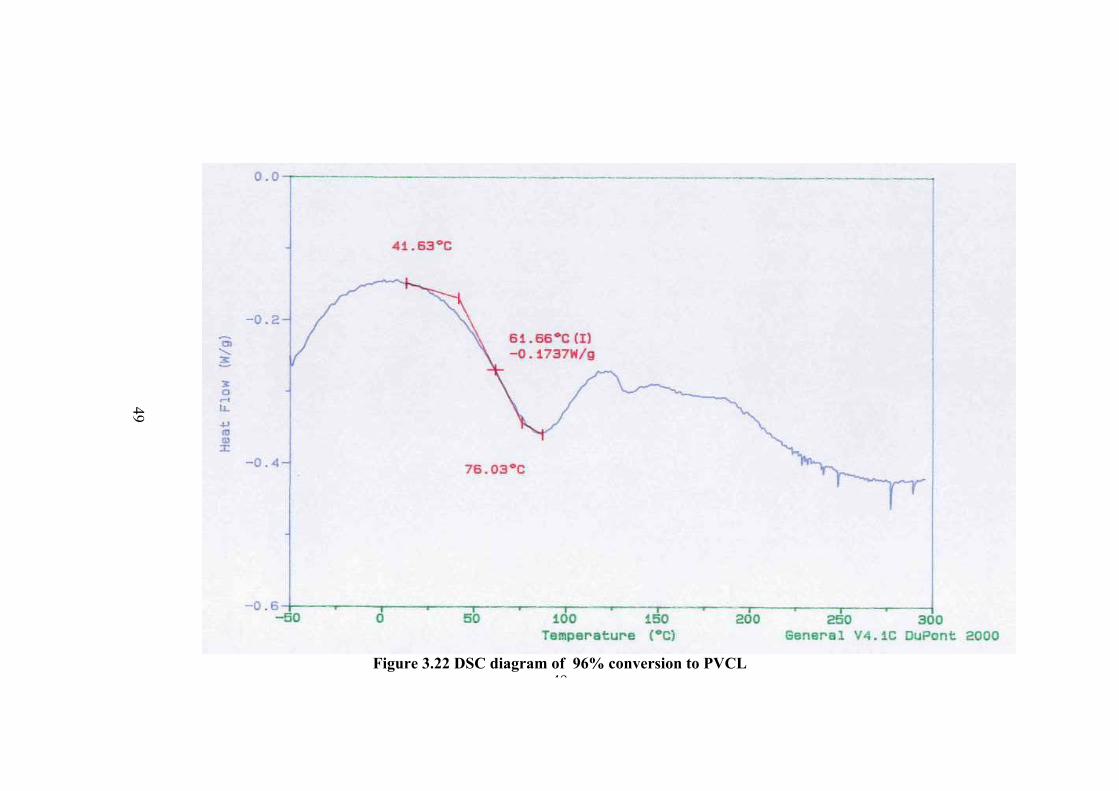
49Figure 3.22 DSC diagram of 96% conversion to PVCL
49
50
Figure3.23 DSC rerun diagram of 96% conversion to PVCL
50

51
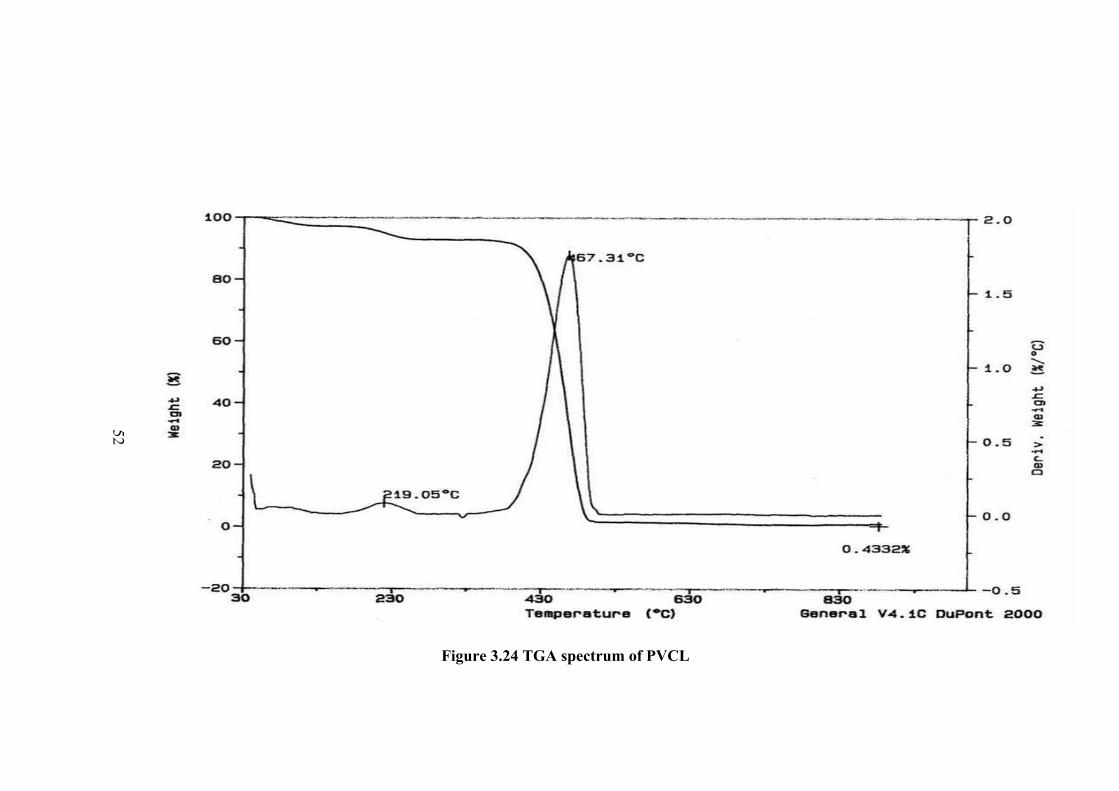
3.6 TGA CHARACTERIZATION OF PVCL
Thermogravimetric analysis of polymer was carried out under nitrogen
atmosphere from room temperature up to 900oC. The thermogram is given in Figure
3.24. The decreases in weight started at about 700C and continue up to about 2100C
by about 5%. A second range is maximized at 2900C. After about 4000C the weight
decrease is very sharp and reach to zero percent. The first decomposition
corresponds to adsorb water and then crystalline water. The percent weight decrease
calculated shows about one mole of water per mole of monomer repeating unit. The
main decomposition maximized at 4670C. The sharp decrease of weight shows that
the degradation of polymer is in the form of depolymerization.
52
Figure 3.24 TGA spectrum of PVCL
52
53
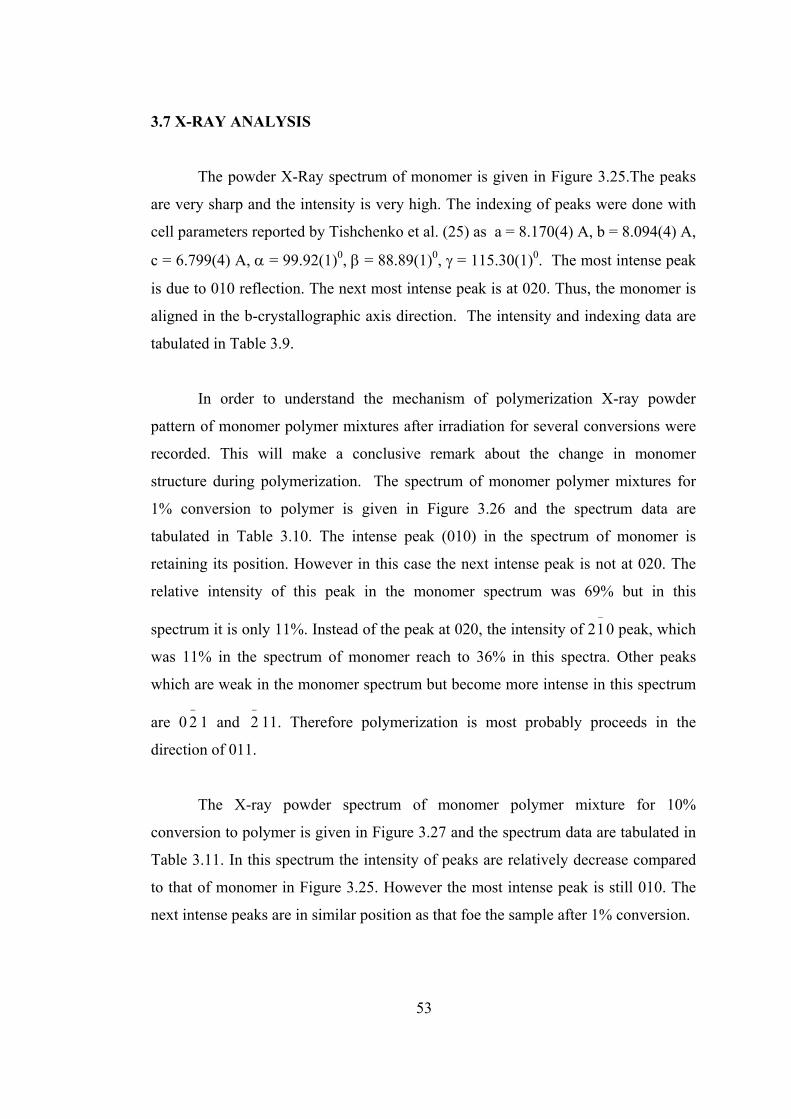
3.7 X-RAY ANALYSIS The powder X-Ray spectrum of monomer is given in Figure 3.25.The peaks
are very sharp and the intensity is very high. The indexing of peaks were done with
cell parameters reported by Tishchenko et al. (25) as a = 8.170(4) A, b = 8.094(4) A,
c = 6.799(4) A, α = 99.92(1)0, β = 88.89(1)0, γ = 115.30(1)0. The most intense peak
is due to 010 reflection. The next most intense peak is at 020. Thus, the monomer is
aligned in the b-crystallographic axis direction. The intensity and indexing data are
tabulated in Table 3.9.
In order to understand the mechanism of polymerization X-ray powder
pattern of monomer polymer mixtures after irradiation for several conversions were
recorded. This will make a conclusive remark about the change in monomer
structure during polymerization. The spectrum of monomer polymer mixtures for
1% conversion to polymer is given in Figure 3.26 and the spectrum data are
tabulated in Table 3.10. The intense peak (010) in the spectrum of monomer is
retaining its position. However in this case the next intense peak is not at 020. The
relative intensity of this peak in the monomer spectrum was 69% but in this
spectrum it is only 11%. Instead of the peak at 020, the intensity of 2−
10 peak, which
was 11% in the spectrum of monomer reach to 36% in this spectra. Other peaks
which are weak in the monomer spectrum but become more intense in this spectrum
are 0−
2 1 and −
2 11. Therefore polymerization is most probably proceeds in the
direction of 011.
The X-ray powder spectrum of monomer polymer mixture for 10%
conversion to polymer is given in Figure 3.27 and the spectrum data are tabulated in
Table 3.11. In this spectrum the intensity of peaks are relatively decrease compared
to that of monomer in Figure 3.25. However the most intense peak is still 010. The
next intense peaks are in similar position as that foe the sample after 1% conversion.
54
The X-ray powder spectrum of monomer polymer mixture for 50%
conversion to polymer is given in Figure 3.28 and the spectrum data are tabulated
in Table 3.12. The spectrum shows much differences compared to other spectrum.
There is a large decrease in the intensity of monomer peaks and abroad peak
corresponding to polymer is appearing in the spectrum. The intensity of 010 peak is
no more the most intense peak (67% intensity). The most intense peak now is 2−
2 0
(100% intensity) .It was only about 12% in the spectrum of monomer. This shows
that even at this percent conversion, monomer retain most of its characteristic
structure .However, the polymer also shows crystalline structure with appearance of
new peaks. Thus, the polymer obtain at 50% conversion has relatively high percent
of crystallinity .
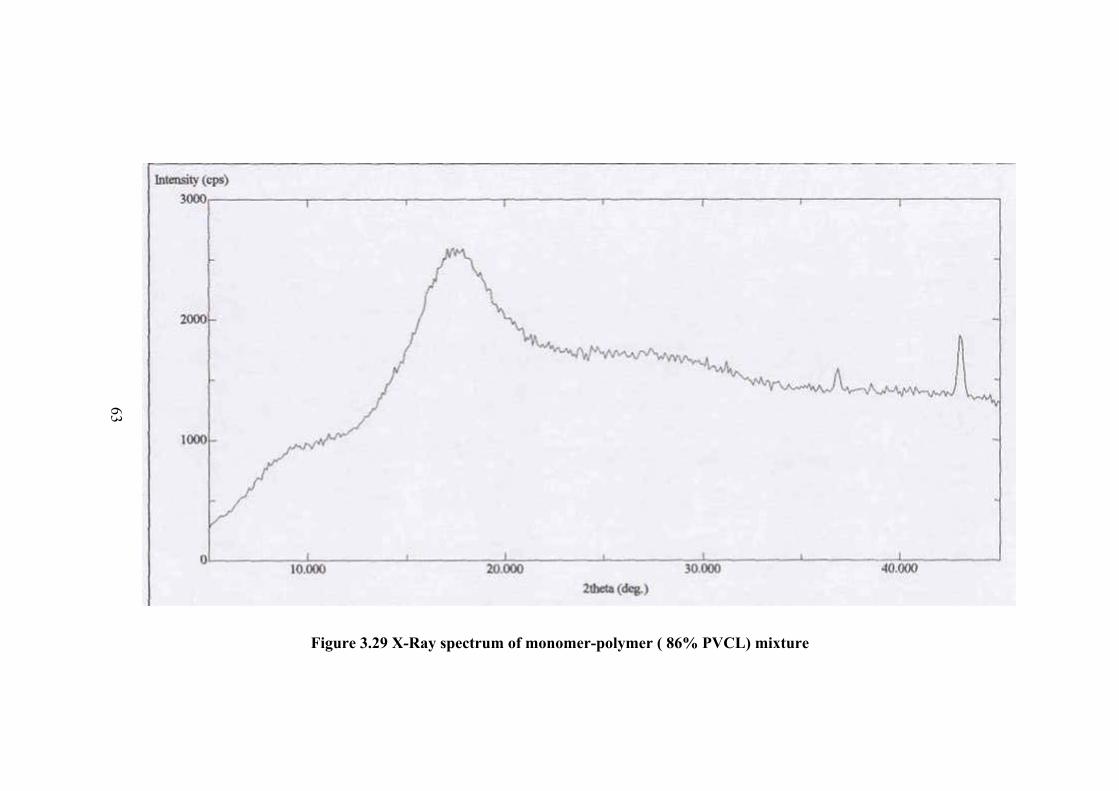
The X-ray powder spectrum of monomer polymer mixture for 86%
conversion is given in Figure 3.29. The spectrum shows at typical appearance of low
percent crystalline polymer. There are some background peaks of monomer also in
the spectrum. The structure of monomer is almost completely disappeared in the
spectrum. When the polymer is separated from the monomer the X-ray spectrum
showed the same pattern. The x-pattern of polymer is given in Figure 3.30.
55
Figure 3.25 X-Ray spectrum of monomer
55

56
Table 3.9 X-Ray Analysis of Monomer
Peak no 2θ d-Value Intensity I/Io d-calc. h k l
1 11,25 7,8584 5370 5
2 12,40 7,132 111176 100 7,1962 0 1 0
3 13,40 6,602 9369 9 6,6849 0 0 1
4 17,45 5,0778 3156 3 5,0777 1 -1 1
5 19,60 4,5253 13230 12 4,5209 -1 1 1
6 20,85 4,2568 13207 12 4,3058 1 1 0
7 21,95 4,0459 11230 11 4,0676 2 -1 0
8 22,45 3,9569 3682 4 3,9784 1 -2 0
9 24,8 3,587 76173 69 3,5981 0 2 0
10 26.15 3,4048 12678 12 3,4034 1 1 1
11 27,90 3,1951 2480 3 3,192 2 -2 1
12 28,8 3,0973 4004 4 3,1165 -1 0 2
13 30,35 2,9425 2974 3 2,9526 0 2 1
14 30,75 2,9051 1598 2 2,9058 -2 2 1
15 32,65 2,7403 5032 5 2,7429 -1 -2 1
16 33,25 2,6922 4881 5 2,7059 0 -2 2
17 33,8 2,6496 2684 3 2,6398 1 -3 0
18 35,35 2,5369 1987 2 2,5388 -2 1 2
19 36,4 2,4661 3803 4 2,4575 3 0 0
20 36,75 2,4434 4824 5 2,4395 1 2 1
21 37,5 2,3963 4205 4 2,3987 0 3 0
22 39 2,3075 2017 2 2,3185 -1 3 1

57
Figure 3.26 X-Ray spectrum of monomer-polymer (1% PVCL) mixture
57
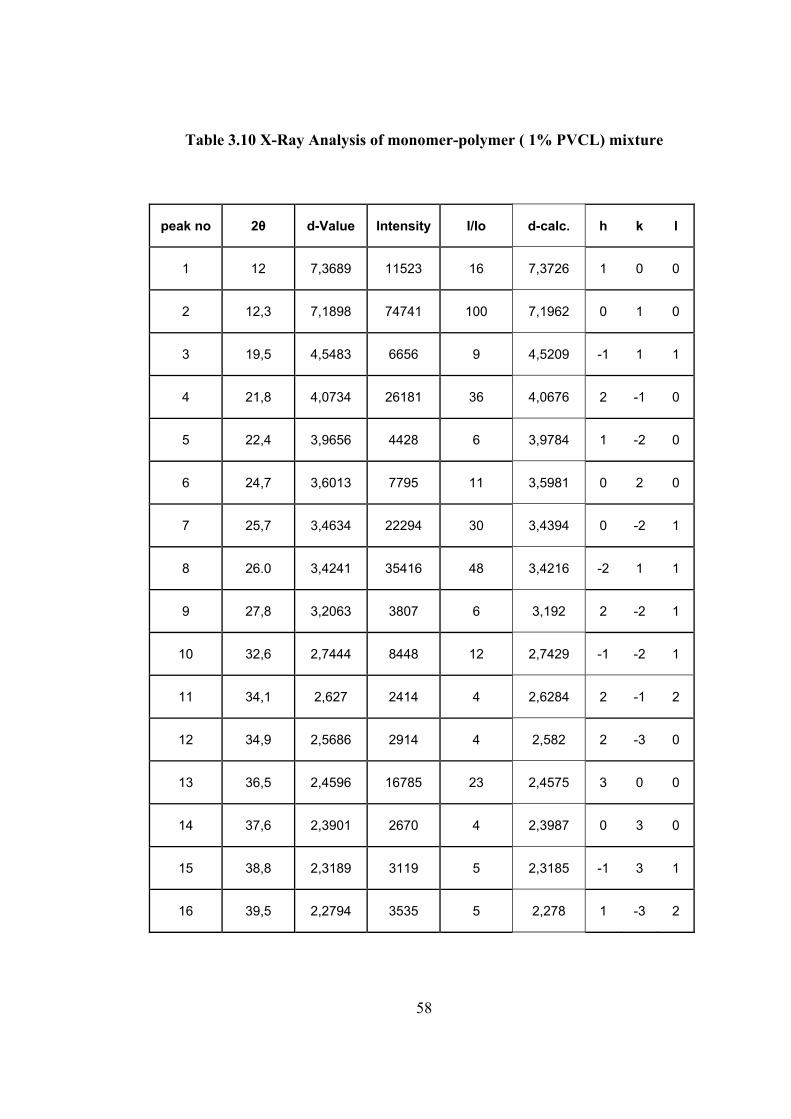
58
Table 3.10 X-Ray Analysis of monomer-polymer ( 1% PVCL) mixture
peak no 2θ d-Value Intensity I/Io d-calc. h k l
1 12 7,3689 11523 16 7,3726 1 0 0
2 12,3 7,1898 74741 100 7,1962 0 1 0
3 19,5 4,5483 6656 9 4,5209 -1 1 1
4 21,8 4,0734 26181 36 4,0676 2 -1 0
5 22,4 3,9656 4428 6 3,9784 1 -2 0
6 24,7 3,6013 7795 11 3,5981 0 2 0
7 25,7 3,4634 22294 30 3,4394 0 -2 1
8 26.0 3,4241 35416 48 3,4216 -2 1 1
9 27,8 3,2063 3807 6 3,192 2 -2 1
10 32,6 2,7444 8448 12 2,7429 -1 -2 1
11 34,1 2,627 2414 4 2,6284 2 -1 2
12 34,9 2,5686 2914 4 2,582 2 -3 0
13 36,5 2,4596 16785 23 2,4575 3 0 0
14 37,6 2,3901 2670 4 2,3987 0 3 0
15 38,8 2,3189 3119 5 2,3185 -1 3 1
16 39,5 2,2794 3535 5 2,278 1 -3 2
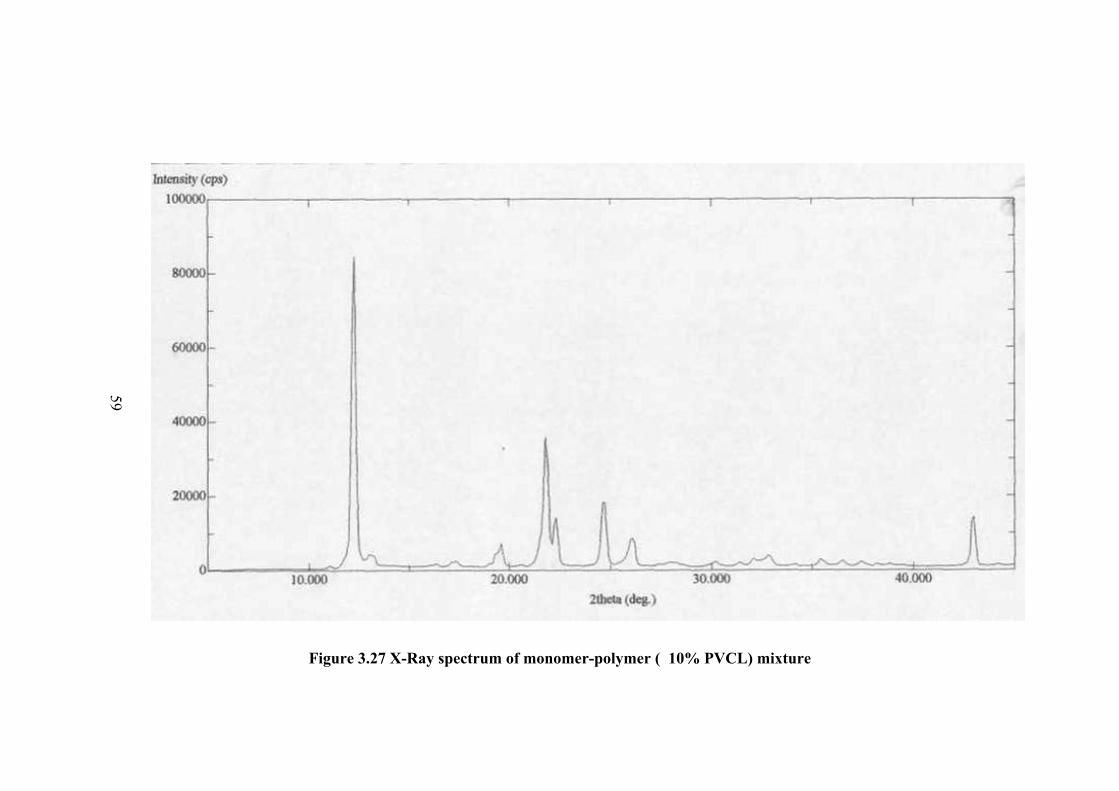
59
Figure 3.27 X-Ray spectrum of monomer-polymer ( 10% PVCL) mixture
59
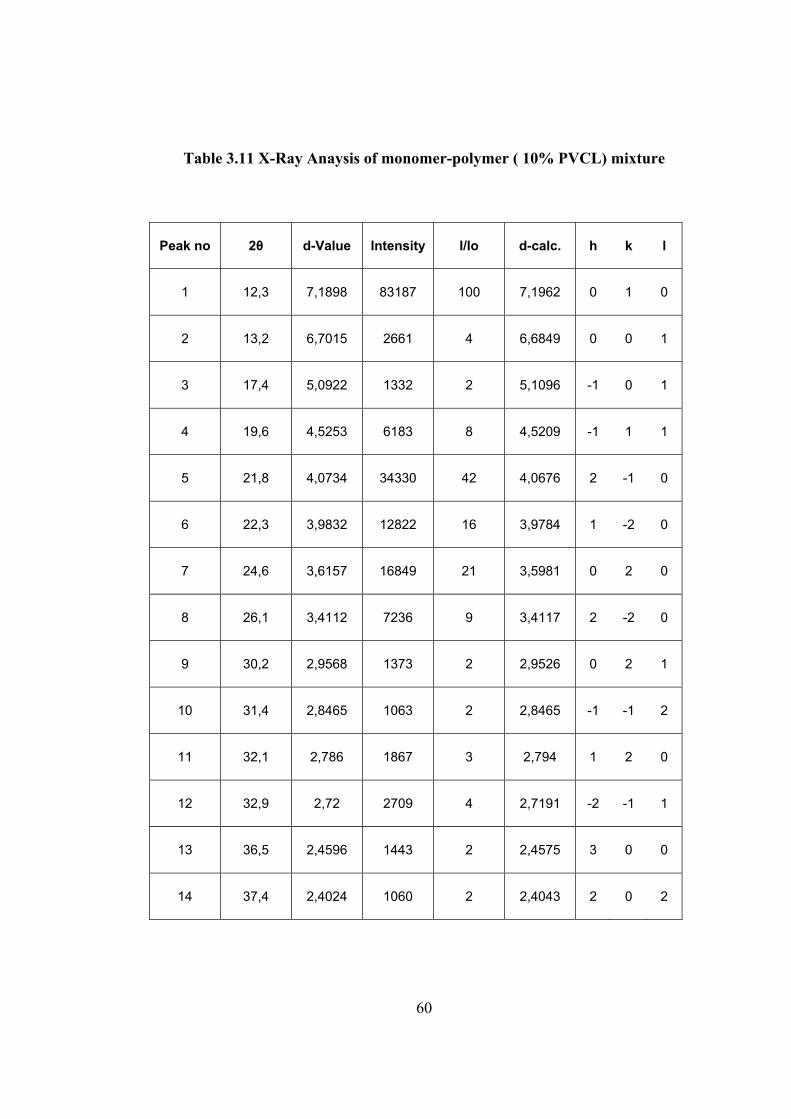
60
Table 3.11 X-Ray Anaysis of monomer-polymer ( 10% PVCL) mixture
Peak no 2θ d-Value Intensity I/Io d-calc. h k l
1 12,3 7,1898 83187 100 7,1962 0 1 0
2 13,2 6,7015 2661 4 6,6849 0 0 1
3 17,4 5,0922 1332 2 5,1096 -1 0 1
4 19,6 4,5253 6183 8 4,5209 -1 1 1
5 21,8 4,0734 34330 42 4,0676 2 -1 0
6 22,3 3,9832 12822 16 3,9784 1 -2 0
7 24,6 3,6157 16849 21 3,5981 0 2 0
8 26,1 3,4112 7236 9 3,4117 2 -2 0
9 30,2 2,9568 1373 2 2,9526 0 2 1
10 31,4 2,8465 1063 2 2,8465 -1 -1 2
11 32,1 2,786 1867 3 2,794 1 2 0
12 32,9 2,72 2709 4 2,7191 -2 -1 1
13 36,5 2,4596 1443 2 2,4575 3 0 0
14 37,4 2,4024 1060 2 2,4043 2 0 2

61
Figure 3.28 X-Ray spectrum of monomer-polymer (50% PVCL) mixture
61
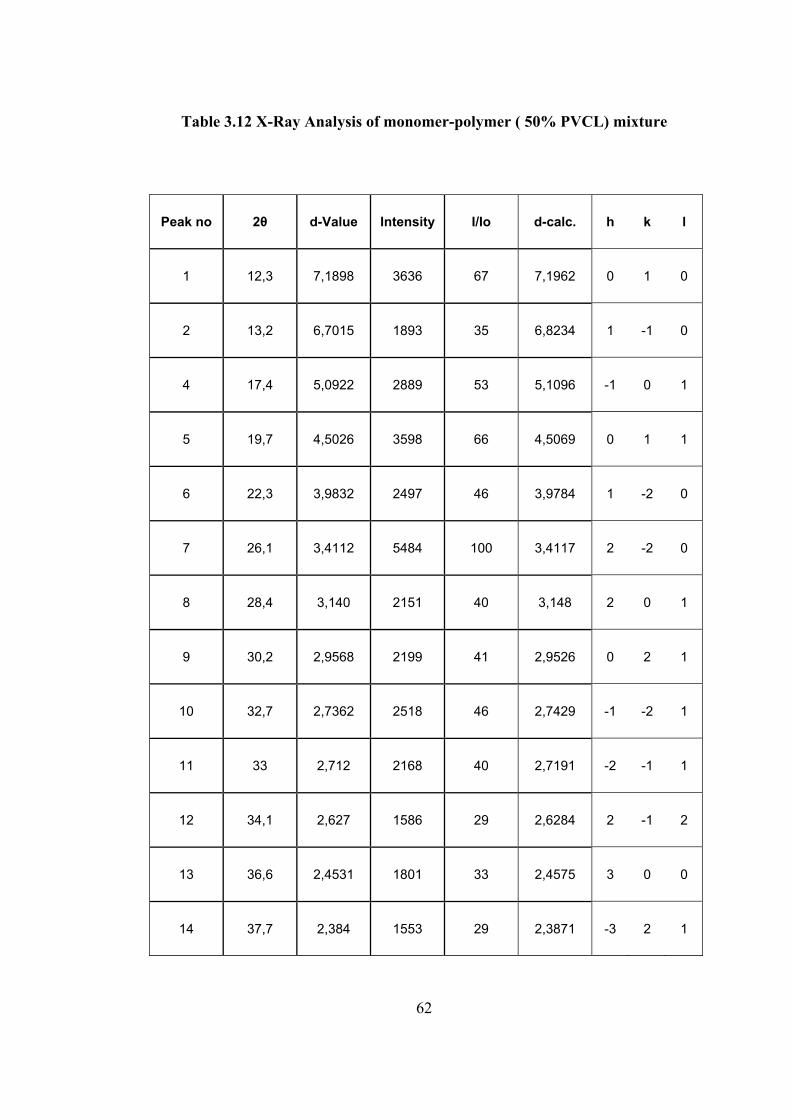
62
Table 3.12 X-Ray Analysis of monomer-polymer ( 50% PVCL) mixture
Peak no 2θ d-Value Intensity I/Io d-calc. h k l
1 12,3 7,1898 3636 67 7,1962 0 1 0
2 13,2 6,7015 1893 35 6,8234 1 -1 0
4 17,4 5,0922 2889 53 5,1096 -1 0 1
5 19,7 4,5026 3598 66 4,5069 0 1 1
6 22,3 3,9832 2497 46 3,9784 1 -2 0
7 26,1 3,4112 5484 100 3,4117 2 -2 0
8 28,4 3,140 2151 40 3,148 2 0 1
9 30,2 2,9568 2199 41 2,9526 0 2 1
10 32,7 2,7362 2518 46 2,7429 -1 -2 1
11 33 2,712 2168 40 2,7191 -2 -1 1
12 34,1 2,627 1586 29 2,6284 2 -1 2
13 36,6 2,4531 1801 33 2,4575 3 0 0
14 37,7 2,384 1553 29 2,3871 -3 2 1
63
Figure 3.29 X-Ray spectrum of monomer-polymer ( 86% PVCL) mixture
63

64
Figure 3.30 X-Ray spectrum of PVCL
64
65
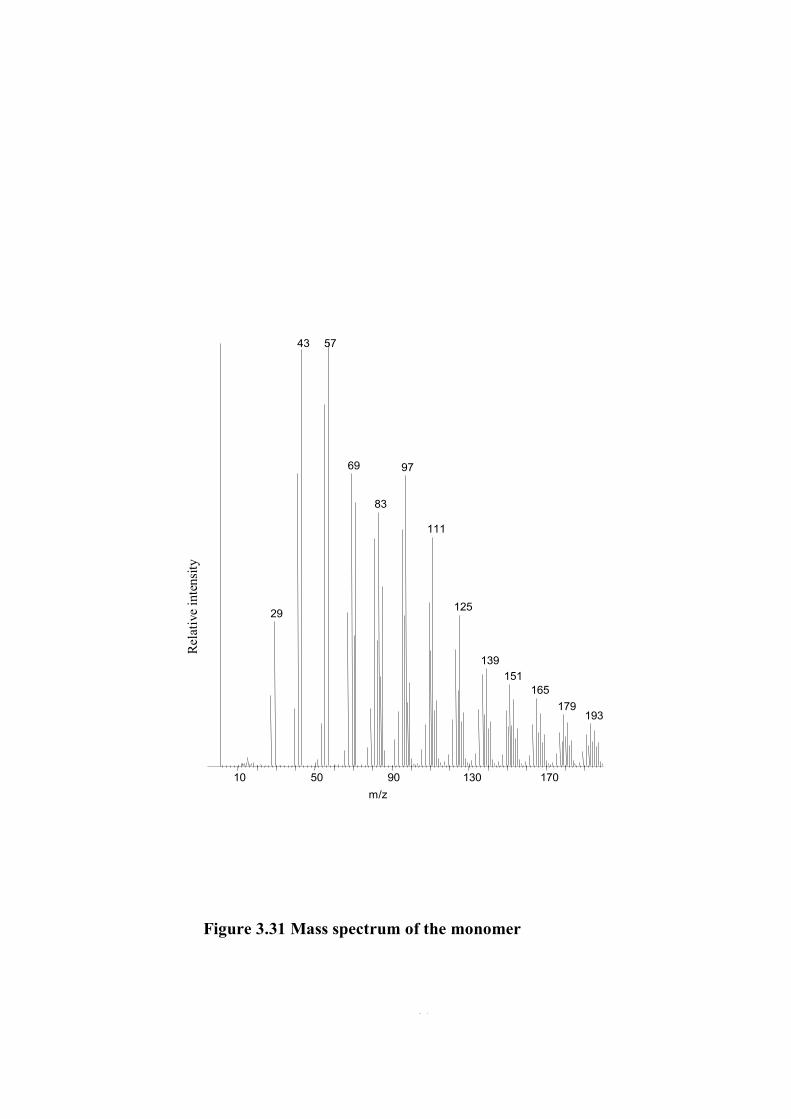
3.8 MASS SPECTRAL ANALYSIS
The mass spectrum of the monomer is given in Figure 3.31. Monomer peak is
quite intense. Yet, there are some high mass peaks indicating presence of oligomers.
The base peak is at m/z=57 Da due to N=COHCH2 indicating that McLafferty
rearrangement reaction was the main dissociation path way during ionization. The
second intense peak is at m/z=43 Da due to N=COH. Other intense peaks are at
m/z=41,69, 71, 83 and 97 due to C3H5 ; C3H6CH=CH2 , CH2=CH-N=CH2 ;
N=C(OH)(CH2)2 ; CH2=CH-N(CO)(CH2)2 ; C=O(CH2)3CH=CH2 respectively. In
Table 3.13 the mass spectral data is given.
In Figure 3.32 total ion-current, (TIC) curve, the variation of total ion yield as a
function of temperature, and the pyrolysis mass spectra of the polymer recorded at
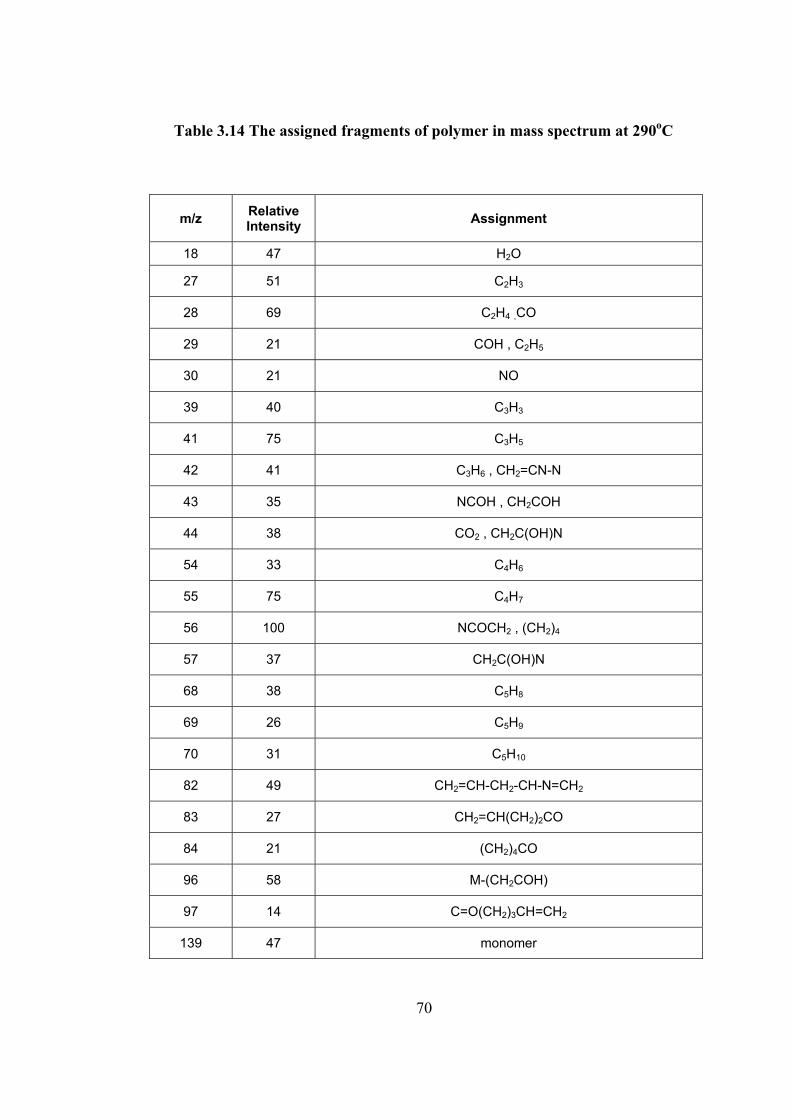
weak and broad peak at 290 C and at the maximum of the TIC curve at 445 C are
shown.
It can be observed from the figure that the main decomposition occurred above
4300C in accordance with the TGA. The base peak in the mass spectrum recorded at
290 C is at m/z= 56 Da due to (CH2)5. The highest mass fragment is monomer.
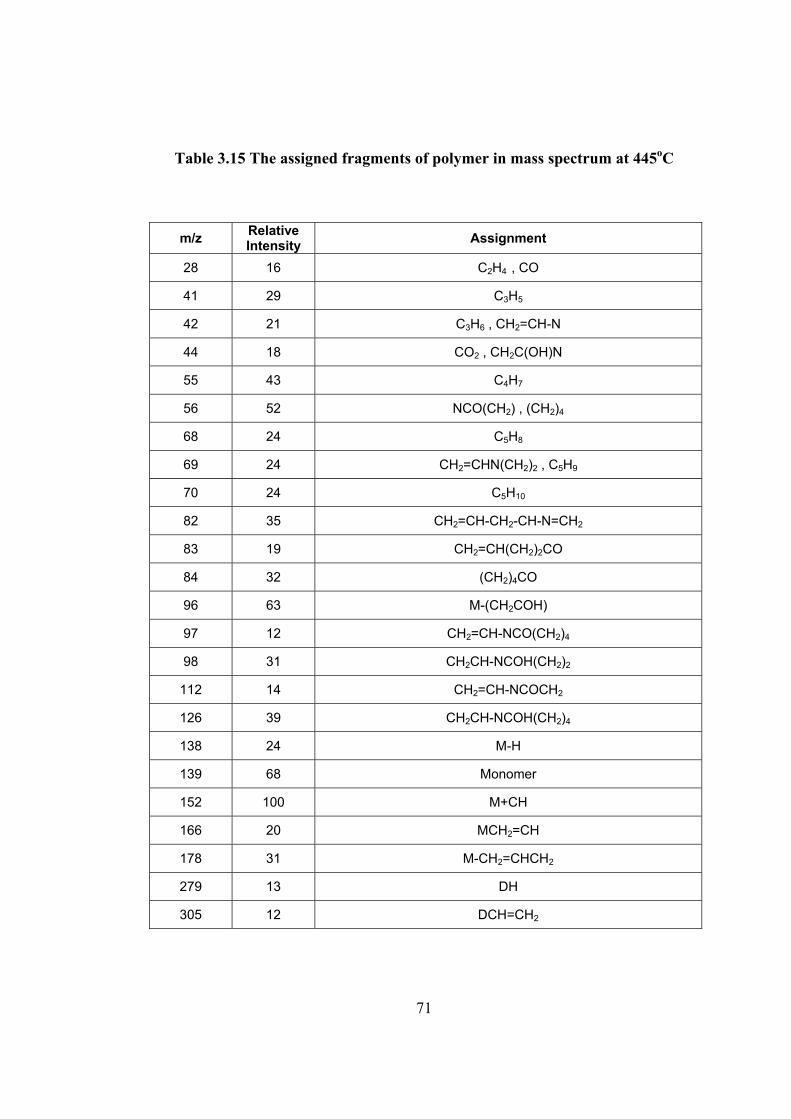
Evolution of water was also detected around this temperature range. At the final
stage of pyrolysis the base peak was at m/z=152 Da at is due to M+CH. Yet
monomer yield was also quite intense. The data indicated cleavage of side groups
from the low molecular weight oligomers. Yet, it seems that the loss of side groups
occurred mainly during the ionization processes inside the mass spectrometer. Thus
it may be concluded that the thermal degradation occurs by random cleavages of the
polymer backbone in a single yielding mainly monomer and low molecular weight
oligomers. In Table 3.14 and 3.15 the mass spectral data recorded at 290 and 445 C
are summarized respectively.
66
However, in order to be sure about the thermal degradation processes taking
place the single ion pyrograms, the variation of intensity of a single product ion as a
function of temperature were also studied. In Figure3.33 , the single ion pyrograms,
evolution profiles of some selected products are shown. It can be observed form
figure that besides H2O, monomer and dissociation products the monomer, thermal
decomposition mainly occured in the final stage of pyrolysis.
67
10 50 90 130 170m/z
5743
69 97
83
111
12529
139151
165179
193
Rela
tive
inte
nsity
Figure 3.31 Mass spectrum of the monomer

68
Table 3.13 The assigned fragments of monomer in mass spectrum
m/z Relative Intensity Assignment
29 34 COH, C2H5
41 69 C3H5
43 98 N=C-OH , CH2=C-OH
55 85 C2H4-CH=CH2 , CH2-CH-N-CH2
57 100 N=C(OH)CH2
69 69 C3H6CH=CH2 , CH2=CH-N=CH2
70 31 C5H10
71 62 N=C(OH)(CH2)2
83 60 CH2=CH-N(CO)(CH2)2
85 42 N=C(OH)(CH2)3
95 56 C5H5NO
97 69 C=O(CH2)3CH=CH2
109 39 C7H11N
111 54 M-CH2-CH2
125 36 M-CH2
139 23 monomer

69
m/z
m/z
Temperature
0 50 100 150 200 250 300 350 400
c) T=4450C152
96
56
126178
29126628 317204418
Rel
ativ
ein
tens
ity
10 20 30 40 50 60 70 80 90 100 110 120 130 140
56
4128
96
8218 13968
110
b)T=2900C
Rel
ativ
ein
tens
ity
230 330 430
a) TIC Curve
Inte
nsity
Figure 3.32 Mass spectrum of PVCA
70
Table 3.14 The assigned fragments of polymer in mass spectrum at 290oC
m/z Relative Intensity Assignment
18 47 H2O
27 51 C2H3
28 69 C2H4 ,CO
29 21 COH , C2H5
30 21 NO
39 40 C3H3
41 75 C3H5
42 41 C3H6 , CH2=CN-N
43 35 NCOH , CH2COH
44 38 CO2 , CH2C(OH)N
54 33 C4H6
55 75 C4H7
56 100 NCOCH2 , (CH2)4
57 37 CH2C(OH)N
68 38 C5H8
69 26 C5H9
70 31 C5H10
82 49 CH2=CH-CH2-CH-N=CH2
83 27 CH2=CH(CH2)2CO
84 21 (CH2)4CO
96 58 M-(CH2COH)
97 14 C=O(CH2)3CH=CH2
139 47 monomer
71
Table 3.15 The assigned fragments of polymer in mass spectrum at 445oC
m/z Relative Intensity Assignment
28 16 C2H4 , CO
41 29 C3H5
42 21 C3H6 , CH2=CH-N
44 18 CO2 , CH2C(OH)N
55 43 C4H7
56 52 NCO(CH2) , (CH2)4
68 24 C5H8
69 24 CH2=CHN(CH2)2 , C5H9
70 24 C5H10
82 35 CH2=CH-CH2-CH-N=CH2
83 19 CH2=CH(CH2)2CO
84 32 (CH2)4CO
96 63 M-(CH2COH)
97 12 CH2=CH-NCO(CH2)4
98 31 CH2CH-NCOH(CH2)2
112 14 CH2=CH-NCOCH2
126 39 CH2CH-NCOH(CH2)4
138 24 M-H
139 68 Monomer
152 100 M+CH
166 20 MCH2=CH
178 31 M-CH2=CHCH2
279 13 DH
305 12 DCH=CH2

72
m/z=305X7.6
180 280 380
m/z=139X1.5
m/z=152
m/z=96X1..6
m/z=18X1.15
Temperature
Inte
nsity
Figure 3.33 The single ion pyrograms in selected products

73
CHAPTER IV
CONCLUSION
In this study, N-vinylcaprolactam was polymerized in solid state by radiation.
Polymerization was carried out in vacuum and in open atmosphere at room
temperature. The following conclusion were derived from this study:
1. The rate of polymerization was higher in open air and limiting conversion was
100% in vacuum; 90% in open atmosphere.
2. Polymer obtain was gel type soluble in water and most common organic
solvents.
3. FT-IR and NMR results show that polymerization proceeded by opening of
vinyl group.
4. The light scattering, GPC and viscosity methods useful for molecular weight
determination showed that the polymer conformation in solution highly
dependent on molecular weight. Therefore, a simple relation between intrinsic
viscosity and molecular weight could not be obtained.
5. X-Ray structure determination showed that the cyristal structure of monomer
retained its identity up to about 86% conversion. The polymer was amorphous
but showed some polymer chain regularity and chain orientation up to a certain
extend.
6. Mass spectrum analysis of monomer and polymer gave the fragments
compatible with a vinyl group backbone chain and lactam as side group.

74
REFERENCES
1. Charlesby, A., Atomic Radiation and Polymers, Pergamon Press, Newyork,
(1960)
2. Ivanov, V. S., Radiation Chemistry of Polymers, Utrecht, The Netherlands,
(1992)
3. Schmitz, J.V. and Lawton, E.J., Sciences, 113, 718, (1951)
4. Adler, G., Ballantine, D.S., and Baysal B., J.of Polym.Sci., 48, 198, (1954)
5. Restaiona, A.J., Mesrobian, R.B., Morawetz, H., Ballatine, D.S., Dienes, G.J.
and Metz, D.J, J.A.Chem. Soc., 78,2939, (1956)
6. Lawton, E.J. Grubb, W.T. and Balwit, J.S., J.S., J.Polymer sci., 19, 455,
(1956)
7. Morowetz, H. and Rubin, I.D., J.Polym.Sci., 57, 669, (1962)
8. Lando, J. B., Morowetz H., I.D., J. Polymer Sci., C4, 789, (1963)
9. Charlesby, C. A., Morris, J., Proc. Roy. Soc.A., 281, 392, (1964)
10. Adler, G. and Reams, W., J. Chem.Phys., 32, 1698, (1960)
75
11. Adler , G., Ballantine, D.S. and Baysal, B., J. Polym. Sci., 48, 195, (1960)
12. Usanmaz, A., Turk. J. Chem.,21, 304-312, (1997)
13. Bamford, C.H., Eastmond, G.C. and Ward, G.C., Proc. Roy. Soc. (London),
271, 357, (1967)
14. Bunn, C.W., Nature, 161, 929, (1948)
15. Natta, G. and Carradini, P., J. Polym. Sci., 20,251, (1956)
16. Natta, G., Carradini, P. And Allegra, G., Atti. Acad. Naz. Lincei, Rend., 31,
350, (1961)
17. Hayashi, K., Isotopes and Radiation 3, 416, (1960)
18. Hayashi, K., Isotopes and Radiation 3, 510, (1960)
19. Hayashi, K., Isotopes and Radiation 3, 346, (1960)
20. Hasegawa, M. And Suzuki, Y.Y ., J. Polym. Sci., B-5, 813, (1967)
21. Usanmaz, A., and Melad, O.K., J.Polym.Sci., Part A., Polym. Chem., 34,
1087, (1996)
22. Masayuki, A., J. of Applied Polym. Sci., 33, 1793-1807 (1987)
23. Usanmaz, A. and Yılmaz, E.,J. Macromol., Sci- Chem., A-24(5), 479-491,
(1987)

76
24. Nasimova, I. R., Evlanova, Makhaeva, E. E.,Khokhlov, A. R., Journal of
Applied Polymer Science, 81, 12, 2838-2842, (2001)
25. Tishchenko, G. N., Zhukhlistova, N. E., Kirsh, Yu. E., Crystallography
Reports, 42, 4, 626-630, (1997)
26. Kirsh,Yu. E., Yanul, N. A., Kalninsh, K. K.,European Polymer Journal, 35,
305-316, (1999)
27. Andy, C.W., Lau, C.W., Macromolecules., 32, 581, (1999)
28. Laukkanen, A., Ph.D. Thesis, University of Helsinki, (2005)
29. Cheng, S. C., Feng, W., Pashikin, I.I., Yuan, L. H., Deng, H. C., Zhou, Y.,
Radiation Physics and Chemistry, 63, 517-519, (2002)
30. Lozinsky, V. I., Simenel, I. A., Kurskaya, E. A., Kulakova, V. K., Galaev, I.
Yu., Mattiasson, B., Grinberg, V. Ya., Grinberg, N. V., Khokhlov, A. R.,
Polymer, 41, 6507-6518, (2000)
31. Gao, Y., Steve, C. F., Au-Yeung, Chi Wu, Macromolecules, 32, 3674-3677,
(1999)
32. Morgret, L. D., Hinkley, J. A., NASA/TM-2004-212992, (2004)
33. Peng, S., Chi Wu, J. Phys. Chem. B ,105, 2331-2335, (2001)

77
34. Ivanov, A. E., Kazakov, S. V., Galaev, I. Yu., Mattiasson, B., Polymer, 42,
3373-3381, (2001)
35. Solomon, O. F., Corciovei, M., Ciuta, I., Boghina, C., J. Appl. Pol. Sci. 12(8),
1835, (1968)
36. Anufrieva, E. V., Gromova, R. A., Kirsh, Yu. E., Yanul, N. A., Krakovyak,
M. G., Lushchik, V. B., Pautov, V. D., Sheveleva, T. V., Eur. Polym. J. 37
323-328, (2001)
37. Kudryavtsev, Val. N., Kabanov, V. Ya., Yanul, N. A., Kedik, S. A.,
Radiation Chemistry, 37, 6, 382-388, (2003)
38. Mamytbekov, G., Bouchal, K., Ilavsky, M., Eur. Polym. J., 35, 1925-1933,
(1999)
39. Makhaeva, E. E., Tenhu, H., Khokhlov, A. R., Polymer, 41, 9139-9145,
(2000)
40. Lebedev, V. T., Török, Gy., Cser, L., Kali, Gy., Kirsh, Yu. E., Sibilev, A. I.,
Orlava, D. N., Physica B, 297, 50-54, (2001)
41. Alexander, Leroy E., X-Ray Diffraction Methods in Polymer Science New
York, Wiley –Interscience, (1969)
78
42. Ghassempour, A., Najafi, N. M., Amiri, A. A., J. Anal. Appl. Pyrolysis, 70,
251-261, (2003)
43. Radovic, B. S., Goodacre, R., Anklam, E., J. Anal. Appl. Pyrolysis, 60, 79-
87, (2001)
44. Fazlıoglu, H., Hacaloglu, J., J. Anal. Appl. Pyrolysis, 63, 327-338, (2002)
45. Gozet, T., Onal, A. M., Hacaloglu, J., Synthetic Metals, 135-136, 453-454,
(2003)
46. Badawy, S. M., Radiation Physics and Chemistry, 61, 143-148, (2001)