polymer nanocomposite processing, characterization and...
TRANSCRIPT

Na
nom
ate
ria
lsPolymer Nanocomposite Processing, Characterization and Applications 2011
Guest Editors: Gaurav Mago, Dilhan M. Kalyon, and Sadhan C. Jana
Journal of Nanomaterials

Polymer Nanocomposite Processing,Characterization and Applications 2011

Journal of Nanomaterials
Polymer Nanocomposite Processing,Characterization and Applications 2011
Guest Editors: Gaurav Mago, Dilhan M. Kalyon,and Sadhan C. Jana

Copyright © 2011 Hindawi Publishing Corporation. All rights reserved.
This is a special issue published in “Journal of Nanomaterials.” All articles are open access articles distributed under the Creative Com-mons Attribution License, which permits unrestricted use, distribution, and reproduction in any medium, provided the original workis properly cited.

Editorial Board
Katerina Aifantis, GreeceNageh K. Allam, USAMargarida Amaral, PortugalXuedong Bai, ChinaEnrico Bergamaschi, ItalyTheodorian Borca-Tasciuc, USAC. Jeffrey Brinker, USAChristian Brosseau, FranceXuebo Cao, ChinaSang-Hee Cho, Republic of KoreaShafiul Chowdhury, USACui ChunXiang, ChinaMiguel A. Correa-Duarte, SpainShadi A. Dayeh, USAAli Eftekhari, USAClaude Estournes, FranceAlan Fuchs, USALian Gao, ChinaRussell E. Gorga, USAHongchen Chen Gu, ChinaMustafa O. Guler, TurkeyJohn Zhanhu Guo, USASmrati Gupta, GermanyMichael Harris, USAZhongkui Hong, USAMichael Z. Hu, USADavid Hui, USAY.-K. Jeong, Republic of KoreaSheng-Rui Jian, TaiwanWanqin Jin, ChinaRakesh K. Joshi, IndiaZhenhui Kang, China
Fathallah Karimzadeh, IranDo Kyung Kim, Republic of KoreaKin Tak Lau, AustraliaBurtrand Lee, USABenxia Li, ChinaJun Li, SingaporeShijun Liao, ChinaGong Ru Lin, TaiwanJ.-Y. Liu, USAJun Liu, USATianxi Liu, ChinaSongwei Lu, USADaniel Lu, ChinaJue Lu, USAEd Ma, USAGaurav Mago, USASanjay R. Mathur, GermanyNobuhiro Matsushita, JapanA. McCormick, USAVikas Mittal, UAEWeihai Ni, GermanySherine Obare, USAEdward Andrew Payzant, USAKui-Qing Peng, ChinaAnukorn Phuruangrat, ThailandUgur Serincan, TurkeyHuaiyu Shao, JapanDonglu Shi, USASuprakas Sinha Ray, South AfricaVladimir Sivakov, GermanyMarinella Striccoli, ItalyBohua Sun, South Africa
Saikat Talapatra, USANairong Tao, ChinaTitipun Thongtem, ThailandSomchai Thongtem, ThailandValeri P. Tolstoy, RussiaTsung-Yen Tsai, TaiwanTakuya Tsuzuki, AustraliaRaquel Verdejo, SpainMat U. Wahit, MalaysiaShiren Wang, USAYong Wang, USACheng Wang, ChinaZhenbo Wang, ChinaJinquan Wei, ChinaChing Ping Wong, USAXingcai Wu, ChinaGuodong Xia, Hong KongZhi Li Xiao, USAPing Xiao, UKShuangxi Xing, ChinaYangchuan Xing, USAN. Xu, ChinaDoron Yadlovker, IsraelYing-Kui Yang, ChinaKhaled Youssef, USAKui Yu, CanadaHaibo Zeng, ChinaTianyou Zhai, JapanRenyun Zhang, SwedenYanbao Zhao, ChinaLianxi Zheng, SingaporeChunyi Zhi, Japan

Contents
Polymer Nanocomposite Processing, Characterization and Applications 2011, Gaurav Mago,Dilhan M. Kalyon, and Sadhan C. JanaVolume 2011, Article ID 917474, 1 page
Preparation, Characterization, and Properties of Polyurethane-Grafted Multiwalled Carbon Nanotubesand Derived Polyurethane Nanocomposites, Tzong-Liu Wang, Chin-Chung Yu, Chien-Hsin Yang,Yeong-Tarng Shieh, Yu-Zen Tsai, and Na-Fu WangVolume 2011, Article ID 814903, 9 pages
A Comparative Study of Dispersion Techniques for Nanocomposite Made with Nanoclays and anUnsaturated Polyester Resin, Farida Bensadoun, Nadir Kchit, Catherine Billotte, Francois Trochu,and Edu RuizVolume 2011, Article ID 406087, 12 pages
Thermal Behavior with Mechanical Property of Fluorinated Silane Functionalized SuperhydrophobicPullulan/Poly(vinyl alcohol) Blends by Electrospinning Method, Mohammad Rezaul Karim andMd. Shahidul IslamVolume 2011, Article ID 979458, 7 pages
New Resistive Switching and Self-Regulating Heating in Foliated Graphite/Nickel Polyvinyl ChlorideNanocomposites, Omar A. Al-Hartomy, Falleh Al-Salamy, A. A. Al-Ghamdi, Attieh A. Al-Ghamdi,A. M. Abdel Daiem, and Farid El-TantawyVolume 2011, Article ID 694879, 10 pages
Influence of Silanization Treatment on Thermomechanical Properties of Multiwalled CarbonNanotubes: Poly(methylmethacrylate) Nanocomposites, Carlos Velasco-Santos,Ana Laura Martinez-Hernandez, Witold Brostow, and Victor M. CastanoVolume 2011, Article ID 928659, 9 pages
Nanofibrous Resonant Membrane for Acoustic Applications, K. KalinovaVolume 2011, Article ID 265720, 6 pages
Electrical Properties of Zn-Phthalocyanine and Poly (3-hexylthiophene) Doped Nematic Liquid Crystal,Y. Karakus, M. Okutan, A. Kosemen, S. E. San, Z. Alpaslan, and A. DemirVolume 2011, Article ID 729085, 5 pages

Hindawi Publishing CorporationJournal of NanomaterialsVolume 2011, Article ID 917474, 1 pagedoi:10.1155/2011/917474
Editorial
Polymer Nanocomposite Processing, Characterization andApplications 2011
Gaurav Mago,1 Dilhan M. Kalyon,2 and Sadhan C. Jana3
1 Department of Mechanical Engineering, Stevens Institute of Technology, Hoboken, NJ 07030, USA2 Highly Filled Materials Institute and Department of Chemical Engineering and Materials Science, Stevens Institute of Technology,Hoboken, NJ 07030, USA
3 Department of Polymer Engineering, The University of Akron, 250 South Forge Street, Akron, OH 44325, USA
Correspondence should be addressed to Gaurav Mago, [email protected]
Received 14 December 2011; Accepted 14 December 2011
Copyright © 2011 Gaurav Mago et al. This is an open access article distributed under the Creative Commons Attribution License,which permits unrestricted use, distribution, and reproduction in any medium, provided the original work is properly cited.
There is a growing interest in the incorporation of nanopar-ticles into polymers to improve various functional proper-ties (such as mechanical, thermal, optical, magnetic, andelectrical properties). However, the ultimate properties ofnanocomposites are affected by a large number of factorsincluding the microstructural distributions that are gen-erated during nanocomposite processing. While significantwork has been done on preparation and properties ofpolymer nanocomposites, the interrelationship between pro-cessing, morphology, and functional properties of nanocom-posites is complex and needs further elucidation. Further-more, the effective utilization of nanoparticles in polymersdepends strongly on the ability to disperse the nanoparticlesuniformly throughout the polymeric matrices especiallywithout reducing their aspect ratios. An understandingof the relationship between processing, morphology, andfunctional properties of nanocomposites will be very helpfulin optimizing the overall properties of nanocomposites aswell as improving the models for predicting the propertiesof nanocomposite systems. Such knowledge will facilitate thegeneration and optimization of polymeric nanocompositeswith better tailored ultimate properties.
Considering the challenges in the area of developmentof adequate methods of processing for nanocomposites, weinvited research articles to this special issue with a specialfocus on the interrelationships between polymer nanocom-posite processing, characterization, and novel applications.This special issue with a total of seven papers covers a widerange of areas related to covalent functionalization of carbonnanotubes (CNTs) with polyurethane segments to improve
the dispersion and mechanical properties; silanization ofCNTs to improve interaction at the interface to allow betterload transfer between matrix and nanoparticles; rheologicalcharacterization of nanoclay dispersions in nanocompositesprepared via different processing methods such as sonication,manual mixing, or high shear mixing; electrospinningto produce nanofibrous resonant membranes for acous-tic applications; superhydrophobic membranes preparedvia electrospinning from fluorinated silane-functionalizedpullulan/poly(vinyl alcohol) blends; electrical properties ofdoped nematic liquid crystals; and finally, the preparation ofpolymer nanocomposites with graphite and nickel nanopar-ticles for potential applications in positive temperaturecoefficient of resistance devices, self-regulating heater, andtemperature sensors.
It is hoped that this special issue will help readers witha wide range of backgrounds to understand the impact ofvarious processing methods as well as nanoparticles on thenanocomposite properties and applications.
Acknowledgments
The editors would like to acknowledge the invited and con-tributing authors, reviewers, and staff members of HindawiPublisher.
Gaurav MagoDilhan M. Kalyon
Sadhan C. Jana

Hindawi Publishing CorporationJournal of NanomaterialsVolume 2011, Article ID 814903, 9 pagesdoi:10.1155/2011/814903
Research Article
Preparation, Characterization, and Properties ofPolyurethane-Grafted Multiwalled Carbon Nanotubes andDerived Polyurethane Nanocomposites
Tzong-Liu Wang,1 Chin-Chung Yu,2 Chien-Hsin Yang,1 Yeong-Tarng Shieh,1
Yu-Zen Tsai,3 and Na-Fu Wang3
1 Department of Chemical and Materials Engineering, National University of Kaohsiung, Kaohsiung 811, Taiwan2 Department of Applied Physics, National University of Kaohsiung, Kaohsiung 811, Taiwan3 Department of Electronics, Cheng Shiu University, Kaohsiung County 833, Taiwan
Correspondence should be addressed to Tzong-Liu Wang, [email protected]
Received 15 July 2011; Accepted 3 October 2011
Academic Editor: Gaurav Mago
Copyright © 2011 Tzong-Liu Wang et al. This is an open access article distributed under the Creative Commons AttributionLicense, which permits unrestricted use, distribution, and reproduction in any medium, provided the original work is properlycited.
We incorporated hydroxyl groups into the polyurethane backbone and then used the “grafting to” approach to functionalizethe multiwalled carbon nanotubes (MWNTs) via the esterification reaction between MWNTs and segmented polyurethanes(PUs). X-ray photoelectron spectroscopy (XPS) spectra showed that the sidewalls of MWNTs had been functionalized withacid treatment, and the amount of COOH increased with increasing acid treatment time. FTIR spectra further confirmed thatPU was covalently attached to the sidewalls of MWNTs. The functionalized acid amount and the grafted PU amount weredetermined by thermogravimetric analyses (TGAs). Comparative studies based on SEM images of the PU-functionalized andchemically defunctionalized MWNT samples also revealed the covalent coating character. Dynamic mechanical analysis (DMA) ofnanocomposite films prepared from PU and PU-functionalized MWNTs showed enhanced mechanical properties and increasedsoft segment Tg . Tensile properties indicated that PU-functionalized MWNTs were effective reinforcing fillers for the polyurethanematrix.
1. Introduction
In recent decades, polymer-carbon nanotube composite ma-terials have attracted much attention for their potential ap-plications in unique lightweight materials with distinctly su-perior mechanical, thermal, and electronic properties [1–4].This can be attributed to the fascinating electronic, thermal,and mechanical properties of carbon nanotubes (CNTs) [5,6]. With extremely high mechanical strength and chemicalstability, CNTs represent attractive possibilities for develop-ing ultrastrong composite materials [7, 8]. The effective util-ization of CNTs in nanocomposite applications dependsstrongly on the ability to disperse the CNTs homogeneouslythroughout a matrix without destroying the integrity of theCNTs. The CNTs can offer a kind of nanosize reinforcementwith a light weight, a hollow-core immerse aspect ratio,and an exceptionally high axial strength. Hence, significant
efforts have been made in the fabrication of these nano-composites by dispersing either single-walled (SWNT) ormultiple-walled (MWNT) carbon nanotubes into variouspolymer matrices.
However, the manipulation and processing of CNTs havebeen limited by their insolubility in most common solvents[9]. By functionalization or modification of nanosurfaces ofCNTs, it has unlocked a new era in the development andapplications of CNTs containing hybrid nanomaterials [10–12]. This can be generally fulfilled by the “grafting to” [13–16] and “grafting from” [17–20] approaches. Some experi-mental studies on CNT-reinforced polymer composites havebeen reported for various kinds of organic polymers, includ-ing polyethylene [21, 22] polypropylene [23], poly(meth-yl methacrylate) [24, 25], polystyrene [26], pitch [27], andepoxy [28, 29], with enhanced mechanical and electrical pro-perties. More recently, polyurea-functionalized CNTs have

2 Journal of Nanomaterials
4+2 OCN NCO
DMF
N
H
1
n
Et
85–90◦C, 3 hr
Cl
∗
CH2OH
H2
H2
PUT100◦C, 24 hr
∗
PUT m
HOCH2C O
XNCO NCO
DMF
85–90◦C, 3 hr+
C
O
C
C
m
O
C
H
N
H O
O OC C C CH2
+
CH2OH
1
H2
hP hPhPhP N
H O
O OCH2C
4
O
C N
HH2C
PUT
H2C
H2C CHO OH
Et
CH2OH
TMP
:
X
−HCl
O
∗
Scheme 1: Synthetic route for the functionalization of MWNTs with segmented polyurethanes (PUT).
also been prepared via an in situ polycondensation approach[30]. In a similar manner, polyurethane-functionalizedSWNTs have also been prepared through a two-step reaction[31]. However, Gao’s and Xia’s approaches could not be usedin the preparation of segmented polyurethane elastomersfunctionalized carbon nanotubes, because polyurethane elas-tomers must be prepared through a prepolymer technique.In addition, although Kwon and Kim reported dispersion ofCNTs in a waterborne polyurethane matrix [32, 33], the dis-persion of carbon nanotubes in the polyurethane elastomermatrix was only through a noncovalent solution blending.
Elastomeric thermoplastic block copolymers are typicallymicrophase-separation materials containing two types ofsegments in their molecular architecture. It was expectedCNTs functionalized with polyurethane elastomers (i.e., seg-mented copolyurethanes or polyurethane block copolymers)via a covalent bonding would be more compatible withpolyurethane elastomer matrices and hence could reinforcepolyurethane elastomers. Since polyurethane block copoly-mers are a class of high-performance materials for versatileend use, nanocomposites prepared from polyurethane elas-tomers reinforced with CNTs may extend its application invarious fields.
In a previous report, we have presented a methodology tobind as-prepared segmented polyurethanes to CNTs via the“grafting to” approach [34]. In this work, we incorporatedhydroxyl groups into the polyurethane backbone and thenused the “grafting to” approach to functionalize the MWNTsvia the esterification reaction between MWNTs and PU. Thesegmented polyurethanes with hydroxyl groups pendant onthe chain extender were synthesized by the conventional pre-polymer technique. The functionalized CNTs and MWNT-PU nanohybrids have been characterized to confirm thecovalent linkage. In addition, results from the fabrication
280 285 290 295
MWNT
Inte
nsi
ty(c
oun
ts)
Binding energy (eV)
NT-COOH-8
NT-COOH-24–C–O
–C(=O)–OH
–C–O–C(=O)–OH
–C–O –C(=O)–OH
C–C/C=C
C–C/C=C
C–C/C=C
Figure 1: High-resolution XPS spectra of crude MWNTs and acid-treated MWNTs with different treatment times.
and characterization of the polyurethane-carbon nanotubenanocomposite films are presented and discussed.
2. Experimental
2.1. Materials. The MWNTs used in this work were pur-chased from Desunnano Co., Ltd.; the purity is higher than95%. Thionyl chloride (SOCl2) was obtained from Aldrichand used as received. 4,4′-Methylenebis(phenyl isocyanate)(MDI, Aldrich), methyl isobutyl ketone (MIBK, HayashiChemicals), N,N-dimethylformamide (DMF, Tokyo Chem-icals), ethyl acetate (EA, Tokyo Chemicals), and dimethylsulfoxide (DMSO, Nacalai Tesque, Inc.) were distilled under

Journal of Nanomaterials 3
reduced pressure. 1,1,1-Tris(hydroxymethyl)propane (TMP,Fluka) and tetrahydrofuran (THF, Tokyo Chemicals) wereused as received. Poly(tetramethylene ether glycol) (PTMG,Mn = 1000) was degassed in vacuo at 55◦C and 600 Pa(4.5 mmHg) for 3 h to remove any absorbed water. Nitricacid (EP grade), and sulfuric acid (EP grade) were purchasedfrom Nihon Shiyaku Industries, Ltd. and used as received.
2.2. Synthesis of the Segmented Polyurethane Elastomer (PUT).The preparation method of the segmented polyurethaneelastomer carrying a pendant hydroxyl group in the chainextender has been described in our previous article [34].GPC (DMF): Mn = 31, 300 g/mol, Mw = 51, 000 g/mol,and PDI = 1.63. The reaction is given in Scheme 1. Forconvenience, this polymer is designated as PUT.
2.3. Acid Treatment and Acylation of MWNTs. The detailprocedures have been published previously [34]. The sam-ples (MWNT-COOH) obtained for acid treatment of 8 and24 h were designated as NT-COOH-8 and NT-COOH-24,respectively. After acylation, the samples (MWNT-COCl)were washed with purified EA three times and ready foresterification with PUT.
2.4. Esterification of Acylated MWNTs with PUT. 0.2 g ofas-prepared MWNT-COCl was immediately reacted with1.0 g of PUT at 100◦C for 24 h, obtaining PUT-graftedMWNTs after repeated centrifugation at 7500 rpm, washing,and vacuum drying. The products (MWNT-PUT) preparedfrom acylation of NT-COOH-8 and NT-COOH-24 weredesignated as NT-PUT-8 and NT-PUT-24, respectively.
2.5. Preparation of Nanocomposite Films. In a typical exper-iment, the matrix PUT (4 g) was dissolved in DMF (16 mL)to form a homogeneous solution. To the solution was add-ed dropwise a DMF solution of PUT-functionalized carbonnanotubes (NT-PUT-8) under constant stirring. The result-ing solution was cast onto a glass substrate and dried at50◦C for 48 h. In this study, three different compositions,that is, 1 wt%, 5 wt%, and 10 wt% of NT-PUT-8 based on theoriginal amount of PUT (4 g) were prepared for comparison.The composite films were designated as PUT/NT-PUT-8-1,PUT/NT-PUT-8-5, and PUT/NT-PUT-8-10, respectively.
2.6. Characterization. Infrared spectra of samples were ob-tained using a Bio-Rad FTS 165 Fourier transform infraredspectrometer. The spectra were obtained over the frequencyrange of 4000 to 400 cm−1 at a resolution of 4 cm−1.
XPS surface analysis was carried out using a VG Instru-ments X-ray photoelectron spectrometer. Mg-Kα radiationwas used as the X-ray source and the photoelectron peaks (inthe wide-scan spectra) from the samples were numericallyfitted using Lorentzian curves with an integral backgroundsubtraction and analyzed at an angle of 45◦ to the surface.The adventitious C(1s) signal at 284.6 eV was used to cali-brate the charge-shifted energy scale.
Thermogravimetric analysis (TGA) experiments werecarried out on samples placed in a platinum sample pan
4000 3500 3000 2500 2000 1500 1000 500
Tran
smit
tan
ce
Wavenumber (cm−1)
PUT
NT-PUT-8
NT-PUT-24
Figure 2: FTIR spectra of PUT, NT-PUT-8, and NT-PUT-24.
200 400 600 800 10000
20
40
60
80
100
Wei
ght
(%)
Temperature (◦C)
MWNTNT-COOH-8NT-COOH-24
PUTNT-PUT-8NT-PUT-24
Figure 3: TGA weight loss curves of crude MWNTs, acid-treatedMWNTs, and PUT-functionalized MWNTs under a nitrogen at-mosphere.
using a TA Instruments SDT-2960 analyzer. Products rangingfrom 4 to 5 mg were loaded into the platinum pan and sealedin the sample chamber. The samples were heated from 50◦Cto 900◦C under a nitrogen atmosphere at a heating rate of10◦C/min.
Scanning electron microscopy (SEM) images were re-corded using a Hitachi S-4800 field-emission microscope,and the samples were precoated with a homogeneous goldlayer by sputtering technology.
Dynamic mechanical analysis (DMA) was performed ona Perkin Elmer DMA7e unit with an operating temperaturerange of −100∼50◦C. The heating rate was set at 5◦C/min.The sample size was approximately 5.5 × 1.5 × 0.5 mm3.
Stress-strain data of nanocomposite films were obtainedusing a Universal Testing Machine (Shimadzu AGS-500ASeries) with a 10 kg load cell and film grips. The crosshead

4 Journal of Nanomaterials
20 40 60 80 100 120 140
Diameter (nm)
79.7± 17.5 nm
10 kV 11.8 mm ×20 k 20 : 58 2 μm
(a)
58.1± 14.5 nm
13 : 1710 kV 11.8 mm ×20 k 2 μm
20 40 60 80 100 120 140
Diameter (nm)
(b)
85.5± 22.9 nm
Acc.V Spot magn De t WD Exp 1 μm15 3 2000x SE 9. 9 1 FESE M 9 4042 5kV
20 40 60 80 100 120 140
Diameter (nm)
(c)
61.3± 13.4 nm
13 : 3110 kV 12 mm ×20 k 2 μm
20 40 60 80 100 120 140
Diameter (nm)
(d)
Figure 4: SEM micrographs of PUT-functionalized and chemically defunctionalized MWNT samples. (a) NT-PUT-8. (b) NT-PUT-8 def-unctionalized at 900◦C for 2 h. (c) NT-PUT-24. (d) NT-PUT-24 defunctionalized at 900◦C for 2 h.

Journal of Nanomaterials 5
100 200 300 400 500 600 7000
20
40
60
80
100
PUTPUT/NT-PUT-8 1
PUT/NT-PUT 5PUT/NT-PUT 10
Wei
ght
(%)
Temperature (◦C)
--8--8-
Figure 5: TGA weight loss curves of PUT and PUT/NT-PUT-8 na-nocomposites under a nitrogen atmosphere.
speed was 20 mm/min. Measurements were made at roomtemperature using a 1.2 × 0.4 cm2 dumbbell sample.
3. Results and Discussion
3.1. X-Ray Photoelectron Spectroscopy (XPS) Analysis of Acid-Treated MWNTs. In our previous article, Raman spectro-scopy has showed that the suitable time of acid treatment wasca. 8 h [34]. Therefore, our polymeric carbon nanocompos-ites discussed here and after were all prepared from NT-PUT-8 in view of processing and application.
In the present study, electron spectroscopy for chemicalanalysis (i.e., XPS) was further used to provide qualitativeand quantitative information about the elemental composi-tion of acid-treated MWNTs [35, 36]. In the high-resolutionspectra of C(1s), as shown in Figure 1, it is evident thatthe C(1s) core level spectra of acid-treated MWNTs consistof three well-resolved peaks after curve-fitting. The majorpeak, referenced to 284.6 eV (C–C or C=C), is ascribed asunsubstituted aromatic carbon in carbon nanotubes. Thepeak shifted approximately 0.7 eV (i.e., at 285.3 eV) towardthe higher binding energy side of the main peak correspondsto the carbon singly bound to oxygen (C–O). This is probablydue to the residual oxygen after the purification step ofpristine MWNTs or ether-type oxygen (–C–O–) of COOH.The small peak, present at 288.8 eV, can be attributed to thecarbon double-bonded (C=O) to oxygen in the carboxylicacid groups. The quantitative results of XPS are listed inTable 1. The higher surface oxygen content for the carboxylicacid functionalized MWNTs, NT-COOH-8, and NT-COOH-24, in comparison with that of the pristine materials, isevidence of COOH groups on the MWNT surface.
3.2. Synthesis and Characterization of MWNT-PolyurethaneNanohybrids. Through the “grafting to” approach, theMWNTs were functionalized by grafting polyurethane to the
Table 1: (1) XPS peak position (in eV) and (2) percentage (in atom-%) from high-resolution C(1s) spectra of crude MWNTs and acid-treated MWNTs.
Sample C–C/C=C C–O C(=O)–OH
MWNT(1) 284.6 eV 285.4 eV 288.6 eV
(2) 76.65% 16.55% 6.80%
NT-COOH-8
(1) 284.6 eV 285.3 eV 289.1 eV
(2) 42.57% 33.44% 23.99%
NT-COOH-24
(1) 284.6 eV 285.3 eV 288.7 eV
(2) 39.74% 34.05% 26.21%
sidewalls of MWNTs (Scheme 1). The chemical structureof the resulting MWNT-polyurethane nanohybrids is alsoillustrated in Scheme 1. It is noteworthy that the adsorbedpolyurethane can be efficiently removed from the productsby filtration and washing as mentioned in Section 2. From IRmeasurements for the upper layer of DMF solution, collectedby centrifuging (1 h at a rate of 7500 rpm) of MWNT-PUTsamples from the solution it is shown that no polyurethanesignals appeared in the spectrum. This indicates that theadsorbed polymer quantity is negligible. Therefore, the“grafting to” approach presented here promised the graftingof polyurethanes onto CNT surfaces with some extent ofcontrol.
The molecular composition of the resulting MWNT-pol-yurethane nanohybrids was confirmed by FTIR measure-ments. The IR spectra of NT-PUT-8 and NT-PUT-24 areshown in Figure 2. For both samples, the characteristic ab-sorption peaks of polyurethane such as –CH2–, NHCOO–,and C–O–C, and clearly appear at 2930/2853, 1730,1100 cm−1, respectively. The benzene-ring C=C absorptionpeak from MDI is at ca. 1600 cm−1, while the peaks at1530 cm−1 and 1220 cm−1 correspond to C–N of urethanegroups. This spectrum clearly shows that PUT has been graft-ed to MWNTs successfully.
In general, polymer-functionalized CNTs would showmuch higher solubility or better dispersibility as comparedwith pristine nanotubes. Herein, as polyurethane is polar,our resulting samples of MWNT-polyurethane are readilydispersed in polar organic solvents such as DMSO, DMF,1-methyl-2-pyrrolidinone (NMP), and N,N-dimethyl aceta-mide (DMAc). The clear, gray solutions from the solublesamples are stable, without any precipitations over time.
3.3. Thermal Analysis of the Resulting MWNT-PolyurethaneNanohybrids. In order to obtain the grafted amount of poly-urethane on MWNTs, thermal analyses of MWNT-PUT pre-pared from MWNTs with different times of acid treatment(8 h and 24 h) were carried out. The thermal stability forcrude MWNTs and functionalized MWNTs in nitrogen isillustrated in Figure 3. As seen in the figure, the TGAcurves display a two-step degradation mechanism for PUT,NT-PUT-8, and NT-PUT-24, which is quite different withthe one-step degradation mechanism of MWNT and acid-treated MWNTs (MWNT-COOH, i.e., NT-COOH-8 andNT-COOH-24). It is obvious that PUT has been grafted

6 Journal of Nanomaterials
PUTPUT/NT-PUT-8 1
PUT/NT-PUT 5PUT/NT-PUT 10-
-8--8-
−100 −80 −60 −40 −20 0 20 40
1E7
1E8
1E9
Stor
age
mod
ulu
s(P
a)
Temperature (◦C)
(a)
PUTPUT/NT-PUT-8 1
PUT/NT-PUT 5PUT/NT-PUT 10-
-8--8-
−100 −80 −60 −40 −20 0 20 40
Temperature (◦C)
0
0.1
0.2
0.3
0.4
0.5
0.6
0.7
Tanδ
(b)
Figure 6: Temperature dependence of (a) storage modulus (E′); (b) loss tangent (tan δ) for PUT and PUT/NT-PUT-8 composite films.
onto the sidewalls of MWNTs. In the MWNT-COOH case,there is a continuous but not very obvious decrease inweight, which is typical for acid functionalized MWNTs. Incomparison with the curves of MWNTs and acid-treatedMWNTs, the rapid degradation stage in NT-PUT-8 andNT-PUT-24 may arise due to the decomposition of graftedPUT. As compared to crude MWNTs, the functionalizedacid amount could be calculated by the subtraction of charyields of acid-treated MWNTs from pristine MWNT. Thus,the functionalized acid amounts for NT-COOH-8 and NT-COOH-24 are 10.0 and 12.2%, respectively. It is evident thatthe increased acid amount after acid treatment for 8 h is notmuch, demonstrating that longer acid-treated time may benot necessary. Therefore, to save the processing time for theapplication, our nanocomposites were only prepared fromNT-PUT-8 nanohybrid. In addition, the grafted amounts ofPUT were also obtained. According to the TGA traces, thePUT contents in the NT-PUT-8 and NT-PUT-24 samplesare approximately 35.6% and 42.2%, respectively. It wasfound that the longer acid treatment time results in a highergrafted amount of PUT. This further confirms the successfulfunctionalization of MWNTs.
3.4. Morphology of the MWNT-Polyurethane Nanohybrids.The fine nanostructures of the as-prepared MWNT-poly-urethane nanohybrides were investigated by SEM. As shownin Figures 4(a) and 4(c), MWNTs were coated by a layerof polymer chains. From the SEM images of the PUT-grafted MWNT samples, we can clearly discern that thehigher the quantity of the grafted polymer, the thicker thepolymer shells. The calculated diameters for NT-PUT-8 andNT-PUT-24 are ca. 79.7 and 85.5 nm, respectively. Afterheat treatment of NT-PUT-8 and NT-PUT-24 at 900◦C for2 h, the defunctionalized tube surfaces are relatively smoothand clean (Figures 4(b) and 4(d)), obviously different fromthose of the polyurethane-functionalized MWNTs. The tube
diameters are ca. 58.1 and 61.3 nm, respectively, being closeto the diameter of pristine MWNTs.
3.5. Preparation and Thermal Analysis of Polyurethane Nano-composites. In this research, MWNTs were functionlalizedwith PUT in order to be more compatible with the poly-mer matrix, PUT, of the nanocomposites. Due to the ure-thane groups of PUT, there are strong intermolecular inter-actions arising from the hydrogen bondings between PUTand MWNT-PUT nanohybrids, resulting in high compatibi-lity between both components. The common solubility ofthe PUT-functionalized carbon nanotubes and the matrixPUT also makes the solution casting easier. The compat-ibility of the PUT-functionalized carbon nanotubes withpolyurethane and the dispersion of the nanotubes in poly-urethane matrix were evaluated via the fabrication of na-nocomposite thin films. The PUT-functionalized carbon na-notubes used in this study are NT-PUT-8 as mentionedpreviously. In a typical experiment, a calculated amount ofNT-PUT-8 (w/w) based on PUT matrix was dissolved inDMF and added to a PUT solution. For comparison, 1, 5,and 10 wt% of NT-PUT-8 based on 100 wt% of PUT wereused as the reinforcing fillers. The nanocomposites preparedfrom PUT reinforced with the aforementioned amounts ofNT-PUT-8 were designated as PUT/NT-PUT-8-1, PUT/NT-PUT-8-5, and PUT/NT-PUT-8-10, respectively. The result-ing composite solution was allowed to settle overnight andthen centrifuged to remove any residual insoluble species,followed by being concentrated to attain the desired viscosity.The viscous but transparent solution was used for thecasting of a thin film. The polyurethane-MWNT compositethin film thus obtained is transparent with a high opticalquality. The successful fabrication of optically high-qualitynanocomposite thin films reflects the excellent compati-bility of the PUT-functionalized carbon nanotubes with po-lyurethane. It also serves as initial evidence for the notion

Journal of Nanomaterials 7
Table 2: Composition and physical properties of PUT and PUT/NT-PUT-8 composite films.
SpecimensComposition
(wt%)PUT/NT-PUT-8
Tg (◦C)(soft segment)
Storage modulusat −40◦C (GPa)
Tensile strength(KPa)
Elongation atbreak (%)
PUT 100/0 −26 0.918 180 195
PUT/NT-PUT-8-1 100/1 −24 1.14 286 192
PUT/NT-PUT-8-5 100/5 −19 1.22 344 173
PUT/NT-PUT-8-10 100/10 −17 1.47 675 116
that functionalized carbon nanotubes can be dispersed ho-mogeneously into polymeric matrices. According to TGAresults shown in Figure 5, it is obvious that the thermal sta-bility of nanocomposites increases with increasing amountsof PUT-functionalized carbon nanotubes. As a result, thedegradation temperature (ca. 335◦C) of 10% weight loss forPUT/NT-PUT-8-10 composite is ca. 16◦C higher than thatof neat PUT. In addition, compared to the char yield (ca.3.5%) of neat PUT, the higher char yield (ca. 16.9%) for thiscomposite demonstrates that the effect of enhanced thermalstability due to the PUT-functionalized MWNTs may occur.
3.6. Mechanical Properties of Polyurethane Nanocomposites.Dynamic mechanical analysis (DMA) is most useful forstudying the viscoelastic behavior of polymers. The mechan-ical properties and stiffness of the polyurethane nanocom-posites were then analyzed with DMA. In the polyurethanecomposite, PUT-functionalized MWNTs serve as the rein-forcement and segmented PUT acts as the matrix. Increasingthe amount of NT-PUT-8 in the composite increased thestorage modulus due to stronger intermolecular interactionsbetween MWNT-PUT nanohybrid and PUT. The soft seg-ment Tgs of the three composite films were also obtainedfrom loss tangent of DMA. As shown in Figure 6, thedynamic storage modulus (E′) and loss tangent (tan δ) ofthe PUT/NT-PUT-8 nanocomposite films show enhancedmechanical properties and increased soft segment Tg . Theresults of soft segment Tg of the three composites arelisted in Table 2. The enhanced E′s of PUT/NT-PUT-8nanocomposites are induced from the stiffening effect ofthe CNTs. E′ of the PUT/NT-PUT-8 nanocomposite filmsprepared in this study increases with increasing NT-PUT-8content, which is due to the stiffening effect of the NT-PUT-8. In comparison with the E′ values of PUT, the E′s of thethree nanocomposites are significantly improved, indicatinga strong adhesion between the reinforcement and the matrix.For the convenience of comparison, data of E′ at –40◦C arealso shown in Table 2. Moreover, with increasing NT-PUT-8content, the glass-transition temperature of the soft segmentsof the PUD/NT-PUT-8 nanocomposite films shifts from –26to –17◦C. The increase of soft segment Tg is attributed to theconstraint of polyurethane chains by carbon nanotubes. Thismeans that NT-PUT-8 nanohybrids are compatible with theamorphous regions of the soft segments in PUT matrix.
Figure 7 shows the stress-strain curves of the PUT filmand PUT/NT-PUT-8 nanocomposite films. The results oftensile strength and elongation at break of the PUD/NT-
PUT
0 25 50 75 100 125 150 175 200 2250
100
200
300
400
500
600
700
Stre
ss(K
Pa)
Strain (%)
PUT/NT-PUT- -8 1PUT/NT-PUT 5PUT/NT-PUT 10
- -8- -8
Figure 7: Stress-strain curves for PUT and PUT/NT-PUT-8 com-posite films.
PUT-8 nanocomposite films are also summarized in Table 2.The tensile strengths of the nanocomposite films are en-hanced with 1 wt% to 10 wt% loading of NT-PUT-8 com-pared to the corresponding value of the original PUT film.As the NT-PUT-8 content increased from 1 wt% to 10 wt%,the tensile strength of the PUT/NT-PUT-8 nanocompositefilms increases from 286 to 675 KPa, corresponding to anincreasing ratio of 59 to 275%; however, the elongation atbreak (% of strain) decreased from 192 to 116%. The increaseof tensile strength in the PUT/NT-PUT-8 nanocomposites isdue to the reinforcing effect of NT-PUT-8 in the PUT matrix.
4. Conclusions
MWNTs were covalently functionalized with segmented pol-yurethanes using the “grafting to” technique. The segmentedpolyurethane (PUT) with hydroxyl groups pendant on thepolymer backbone was synthesized by the conventional pre-polymer technique. The functionalized MWNT-COCl wasthen reacted with polyurethane to prepare the MWNT-polyurethane nanohybrids. By XPS analysis, the presence ofC(=O) (1s) for acid-treated MWNTs indicated the successfuloxidization of MWNTs. From the characteristic peaks ofPUT shown in IR spectra, PUT has been grafted to thesurfaces of MWNTs successfully. TGA results indicated that

8 Journal of Nanomaterials
acid treatment time for 8 h might be enough. SEM inves-tigations gave direct evidence of the nanostructures of theMWNT-PUT hybrids. The MWNT-PUT nanohybrids werewell dispersed in the same solvents for neat PU, thus allowingthe intimate mixing of the functionalized nanotubes withthe matrix polymer for the preparation of nanocomposites.Dynamic mechanical analysis showed the storage modulusand the soft segment Tg of the nanocomposites increasedwith increasing NT-PUT-8 content. The tensile strengths ofthe nanocomposite films with different weight ratio loadingof NT-PUT-8 were enhanced by about 59 to 275%, comparedto the corresponding value of the original PUT film.
References
[1] A. L. Martınez-Hernandez, C. Velasco-Santos, and V. M.Castano, “Carbon nanotubes composites: processing, graftingand mechanical and thermal properties,” Current Nanoscience,vol. 6, no. 1, pp. 12–39, 2010.
[2] T. Kashiwagi, E. Grulke, J. Hilding et al., “Thermal and flam-mability properties of polypropylene/carbon nanotube nano-composites,” Polymer, vol. 45, no. 12, pp. 4227–4239, 2004.
[3] W. Bauhofer and J. Z. Kovacs, “A review and analysis of elec-trical percolation in carbon nanotube polymer composites,”Composites Science and Technology, vol. 69, no. 10, pp. 1486–1498, 2009.
[4] B. Fan, X. Mei, K. Sun, and J. Ouyang, “Conducting poly-mer/carbon nanotube composite as counter electrode of dye-sensitized solar cells,” Applied Physics Letters, vol. 93, no. 14,Article ID 143103, 2008.
[5] M. S. Dresselhaus, G. Dresselhaus, and P. C. Eklund, Science ofFullerenes and Carbon Nanotubes, Academic Press, New York,NY, USA, 1996.
[6] R. Saito, M. S. Dresselhaus, and G. Dresselhaus, Physical Prop-erties of Carbon Nanotubes, Imperial College Press, London,UK, 1998.
[7] P. M. Ajayan, L. S. Schadler, C. Giannaris, and A.Rubio, “Single-walled carbon nanotube-polymer composites:strength and weakness,” Advanced Materials, vol. 12, no. 10,pp. 750–753, 2000.
[8] B. Ni and S. B. Sinnott, “Chemical functionalization of car-bon nanotubes through energetic radical collisions,” PhysicalReview B, vol. 61, no. 24, pp. R16343–R16346, 2000.
[9] J. Chen, M. A. Hamon, H. Hu et al., “Solution properties ofsingle-walled carbon nanotubes,” Science, vol. 282, no. 5386,pp. 95–98, 1998.
[10] R. H. Baughman, A. A. Zakhidov, and W. A. De Heer, “Carbonnanotubes—the route toward applications,” Science, vol. 297,no. 5582, pp. 787–792, 2002.
[11] X. Chen and S. P. Armes, “Surface polymerization of hydro-philic methacrylates from ultrafine silica sols in protic mediaat ambient temperature: a novel approach to surface function-alization using a polyelectrolytic macroinitiator,” AdvancedMaterials, vol. 15, no. 18, pp. 1558–1562, 2003.
[12] A. Hirsch, “Functionalization of single-walled carbon nano-tubes,” Angewandte Chemie International Edition, vol. 41, no.11, pp. 1853–1859, 2002.
[13] Y. P. Sun, K. Fu, Y. Lin, and W. Huang, “Functionalized carbonnanotubes: properties and applications,” Accounts of ChemicalResearch, vol. 35, no. 12, pp. 1096–1104, 2002.
[14] R. Czerw, Z. Guo, P. M. Ajayan, Y. P. Sun, and D. L. Carroll,“Organization of polymers onto carbon nanotubes: a route to
nanoscale assembly,” Nano Letters, vol. 1, no. 8, pp. 423–427,2001.
[15] S. Qin, D. Qin, W. T. Ford, D. E. Resasco, and J. E. Herrera,“Functionalization of single-walled carbon nanotubes withpolystyrene via grafting to and grafting from methods,” Mac-romolecules, vol. 37, no. 3, pp. 752–757, 2004.
[16] Y. Lin, B. Zhou, K. A. S. Fernando, P. Liu, L. F. Allard, and Y.P. Sun, “Polymeric carbon nanocomposites from carbon nan-otubes functionalized with matrix polymer,” Macromolecules,vol. 36, no. 19, pp. 7199–7204, 2003.
[17] M. S. P. Shaffer and K. Koziol, “Polystyrene grafted multi-walled carbon nanotubes,” Chemical Communications, no. 18,pp. 2074–2075, 2002.
[18] W. Wu, S. Zhang, Y. Li et al., “PVK-modified single-walled car-bon nanotubes with effective photoinduced electron transfer,”Macromolecules, vol. 36, no. 17, pp. 6286–6288, 2003.
[19] H. Kong, C. Gao, and D. Yan, “Controlled functionalization ofmultiwalled carbon nanotubes by in situ atom transfer radicalpolymerization,” Journal of the American Chemical Society, vol.126, no. 2, pp. 412–413, 2004.
[20] I. C. Liu, H. M. Huang, C. Y. Chang, H. C. Tsai, C. H. Hsu, andR. C. C. Tsiang, “Preparing a styrenic polymer composite con-taining well-dispersed carbon nanotubes: anionic polymeriza-tion of a nanotube-bound p-methylstyrene,” Macromolecules,vol. 37, no. 2, pp. 283–287, 2004.
[21] S. L. Ruan, P. Gao, X. G. Yang, and T. X. Yu, “Toughening highperformance ultrahigh molecular weight polyethylene usingmultiwalled carbon nanotubes,” Polymer, vol. 44, no. 19, pp.5643–5654, 2003.
[22] W. Tang, M. H. Santare, and S. G. Advani, “Melt processingand mechanical property characterization of multi-walled car-bon nanotube/high density polyethylene (MWNT/HDPE)composite films,” Carbon, vol. 41, no. 14, pp. 2779–2785, 2003.
[23] S. A. Gordeyev, F. J. MacEdo, J. A. Ferreira, F. W. J. VanHattum, and C. A. Bernardo, “Transport properties of poly-mer-vapour grown carbon fibre composites,” Physica B, vol.279, no. 1–3, pp. 33–36, 2000.
[24] Z. Jia, Z. Wang, C. Xu et al., “Study on poly(methyl methacry-late)/carbon nanotube composites,” Materials Science and En-gineering A, vol. 271, no. 1-2, pp. 395–400, 1999.
[25] Z. Jin, K. P. Pramoda, G. Xu, and S. H. Goh, “Dynamicmechanical behavior of melt-processed multi-walled carbonnanotube/poly(methyl methacrylate) composites,” ChemicalPhysics Letters, vol. 337, no. 1–3, pp. 43–47, 2001.
[26] D. Qian, E. C. Dickey, R. Andrews, and T. Rantell, “Loadtransfer and deformation mechanisms in carbon nanotube-polystyrene composites,” Applied Physics Letters, vol. 76, no.20, pp. 2868–2870, 2000.
[27] R. Andrews, D. Jacques, A. M. Rao et al., “Nanotube compositecarbon fibers,” Applied Physics Letters, vol. 75, no. 9, pp. 1329–1331, 1999.
[28] L. S. Schadler, S. C. Giannaris, and P. M. Ajayan, “Load transferin carbon nanotube epoxy composites,” Applied Physics Letters,vol. 73, no. 26, pp. 3842–3844, 1998.
[29] J. M. Park, D. S. Kim, J. R. Lee, and T. W. Kim, “Nonde-structive damage sensitivity and reinforcing effect of carbonnanotube/epoxy composites using electro-micromechanicaltechnique,” Materials Science and Engineering C, vol. 23, no.6-8, pp. 971–975, 2003.
[30] C. Gao, Y. Z. Jin, H. Kong et al., “Polyurea-functionalized mul-tiwalled carbon nanotubes: synthesis, morphology, and Ra-man spectroscopy,” Journal of Physical Chemistry B, vol. 109,no. 24, pp. 11925–11932, 2005.

Journal of Nanomaterials 9
[31] H. Xia and M. Song, “Preparation and characterisation of pol-yurethane grafted single-walled carbon nanotubes and derivedpolyurethane nanocomposites,” Journal of Materials Chem-istry, vol. 16, no. 19, pp. 1843–1851, 2006.
[32] J. Kwon and H. Kim, “Comparison of the properties of water-borne polyurethane/multiwalled carbon nanotube and acid-treated multiwalled carbon nanotube composites prepared byin situ polymerization,” Journal of Polymer Science Part A, vol.43, no. 17, pp. 3973–3985, 2005.
[33] J. Kwon and H. Kim, “Preparation and properties of acid-treated multiwalled carbon nanotube/waterborne polyure-thane nanocomposites,” Journal of Applied Polymer Science,vol. 96, no. 2, pp. 595–604, 2005.
[34] T. L. Wang and C. G. Tseng, “Polymeric carbon nanocompos-ites from multiwalled carbon nanotubes functionalized withsegmented polyurethane,” Journal of Applied Polymer Science,vol. 105, no. 3, pp. 1642–1650, 2007.
[35] D. A. Skoog and F. J. Holler, Principles of Instrumental Analysis,Saunders, Philadelphia, Pa, USA, 5th edition, 1992.
[36] E. Y. Kim, J. S. Kong, S. K. An, and H. D. Kim, “Surfacemodification of polymers and improvement of the adhesionbetween evaporated copper metal film and a polymer. I.Chemical modification of PET,” Journal of Adhesion Scienceand Technology, vol. 14, no. 9, pp. 1119–1130, 2000.

Hindawi Publishing CorporationJournal of NanomaterialsVolume 2011, Article ID 406087, 12 pagesdoi:10.1155/2011/406087
Research Article
A Comparative Study of Dispersion Techniques forNanocomposite Made with Nanoclays and an UnsaturatedPolyester Resin
Farida Bensadoun, Nadir Kchit, Catherine Billotte, Francois Trochu, and Edu Ruiz
Chair on Composites of High Performance (CCHP), Research Centre on Plastics and Composites (CREPEC),Department of Mechanical Engineering, Ecole Polytechnique de Montreal, P.O. Box 6079, Station Centre-Ville,Montreal, QC, Canada H3C 3A7
Correspondence should be addressed to Edu Ruiz, [email protected]
Received 12 April 2011; Revised 19 July 2011; Accepted 23 August 2011
Academic Editor: Gaurav Mago
Copyright © 2011 Farida Bensadoun et al. This is an open access article distributed under the Creative Commons AttributionLicense, which permits unrestricted use, distribution, and reproduction in any medium, provided the original work is properlycited.
Over the last few years, polymer/clay nanocomposites have been an area of intensive research due to their capacity to improvethe properties of the polymer resin. These nanocharged polymers exhibit a complex rheological behavior due to their dispersedstructure in the matrix. Thus, to gain fundamental understanding of nanocomposite dispersion, characterization of their internalstructure and their rheological behavior is crucial. Such understanding is also key to determine the manufacturing conditions toproduce these nanomaterials by liquid composite molding (LCM) process. This paper investigates the mix of nanoclays particlesin an unsaturated polyester resin using three different dispersion techniques: manual mixing, sonication, and high shear mixing(HSM). This paper shows that the mixing method has a significant effect on the sample morphology. Rheology, scanning electronmicroscopy (SEM), and differential scanning calorimetry (DSC) characterization techniques were used to analyze the blendsmorphology and evaluate the nanoclays stacks/polymer matrix interaction. Several phenomena, such as shear thinning andpremature polymer gelification, were notably observed.
1. Introduction
Recent advances in the composite materials field are relatedto the addition of nanoparticles such as carbon nanotubesor nanoclays to improve thermal, mechanical, or electricalproperties. Nanoparticle additives, like nanoclays, are widelyused in various industries such as cable coatings, adhesives,inks, pharmaceuticals and automotives [1, 2]. One of themost common nanoclay forms is MMT layered silicate witha particle thickness of 1 nm and 70 to 100 nm crosswise silicaplatelets [3]. The choice of montmorillonite nanoparticles inprevious researches is mainly due to the fact that they arecommonly available in nature and inexpensive. A minimalcontent of such additives between 1 to 6% wt can improvethe properties of the polymer matrix by increasing flexuralmodulus by up to 31% and lowering the coefficient oflinear thermal expansion by 66% [1, 4, 5]. However, theincorporation of nanoparticles into the liquid matrix is
still a challenge, because it requires proper dispersion andexfoliation. Nanoclays are widely used in thermoplastic ma-trices, but only few studies report to their addition in pol-yester thermoset resins. This explains the lack of results onthe thermal and mechanical properties and especially on therheology of the mix.
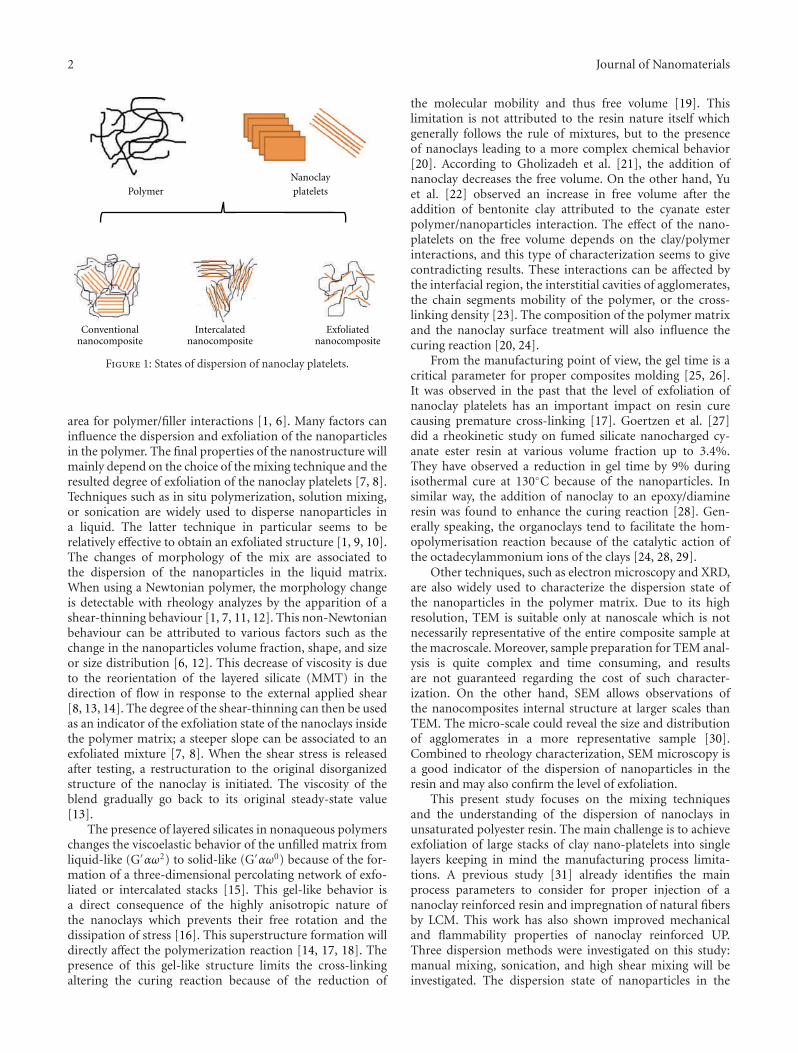
Rheology is a widely used evaluation method for detect-ing the presence of interconnected structures. This techniqueseems to be relevant for the study of the dispersion statewhich defines the nanostructure of the mixture between theconventional, the intercalated, or exfoliated nanocompositeas illustrated in Figure 1. However, in practice, the finalmixture would probably be a combination of these threemorphologies, where the best-case scenario is the fully ex-foliated structure [1, 6]. Due to the high aspect ratio of theplatelets, a small percentage of nanoclay particles properlydispersed in the matrix can generate a very large surface
2 Journal of Nanomaterials
PolymerNanoclayplatelets
Conventionalnanocomposite
Intercalatednanocomposite
Exfoliatednanocomposite
Figure 1: States of dispersion of nanoclay platelets.
area for polymer/filler interactions [1, 6]. Many factors caninfluence the dispersion and exfoliation of the nanoparticlesin the polymer. The final properties of the nanostructure willmainly depend on the choice of the mixing technique and theresulted degree of exfoliation of the nanoclay platelets [7, 8].Techniques such as in situ polymerization, solution mixing,or sonication are widely used to disperse nanoparticles ina liquid. The latter technique in particular seems to berelatively effective to obtain an exfoliated structure [1, 9, 10].The changes of morphology of the mix are associated tothe dispersion of the nanoparticles in the liquid matrix.When using a Newtonian polymer, the morphology changeis detectable with rheology analyzes by the apparition of ashear-thinning behaviour [1, 7, 11, 12]. This non-Newtonianbehaviour can be attributed to various factors such as thechange in the nanoparticles volume fraction, shape, and sizeor size distribution [6, 12]. This decrease of viscosity is dueto the reorientation of the layered silicate (MMT) in thedirection of flow in response to the external applied shear[8, 13, 14]. The degree of the shear-thinning can then be usedas an indicator of the exfoliation state of the nanoclays insidethe polymer matrix; a steeper slope can be associated to anexfoliated mixture [7, 8]. When the shear stress is releasedafter testing, a restructuration to the original disorganizedstructure of the nanoclay is initiated. The viscosity of theblend gradually go back to its original steady-state value[13].
The presence of layered silicates in nonaqueous polymerschanges the viscoelastic behavior of the unfilled matrix fromliquid-like (G′αω2) to solid-like (G′αω0) because of the for-mation of a three-dimensional percolating network of exfo-liated or intercalated stacks [15]. This gel-like behavior isa direct consequence of the highly anisotropic nature ofthe nanoclays which prevents their free rotation and thedissipation of stress [16]. This superstructure formation willdirectly affect the polymerization reaction [14, 17, 18]. Thepresence of this gel-like structure limits the cross-linkingaltering the curing reaction because of the reduction of
the molecular mobility and thus free volume [19]. Thislimitation is not attributed to the resin nature itself whichgenerally follows the rule of mixtures, but to the presenceof nanoclays leading to a more complex chemical behavior[20]. According to Gholizadeh et al. [21], the addition ofnanoclay decreases the free volume. On the other hand, Yuet al. [22] observed an increase in free volume after theaddition of bentonite clay attributed to the cyanate esterpolymer/nanoparticles interaction. The effect of the nano-platelets on the free volume depends on the clay/polymerinteractions, and this type of characterization seems to givecontradicting results. These interactions can be affected bythe interfacial region, the interstitial cavities of agglomerates,the chain segments mobility of the polymer, or the cross-linking density [23]. The composition of the polymer matrixand the nanoclay surface treatment will also influence thecuring reaction [20, 24].
From the manufacturing point of view, the gel time is acritical parameter for proper composites molding [25, 26].It was observed in the past that the level of exfoliation ofnanoclay platelets has an important impact on resin curecausing premature cross-linking [17]. Goertzen et al. [27]did a rheokinetic study on fumed silicate nanocharged cy-anate ester resin at various volume fraction up to 3.4%.They have observed a reduction in gel time by 9% duringisothermal cure at 130◦C because of the nanoparticles. Insimilar way, the addition of nanoclay to an epoxy/diamineresin was found to enhance the curing reaction [28]. Gen-erally speaking, the organoclays tend to facilitate the hom-opolymerisation reaction because of the catalytic action ofthe octadecylammonium ions of the clays [24, 28, 29].
Other techniques, such as electron microscopy and XRD,are also widely used to characterize the dispersion state ofthe nanoparticles in the polymer matrix. Due to its highresolution, TEM is suitable only at nanoscale which is notnecessarily representative of the entire composite sample atthe macroscale. Moreover, sample preparation for TEM anal-ysis is quite complex and time consuming, and resultsare not guaranteed regarding the cost of such character-ization. On the other hand, SEM allows observations ofthe nanocomposites internal structure at larger scales thanTEM. The micro-scale could reveal the size and distributionof agglomerates in a more representative sample [30].Combined to rheology characterization, SEM microscopy isa good indicator of the dispersion of nanoparticles in theresin and may also confirm the level of exfoliation.
This present study focuses on the mixing techniquesand the understanding of the dispersion of nanoclays inunsaturated polyester resin. The main challenge is to achieveexfoliation of large stacks of clay nano-platelets into singlelayers keeping in mind the manufacturing process limita-tions. A previous study [31] already identifies the mainprocess parameters to consider for proper injection of ananoclay reinforced resin and impregnation of natural fibersby LCM. This work has also shown improved mechanicaland flammability properties of nanoclay reinforced UP.Three dispersion methods were investigated on this study:manual mixing, sonication, and high shear mixing will beinvestigated. The dispersion state of nanoparticles in the

Journal of Nanomaterials 3
Table 1: Properties of the nanoclay platelets used in this work.
Type D-spacing Density Surface treatment
Cloisite30B
18.5 A 1.98 g/mLAlkyl quaternaryammonium bentonite
matrix will be evaluated using both rheology and SEManalyses. The catalytic effect of the nanoclays will also beinvestigated by gel time measurements and cure kineticsstudy using rheology and M-DSC techniques. The mainobjective of this research is to identify the most efficientdispersion technique and its impact on rheological and curekinetics on nanocharged UP matrix keeping in considerationfuture manufacturing possibilities.
2. Experimental
2.1. Material. In this work, an unsaturated polyester petro-leum-based resin (UP) R937-DPE24 from AOC was used,which has an average viscosity of 0.1804 Pa.s at 23◦C. Theresin was prepromoted with cobalt ethylhexanoate and ini-tiated using 1.5 phr of methyl ethyl ketone peroxide (MEKP925) from Norox. The resin was reinforced using 3% wt ofCloisite 30B nanoclay from Southern Clay Products. Thesenanoparticles are organically modified layered magnesiumaluminum silicates and their properties are summarized inTable 1.
2.2. Nanoclay Dispersion. A good dispersion is a key chal-lenge to achieve the best possible combination of matrix-nanoparticles. For that reason, a new dispersion techniqueusing high shear mixer was investigated in this work andcompared to sonication and manual mixing. The choiceof the 3% wt Cloisite 30B was notably based on previousresearches [31, 32] showing that these type of nanoparticlesare easier to disperse due to their chemistry providing generalimprovement on the matrix properties. Furthermore thistype of nanoclay was investigated in an earlier study focusingon composites manufacturing [31], and the mass fraction of3% wt was considered adequate for RTM processing.
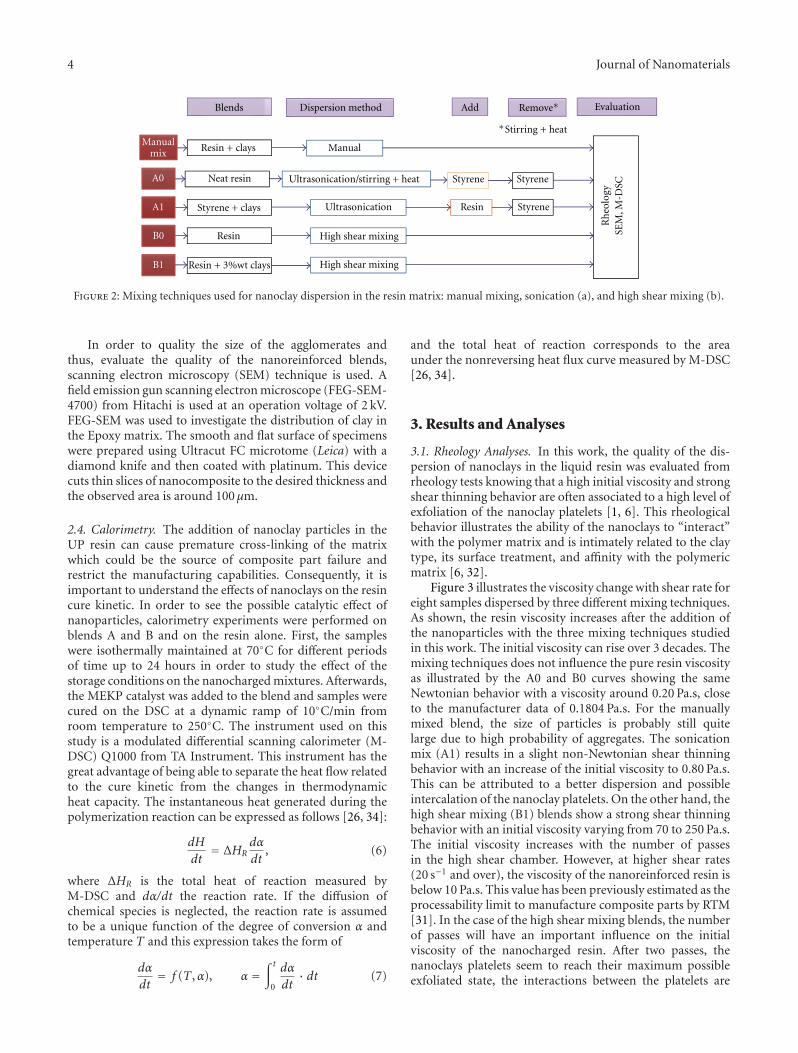
The sonication and manual preparations are detailed in aprevious study [31]. In these techniques, the nanoclays wereincorporated and predispersed in styrene first. The resin wasthen added to the mix and the styrene in excess was evapo-rated using high-speed mechanical stirring. The amount ofeach component was weight controlled. Since the HSM isperformed in a sealed chamber, the nanoclays were directlyincorporated into the resin. The gap in the geometry interac-tion chamber has been fixed between 50 and 100 microns,and the resin was circulated inside the chamber at highpressure. The size of particles agglomerates was significantlyreduced with this mixing technique resulting in a well-dispersed and homogeneous blend. Figure 2 summarizes theblend preparation procedures with the different approaches.The letter A refers to sonication technique whereas the lettersB to high shear mixing. Pure and nanocharged resins weremixed by three methods in order to take into account thepossible effect of the mixing technique on the resin itself. The
temperature and pressure were maintained at 23◦C and 1 atmfor (A0) and (A1) blends to limit the possible formation ofmicrogels or styrene evaporation.
2.3. Rheology and Electron Microscopy. Rheology experi-ments were conducted using a combined motor and trans-ducer (CMT) rheometer MCR501 from Anton-Paar. Bothsteady shear and small amplitude oscillatory shear (SAOS)measurements were carried out using two types of geome-tries: parallel plates of 25 cm diameter with a constant gapof 1 mm for high-viscosity blends and concentric cylindersfor low-viscosity blends. All experiments were conducted at23◦C and before measurement the sample was left in thegeometry for stabilization for 20 minutes. Plastic paraffinfilms (parafilm) were placed above the mixtures to limitstyrene evaporation during the stabilisation stage. This filmlimits the air contact of the liquid resin and styrene evapora-tion can be neglected. The steady shear measurements wereperformed using a shear rate varying from 0.1 to 1000 s−1.
For steady shear viscosity, the non-Newtonian viscosity ηis defined as follows [19, 33]:
η(γ) = −τ21
γ, (1)
where τ21 is the shear stress, and γ the shear rate applied. TheSAOS experiments were carried out under strain amplitudesof 1%, inside the linear viscoelasticity (LVE) domain.Frequency sweep test measurements were performed atfrequencies varying from 0.1 to 100 Hz. A strain wave wasimposed to the sample and the SAOS shear stress responseτ21(t) defined as follows [19, 33]:
−τ21(t) = (τ0 cos (δ)) sin (�t) + (τ0 sin (δ)) cos (�t), (2)
where τ0 is the stress amplitude, � the angular frequency,and δ the phase difference between the strain wave and thestress response. For elastic solids, the shear stress is directlyproportional to the strain imposed as defined by Hooke’s law:
τ21 = −G · γ21 = −G · γ0, (3)
where γ0 = γ0/� is the strain amplitude and G the elasticmodulus. Equations (2) and (3) can be combined to obtainthe SAOS material function:
−τ21
γ0= G′ sin (ω · t) + G′′ cos (ω · t), tan(δ) = G′′
G′,
(4)
where G′ is the storage modulus and G′′ the loss modulus,related, respectively, to the energy stored (elastic contri-bution) and dissipated (viscous contribution). The ratiobetween modulus is defined as the damping factor tan δ. Thecomplex viscosity η ∗ (�) is finally defined as
η ∗ (�) = −τ21(t)γ21(t)
, (5)
where γ21(t) is the SAOS strain rate.
4 Journal of Nanomaterials
Styrene + clays
Resin + clays
Neat resin
Dispersion method
Ultrasonication/stirring + heat
Manual
Ultrasonication
Add
Resin
Blends
Rh
eolo
gySE
M,M
-DSC
A0
A1
Manualmix
Evaluation
Styrene Styrene
Resin + 3%wt clays
High shear mixingB0
B1
Resin
High shear mixing
Styrene
Remove∗
∗Stirring + heat
Figure 2: Mixing techniques used for nanoclay dispersion in the resin matrix: manual mixing, sonication (a), and high shear mixing (b).
In order to quality the size of the agglomerates andthus, evaluate the quality of the nanoreinforced blends,scanning electron microscopy (SEM) technique is used. Afield emission gun scanning electron microscope (FEG-SEM-4700) from Hitachi is used at an operation voltage of 2 kV.FEG-SEM was used to investigate the distribution of clay inthe Epoxy matrix. The smooth and flat surface of specimenswere prepared using Ultracut FC microtome (Leica) with adiamond knife and then coated with platinum. This devicecuts thin slices of nanocomposite to the desired thickness andthe observed area is around 100 μm.
2.4. Calorimetry. The addition of nanoclay particles in theUP resin can cause premature cross-linking of the matrixwhich could be the source of composite part failure andrestrict the manufacturing capabilities. Consequently, it isimportant to understand the effects of nanoclays on the resincure kinetic. In order to see the possible catalytic effect ofnanoparticles, calorimetry experiments were performed onblends A and B and on the resin alone. First, the sampleswere isothermally maintained at 70◦C for different periodsof time up to 24 hours in order to study the effect of thestorage conditions on the nanocharged mixtures. Afterwards,the MEKP catalyst was added to the blend and samples werecured on the DSC at a dynamic ramp of 10◦C/min fromroom temperature to 250◦C. The instrument used on thisstudy is a modulated differential scanning calorimeter (M-DSC) Q1000 from TA Instrument. This instrument has thegreat advantage of being able to separate the heat flow relatedto the cure kinetic from the changes in thermodynamicheat capacity. The instantaneous heat generated during thepolymerization reaction can be expressed as follows [26, 34]:
dH
dt= ΔHR
dα
dt, (6)
where ΔHR is the total heat of reaction measured byM-DSC and dα/dt the reaction rate. If the diffusion ofchemical species is neglected, the reaction rate is assumedto be a unique function of the degree of conversion α andtemperature T and this expression takes the form of
dα
dt= f (T ,α), α =
∫ t
0
dα
dt· dt (7)
and the total heat of reaction corresponds to the areaunder the nonreversing heat flux curve measured by M-DSC[26, 34].
3. Results and Analyses
3.1. Rheology Analyses. In this work, the quality of the dis-persion of nanoclays in the liquid resin was evaluated fromrheology tests knowing that a high initial viscosity and strongshear thinning behavior are often associated to a high level ofexfoliation of the nanoclay platelets [1, 6]. This rheologicalbehavior illustrates the ability of the nanoclays to “interact”with the polymer matrix and is intimately related to the claytype, its surface treatment, and affinity with the polymericmatrix [6, 32].
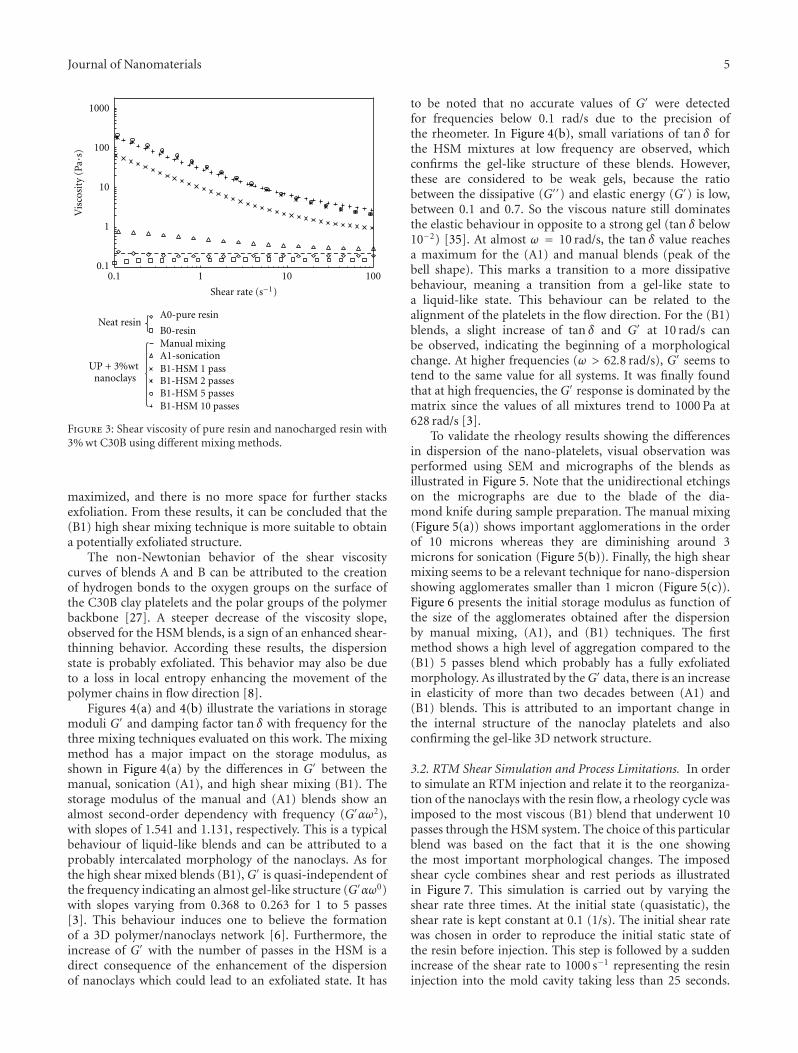
Figure 3 illustrates the viscosity change with shear rate foreight samples dispersed by three different mixing techniques.As shown, the resin viscosity increases after the addition ofthe nanoparticles with the three mixing techniques studiedin this work. The initial viscosity can rise over 3 decades. Themixing techniques does not influence the pure resin viscosityas illustrated by the A0 and B0 curves showing the sameNewtonian behavior with a viscosity around 0.20 Pa.s, closeto the manufacturer data of 0.1804 Pa.s. For the manuallymixed blend, the size of particles is probably still quitelarge due to high probability of aggregates. The sonicationmix (A1) results in a slight non-Newtonian shear thinningbehavior with an increase of the initial viscosity to 0.80 Pa.s.This can be attributed to a better dispersion and possibleintercalation of the nanoclay platelets. On the other hand, thehigh shear mixing (B1) blends show a strong shear thinningbehavior with an initial viscosity varying from 70 to 250 Pa.s.The initial viscosity increases with the number of passesin the high shear chamber. However, at higher shear rates(20 s−1 and over), the viscosity of the nanoreinforced resin isbelow 10 Pa.s. This value has been previously estimated as theprocessability limit to manufacture composite parts by RTM[31]. In the case of the high shear mixing blends, the numberof passes will have an important influence on the initialviscosity of the nanocharged resin. After two passes, thenanoclays platelets seem to reach their maximum possibleexfoliated state, the interactions between the platelets are
Journal of Nanomaterials 5
0.1
1
10
100
1000
0.1 1 10 100
Shear rate (s−1)
A0-pure resin
B0-resinManual mixingA1-sonicationB1-HSM 1 passB1-HSM 2 passesB1-HSM 5 passesB1-HSM 10 passes
Neat resin
UP + 3%wtnanoclays
Vis
cosi
ty(P
a·s)
Figure 3: Shear viscosity of pure resin and nanocharged resin with3% wt C30B using different mixing methods.
maximized, and there is no more space for further stacksexfoliation. From these results, it can be concluded that the(B1) high shear mixing technique is more suitable to obtaina potentially exfoliated structure.
The non-Newtonian behavior of the shear viscositycurves of blends A and B can be attributed to the creationof hydrogen bonds to the oxygen groups on the surface ofthe C30B clay platelets and the polar groups of the polymerbackbone [27]. A steeper decrease of the viscosity slope,observed for the HSM blends, is a sign of an enhanced shear-thinning behavior. According these results, the dispersionstate is probably exfoliated. This behavior may also be dueto a loss in local entropy enhancing the movement of thepolymer chains in flow direction [8].
Figures 4(a) and 4(b) illustrate the variations in storagemoduli G′ and damping factor tan δ with frequency for thethree mixing techniques evaluated on this work. The mixingmethod has a major impact on the storage modulus, asshown in Figure 4(a) by the differences in G′ between themanual, sonication (A1), and high shear mixing (B1). Thestorage modulus of the manual and (A1) blends show analmost second-order dependency with frequency (G′αω2),with slopes of 1.541 and 1.131, respectively. This is a typicalbehaviour of liquid-like blends and can be attributed to aprobably intercalated morphology of the nanoclays. As forthe high shear mixed blends (B1), G′ is quasi-independent ofthe frequency indicating an almost gel-like structure (G′αω0)with slopes varying from 0.368 to 0.263 for 1 to 5 passes[3]. This behaviour induces one to believe the formationof a 3D polymer/nanoclays network [6]. Furthermore, theincrease of G′ with the number of passes in the HSM is adirect consequence of the enhancement of the dispersionof nanoclays which could lead to an exfoliated state. It has
to be noted that no accurate values of G′ were detectedfor frequencies below 0.1 rad/s due to the precision ofthe rheometer. In Figure 4(b), small variations of tan δ forthe HSM mixtures at low frequency are observed, whichconfirms the gel-like structure of these blends. However,these are considered to be weak gels, because the ratiobetween the dissipative (G′′) and elastic energy (G′) is low,between 0.1 and 0.7. So the viscous nature still dominatesthe elastic behaviour in opposite to a strong gel (tan δ below10−2) [35]. At almost ω = 10 rad/s, the tan δ value reachesa maximum for the (A1) and manual blends (peak of thebell shape). This marks a transition to a more dissipativebehaviour, meaning a transition from a gel-like state toa liquid-like state. This behaviour can be related to thealignment of the platelets in the flow direction. For the (B1)blends, a slight increase of tan δ and G′ at 10 rad/s canbe observed, indicating the beginning of a morphologicalchange. At higher frequencies (ω > 62.8 rad/s), G′ seems totend to the same value for all systems. It was finally foundthat at high frequencies, the G′ response is dominated by thematrix since the values of all mixtures trend to 1000 Pa at628 rad/s [3].
To validate the rheology results showing the differencesin dispersion of the nano-platelets, visual observation wasperformed using SEM and micrographs of the blends asillustrated in Figure 5. Note that the unidirectional etchingson the micrographs are due to the blade of the dia-mond knife during sample preparation. The manual mixing(Figure 5(a)) shows important agglomerations in the orderof 10 microns whereas they are diminishing around 3microns for sonication (Figure 5(b)). Finally, the high shearmixing seems to be a relevant technique for nano-dispersionshowing agglomerates smaller than 1 micron (Figure 5(c)).Figure 6 presents the initial storage modulus as function ofthe size of the agglomerates obtained after the dispersionby manual mixing, (A1), and (B1) techniques. The firstmethod shows a high level of aggregation compared to the(B1) 5 passes blend which probably has a fully exfoliatedmorphology. As illustrated by the G′ data, there is an increasein elasticity of more than two decades between (A1) and(B1) blends. This is attributed to an important change inthe internal structure of the nanoclay platelets and alsoconfirming the gel-like 3D network structure.
3.2. RTM Shear Simulation and Process Limitations. In orderto simulate an RTM injection and relate it to the reorganiza-tion of the nanoclays with the resin flow, a rheology cycle wasimposed to the most viscous (B1) blend that underwent 10passes through the HSM system. The choice of this particularblend was based on the fact that it is the one showingthe most important morphological changes. The imposedshear cycle combines shear and rest periods as illustratedin Figure 7. This simulation is carried out by varying theshear rate three times. At the initial state (quasistatic), theshear rate is kept constant at 0.1 (1/s). The initial shear ratewas chosen in order to reproduce the initial static state ofthe resin before injection. This step is followed by a suddenincrease of the shear rate to 1000 s−1 representing the resininjection into the mold cavity taking less than 25 seconds.

6 Journal of Nanomaterials
0.1
1
10
100
1000
0.1 1 10 100
ω (rad/s)
Manual mixing, G′ = 0.003ω1.541
A1-sonication, = 0.159ω1.131
B1-HSM 1 pass, = 45.42ω0.368
B1-HSM 2 passes, G′ = 86.55ω0.327
B1-HSM 5 passes, G′ = 157.7ω0.263
G′ (
Pa)
G′
Low-frequency zone
G′
(a)
0.01
0.1
1
10
100
0.1 1 10 100
tanδ
ω (rad/s)
Manual mixingA1-sonicationB1-HSM 1 pass
B1-HSM 2 passesB1-HSM 5 passes
(b)
Figure 4: Internal structure behavior of UP resin with 3% wt C30Bnanoclays for various mixing methods (a) storage modulus of (b)tan δ.
After this period, the resin is maintained on a static state (i.e.,0.1 (1/s)) for 25 minutes. During this quasistate period atconstant shear rate, the resin viscosity increase from 1.8 Pa.sto 200 Pa.s. This increment is assumed to be linked to thenanoclays reorganization, since the shear rate is constant andno chemical reaction takes places (no hardener was added tothe resin).
At the very beginning of the cycle, the nanocharged resinis at rest and the initial exfoliated structure of the plateletsrandomly disorganized. This leads to a very high viscosity of250 Pa.s on the first two minutes. When the resin is injectedat a shear rate of 1000 s−1, the viscosity decreases abruptly
CNRC-IMI 2.0 kV 7.6 mm ×10.0 k 9/22/2009SE(U) 5 μm
(a)
CNRC-IMI 2.0 kV 5.7 mm ×10.0 k 9/22/2009SE(U) 5 μm
(b)
CNRC-IMI 2.0 kV 14.0 mm 12/6/2010×10.0 k SE(U) 5 μm
(c)
Figure 5: SEM micrograph of nanocharged resin with 3% wt C30Busing different dispersion methods: (a) manual mixing, (b) A1-sonication, and (c) B1-HSM.
to 1.8 Pa.s and the original nano-structure is destroyed.The particles at this point are oriented in the fluid flowdirection. After the filling is completed, at around 3 minutes,the shear is released and the viscosity gradually increasesuntil it reaches its initial value after 10 minutes. There isa restructuration of the nanoparticles in the blend whichdisorganized themselves to their original exfoliated structureafter this period. This rheology simulation gives precious

Journal of Nanomaterials 7
0.01
0.1
1
10
100
1000
0 1 2 3 4 5 6 7 8 9 10 11 12
Size of the agglomerates (μm)
B1-HSM 5 passes
A1-sonicationManual mix
G′ (
Pa)
Figure 6: Variation of the storage modulus according to the mixingtechnique.
0.01
0.1
1
10
100
1000 10000
1
10
100
1000
0 2 4 6 8 10 12
Shea
rra
te(s−1
)
Time (min)
Initial state(quasistatic) After fiber impregnation
(quasistatic)
Injection (RTM)
η(P
a·s)
Figure 7: RTM injection simulation on the rheometer (B1-HSM 10passes).
indication about the time necessary for the exfoliated nano-blend to reach a viscosity small enough for injection in addi-tion to its ability to recover rapidly to its original probableexfoliated state which is of interest for the improvement ofthe properties of the final part.
The gel point is another important feature of thenanocharged mixtures and it is defined as the required timefor the covalent bound of the monomer to connect acrossthe network to form the infinite network [15]. At that time,the polymer viscosity tends to infinity. Numerous techniques[19, 34, 36] can be used to determine the gel point, suchas the crossing point between the baseline and the tangentdrawn from the turning point of G′ curve, the cross-overof the modulus G′ and G′′, or when the tan δ becomesinvariant with frequency. The chosen criteria will depend onthe system being studied as well as the stoichiometry of thedifferent components. One of the techniques selected in thisstudy was successfully used for epoxy prepregs, consistingin determining the gel time at the maximum of the tan δ[36]. It was decided for the gel point study to focus only onthe low-frequency range in order to be representative of the
0.01
0.1
1
10
0 5 10 15
Time (min)
Gel pointG′G′′
G′ a
ndG′′
(Pa)
0E + 0
2E4 + 02
4E + 02
6E + 02
8E + 02
1E + 03
1.2E + 03
1.4E + 03
1.6E + 03
1.8E + 03
2E + 03
tan (δ)
tan
(δ)
Figure 8: Storage and loss moduli and tan δ during the cure of B1-HSM 5 passes blend at 23◦C.
actual manufacturing process. To obtain consistent results,the frequency of all experiments was set to 1 Hz in the linearviscoelastic region. Experiments were then conducted in timesweep mode as shown in Figures 8 and 9.
Figure 8 illustrates the evolution of G′,G′′, and tan δduring the cure of the B1-HSM 5 passes blend at 23◦C. Itcan be seen that G′ is always higher than G′′ because of thegel-like structure of the blend. As a consequence, no cross-over is observed between G′ and G′′. At around 9 minutesfrom the beginning of cure, there is a sudden increase ofthe storage modulus to infinity which indicates an importantchange in the polymer structure. At this point, the tan δ curvereaches a maximum close to 1. This is an indication of the gelformation which denotes the beginning of the cross-linkingof the polymer. The calculation of the gel time with thismethod was carried out on the resin/nanoparticles blendsmixed with different techniques as illustrated in Figure 9(a)at the same temperature and frequency. As shown, the blendsmixed with a high shear mixer result in the lowest gel times,between 3 and 15 minutes. Moreover, it is observed that thegel time decreases proportionally with the number of passesin the mixer for the HSM technique. As of the hand mixedand sonicated samples, their gel point is slightly inferior tothe pure resin due to the supposed catalytic effect of thenanoclays. Since the nanoclays are not well dispersed withthis techniques compared to HSM mixtures, the catalyticeffect is limited.
The gelification point is often defined as the time atwhich the G′ exceeds G′′ (i.e., tan δ = 1), but this pointcorresponds to a high resin viscosity. In LCM process anal-ysis, the processing gel time may be defined as the point atwhich the resin viscosity curve has a slope of 10% [26]. Thiscriterion results in a viscosity increase between 2 to 5 timesfrom the initial value. At this point the resin will not flowunder normal injection pressures [26]. Figure 9(b) illustratesthe evolution of the complex viscosity with time duringcure. This processing gel time calculated from complexviscosity is in good agreement with the data obtained from

8 Journal of Nanomaterials
0.01
0.1
1
10
100
0 10 20 30 40 50 60
Time (min)
A0-pure resinManual mixingA1-sonicationB1-HSM 1 pass
Gel point
HSM Sonication
B1-HSM 5 passesB1-HSM 10 passes
tan
(δ)
(a)
Gel point
0
1
10
100
1000
10000
0 10 20 30 40 50 60
Time (min)
Manual mixing
10%
B1-HSM 1 passesA1-sonication
B1-HSM 5 passes
B1-HSM 10 passes
A0-pure resin
η∗
(Pa·
s)
(b)
0
5
10
15
20
25
30
35
40
45
Gel
tim
e(m
in)
B1-HSM 1 pass
B1-HSM 5 passes
A0-pure resin
Manual mixing
B1-HSM 10 passes
A1-sonication
(c)
Figure 9: Gel time at 23◦C UP resin with 3% wt of C30B mixed with various dispersion techniques: (a) method of maximum tan δ, (b) 10%slope of η∗, and (c) gel point tendency obtained with the maximum tan δ.
the maximum of tan δ. The catalytic effect of the nan-oclay tends to decrease the gel time due to the increasedinteractions between nanoclay platelets and the polymerresin. Table 2 resumes the gelification time for each systemaccording to the mixing method. Figure 9(c) summarizesthe gelification times calculated from the maximum of tan δaccording to the mixing method. The gelification time hasbeen reduced in 17 minutes between (A1) and (B1) blends.This is mainly due to an enhanced dispersion state andprobable exfoliation, which results in a greater surface forinteraction between the polymer matrix and the clays. Thisinterfacial region acts as a catalyst and accelerates the curingreaction.
3.3. Catalytic Effect of the Nanoclays. As illustrated by the geltime results, the addition of nanoclays has a nonnegligibleimpact on the polymerization process. In order to better un-derstand this catalytic effect on the cross-linking reactionof the UP resin, samples of the different blends were
isothermally maintained at 70◦C for various dwell times. Thecatalyst was then added to the blend and the heat of reactionwas analyzed with an M-DSC using a constant heatingrate process. The residual heat of reaction was comparedto the total heat of reaction generated during the cure ofthe pure resin. In addition, the samples exposed at 70◦Cwere compared to the samples stored at −18◦C, so-calledcontrol samples. Neat resin samples were exposed to thesame isothermal condition to take into account the styreneevaporation which has an influence on the released heat ofreaction. For that reason, a correction of the total heat ismade for all stored samples. The nonreleased heat due theevaporation of styrene for the pure resin sample, ΔHpure resin,during storage at 70◦C was calculated as follows:
ΔHpure resin = Hpure resin at −18◦C −Hpure resin at 70◦C. (8)
The evaporation of the cross-linking agent (styrene) duringstorage lowers the total heat or reaction of the resin a quantity

Journal of Nanomaterials 9
Table 2: Gel time results using two different calculation methods.
Maximum tan δ(min)
Figure 9(a)
10% slope(min)
Figure 9(b)
Pure resin 44 42
3% cloisite30B
Manual mixing 38 37
A1-sonication 36 32
B1HSM
1 pass 15 14
5 passes 9 8
10 passes 3 3
Table 3: Storage temperature influence on nanocharged resin using HSM and sonication dispersion techniques.
Isothermaltemperature(◦C)
Dwell time(h)
Pure resin Sonication A1 HSM B1-5 passes
Hres (J/g) ΔHres (J/g) Hres (J/g) αnano1 (%) Hres (J/g) αnano
1 (%)
−18 24 279.8 — 259.7 6.5 273.1 4.4
70
1 224.6 18.4
1.5 214.2 21.5
2 166.7 38.5
6 260.1 19.7 214.7 14.4
70 12 243.6 36.2 206.9 15.1
70 24 239.3 40.5 197.1 17.61Calculation based on Hres of the corresponding pure resin storage
equals to ΔHpure resin. As shown in Table 3, exposing thepure resin at 70◦C, for long periods, results in a decrementof the heat of reaction of 9.5% and 14.5% after 6 and24 hours, respectively. Therefore, for the nanocompositesamples maintained at 70◦C, the total heat of reaction hasto be compared to the one of the pure resin under similarthermal treatment (Hpure resin at 70◦C). Thus, the degree of cureassociated to the catalytic effect of the nanoclays αnano wascalculated based on the total heat of reaction generatedduring cure of the nanocomposites and the one of the pureresin:
αnano = 1−(
Hblend
Hpure resin
), (9)
where, Hblend is the heat of reaction of the nanochargedblend and Hpure resin the heat of reaction for the pure resin,both at 70◦C and at the same dwell time. Figure 10 showsthe results of two MDSC tests of the sonicated blend (A1)maintained at −18◦C and 70◦C during 24 hours. It can beseen that the residual heat of reaction after thermal exposurehas decreased by 10% at −18◦C and by 17.6% at 70◦C.This clearly indicates the influence of the nanoclays on thecure reaction of the unsaturated polyester resin. Table 3presents the resulting degree of cure αnano after exposing thenanocomposites at these temperatures.
As for the HSM blend (B1), this catalytic effect ofnanoclays is very important. The degree of cure αnano reaches18% after 1 h of exposition and 38.5% after 2 h at 70◦C.After this point, the resin gels and it is no longer possible
Temperature (◦C)
A1-24 h at 70◦C
ΔHres = 259.8 J/g
ΔHres = 197.1 J/g
25 50 75 100 125 150 1750
0.1
0.2
0.3
0.4
0.5
0.6
0.7
0.8
0.9
1
1.1
1.2
1.3
1.4
Non
-rev
erse
hea
tfl
ow(W
/g)
A1-24 h at −18◦C
Figure 10: Heat of reaction of the sonicated 3% wt C30Bnanocharged resin exposed at 70◦C and maintained at −18◦C infreezer (control) for 24 h. Catalyst added to the mix just before M-DSC analysis.
to be add the catalyst. The differences in cure reactionbetween the (A1) and (B1) blends can be attributed to anincreased dispersion and possible exfoliation of the HSMblend. This catalytic effect of nanoclay platelets is probably

10 Journal of Nanomaterials
0
0.1
0.2
0.3
0.4
0.5
0.6
0.7
0.8
0.9
1
0 5 10 15 20 25
αn
ano
Time (h)
Experimental data: HSM
Model: HSM
Experimental data: sonication
Model: sonication
Figure 11: Modelling of conversion-time curves for sonicated andHSM blends. Experimental data comes from M-DSC analyses.Fitting curves are polynomial.
due to the existence of attractive forces between the clayand the polymer matrix. The cation-exchange capacity ofthe nanoclay influences the cure reaction. This acceleration isinduced by the alkylammonium ions contained in the surfacetreatment of the nanocharges [20].
Figure 11 shows the results of the measured degree ofcure αnano for (A1) and (B1) blends as a function of ex-position time at 70◦C. A phenomenological autocatalyticmodel was used to model the cure reaction of both blends.The degree of cure was evaluated by an nth-order model asfollows [26, 34]:
dα
dt= KA · (1− α)n, (10)
where α is the degree of polymerization, n the reaction order,and KA the rate constant given by an Arrhenius temperaturedependence defined as
KA = K0 exp( −EAR · T
), (11)
where K0 is the Arrhenius constant, EA is the activationenergy, and R is the ideal gas constant. Equations (10) and(11) are widely used to model the cure of many polymersystems such as polyester and epoxies. This model is usedon the assumption that only one kind of reaction mayrepresent the whole cure process [34]. The parameters ofthe proposed cure kinetics model were obtained by fittingthe experimental data extracted from M-DSC tests andpresented in Table 3. The coefficients of the two modelsare shown in Table 4. As illustrated in Figure 11, there isa good agreement between the M-DSC experiments andthe proposed models. This indicates that an autocatalyticreaction of the polymer can be started due to the presence ofnanoclay particles. Moreover, these results demonstrate thatthe degree of exfoliation accelerates the autocatalytic cure
Table 4: K and m constants of the autocatalytic model for UPresin/nanoclay systems depending on the dispersion method.
T = 70◦C Sonication model HSM model
KA (1/min) 0.000875 0.00575
n 16.5 2.7
reaction. It is then concluded that the exfoliation of MMTchanges the cure rate of the UP resin tested on this work.Similar results were reported in the past for epoxy resins [37].This could also indicate that the interfacial region betweenthe clay and the polymer may dominate the properties of theblend.
4. Conclusion
The scope of this work was to study the nanoclays dispersionin an UP resin and by means of three different mixing tech-niques. Rheology tests based on shear and SAOS experimentsrevealed the differences between the manual mixing, sonica-tion, and high shear mixing techniques. Notably, the shearthinning behavior is a result of the morphological change ofthe blend due to the rearrangement of the silicate nanoclays.Furthermore the intercalated and exfoliated structure hasshown a gel-like structure of high shear mixed blends. This is,however, a weak gel since tan δ is in the order of 10−1. Thisgel-like structure is a direct consequence of the interactionbetween the polymer and the nano-platelets leading to thecreation of a 3D network in the liquid.
The high shear mixing has the highest elastic modulus(100 Pa) and initial viscosity (up to 250 Pa.s compared toother mixing techniques). However, the viscosity decreasesat high shear rate due to the reorientation of the nanoclays.The viscosity reaches 2 Pa.s at high shear which makes itpossible to process the blend by RTM. The dispersion wasalso verified by SEM microscopy showing agglomerates of10 microns for the manual mixing and less than 1 micron forthe high shear technique. The nanoclays seem also to have acatalyst effect on the resin system, showing a reduction of thegel time due to their exfoliation state. The neat resin showeda gel time of 45 minutes whereas the 10 passes HSM blendjellified at around 3 minutes. This phenomenon has to betaken into account for proper composites molding. The DSCstudy confirms the catalytic effect of the nanoclays showing adegree of cure of 38.5% for the high shear mix after 2 hoursof exposition at a 70◦C.
This study illustrates how well-dispersed nanoclays inUP resin bring many interesting structural changes in thepolymer matrix. This work also shows that processing maybe achievable since the time to orient the nanoparticles in thedirection of fluid flow is within seconds and the restructura-tion to their initial random disorganized structure takes fewminutes. Future work will focus on the use of HSM techniquefor manufacturing biocomposite parts improved by nanoclayreinforcing of the bioresin.
Journal of Nanomaterials 11
Abbreviations
FEG: Field emission gun (scanning electronmicroscope)
G′: Elastic modulusG′′: Loss modulusHSM: High shear mixingLCM: Liquid composite moldingLVE: Linear viscoelasticM-DSC: Modulated differential scanning calorimetryMMT: Montmorillonitephr: Parts per hundredRTM: Resin transfer moldingSCRIMP: Seeman composite resin infusion molding
processSEM: Scanning electron microscopyTEM: Transmission electronic microscopyUP: Unsaturated polyester resinVARI: Vacuum assisted resin infusion% wt: Weight percentageXRD: X-Ray diffractionω: Frequency (rad/s)tan δ: Damping factor.
Acknowledgments
The authors acknowledge the support provided by the Chairof High Performance Composite (CCHP) and the Center forApplied Research on Polymers and Composites (CREPEC).The financial contribution of the Natural Sciences andEngineering Research Council of Canada (NSERC) is alsogreatly appreciated.
References
[1] I. Ortega, Fabrication et caracterisation de nanocomposites amatrice epoxy, M.S. dissertation, Ecole Polytechnique, Mon-treal, Canada, 2008.
[2] S. Abend and G. Lagaly, “Sol-gel transitions of sodium mont-morillonite dispersions,” Applied Clay Science, vol. 16, no. 3-4,pp. 201–227, 2000.
[3] S. S. Ray and M. Okamoto, “Polymer/layered silicate nano-composites: a review from preparation to processing,” Progressin Polymer Science, vol. 28, no. 11, pp. 1539–1641, 2003.
[4] Y. Rao and T. N. Blanton, “Polymer nanocomposites with alow thermal expansion coefficient,” Macromolecules, vol. 41,no. 3, pp. 935–941, 2008.
[5] D. Dean, A. M. Obore, S. Richmond, and E. Nyairo, “Mul-tiscale fiber-reinforced nanocomposites: synthesis, processingand properties,” Composites Science and Technology, vol. 66,no. 13, pp. 2135–2142, 2006.
[6] S. S. Ray, “Rheology of polymer/layered silicate nanocompos-ites,” Journal of Industrial and Engineering Chemistry, vol. 12,no. 6, pp. 811–842, 2006.
[7] S. Zainuddin, M. V. Hosur, Y. Zhou, A. Kumar, and S. Jee-lani, “Durability study of neat/nanophased GFRP compositessubjected to different environmental conditioning,” MaterialsScience and Engineering A, vol. 527, no. 13-14, pp. 3091–3099,2010.
[8] A. Lele, M. Mackley, G. Galgali, and C. Ramesh, “In situ rheo-x-ray investigation of flow-induced orientation in layered
silicate-syndiotactic polypropylene nanocomposite melt,”Journal of Rheology, vol. 46, no. 5, pp. 1091–1110, 2002.
[9] C.-K. Lam, K.-T. Lau, H.-Y. Cheung, and H.-Y. Ling, “Effect ofultrasound sonication in nanoclay clusters of nanoclay/epoxycomposites,” Materials Letters, vol. 59, no. 11, pp. 1369–1372,2005.
[10] S. Lakshminarayanan, B. Lin, G. A. Gelves, and U. Sundararaj,“Effect of clay surfactant type and clay content on the ehe-ology and morphology of uncured Fluoroelastomer/clay na-nocomposites prepared by melt-mixing,” Journal of AppliedPolymer Science, vol. 112, no. 6, pp. 3597–3604, 2009.
[11] Y. Zhong and S.-Q. Wang, “Exfoliation and yield behaviorin nanodispersions of organically modified montmorilloniteclay,” Journal of Rheology, vol. 47, no. 2, pp. 483–495, 2003.
[12] I. Ortega, C. Billotte, and E. Ruiz, “Thermo-mechanical andrheologicalcharacterization of various epoxy-based nanocom-posites for high performance composites,” in Proceedings ofthe 4th International Symposium on Polymer NanocompositesScience and Technology, Quebec, Canada, 2007.
[13] J. Ren, B. F. Casanueva, C. A. Mitchell, and R. Krishnamoorti,“Disorientation kinetics of aligned polymer layered silicatenanocomposites,” Macromolecules, vol. 36, no. 11, pp. 4188–4194, 2003.
[14] R. Krishnamoorti, J. Ren, and A. S. Silva, “Shear response oflayered silicate nanocomposites,” Journal of Chemical Physics,vol. 114, no. 11, pp. 4968–4973, 2001.
[15] C. Mobuchon, P. J. Carreau, and M.-C. Heuzey, “Structuralanalysis of non-aqueous layered silicate suspensions subjectedto shear flow,” Journal of Rheology, vol. 53, no. 5, pp. 1025–1048, 2009.
[16] R. Prasad, V. Pasanovic-Zujo, R. K. Gupta, F. Cser, and S.N. Bhattacharya, “Morphology of EVA based nanocompositesunder shear and extensional flow,” Polymer Engineering &Science, vol. 44, no. 7, pp. 1220–1230, 2004.
[17] J. Ren, A. S. Silva, and R. Krishnamoorti, “Linear viscoelastic-ity of disordered polystyrene—polyisoprene block copolymerbased layered-silicate nanocomposites,” Macromolecules, vol.33, no. 10, pp. 3739–3746, 2000.
[18] R. Krishnamoorti and K. Yurekli, “Rheology of polymerlayered silicate nanocomposites,” Current Opinion in Colloidand Interface Science, vol. 6, no. 5-6, pp. 464–470, 2001.
[19] E. Ruiz and C. Billotte, “Predicting the cure of thermosettingpolymers: the isoconversion map,” Polymer Composites, vol.30, no. 10, pp. 1450–1457, 2009.
[20] O. Becker, Y.-B. Cheng, R. J. Varley, and G. P. Simon,“Layered silicate nanocomposites based on various high-functionality epoxy resins: the influence of cure temperatureon morphology, mechanical properties, and free volume,”Macromolecules, vol. 36, no. 5, pp. 1616–1625, 2003.
[21] B. Gholizadeh, A. Arefazar, and J. Barzin, “Polycarbon-ate/polyamide 6/nanoclay ternary nanocomposite mem-branes: preparation, characterisation, and gas separationproperties,” Polymers and Polymer Composites, vol. 17, no. 3,pp. 181–187, 2009.
[22] D. H. Yu, B. Wang, Y. Feng, and Z. P. Fang, “Investigation offree volume, interfacial, and toughening behavior for cyanateester/bentonite nanocomposites by positron annihilation,”Journal of Applied Polymer Science, vol. 102, no. 2, pp. 1509–1515, 2006.
[23] G. Choudalakis, A. D. Gotsis, H. Schut, and S. J. Picken, “Thefree volume in acrylic resin/laponite nanocomposite coatings,”European Polymer Journal, vol. 47, no. 3, pp. 264–272, 2011.
[24] F. Roman, S. Montserrat, and J. M. Hutchinson, “On theeffect of montmorillonite in the curing reaction of epoxy

12 Journal of Nanomaterials
nanocomposites,” Journal of Thermal Analysis and Calorime-try, vol. 87, no. 1, pp. 113–118, 2007.
[25] E. Ruiz and F. Trochu, “Multi-criteria thermal optimizationin liquid composite molding to reduce processing stresses andcycle time,” Composites Part A:, vol. 37, no. 6, pp. 913–924,2006.
[26] E. Ruiz, F. Waffo, J. Owens, C. Billotte, and F. Trochu, “Mod-eling of resin cure kinetics for molding cycle optimization,” inProceedings of the International Conference in Flow Processes inComposite Materials (FPCM ’06), Ecole des Mines de Douai,Douai, France, 2006.
[27] W. K. Goertzen, X. Sheng, M. Akinc, and M. R. Kessler,“Rheology and curing kinetics of fumed silica/cyanate esternanocomposites,” Polymer Engineering & Science, vol. 48, no.5, pp. 875–883, 2008.
[28] K. C. Cole, J. J. Hechler, and D. Noel, “A new approachto modeling the cure kinetics of epoxy amine thermosettingresins. 2. Application to a typical system based on bis[4-(diglycidylamino)phenyl]methane and bis(4-aminophenyl)sulfone,” Macromolecules, vol. 24, no. 11, pp. 3098–3110, 1991.
[29] T. Lan, P. D. Kaviratna, and T. J. Pinnavaia, “Epoxy self-polymerization in smectite clays,” Journal of Physics andChemistry of Solids, vol. 57, no. 6–8, pp. 1005–1010, 1996.
[30] L. Botta, R. Scaffaro, F. P. L. A. Mantia, and N. T. Dintcheva,“Effect of different matrices and nanofillers on the rheologicalbehavior of polymer-clay nanocomposites,” Journal of PolymerScience, Part B, vol. 48, no. 3, pp. 344–355, 2010.
[31] F. Bensadoun, N. Kchit, C. Billotte, S. Bickerton, F. Trochu,and E. Ruiz, “A study of nanoclay reinforcement of bio-composites made by liquid composite molding,” InternationalJournal of Polymer Science, vol. 2011, Article ID 964193, 10pages, 2011.
[32] C. H. Dan, M. H. Lee, Y. D. Kim, B. H. Min, and J. H. Kim,“Effect of clay modifiers on the morphology and physicalproperties of thermoplastic polyurethane/clay nanocompos-ites,” Polymer, vol. 47, no. 19, pp. 6718–6730, 2006.
[33] F. A. Morrison, Understanding Rheology, Oxford UniversityPress, New York, NY, USA, 2001.
[34] E. Ruiz and F. Trochu, “Thermomechanical properties duringcure of glass-polyester RTM composites: elastic and viscoelas-tic modeling,” Journal of Composite Materials, vol. 39, no. 10,pp. 881–916, 2005.
[35] M. Hamdine, M.-C. Heuzey, and A. Begin, “Effect of organicand inorganic acids on concentrated chitosan solutions andgels,” International Journal of Biological Macromolecules, vol.37, no. 3, pp. 134–142, 2005.
[36] M. Hayaty, M. H. Beheshty, and M. Esfandeh, “A newapproach for determination of gel time of a glass/epoxyprepreg,” Journal of Applied Polymer Science, vol. 120, no. 3,pp. 1483–1489, 2011.
[37] W.-B. Xu, S.-P. Bao, S.-J. Shen, G.-P. Hang, and P.-S. He,“Curing kinetics of epoxy resin-imidazole-organic montmo-rillonite nanocomposites determined by differential scanningcalorimetry,” Journal of Applied Polymer Science, vol. 88, no.13, pp. 2932–2941, 2003.

Hindawi Publishing CorporationJournal of NanomaterialsVolume 2011, Article ID 979458, 7 pagesdoi:10.1155/2011/979458
Research Article
Thermal Behavior with Mechanical Property of FluorinatedSilane Functionalized Superhydrophobic Pullulan/Poly(vinylalcohol) Blends by Electrospinning Method
Mohammad Rezaul Karim1 and Md. Shahidul Islam2
1 Center of Excellence for Research in Engineering Materials, College of Engineering, King Saud University, Riyadh 11421, Saudi Arabia2 Department of Applied Chemistry and Chemical Engineering, University of Dhaka, Dhaka 1000, Bangladesh
Correspondence should be addressed to Mohammad Rezaul Karim, [email protected]
Received 14 June 2011; Accepted 19 August 2011
Academic Editor: Gaurav Mago
Copyright © 2011 M. R. Karim and Md. S. Islam. This is an open access article distributed under the Creative CommonsAttribution License, which permits unrestricted use, distribution, and reproduction in any medium, provided the original work isproperly cited.
Fluorinated silane functionalized superhydrophobic pullulan/poly(vinyl alcohol) (PULL/PVA) blend membrane with water con-tact angle larger than 150◦ has been prepared by the electrospinning method. The morphology, thermal stability, and mechanicalproperty of the membranes are characterized using scanning electron microscopy (SEM), thermogravimetric analysis (TGA), andZWICK materials testing machine, respectively. Interactions between PULL and PVA and PULL/PVA blends with perfluorooctyl-triethoxysilane (PFOTES) of the membranes are analyzed using differential scanning calorimetry (DSC) and Fourier transform in-frared (FTIR). Contact angles and water drops on the surface of the membrane are measured by video microscopy. The study showsthat the addition of minor quantity of PVA with PULL results in improvement in thermal stability and mechanical property (tensilestrength) of the PULL membranes.
1. Introduction
The wettability of a solid surface is an interesting propertyof a material and is described as the contact angle betweena liquid and a solid surface. When the contact angle betweenwater and a solid surface is larger than 150◦, this solid surfaceis called a superhydrophobic surface [1]. Superhydrophobicsurfaces are widely found in nature. For example, the surfaceof a lotus leaf is observed to be an array of nanoscale buds[2]. Water drops on the surface of the leaf tend to slide down,rendering its self-cleaning property. The surfaces whichmimic “lotus effect” have triggered extensive interests fortheir potential applications involving water repellency, self-cleaning, and antifouling properties [3–6]. Generally, the hy-drophobicity of surfaces depends on both their chemi-cal composition and surface geometrical structure [7]. Interms of chemical composition, hydrophobicity can only beincreased by introducing a component with low surfaceenergy such as fluorinated methyl groups. However, thismethod to increase hydrophobicity is limited.
The maximum contact angle that can be reached by coat-ing fluorinated methyl groups onto a flat solid surface isonly 120◦, which can be hardly called superhydrophobic [8].Therefore, a hierarchical structure is introduced into thesolid surface to achieve superhydrophobicity. A number ofmethods have been used to make a hierarchical superhy-drophobic surface including phase separation [9], electro-chemical deposition [10], chemical vapor deposition [11],crystallization control [12], photolithography [13], assembly[14], sol-gel methods [15], solution-immersion methods[16], and array of nanotubes/nanofibers [17, 18].
Electrospinning is a simple but versatile method to pro-duce continuous fibers with diameters ranging from na-nometer to submicron scale. Superhydrophobic surfaces canbe obtained through this process by controlling the surfaceroughness under appropriate conditions [19, 20]. Superhy-drophobic polystyrene nanofibers were electrospun by eitherusing various solvents [8] or adding room temperatureionic liquid [21]. Cellulose triacetate fibrous mat [22]and poly(3-hydroxybutyrate-co-3-hydroxyvalerate) (PHBV)
2 Journal of Nanomaterials
fibrous surfaces [23] are fabricated using electrospun fibersfollowed with plasma treatment. Electrospun nanofibersfrom the blending solution of fully hydrolyzed mediummolecular weight poly(vinyl alcohol) and high-molecular-weight poly(vinyl alcohol) with montmorillonite were fab-ricated [24].
Pullulan is a natural polymer with excellent biocompat-ibility. The use of natural polymer has created tremendousinterest recently, for example, as proteins in biotechnologicalmaterials and biomedical applications [25]. However, onlyfew reports are available in the literature regarding super-hydrophobic PULL membrane prepared by electrospinning.Pullulan’s solubility can be controlled or provided with reac-tive groups by chemical derivatization. Due to its excellentproperties, pullulan is used as a low-calorie ingredient infoods, gelling agent, coating and packaging material forfood and drugs, binder for fertilizers, and as an oxidation-prevention agent for tablets. Other applications includecontact lenses manufacturing, biodegradable foil, plywood,water solubility enhancer, and for enhancing oil recovery[26–29].
Poly(vinyl alcohol) (PVA) is a semicrystalline hydrophilicpolymer with good chemical and thermal stability. It is ahighly biocompatible and nontoxic polymer and it can beprocessed easily; it also has high water permeability. PVA canform physical gels in various types of solvents which lead tothe use of PVA in a wide range of applications in medical,cosmetic, food, pharmaceutical, and packaging industries[30–36].
Polymer blending constitutes a very useful method forthe improvement or modification of the physicochemicalproperties of polymeric materials. An important property ofa polymer blend is the miscibility of its components becauseit affects the mechanical properties, the morphology, and thepermeability and degradation. Polymer blends are physicalmixtures of structurally different polymers or copolymersthat interact with secondary forces with no covalent bonding[37], such as hydrogen bonding, dipole-dipole forces, andcharge-transfer complexes for homopolymer mixtures [38–40].
In our previous report, we prepared fluorinated silanefunctionalized pullulan superhydrophobic membrane usingelectrospinning technique [41]. In this study, fluorinatedsilane functionalized superhydrophobic PULL/PVA blendmembranes are made to enhance the thermal stability andmechanical property (tensile strength) of PULL membranesby applying the same technique.
2. Experimental
2.1. Materials. Pullulan is a food grade preparation (PF-20grade) from Hayashibara Biochemical Laboratories Inc.(Okayama, Japan), PVA with Pn = 1,700 (fully hydrolyzed,degree of saponification = 99.9%) was obtained from DCChemical, Seoul, Republic of Korea and perfluorooctyltri-ethoxysilane (PFOTES) is purchased from Aldrich ChemicalCompany. Doubly distilled water is used as a solvent to pre-pare all solutions.
2.2. Preparation of PULL/PVA/PFOTES Blend Solutions. ThePULL/PVA solutions (total polymer concentrations are 9 and12 wt.%) with 80/20 mass ratio were prepared in doubly dis-tilled water at 80◦C temperature under magnetic stirring for2-3 h. The PULL/PVA/PFOTES blend solutions were pre-pared by mixing of the PULL/PVA solutions with 1 wt.% ofPFOTES with gently stirred for further 24 h. The formedsolutions were then used for the preparation of membranesusing electrospinning technique.
2.3. Membrane Preparation by Electrospinning. During elec-trospinning, each solution was continuously supplied usinga syringe pump with a speed of 0.04 mL/h through a 25Gneedle producing a Taylor cone. A high power voltage(15 kV) was supplied to the solution with a tip-to-collectordistance of 15 cm. Membranes were collected on electricallygrounded aluminum foil placed at a vertical distance to theneedle tip. Trace amount of PFOTES does not affect theelectrospinnability of PULL/PVA blend solution.
2.4. Characterization of Membranes. The water contact an-gles of the membranes were measured using video mi-croscopy. Using a microsyringe, 5 μL deionized water wasdropped perpendicularly to each surface of the membranesplaced on a horizontal glass sheet. Then, the images of waterdrops on the surface of the membranes were observed usingScalar Video Loupe (VL-11s) and analyzed using the SigmaTV II program. Membranes were also characterized withFTIR (IFS 120HR, Bruker) and DSC (model Q-10) from TAinstruments, USA. The morphology, thermal stability, andmechanical property (tensile strength) of membranes wereobserved with a field-emission scanning electron microscope(JEOL, model JSM-6380) after gold coating, TGA technique(model Q-50; TA Instruments, USA), and ZWICK Z005(ZWICK materials testing machine, Germany), respectively.
3. Results and Discussion
3.1. DSC Data of Membranes. Figure 1 illustrates the DSCthermograms of pure PULL, PVA, and electrospunPULL/PVA blend membrane with 80/20 mass ratio at a totalpolymer concentration of 9 wt.%. A relatively large and sharpendothermic peak is observed at about 224◦C (Figure 1(a))and is assigned to the melting temperature of pure PVA,which has a number-average degree of polymerization of1700, which agrees very well with reported data [42]. Thispeak is shifted to 206.50◦C with the addition of 80 wt.%PULL (Figure 1(b)), and this shifts the melting temperatureto lower value; this occurred because of the addition ofPULL whose melting temperature changes from 95 to 84◦C(Figure 1(b)). This is because the majority of the chainsare in a noncrystalline state due to the rapid solidificationprocess of stretched chains during electrospinning. PurePULL shows a large thermogram peak of melting transition(Tm) at 95◦C (Figure 1(c)).
The interactions between PULL/PVA blending andPFOTES of membranes are investigated by DSC. Figure 2shows the DSC thermogram of PULL/PVA/PFOTES blendmembrane with 1 wt.% of PFOTES contents and 80/20 mass

Journal of Nanomaterials 3
−4
−2
0
2
4
Hea
tfl
ow(m
W)
50 100 150 200 250
84◦C
95◦C 206.5◦C
224◦C
Temperature (◦C)
(a)
(b)
(c)
(a) PVA(b) PULL/PVA(c) PULL
Figure 1: DSC data of (a) PVA, (b) PULL/PVA blend membraneusing electrospinning method (Applied voltage = 15 kV, TCD=15 cm, Blend ratio (PULL/PVA) = 80/20, and Total polymer con-centration = 9 wt.%), and (c) PULL.
−4
−2
0
2
4
Hea
tfl
ow(m
W)
50 100 150 200 250
84◦C
88.5◦C
208◦C
206.5◦C
Temperature (◦C)
(a) Without PFOTES(b) With PFOTES
(a)
(b)
Figure 2: DSC data of PULL/PVA blend membranes (a) withoutPFOTES, and (b) with PFOTES using electrospinning method(Applied voltage = 15 kV, TCD = 15 cm, Blend ratio (PULL/PVA)=80/20, and Total polymer concentration = 9 wt.%).
ratio of those two polymers at a total polymer concentrationof 9 wt.%. Without PFOTES, PULL/PVA membrane showstwo thermogram peaks of melting transitions (Tm) at 84◦C,and 206.50◦C (Figure 2(a)). These peaks are shifted to88.5◦C and 208◦C with the addition of 1 wt.% PFOTES(Figure 2(b)). The DSC thermograms for the membranesshow clearly the melting transitions of the PULL/PVA blendmembrane, in which there are significant effects of thePFOTES content. The dramatic changes of Tm of the com-posite membranes can be attributed by the introduction ofCF3 groups into heteroatom (O atom) containing hydropho-bic carbon ring of PULL and hydrophobic carbon chain ofPVA.
20
30
40
50
60
70
80
Inte
nsi
ty
Wavenumber (cm−1)
4000 3000 2000 1000
(a)
(b)
(c)
(a) PULL/PVA = 100/0(b) PULL/PVA = 80/20(c) PULL/PVA = 60/40
Figure 3: FTIR data of PULL/PVA blend membrane with variousweight ratios of (a) 100/0, (b) 80/20, and (c) 60/40 using electro-spinning method (Applied voltage = 15 kV, TCD = 15 cm, and Totalpolymer concentration = 9 wt.%).
3.2. FTIR Data of Membranes. FTIR spectra give informationabout the structure of blend membranes studied. In Figure 3,examples of spectra of pure PULL and PULL/PVA blendmembranes at 500–4000 cm−1 range are shown. Pure PULLmembrane exhibits identical bands as shown in Figure 3(a).Strong absorption in 850 cm−1 is characteristic of thea-glucopyranoside units. Absorption in 755 cm−1 indicatesthe presence of α-(1,4) glucosidic bonds, and spectra in932 cm−1 proves the presence of α-(1,6) glucosidic bonds.Besides, in the areas for reference and evaluated samples thefrequencies are analogous [43]. Bands at 2850–3000 cm−1
are due to stretching vibrations of CH and CH2 groupsand bands attribute to CH/CH2 deformation vibrations arepresent at 1300–1500 cm−1 range. Also very intensive, broadhydroxyl band occurs at 3000–3600 cm−1 and accompanyingC–O stretching exists at 1000–1260 cm−1. With the additionof PVA, some absorption peaks of PULL become lowerin intensity, whereas some absorption peaks at 1096 and1447 cm−1 appear and the intensity of these peaks increaseswith augmenting the concentration of PVA (Figures 3(b) and3(c)). This suggests that hydrogen bonds between hydroxylgroups in PULL and hydroxyl groups in PVA could possiblyplay a role in the shift of the peaks. Thus, the FTIR spec-troscopy supports the interactions between PULL and PVA,which are suggested above. Moreover, the absorption peakswhich appeared at 1145 cm−1, 1235 cm−1, and 1430 cm−1
are attributed to the vibrations of CF2 and CF3 groups inPFOTES and the absorption peaks at 700–800 cm−1 are dueto the vibration of Si–O groups in the silanes (Figure 4(b)).Thus, the FTIR spectroscopy supplies also evidences of pos-sible interactions between PULL/PVA blend and PFOTES,which are suggested by DSC.
3.3. TGA Data of Membranes. Thermal stability ofPULL/PVA membranes is measured using TGA in nitrogen

4 Journal of Nanomaterials
20
30
40
50
60
70
80
Inte
nsi
ty
Wavenumber (cm−1)
4000 3000 2000 1000
(a)
(b)
(a) Without PFOTES(b) With PFOTES
Figure 4: FTIR data of PULL/PVA blend membranes (a) withoutPFOTES, and (b) with PFOTES using electrospinning method(applied voltage= 15 kV, TCD= 15 cm, blend ratio (PULL/PVA)=80/20, and total polymer concentration = 9 wt.%).
Table 1: Tensile strength of PULL/PVA blend membranes as a func-tion of PVA contents using electrospinning method (applied voltage= 15 kV, TCD = 15 cm, and total polymer concentration = 9 wt.%).
PVA content (wt.%) Tensile strength (MPa)
0 5.12 ± 0.25
5 5.27 ± 0.25
10 5.42 ± 0.25
15 5.54 ± 0.25
20 5.65 ± 0.25
atmosphere. Figure 5 shows TGA thermograms of differentdecomposition temperature with PULL/PVA mass ratiosof 100/0, and 80/20. The below curve of the TGA data(Figure 5(a)) represents the pure PULL membrane and theupper curve (Figure 5(b)) is for 80/20 blend ratio of PULL/PVA. Clearly, it can be seen that higher thermal stability ofthe membranes could be with the addition of PVA in thePULL/PVA blend system.
3.4. Tensile Strength. Some of the fascination with the behav-ior of polymers comes from the large changes in the physicalproperties and the wide range of mechanical behaviours [44].The tensile strength of the PULL/PVA blend membranesincreases with augmenting the weight percentage of PVA, asshown in Table 1.
3.5. Water Contact Angles of Membranes. Membranes pre-pared by electrospinning method have much higher contactangle because of the high surface area of the formed fibersthat ranges from nanometer to submicron scale. As shownin Figure 6(a), nanofibers electrospun using total polymerconcentration 9 wt.% contain a large number of beads innanometer size (500–1000 nm), whereas less number ofbeads containing nanofibers can be electrospun using total
75
80
85
90
95
Wei
ght
(%)
200 220 240 260 280 300
Temperature (◦C)
0
20
40
60
80
100
Wei
ght
(%)
0 100 200 300 400 500 600
Temperature (◦C)
(a)
(b)
(a)
(b)
(a) PULL/PVA = 100/0(b) PULL/PVA = 80/20
Figure 5: TGA data of PULL/PVA blend membrane with weightratios of (a) 100/0 and (b) 80/20 using electrospinning method(applied voltage = 15 kV, TCD = 15 cm, and total polymer concen-tration = 9 wt.%).
polymer concentration of 12 wt.%, and 9 wt.% and 12 wt.%of total polymer concentrations coupled with PFOTESapplying the same parameters as shown in Figures 6(b), 6(c),and 6(d), respectively. The obtained nanofibers are rangedfrom 200 to 800 nm. The reason for different bead contentsin each concentration is that the Rayleigh forces, whichassist in bead formation, are able to overcome the viscousforces to enable the formation of beads [45]. Moreover,strong interaction between PULL/PVA blends and PFOTESis attributed to the formation of less number of beads inthe fibers. The interaction between PULL/PVA blends andPFOTES can be put forward as a cause to two factors.
First, the introduction of hydrophobic CF3 groups on theheteroatom (O atom) containing hydrophobic carbon ringof PULL and hydrophobic carbon chain of PVA and thesecond factor is the interaction obtained from the formationof hydrogen bonding between polar hydrogen of –OH groupof PULL and PVA with O of PFOTES. Although contactangles of up to 147◦ (Figure 6(a)) and 142◦ (Figure 6(b)) canbe reached by directly electrospinning of 9 wt.% and 12 wt.%

Journal of Nanomaterials 5
5μm
147
(a)
5μm
142
(b)
5μm
155
(c)
5μm
152
(d)
Figure 6: SEM images of membranes prepared from PULL/PVA blend solutions of total polymer concentrations of (a) 9 wt.%, (b) 12 wt.%,(c) 9 wt.% with PFOTES, (d) 12 wt.% with PFOTES using electrospinning method (applied voltage = 15 kV, TCD = 15 cm, blend ratio(PULL/PVA) = 80/20).
140
145
150
155
160
0 1 2 3 4 5
Sample name
(1) 9 wt.% TPC(2) 12 wt.% TPC(3) 9 wt.% TPC/PFOTES(4) 12 wt.% TPC/PFOTES
Wat
erco
nta
ctan
gle
(deg
ree)
Figure 7: Variation of water contact angle with different compo-sitions of PULL/PVA blend polymers of (1) 9 wt.% total polymerconcentration (TPC), (2) 12 wt.% total polymer concentration(TPC), (3) 9 wt.% TPC with PFOTES, and (4) 12 wt.% TPC withPFOTES (blend ratio, PULL/PVA = 80/20).
Table 2: Water contact angles of the prepared membranes.
SamplesPULL/PVA blend ratio
(by wt.%)Water contact
angles
9 wt.% TPC 147 ± 0.25
12 wt.% TPC80/20
142 ± 0.15
9 wt.% TPC/PFOTES 155 ± 1.0
12 wt.% TPC/PFOTES 152 ± 0.5
TPC: total polymer concentration.
of total polymer concentration solutions, respectively, themembranes can not still be considered as superhydropho-bic membranes. Therefore, 9 wt.% and 12 wt.% of totalpolymer concentration solutions coupled with PFOTES areused to successfully prepare superhydrophobic membraneswith high-contact angles of 155◦ (Figure 6(c)) and 152◦
(Figure 6(d)), respectively. Water contact angles of all sam-ples taken in this experiment are shown in Figure 7 (dataare given in Table 2). Higher contact angle of 9 wt.% of totalpolymer concentration than that of 12 wt.% total polymerconcentration can be explained on the basis of surfaceroughness like lotus leaf [2] due to the more bead formationin case of 9 wt.%.

6 Journal of Nanomaterials
4. Conclusions
Superhydrophobic PULL/PVA membranes are prepared byelectrospinning from fluorinated silane functionalizedPULL/PVA blends. It is observed that both of 9 wt.% and12 wt.% of total polymer concentration membranes canonly reach contact angles lower than 150◦ by electrospinningof PULL/PVA blends without using PFOTES. Superhy-drophobic membranes with contact angles of up to 155◦ and152◦ can be achieved by electrospinning of 9 wt.% and12 wt.% of total polymer concentration solutions coupledwith fluorinated silane, respectively. Moreover, thermal sta-bility and mechanical property of the PULL membranes hasbeen enhanced with the introduction of PVA.
Acknowledgment
This project was supported by King Saud University, Dean-ship of Scientific Research, College of Engineering ResearchCenter.
References
[1] X. Feng and L. Jiang, “Design and creation of superwetting/antiwetting surfaces,” Advanced Materials, vol. 18, no. 23, pp.3063–3078, 2006.
[2] W. Barthlott and C. Neinhuis, “Purity of the sacred lotus, orescape from contamination in biological surfaces,” Planta, vol.202, no. 1, pp. 1–8, 1997.
[3] L. Feng, S. Li, Y. Li et al., “Super-hydrophobic surfaces: fromnatural to artificial,” Advanced Materials, vol. 14, no. 24, pp.1857–1860, 2002.
[4] A. Lafuma and D. Quere, “Superhydrophobic states,” NatureMaterials, vol. 2, no. 7, pp. 457–460, 2003.
[5] R. Blossey, “Self-cleaning surfaces—Virtual realities,” NatureMaterials, vol. 2, no. 5, pp. 301–306, 2003.
[6] H. Y. Erbil, A. L. Demirel, Y. Avci, and O. Mert, “Transforma-tion of a simple plastic into a superhydrophobic surface,” Sci-ence, vol. 299, no. 5611, pp. 1377–1380, 2003.
[7] D. Quere, “Rough ideas on wetting,” Physica A, vol. 313, no.1-2, pp. 32–46, 2002.
[8] M. Kang, R. Jung, H. S. Kim, and H. J. Jin, “Preparationof superhydrophobic polystyrene membranes by electrospin-ning,” Colloids and Surfaces A, vol. 313-314, pp. 411–414, 2008.
[9] J. T. Han, X. Xu, and K. Cho, “Diverse access to artificial super-hydrophobic surfaces using block copolymers,” Langmuir, vol.21, no. 15, pp. 6662–6665, 2005.
[10] M. Li, J. Zhai, H. Liu, Y. Song, L. Jiang, and D. Zhu, “Elec-trochemical deposition of conductive superhydrophobic zincoxide thin films,” Journal of Physical Chemistry B, vol. 107, no.37, pp. 9954–9957, 2003.
[11] H. Liu, L. Feng, J. Zhai, L. Jiang, and D. Zhu, “Reversiblewettability of a chemical vapor deposition prepared ZnO filmbetween superhydrophobicity and superhydrophilicity,” Lang-muir, vol. 20, no. 14, pp. 5659–5661, 2004.
[12] T. Onda, S. Shibuichi, N. Satoh, and K. Tsujii, “Super-water-repellent fractal surfaces,” Langmuir, vol. 12, no. 9, p. 2125,1996.
[13] T. J. McCarthy and D. Oner, “Ultrahydrophobic surfaces.Effects of topography length scales on wettability,” Langmuir,vol. 16, no. 20, pp. 7777–7782, 2000.
[14] F. Shi, Z. Wang, and X. Zhang, “Combining a layer-by-layerassembling technique with electrochemical deposition of goldaggregates to mimic the legs of water striders,” AdvancedMaterials, vol. 17, no. 8, pp. 1005–1009, 2005.
[15] K. Tadanaga, J. Morinaga, A. Matsuda, and T. Minami, “Super-hydrophobic—Superhydrophilic micropatterning on flower-like alumina coating film by the sol—Gel method,” Chemistryof Materials, vol. 12, no. 3, pp. 590–592, 2000.
[16] S. Wang, L. Feng, and L. Jiang, “One-step solution-immersionprocess for the fabrication of stable bionic superhydrophobicsurfaces,” Advanced Materials, vol. 18, no. 6, pp. 767–770,2006.
[17] T. Sun, G. Wang, H. Liu, L. Feng, L. Jiang, and D. Zhu, “Con-trol over the wettability of an aligned carbon nanotube film,”Journal of the American Chemical Society, vol. 125, no. 49, pp.14996–14997, 2003.
[18] L. Feng, Y. Song, J. Zhai et al., “Creation of a superhydrophobicsurface from an amphiphilic polymer,” Angewandte Chemie,vol. 42, no. 7, pp. 800–802, 2003.
[19] L. Jiang, Y. Zhao, and J. Zhai, “A lotus-leaf-like superhydro-phobic surface: a porous microsphere/nanofiber compositefilm prepared by electrohydrodynamics,” Angewandte Chemie,vol. 43, no. 33, pp. 4338–4341, 2004.
[20] M. Ma, R. M. Hill, J. L. Lowery, S. V. Fridrikh, and G. C.Rutledge, “Electrospun poly(styrene-block-dimethylsiloxane)block copolymer fibers exhibiting superhydrophobicity,”Langmuir, vol. 21, no. 12, pp. 5549–5554, 2005.
[21] X. Lu, J. Zhou, Y. Zhao, Y. Qiu, and J. Li, “Room temperatureionic liquid based polystyrene nanofibers with superhydro-phobicity and conductivity produced by electrospinning,”Chemistry of Materials, vol. 20, no. 10, pp. 3420–3424, 2008.
[22] Y. I. Yoon, H. S. Moon, W. S. Lyoo, T. S. Lee, and W.H. Park, “Superhydrophobicity of cellulose triacetate fibrousmats produced by electrospinning and plasma treatment,”Carbohydrate Polymers, vol. 75, no. 2, pp. 246–250, 2009.
[23] Y. I. Yoon, H. S. Moon, W. S. Lyoo, T. S. Lee, and W. H. Park,“Superhydrophobicity of PHBV fibrous surface with bead-on-string structure,” Journal of Colloid and Interface Science, vol.320, no. 1, pp. 91–95, 2008.
[24] H. M. Ji, H. W. Lee, M. R. Karim et al., “Electrospinningand characterization of medium-molecular-weight poly(vinylalcohol)/high-molecular-weight poly(vinyl alcohol)/ mont-morillonite nanofibers,” Colloid and Polymer Science, vol. 287,no. 7, pp. 751–758, 2009.
[25] H. J. Jin, J. Chen, V. Karageorgiou, G. H. Altman, and D.L. Kaplan, “Human bone marrow stromal cell responses onelectrospun silk fibroin mats,” Biomaterials, vol. 25, no. 6, pp.1039–1047, 2004.
[26] C. J. Israilides, A. Smith, J. E. Harthill, C. Barnett, G. Bam-balov, and B. Scanlon, “Pullulan content of the ethanol precip-itate from fermented agro- industrial wastes,” Applied Micro-biology and Biotechnology, vol. 49, no. 5, pp. 613–617, 1998.
[27] T. D. Leathers, “Biotechnological production and applicationsof pullulan,” Applied Microbiology and Biotechnology, vol. 62,no. 5-6, pp. 468–473, 2003.
[28] R. Schuster, E. Wenzig, and A. Mersmann, “Production of thefungal exopolysaccharide pullulan by batch-wise and contin-uous fermentation,” Applied Microbiology and Biotechnology,vol. 39, no. 2, pp. 155–158, 1993.
[29] M. R. Karim, H. W. Lee, R. Kim et al., “Preparation and char-acterization of electrospun pullulan/montmorillonite nano-fiber mats in aqueous solution,” Carbohydrate Polymers, vol.78, no. 2, pp. 336–342, 2009.

Journal of Nanomaterials 7
[30] G. Ren, X. Xu, Q. Liu et al., “Electrospun poly(vinyl alco-hol)/glucose oxidase biocomposite membranes for biosensorapplications,” Reactive and Functional Polymers, vol. 66, no. 12,pp. 1559–1564, 2006.
[31] C. Shao, H.-Y. Kim, J. Gong, B. Ding, D.-R. Lee, and S.-J.Park, “Fiber mats of poly(vinyl alcohol)/silica composite viaelectrospinning,” Materials Letters, vol. 57, no. 9-10, pp. 1579–1584, 2003.
[32] K. H. Hong, J. L. Park, I. N. Hwan Sul, J. H. Youk, andT. J. Kang, “Preparation of antimicrobial poly(vinyl alcohol)nanofibers containing silver nanoparticles,” Journal of PolymerScience B, vol. 44, no. 17, pp. 2468–2474, 2006.
[33] N. Ristolainen, P. Heikkila, A. Harlin, and J. Seppala, “Poly(vinyl alcohol) and polyamide-66 nanocomposites preparedby electrospinning,” Macromolecular Materials and Engineer-ing, vol. 291, no. 2, pp. 114–122, 2006.
[34] J. H. Park, M. R. Karim, I. K. Kim et al., “Electrospin-ning fabrication and characterization of poly(vinyl alcohol)/montmorillonite/silver hybrid nanofibers for antibacterialapplications,” Colloid and Polymer Science, vol. 288, no. 1, pp.115–121, 2010.
[35] B. Duan, L. Wu, X. Li et al., “Degradation of electrospunPLGA-chitosan/PVA membranes and their cytocompatibilityin vitro,” Journal of Biomaterials Science, vol. 18, no. 1, pp. 95–115, 2007.
[36] H. W. Lee, M. R. Karim, H. M. Ji et al., “Electrospin-ning fabrication and characterization of Poly(vinyl alcohol)/montmorillonite nanofiber mats,” Journal of Applied PolymerScience, vol. 113, no. 3, pp. 1860–1867, 2009.
[37] S. Krause, D. R. Paul, and S. Newman, Polymer-Polymer Com-patibility, in Polymer Blends, Academic Press, New York, NY,USA, 1978.
[38] D. F. Varnell and M. M. Coleman, “FT i.r. studies of polymerblends: V. Further observations on polyester-poly(vinyl chlo-ride) blends,” Polymer, vol. 22, no. 10, pp. 1324–1328, 1981.
[39] D. F. Varnell, J. P. Runt, and M. M. Coleman, “FT i.r. and ther-mal analysis studies of blends of poly(ε-caprolactone) withhomo- and copolymers of poly(vinylidene chloride),” Poly-mer, vol. 24, no. 1, pp. 37–42, 1983.
[40] E. M. Woo, J. W. Barlow, and D. R. Paul, “Phase behavior ofblends of aliphatic polyesters with a vinylidene chloride/vinylchloride copolymer,” Journal of Applied Polymer Science, vol.32, no. 3, pp. 3889–3897, 1986.
[41] M. S. Islam, N. Akter, and M. R. Karim, “Preparation of super-hydrophobic membranes by electrospinning of fluorinatedsilane functionalized pullulan,” Colloids and Surfaces A, vol.362, no. 1–3, pp. 117–120, 2010.
[42] J. S. Lee, K. H. Choi, H. D. Ghim et al., “Role of molecularweight of atactic poly(vinyl alcohol) (PVA) in the structureand properties of PVA nanofabric prepared by electrospin-ning,” Journal of Applied Polymer Science, vol. 93, no. 4, pp.1638–1646, 2004.
[43] H. P. Seo, C. W. Son, C. H. Chung et al., “Production of highmolecular weight pullulan by Aureobasidium pullulans HP-2001 with soybean pomace as a nitrogen source,” BioresourceTechnology, vol. 95, no. 3, pp. 293–299, 2004.
[44] R. F. T. Stepto, Polymer Networks, John Wiley & Sons, Chich-ester, UK, 1998.
[45] Y. M. Shin, M. M. Hohman, M. P. Brenner, and G. C. Rutledge,“Electrospinning: a whipping fluid jet generates submicronpolymer fibers,” Applied Physics Letters, vol. 78, no. 8, pp.1149–1151, 2001.

Hindawi Publishing CorporationJournal of NanomaterialsVolume 2011, Article ID 694879, 10 pagesdoi:10.1155/2011/694879
Research Article
New Resistive Switching and Self-Regulating Heating in FoliatedGraphite/Nickel Polyvinyl Chloride Nanocomposites
Omar A. Al-Hartomy,1, 2 Falleh Al-Salamy,3 A. A. Al-Ghamdi,2 Attieh A. Al-Ghamdi,4
A. M. Abdel Daiem,2, 5 and Farid El-Tantawy6
1 Department of Physics, Faculty of Science, University of Tabuk, Tabuk 71491, Saudi Arabia2 Department of Physics, Faculty of Science, King Abdulaziz University, Jeddah, P.O. Box 80203, Jeddah 21569, Saudi Arabia3 Department of Mathematics, Faculty of Science, University of Tabuk, Tabuk 71491, Saudi Arabia4 Electronics, Communications, and Photonics Program, King Abdulaziz City for Science and Technology, Riyadh, Saudi Arabia5 Department of Physics, Faculty of Science, Zagazig University, Zagazig 44519, Egypt6 Department of Physics, Faculty of Science, Suez Canal University, Ismailia 41522, Egypt
Correspondence should be addressed to Farid El-Tantawy, [email protected]
Received 18 May 2011; Revised 26 June 2011; Accepted 18 July 2011
Academic Editor: Sadhan C. Jana
Copyright © 2011 Omar A. Al-Hartomy et al. This is an open access article distributed under the Creative Commons AttributionLicense, which permits unrestricted use, distribution, and reproduction in any medium, provided the original work is properlycited.
Polyvinyl chloride- (PVC-) based nanocomposites containing nanosized graphite and nickel nanoparticles (GN) as conductivefillers to achieve positive temperature coefficient of resistance (PTCR) thermistors and self-regulating heater function have beensuccessfully fabricated. The microstructure of the foliated graphite and nanocomposites was examined by scanning electronmicroscopy (SEM). The effect of GN content on the static electrical conductivity, carrier’s mobility, and number of charge carriersof the nanocomposites was studied. The applicability of nanocomposites as PTCR thermistors was examined by monitoring theconductivity as a function of temperature. It is found that the conduction mechanism in PVC/GN nanocomposites is governedby tunneling mechanism. Also, the applied voltage versus current and temperature were studied to check the applicability ofcomposites as self-regulating heater. The results show that the PVC/GN nanocomposites might have potential applications inPTCR devices, self-regulating heater, and temperature sensors.
1. Introduction
The design and applications of electroactive conductivepolymer nanocomposites in the electrical and electronicfields have significantly affected the modern technologyand added a new dimension to scientific interest [1–3].The most economical route for fabrication of electroactive conducting polymer composites is the inclusion of aconductive filler such as carbon black, carbon nanotubes,graphite, metal powders, ceramic oxides, polyaniline, andothers in an insulating polymer matrix and subsequentcompaction by compression molding [4–8]. These electroactive nanocomposites attracted great interests due to theirpotential applications in various hi-tech aspects, for example,positive and/or negative temperature coefficient of resistance(PTCR/NTCR) thermistors [9], electrochemical displayers
[10], sensors [11, 12], catalysis [13], redox capacitors[14], electromagnetic shielding [15, 16], radar evasion [17],rechargeable batteries [18, 19], conductive inks and antistatictextiles [20, 21], and aero space [3, 12] as well as in secondarybattery and bipolar plates in the polymer electrolytemembrane fuel cell, and so forth [20]. A PTCR compositeis a grain-boundary resistive effect which is characterizedby an increase in resistivity with increasing temperature[14–16]. The traditionally thermistor materials irrespectiveof its applications can be broadly divided into threecategories, namely, metals (such as titanium and platinum),semiconductors (such as Si, Ge, and SiC), and ceramicoxide semiconductors (like single- and multicomponentoxides) [17, 18]. The use of traditional thermistors has beenconfined because of the low room temperature conductivityand the oxidation of the metallic particles that severely limits

2 Journal of Nanomaterials
the current flow [11, 19]. Furthermore, when particulatefillers such as carbon black and metal are added to polymericsystems, a huge increase in the melt viscosity is observedwhich makes the melt processing of the composites moredifficult and disrupts the mechanical properties restrictingtheir application of thermistors [21]. Recently, the demand ofPTCR composites with high room temperature conductivityis rising in markets, in a wide range of applications especiallyin automobiles that need PTCR materials with large currentcarrying capacity [14], self-regulating heater [18], protectioncircuits [19], temperature sensors [8, 15], infrared radiationdetector sensors, flow meters [5], current limiters [7],temperature controlled heater [10], ambient thermal stateindicators [11], and so on. To our best knowledge, therehave been no reported investigation of the PTCR thermistorsand self-regulating heater from dispersed dual conductingphases foliated graphite and nickel nanoparticles (GN)into polyvinyl chloride (PVC) matrix. In the current study,our investigations are focused on the fabrication anddevelopment of newly electrically conducting PVC-basedcomposites, containing multicomponent fillers (i.e., GN)and on the possibilities for their potential application inPTCR thermistors devices and self-regulating heater.
2. Experimental Details
2.1. Materials. Natural flake graphite purchased from Shan-dong Qingdao Graphite Company (Qingdao, China) withan average diameter of 500 μm is used for preparing theexpanded graphite (exfoliated). Commercially concentratedsulfuric and nitric acids obtained from Egyptian ChemicalCompany, Cairo, Egypt, were used as chemical intercalateand oxidizer to prepare exfoliated graphite. 95% (v/v) alco-hol and distilled water were used as solvents for preparationof foliated (nanosheets) graphite. Polyvinyl chloride (PVC)with an average molar mass number being 2000 was suppliedfrom Tokyo Chemical Industry Co., Ltd., Tokyo, Japan.Nickel powder was supplied by Wako Chemical Companywith particle size of 10 micrometers.
2.2. Preparation of Exfoliated Graphite. Natural flake graphitewas first dried in a vacuum oven for 24 h at 120◦C. Then, amixture of concentrated sulfuric and nitric acids (ratio 3 : 1,v/v) was slowly added to a glass flask containing graphiteflakes with vigorous stirring. After 36 h of reaction, theacid-treated graphite flake was filtered and washed withdeionized water until the pH level of the solution reached6.6. After being dried at 100◦C for 72 h, the resulting graphiteintercalation compound was subjected to a thermal shock at1050◦C for 30 seconds in a muffle furnace to form exfoliated(expanded) graphite.
2.3. Preparation of Graphite Nanosheets. 1 g of exfoliatedgraphite was mixed and saturated with 400 mL alcoholsolution consisting of alcohol and distilled water with aratio of 68 : 32 for 24 h. The mixture was then subjectedto ultrasonic irradiation with a power of 400 watt for 24 h.After 24 h of sonication, exfoliated graphite particles were
effectively fragmented into foliated (nanosheets) graphite.The foliated graphite dispersion was then filtered and dried at100◦C to remove residual solvents. The as-prepared foliatedgraphite powder will be called graphite nanosheets (G)throughout the paper.
2.4. Preparation of Nickel Nanoparticles. The starting mate-rial for ball milling is Ni powder (250 mesh) with purityabove 99.9%. The Ni powder was placed in a stainless steelvial with stainless steel balls of 10 mm diameter. The ball-to-powder ratio 20 : 1 was used in the planetary mill (MarconiMA 350 ball mill) at 400 rpm under argon atmosphere for6 h to obtain nickel nanoparticles (N).
2.5. Preparation of Conducting PVC-Based Nanocomposites.The conducting fillers are composed of graphite nanosheets(thickness: 30–50 nm) with an average thickness of about40 nm (the number of sheets in the platelets is 100) and Niwith an average particles size of 12 nm. First, the as-preparedgraphite nanosheets and nickel nanoparticles 80/20 wt%were mixed together in a kitchen machine Philips mixer for1 h. Second the as-received conducting mixture was added tothe PVC matrix and mixed for 30 min. Then the mixtureswere transferred to a hot press and tested samples wereprepared at pressure of 40 KN/m2 and temperature of 180◦Cfor 30 min. Several batches of PVC/GN weight ratios wereconsidered: 97 : 03, 96 : 07, 91 : 09, and 88 : 12, respectively,and abbreviated as GN3, GN6, GN9, and GN12, respectively.
2.6. Characterization and Tests. Scanning Electron Micro-scopy (SEM) micrographs and energy dispersive X-rayanalysis (EDX) spectra were obtained with a JEOL JSM6400 scanning electron microscope equipped with a Linkanalytical system. The electron energy used was 15 keV. Thespecimens were coated with carbon using a vacuum evapo-rator (JEOL, GEE 500). The specific electrical conductivitytemperature dependence was performed for the compositesby dc two-probe method using a computer-aided system inthe temperature range from 22◦C to 150◦C in air. The currentwas measured through the sheet sample under a steadyconstant voltage using a digital Keithley 642 electrometer.The two sides of the samples were bended with Cu rodduring curing process to reduce the contact resistance.Hall effect measurement was used to determine the carriertype, concentration, and mobility. The measurements wereperformed using the van der Pauw configuration underdirect current ranging from 2× 10⁻³ to 4× 10⁻⁴A, and theapplied magnetic field was 0.33 T. The equipment used forthis purpose was a Keithley source meter (model 231). Thecurrent-voltage (I − V) characteristic curves were measuredwith a precision semiconductor parameter analyser (Keithley442 source measure unit). Silver paste was used to ensure agood contact of the sample surface with copper electrodes.The temperature for each applied voltage on the sample wasmeasured by thermocouple embedded inside the samplesduring compression molding. The dielectric constant of thecomposite specimen was obtained from the capacitance ofthe specimen, the area of Ag electrode, and the thickness

Journal of Nanomaterials 3
5 kV ×1, 000 10μm 0004 Carbon 8
(a)
Mag10.000x
HV5.00 kV
WD5.1 mm
10μmNR +37.5 G + 37.5 ISFA
(b)
Mag10.000x
HV5.00 kV
WD5.9 mm
100μmNR +25 G + 25 ISFA
(c)
1
2
2
1: Nickel2: Graphite
1 2 3 4 5 6 7 8 9 10Energy·keV
(d)
Figure 1: (a) SEM images of graphite nanosheets prepared after 24 h ultrasonic treatment and (b) SEM image of GN12 sample magnificationwith 10 x 0000. (c) SEM image of GN12 sample magnification with 1000 and (d) EDX pattern recorded for GN nanoparticles.
of the composite specimen. Circular-shaped samples with20 mm diameter and ca. 1.3 mm thickness were prepared fordielectric measurement. Silver paste was used to coat the twosides of the specimen as electrodes. The capacitance of thespecimen was measured with a network analyzer (E38362B)at frequency of 100 Hz. The specific heat capacity (Cp)of the samples was calculated using differential scanningcalorimeter measurements (Perkin-Elmer DSC-2; PerkinElmer Cetus Instruments, Norwalk, CT) using sapphire asthe reference material.
3. Results and Discussion
3.1. Network Structure Observation of Nanocomposites. SEMobservations from cross-sections of foliated graphite wereperformed to understand the microstructure occurrence
during intercalation. Figure 1(a) shows the SEM image offoliated graphite nanosheets prepared based on 24 h ultra-sonic irradiation. It is clearly apparent that the exfoliatedgraphite worms have been completely torn into foliated,named graphite nanosheets. The powder has an apparentdensity of about 0.015 g/cm3, much lower than the massdensity of the original natural flake graphite which is2.2 g/cm3 [1, 7].
Generally, the entire concept of electrical propertieslike percolation and PTCR behavior in nanocompositethermistors is mainly dependent on microstructure and filleraspect ratio [5, 21]. The surface morphology of foliatedgraphite and the composites was examined by scanningelectron microscopy. Typical SEM micrograph of GN12 withdifferent magnification is depicted in Figures 1(b) and 1(c).As can be seen, the GN nanoparticles have good affinity and
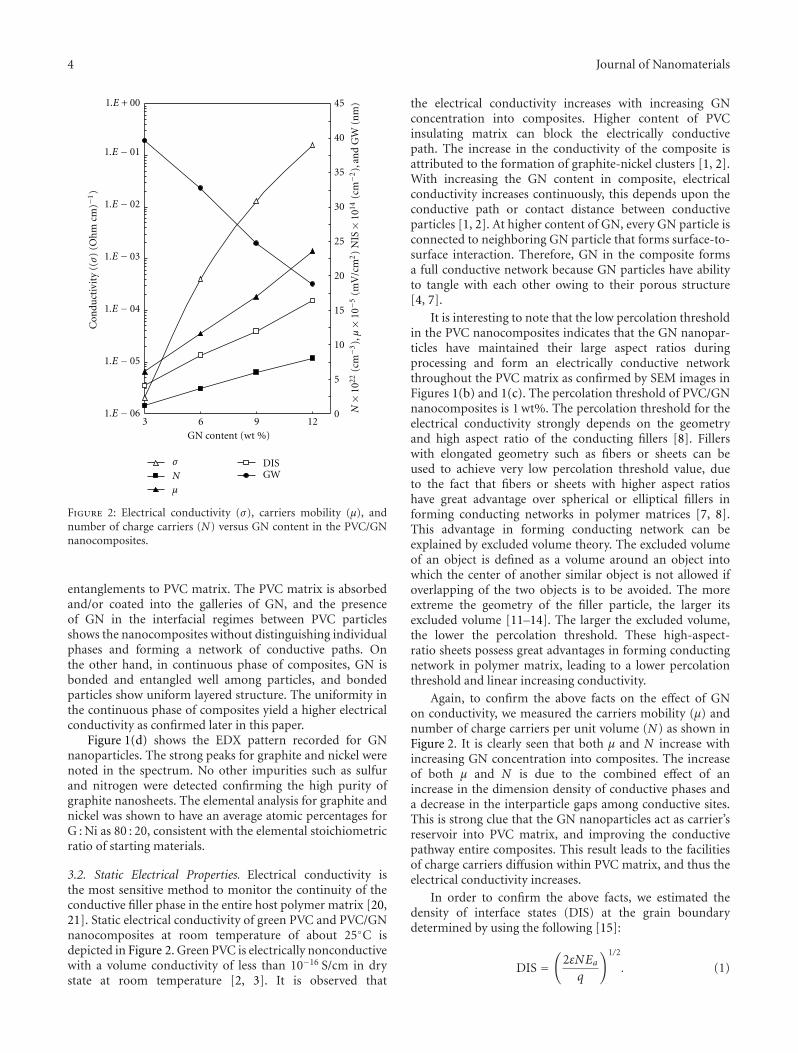
4 Journal of Nanomaterials
1.E − 06
1.E − 05
1.E − 04
1.E − 03
1.E − 02
1.E − 01
1.E + 00
3 6 9 12GN content (wt %)
Con
duct
ivit
y((σ
)(O
hm
cm)−
1)
0
5
10
15
20
25
30
35
40
45
N×
1022
(cm−3
),μ×
10−5
(mV
/cm
2)
NIS×
1014
(cm−2
),an
dG
W(n
m)
σ
N
μ
DISGW
Figure 2: Electrical conductivity (σ), carriers mobility (μ), andnumber of charge carriers (N) versus GN content in the PVC/GNnanocomposites.
entanglements to PVC matrix. The PVC matrix is absorbedand/or coated into the galleries of GN, and the presenceof GN in the interfacial regimes between PVC particlesshows the nanocomposites without distinguishing individualphases and forming a network of conductive paths. Onthe other hand, in continuous phase of composites, GN isbonded and entangled well among particles, and bondedparticles show uniform layered structure. The uniformity inthe continuous phase of composites yield a higher electricalconductivity as confirmed later in this paper.
Figure 1(d) shows the EDX pattern recorded for GNnanoparticles. The strong peaks for graphite and nickel werenoted in the spectrum. No other impurities such as sulfurand nitrogen were detected confirming the high purity ofgraphite nanosheets. The elemental analysis for graphite andnickel was shown to have an average atomic percentages forG : Ni as 80 : 20, consistent with the elemental stoichiometricratio of starting materials.
3.2. Static Electrical Properties. Electrical conductivity isthe most sensitive method to monitor the continuity of theconductive filler phase in the entire host polymer matrix [20,21]. Static electrical conductivity of green PVC and PVC/GNnanocomposites at room temperature of about 25◦C isdepicted in Figure 2. Green PVC is electrically nonconductivewith a volume conductivity of less than 10−16 S/cm in drystate at room temperature [2, 3]. It is observed that
the electrical conductivity increases with increasing GNconcentration into composites. Higher content of PVCinsulating matrix can block the electrically conductivepath. The increase in the conductivity of the composite isattributed to the formation of graphite-nickel clusters [1, 2].With increasing the GN content in composite, electricalconductivity increases continuously, this depends upon theconductive path or contact distance between conductiveparticles [1, 2]. At higher content of GN, every GN particle isconnected to neighboring GN particle that forms surface-to-surface interaction. Therefore, GN in the composite formsa full conductive network because GN particles have abilityto tangle with each other owing to their porous structure[4, 7].
It is interesting to note that the low percolation thresholdin the PVC nanocomposites indicates that the GN nanopar-ticles have maintained their large aspect ratios duringprocessing and form an electrically conductive networkthroughout the PVC matrix as confirmed by SEM images inFigures 1(b) and 1(c). The percolation threshold of PVC/GNnanocomposites is 1 wt%. The percolation threshold for theelectrical conductivity strongly depends on the geometryand high aspect ratio of the conducting fillers [8]. Fillerswith elongated geometry such as fibers or sheets can beused to achieve very low percolation threshold value, dueto the fact that fibers or sheets with higher aspect ratioshave great advantage over spherical or elliptical fillers informing conducting networks in polymer matrices [7, 8].This advantage in forming conducting network can beexplained by excluded volume theory. The excluded volumeof an object is defined as a volume around an object intowhich the center of another similar object is not allowed ifoverlapping of the two objects is to be avoided. The moreextreme the geometry of the filler particle, the larger itsexcluded volume [11–14]. The larger the excluded volume,the lower the percolation threshold. These high-aspect-ratio sheets possess great advantages in forming conductingnetwork in polymer matrix, leading to a lower percolationthreshold and linear increasing conductivity.
Again, to confirm the above facts on the effect of GNon conductivity, we measured the carriers mobility (μ) andnumber of charge carriers per unit volume (N) as shown inFigure 2. It is clearly seen that both μ and N increase withincreasing GN concentration into composites. The increaseof both μ and N is due to the combined effect of anincrease in the dimension density of conductive phases anda decrease in the interparticle gaps among conductive sites.This is strong clue that the GN nanoparticles act as carrier’sreservoir into PVC matrix, and improving the conductivepathway entire composites. This result leads to the facilitiesof charge carriers diffusion within PVC matrix, and thus theelectrical conductivity increases.
In order to confirm the above facts, we estimated thedensity of interface states (DIS) at the grain boundarydetermined by using the following [15]:
DIS =(
2εNEa
q
)1/2
. (1)

Journal of Nanomaterials 5
Once the concentration of charge carriers (N) and activationenergy (Ea) are known, the gap width (GW) among conduc-tive sites was determined by the following:
GW = N
DIS. (2)
The computed values of DIS and GW as a function ofGN content is depicted in Figure 2. It is clear that DISincreases while GW decreases with increasing GN contentinto composites. This is ascribed to the fact that the inclusionof GN content into composites enhances the number ofelastically effective chains and interfacial bonding amongfiller and matrix.
However, the relation between composite conductivityand conducting filler contents in the vicinity of the percola-tion threshold can be described by a simple power law [6, 8]:
σc = σ f
(φf − φc
)β, (3)
where σc is the composite conductivity, σ f is the conductivityof conductive filler, φf is the volume fraction of conductivefiller, φc is the percolation threshold, and β is the crit-ical exponent. For lattice in three dimensions, β usuallylies between 1.65 and 2.0, accepted as a universal value[5, 9].
The computed value of the critical exponent (β) forPVC/GN nanocomposites is 3.12, and this value is muchhigher than the universal one, indicating the nonuniversaltransport behavior of the PVC/GN nanocomposites [15–18].It has been demonstrated that very high values of criticalexponents tend to occur when the conducting particles haveextreme geometries [5, 6]. Presence of tunneling conductioncan also lead to nonuniversal critical exponent [10, 11].The graphite nanosheets used here possess an average aspectratio of as high as about 400. Such an extreme geometrymight be a factor contributable to the high critical exponent.Thus, tunneling through the insulating PVC barriers isexpected leading to nonuniversal transport properties of theconducting nanocomposites [7, 8].
3.3. PTCR Thermistors and Transport Mechanism. The tem-perature dependence of conductivity was examined, as atool for understanding the mechanism of charge carrier’stransport in the PVC/GN nanocomposites and to get apossibility of the application of PVC/GN nanocompositesas PTCR thermistors devices. The temperature dependenceof electrical conductivity of PVC/GN nanocomposites isdepicted in Figure 3. It is seen that a transition temperatureof PTCR curves systematically moved to higher temper-atures as the GN content was increased. With increasingGN content, the transition temperature shifted higher.This behavior indicates that more volume expansion ofthe polymer, allowed for by the increased temperature,was required to pull the conducting particles apart [21].Increasing the GN content well tended to further decreasethe room temperature resistivity and the magnitude in thePTC effect. This strong clue indicates that the inclusionof GN content enhances the thermal stability and skeleton
1.E − 08
1.E − 06
1.E − 04
1.E − 02
1.E + 00
20 70 120Temperature (◦C)
Con
duct
ivit
y(O
hm
cm)−
1
GN3GN6
GN9GN12
Figure 3: Electrical conductivity temperature dependence ofPVC/GN nanocomposites.
molecular structure of nanocomposites. Clearly, at relativelylow temperature, the conductivity slightly decreases up tocertain temperature (i.e., so-called critical or percolationtemperature) after which the conductivity quickly increasesdepending on GN content into composites. There aretwo main reasons evoked for these phenomena. First, aspotential barrier increases proportionally with temperature,electrical resistivity increases very quickly as it dependsexponentially on potential barrier. Second, at high tem-perature, the thermal expansion of polymer increases andthe intermolecular distance among conductive segmentsincreases, which leads to the scattering of charge carri-ers and thereof the conductivity decreases (i.e., resistivityincreases).
The electrical conductivity (σ) is related to the activationenergy (Ea) by [17, 18]
σ = A exp(− EaKBT
), (4)
where A is a constant, KB is the Boltzmann constant, and Tis the Kelvin temperature.
The activation energy of the nanocomposites was cal-culated from the slope of ln σ versus 1/T curve, and thedata is depicted in Figure 4. It is observed that the activationenergy decreases with an increase of GN amount into thenanocomposites. This could occur due to the increasedcharge carrier concentration, which leads to an increase ofthe localized state density in the band gap [1, 16].
Mott’s Variable-Range-Hopping (VRH) model isextensively used to analyze the temperature dependence ofdc conductivity in conducting polymer composites and for

6 Journal of Nanomaterials
0
2
4
6
8
10
3 6 9 12GN content (wt%)
Rh(A
),N
(Ef)×
1022
(eV−1
cm−3
)an
d,T
0×
106
(K)
0
0.2
0.4
0.6
0.8
1
Ea
andEh
(eV
)
T0 Rh
N(EF ) EaEh
Figure 4: Computed values of Rh, N(Ef ), T0, Ea, and Eh forPVC/GN nanocomposites.
the three-dimensional hopping mechanism, which isexpressed as [19, 20]
σ = σ0 exp(−T0
T
)1/4
,
T0 = 16
KBN(Ef
)γ3
,(5)
where N(Ef ) is the density of states at the Fermi level, T0 isthe Mott’s temperature, and γ is the localization length andis taken to be 3A [7, 8].
The average hopping distance (Rh) between two localizedstates and the hoping energy (Eh) is given by the following[3, 13]:
Rh =(
38
)(T0
T
)1/4
,
Eh =(
14
)KBT
(T0
T
)1/4
.
(6)
The computed value of T0, N(Ef ), Rh, and Eh as a functionof GN content into composites is depicted in Figure 4. Itis evident that T0, N(Ef ), Rh, and Eh decrease as the GNcontent increases into composites. The observed values ofT0, N(Ef ), Rh, and Eh point to an effective energy separationbetween the localized states [16, 19]. It is worth mentioningthat the conductivity values and estimated Mott parametersindicate a good interaction between PVC polymer matrixand GN nanoparticles. The interaction among PVC andGN fillers could be explained by the strong molecularinteraction between fillers and matrix. Finally, in Figure 4,it is interesting to note that the value of Ea is different from
80
60
40
20
00 10 20 30
Cu
rren
t(m
A)
Applied voltage (Volt)
Switching voltage
GN3GN6
GN9GN12
Figure 5: Current-voltage dependence of PVC/GN nanocompos-ites.
the value of Eh. This is strong evidence that the conductionmechanism of PVC/GN nanocomposite is governed bytunneling mechanism as confirmed above [9, 16].
3.4. Voltage-Current Relationship and Self-Heating Behavior.The variation of current (I) with applied voltage (V)for PVC/GN nanocomposites is depicted in Figure 5. Theincrease of GN content shifted the V − I curves toward a lowelectric field and a high current. This indicates that migrationof curves will cause a lower nonlinearity [11]. Clearly theI−V characteristics are linear at low applied voltage withoutany remarkable change of the sample temperature, indicatingthe tunneling of electrons on the application of voltage[2, 14]. Increasing the electric field above, a certain valuedepends on GN contents, leading to an increase in theJoule heating effect and consequently an increase in thebulk sample temperature. Therefore, I − V characteristicsdeviate from linear (Ohmic) to nonlinear (non-Ohmic)behavior. By increasing the electric field to a certain value(i.e., switching voltage, see Figure 5), which depends on GNcontents, the current decreases showing negative resistance(i.e., switching effect). The negative resistance is attributed totwo reasons. First, at high applied voltage the Joule heatingtakes place and the temperature of the bulk compositesincreases. This results in an increase in the interparticlesdistance among conductive sites and the transport of chargecarriers decreases. Second, the decrease of current is clearlygenerated by a repulsive force among positive and negativecharges at high applied potential in the PVC matrix [4].
The dependence of surface temperature (T) on appliedvoltage for PVC/GN nanocomposites is depicted in Figure 6.It is seen that at low voltage the surface temperature slightlyincreased. With increasing applied voltage, the surfacetemperature increases; this is due to the Joule or self-heating effect. It is worthily to note that the temperature
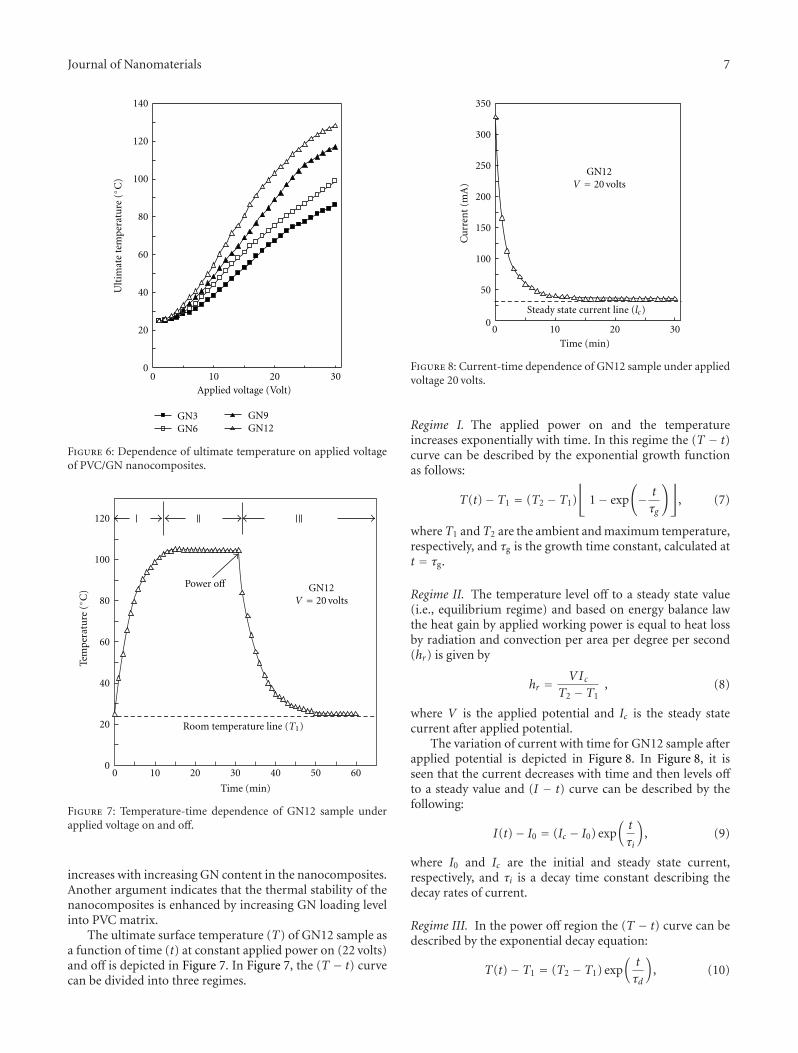
Journal of Nanomaterials 7
0
20
40
60
80
100
120
140
0 10 20 30Applied voltage (Volt)
Ult
imat
ete
mpe
ratu
re(◦
C)
GN3GN6
GN9GN12
Figure 6: Dependence of ultimate temperature on applied voltageof PVC/GN nanocomposites.
120
100
80
60
40
20
00 10 20 30 40 50 60
Time (min)
Tem
pera
ture
(◦C
)
Power off GN12V = 20 volts
Room temperature line (T1)
Figure 7: Temperature-time dependence of GN12 sample underapplied voltage on and off.
increases with increasing GN content in the nanocomposites.Another argument indicates that the thermal stability of thenanocomposites is enhanced by increasing GN loading levelinto PVC matrix.
The ultimate surface temperature (T) of GN12 sample asa function of time (t) at constant applied power on (22 volts)and off is depicted in Figure 7. In Figure 7, the (T − t) curvecan be divided into three regimes.
GN12V = 20 volts
350
300
250
200
150
100
50
00 10 20 30
Cu
rren
t(m
A)
Time (min)
Steady state current line (lc)
Figure 8: Current-time dependence of GN12 sample under appliedvoltage 20 volts.
Regime I. The applied power on and the temperatureincreases exponentially with time. In this regime the (T − t)curve can be described by the exponential growth functionas follows:
T(t)− T1 = (T2 − T1)
⌊1− exp
(− t
τg
)⌋, (7)
whereT1 andT2 are the ambient and maximum temperature,respectively, and τg is the growth time constant, calculated att = τg.
Regime II. The temperature level off to a steady state value(i.e., equilibrium regime) and based on energy balance lawthe heat gain by applied working power is equal to heat lossby radiation and convection per area per degree per second(hr) is given by
hr = VIcT2 − T1
, (8)
where V is the applied potential and Ic is the steady statecurrent after applied potential.
The variation of current with time for GN12 sample afterapplied potential is depicted in Figure 8. In Figure 8, it isseen that the current decreases with time and then levels offto a steady value and (I − t) curve can be described by thefollowing:
I(t)− I0 = (Ic − I0) exp(t
τi
), (9)
where I0 and Ic are the initial and steady state current,respectively, and τi is a decay time constant describing thedecay rates of current.
Regime III. In the power off region the (T − t) curve can bedescribed by the exponential decay equation:
T(t)− T1 = (T2 − T1) exp(t
τd
), (10)

8 Journal of Nanomaterials
where τd is the decay time constant and is related to the heattransfer from the sample to the surrounding which dependson the GN content in composite.
In this regime (i.e., power off), if the thermistor has auniform temperature during cooling, the following equationis valid for the cooling, of thermistor in the time interval dtand according to the Newton’s law of cooling [4, 5]:
Cp(Newton′s) =
hr(T2 − T1)dtmdT
. (11)
The solution of this equation for any value of time (t) is givenby (8). From (8) and (9) we obtain Cp(Newton
′s) in the form
[4, 5]
Cp(Newton′s) =
(hrτdm
)(1− exp
(− t
τd
)). (12)
For the sake of using these nanocomposites in industrialapplications, it is useful to define the whole amount of heattransfer from the composites using the conservation lawof energy. We consider that for an applied voltage (V) oncomposites at time t = 0. The self-heating effect causes thesample temperature to increase from T(t) to T(t + dt) at atime interval from t to t + dt, which produce an electricalenergy (i.e., Joule heat energy). According to the energyconservation approach one has the following [20, 21]:
∫ t=tm
t=0VI(t)dt = mCp(cons)
∫ t=tm
t=0
∂Ts(t)∂t
dt
+ Ahr
∫ t=tm
t=0((T(t)− T1))dT ,
(13)
where m is the mass of the specimen, A is the area of thespecimen, and Cp(cons) is the specific heat capacity of thecomposite.
Taking (7)–(12) into (13) and integrating the resultantequation will obtain the following:
VIct + V(I0 − Ic)τi
[1− exp
(− t
τi
) ]
= mCp(cons)(T2 − T1)
⌊1− exp
(− t
τg
)⌋
+ hrcA(T2 − T1)t − hrcA(T2 − T1)τg
×[
1− exp
(− t
τg
) ].
(14)
By integrating (10) we get Cpc in the form:
Cpc =(
1m(T2 − T1)
)[Vatm(T2 − T1)]
+ ln(tm + t0t0
)+ VaImtm
−Ahr(T2 − T1)
(tm − exp
(− t
τg
)).
(15)
The computed values of τg , τd, τi, hr , Cp(Newton′s), and
Cp(conservation), as a function of GN content are recorded in
Table 1: Some physical properties of PVC/GN nanocomposites.
Physical parameter GN3 GN6 GN9 GN12
Cp (measured) (J Kg−1 K−1) 680 683 688 693
Cp (Newton’s) (J Kg−1 K−1) 682 685 689 695
Cp (conservation) (J Kg−1 K−1) 681 684 690 694
τg (min) 12.34 11.01 8.45 4.65
τd (min) 13.43 10.21 7.78 4.23
τi (min) 11.98 7.48 6.37 3.98
hr (J m−2 s−1◦C−1) 81 74 66 54
Table 1. By a close look at Table 1, it is seen that τg , τd, andτi decrease with increasing GN content into composites. Thisis referred to where the increase of the number of elasticallyeffective chains density increases with increasing GN contentinto composites. This is strong clue that the inclusion ofGN nanoparticles enhances the skeleton internal structure ofthe PVC matrix, thus rendering it more thermodynamicallystable. Also, it is observed that the hr decreases as GN contentincreases indicating the lower efficiency of heat transfer byradiation and convection into composites. This reflects thatthe inclusion of GN improves the inner architecture structureand crosslinking density of nanocomposites.
Finally, the measured and computed values of specificheat capacity increase with increasing GN content intonanocomposites. It is interesting to note that the measuredand estimated values of specific heat capacity by conservationlaw of energy and Newton’s law of cooling are quite close.This is evidenced in that the inclusion of GN improves thethermal stability and thermal conductivity of the nanocom-posite. Monitoring dynamic resistivity (i.e., isothermal resis-tance relaxation with time) provided additional informationabout the stability of composites. The isothermal resistancechanges with time at constant temperature of 110◦C forPVC/GN nanocomposites as is depicted in Figure 9. It is clearthat the resistance undergoes a sudden increase followed bya decrease in resistance, after which it levels off dependingon the GN content into composites. The sudden increase ofresistance at the beginning is attributed to a rapid increaseof volume expansion of the polymer matrix. It is clear thatthe time for the resistance to reach the maximum is shorteras the GN content increases in composites. This can beexplained where, at low content of GN, the slow diffusionof GN nanoparticles occurs from one grain site to anotherleading to change the charge distribution which in turn willchange the effective carrier density and hence the compositeresistivity. In light of the above discussion, we proposethat the interfacial bonding and entanglements among PVCmoieties increase with the increase of GN contents.
4. Conclusions
In this study a new family of electro active polymernanocomposites thermistors and self-heating based on poly-vinyl chloride- (PVC-) reinforced foliated graphite andNi nanoparticles (GN) have been successfully fabricated.

Journal of Nanomaterials 9
1.E + 02
1.E + 03
1.E + 04
1.E + 05
1.E + 06
0 20 40 60 80 100
Time (min)
Res
ista
nce
(Oh
m)
GN3GB6
GN9GN12
Figure 9: Isothermal resistance changes with time at constanttemperature of 110◦C for PVC/GN nanocomposites.
The effect of GN filler loading on the microstructure andelectrical properties was studied. Based on the experimentaldata, the following conclusions can be made.
(1) Scanning electron microscope showed that the inclu-sion of GN nanoparticles improves the skeletoninternal structure of PVC/GN composites.
(2) The electrical conductivity of the PVC/GN nanocom-posites showed a transition from an insulator to asemiconductor. The transition could be describedby classical percolation theory with a critical expo-nent of about 3.12. The PVC/GN nanocompositesexhibited the lowest percolation threshold of about0.7 wt%. This may be attributed to the increased fillerform factor in PVC/GN nanocomposites.
(3) The applicability of nanocomposites obtained asPTCR thermistors was examined by monitoring theconductivity as a function on temperature.
(4) The applicability of nanocomposites for self-regulating heater and temperature sensor was testedby displaying the change of current and temperaturewith applied voltage.
(5) The specific heat capacity and amount of heattransfer by radiation and convection as a function ofGN content were estimated by proposed theoreticalmodeling based on conservation law of energy andNewton’s law of cooling.
(6) Finally, we believe that the PVC/GN nanocompositesopen a new direction for future application in elec-tronics devices such as PTCR thermistors, self-re-gulating heater, and temperature sensors.
Acknowledgment
The authors would like to thank the University of Tabuk,Saudi Arabia, for the financial support of this research.
References
[1] N. A. Aal, F. El-Tantawy, A. Al-Hajry, and M. Bououdina,“New antistatic charge and electromagnetic shielding effec-tiveness from conductive epoxy resin/plasticized carbon blackcomposites,” Polymer Composites, vol. 29, no. 2, pp. 125–132,2008.
[2] O. A. Al-Hartomy, F. Al-Solamy, A. A. Al-Ghamdi, M. A.Ibrahim, N. Dishovsky, and F. El-Tantawy, “Pressure sensorsbased on polyvinyl chloride/graphite/nickel nanocomposites,”Journal of Elastomers and Plastics, vol. 43, no. 2, pp. 137–153,2011.
[3] A. A. Al-Ghamdi, F. El-Tantawy, N. Abdel Aal, E. H. El-Mossalamy, and W. E. Mahmoud, “Stability of new electro-static discharge protection and electromagnetic wave shield-ing effectiveness from poly(vinyl chloride)/graphite/nickelnanoconducting composites,” Polymer Degradation and Stabil-ity, vol. 94, no. 6, pp. 980–986, 2009.
[4] F. El-Tantawy and N. Dishovsky, “Novel V-shaped negativetemperature coefficient of conductivity thermistors and elec-tromagnetic interference shielding effectiveness from butylrubber-loaded boron carbide ceramic composites,” Journal ofApplied Polymer Science, vol. 91, no. 5, pp. 2756–2770, 2004.
[5] G. Chen, W. Weng, D. Wu, and C. Wu, “PMMA/graphitenanosheets composite and its conducting properties,” Euro-pean Polymer Journal, vol. 39, no. 12, pp. 2329–2335, 2003.
[6] J. Lu, X. Chen, W. Lu, and G. Chen, “The piezoresistivebehaviors of polyethylene/foliated graphite nanocomposites,”European Polymer Journal, vol. 42, no. 5, pp. 1015–1021, 2006.
[7] F. El-Tantawy, “Plasticized/graphite reinforced phenolic resincomposites and their application potential,” Journal of AppliedPolymer Science, vol. 104, no. 2, pp. 697–709, 2007.
[8] Z. Todorova, N. Dishovsky, R. Dimitrov, and F. El-Tantawy,“Investigation of electrical properties of elastomer compositesfilled with TiB2,” Journal of Elastomers and Plastics, vol. 39, no.1, pp. 69–80, 2007.
[9] G. Chen, W. Weng, D. Wu et al., “Preparation and charac-terization of graphite nanosheets from ultrasonic powderingtechnique,” Carbon, vol. 42, no. 4, pp. 753–759, 2004.
[10] N. C. Das, D. Khastgir, T. K. Chaki, and A. Chakraborty, “Elec-tromagnetic interference shielding effectiveness of carbonblack and carbon fibre filled EVA and NR based composites,”Composites Part A, vol. 31, no. 10, pp. 1069–1081, 2000.
[11] X. S. Du, M. Xiao, and Y. Z. Meng, “Facile synthesis of highlyconductive polyaniline/graphite nanocomposites,” EuropeanPolymer Journal, vol. 40, no. 7, pp. 1489–1493, 2004.
[12] S. E. Bourdo and T. Viswanathan, “Graphite/Polyaniline (GP)composites: synthesis and characterization,” Carbon, vol. 43,no. 14, pp. 2983–2988, 2005.
[13] S. Shekhar, V. Prasad, and S. V. Subramanyam, “Transportproperties of conducting amorphous carbon-poly(vinyl chlo-ride) composite,” Carbon, vol. 44, no. 2, pp. 334–340, 2006.
[14] W. Luheng, D. Tianhuai, and W. Peng, “Effects of conductivephase content on critical pressure of carbon black filledsilicone rubber composite,” Sensors and Actuators, A, vol. 135,no. 2, pp. 587–592, 2007.

10 Journal of Nanomaterials
[15] W. Lu, H. Lin, D. Wu, and G. Chen, “Unsaturated polyesterresin/graphite nanosheet conducting composites with a lowpercolation threshold,” Polymer, vol. 47, no. 12, pp. 4440–4444, 2006.
[16] M. N. Kalasad, M. A. Gadyal, R. K. Hiremath et al., “Synthesisand characterization of polyaniline rubber composites,” Com-posites Science and Technology, vol. 68, no. 7-8, pp. 1787–1793,2008.
[17] S. Qu and S. C. Wong, “Piezoresistive behavior of polymerreinforced by expanded graphite,” Composites Science andTechnology, vol. 67, no. 2, pp. 231–237, 2007.
[18] W. Weng, G. Chen, and D. Wu, “Transport properties ofelectrically conducting nylon 6/foliated graphite nanocom-posites,” Polymer, vol. 46, no. 16, pp. 6250–6257, 2005.
[19] G. M. Gouda and C. L. Nagendra, “Structural and electricalproperties of mixed oxides of manganese and vanadium: anew semiconductor oxide thermistor material,” Sensors andActuators, A, vol. 155, no. 2, pp. 263–271, 2009.
[20] S. Isaji, Y. Bin, and M. Matsuo, “Electrical conductivityand self-temperature-control heating properties of carbonnanotubes filled polyethylene films,” Polymer, vol. 50, no. 4,pp. 1046–1053, 2009.
[21] Y. Song and Q. Zheng, “Electric self-heating behavior ofacetylene carbon black filled high-density polyethylene com-posites,” Polymer International, vol. 53, no. 10, pp. 1517–1522,2004.

Hindawi Publishing CorporationJournal of NanomaterialsVolume 2011, Article ID 928659, 9 pagesdoi:10.1155/2011/928659
Research Article
Influence of Silanization Treatment on ThermomechanicalProperties of Multiwalled Carbon Nanotubes:Poly(methylmethacrylate) Nanocomposites
Carlos Velasco-Santos,1, 2, 3 Ana Laura Martinez-Hernandez,1, 2, 3 Witold Brostow,3
and Victor M. Castano2
1 Division de Posgrado e Investigacion, Instituto Tecnologico de Queretaro, Avenue Tecnologico s/n esquina gral. Mariano Escobedo,Colonia Centro Historico, 76000 Queretaro, QRO, Mexico
2 Centro de Fısica Aplicada y Tecnologıa Avanzada, Universidad Nacional Autonoma de Mexico, A.P. 1-1010, Santiago de Queretaro,76000 Queretaro, QRO, Mexico
3 Laboratory of Advanced Polymers & Optimized Materials (LAPOM), Department of Materials Science and Engineering, Universityof North Texas, Denton, TX 76203-5310, USA
Correspondence should be addressed to Carlos Velasco-Santos, [email protected]
Received 3 May 2011; Revised 26 July 2011; Accepted 30 July 2011
Academic Editor: Gaurav Mago
Copyright © 2011 Carlos Velasco-Santos et al. This is an open access article distributed under the Creative Commons AttributionLicense, which permits unrestricted use, distribution, and reproduction in any medium, provided the original work is properlycited.
Unfunctionalized and silanized multiwalled carbon nanotubes (MWNTs) were incorporated in poly(methylmethacrylate) matricesusing in situ polymerization. Polymer-compatible functional groups on carbon nanotube (CNT) surfaces were characterized byinfrared spectroscopy. These chemical moieties improve interaction at interfaces, allowing transfer of mechanical load between thematrix and the dispersed phase as reflected in the resulting improved mechanical and thermophysical properties. The compositeswere characterized by Raman spectroscopy to evaluate molecular level interactions and dynamical mechanical analysis. Compositeswith silanized CNTs have higher storage modulus (E′) than polymer reinforced with unfunctionalized nanotubes. Consideringthe average of the samples, only 1 wt.% of silanized nanotubes provides an increase in E′ of 165% at room temperature withrespect to polymer matrix, and the increments reached are by a factor of 6.8 and 13.6 over the polymer matrix at 80◦C and 90◦C,respectively. 1 wt% of silanized CNTs increases the glass transition temperature of polymer matrix around 30◦C. Microscratchtesting results of composites show that unfunctionalized CNTs cause deeper penetration of the indenter than polymer matrix atthe same force; however, the composites developed with silanized CNTs present more regular behavior than polymer reinforcedwith unfunctionalized CNTs.
1. Introduction
The outstanding properties of carbon nanotubes offer possi-bilities for developing new strong multifunctional compositematerials [1–4]. Several studies have demonstrated therelevant high Young’s modulus, stiffness, flexibility, high ele-ctrical conductivity, and thermal stability that CNTs posses[5–8]. Research focus to produce polymer composites is dir-ected to taking advantage of these features in maximum level[9–13].
Different reports provide evidence of progress in thisarea. Depending on the polymer and the processing method
used, there are positive effects in the creation of polymericnanocomposites based on CNTs for mechanical [11–16],electrical [13, 17–20], damping [21], and electroactive prop-erties and artificial muscles [22, 23]. However, to reach thecombination of different properties in one material involvesdiverse challenges. As discussed by Dzenis [4], uniformdistribution of CNTs in the matrix is needed. Moreover,the attention has been paid to mechanical properties thanto tribological ones. However, the analysis of tribologi-cal properties is needed because the ongoing process inseveral industries of replacement of metal components bypolymeric ones requires polymer-based materials (PBMs)

2 Journal of Nanomaterials
with better tribological properties [24]. Recently studiesshow that the use of CNTs to improve tribology of PBMsturned out to be a two-edged sword; because, while thepenetration depths de-crease with increasing concentrationof CNTs, the residual depths increase at the same time[16]. Thus, clearly more work also along these lines isneeded.
A way to provide uniformity on the distribution of CNTsin a polymeric matrix is functionalization [25–27]. In thispaper is presented new evidence related with the efficiencyof functionalization to improve compatibility and enhancedispersion and the load transfer of CNTs in polymer nano-composites. Chemical modification applied to nanotubes issupported in the silanization process, which has been provedas successful method to produce different surface behaviorin CNTs. Here we report results for functionalized as wellas unfunctionalized carbon nanotube polymer composites.Poly(methyl methacrylate) (PMMA) has been chosen as thematrix because of its wide use.
2. Experimental
Methyl methacrylate monomer (MMA) and 3-(trimethoxy-silyl)-propyl methacrylate 98% (3-MAT) were supplied byAldrich. 2,2′-azoisobutironitrile (AIBN) was donated byGIRSA Company, and arc-discharge MWNTs (ground corematerials) were provided by MER Corporation. The corematerial has around 40 wt% MWNTs. The product is over99% carbon and is produced without catalysts. MWNTs have8–30 graphene layers and are 6–20 nm in diameter and 1–5microns in length.
MWNTs previously purified and oxidized were silanized.Oxidation was achieved with KMnO4 in H2SO4 medium;this kind of purification is much recognized and produces ahigh yield and high purity CNTs. Nanotubes obtained by thisprocess have been analyzed by transmission electron micro-scopy (TEM) and Raman spectroscopy in an earlier paper[28]. Silanization was realized in alcoholic solution; silanewas added 1 : 1 in weight with respect to the oxidized CNTs.The mix was refluxed for 3 h, maintaining the temperaturearound 65–70◦C and under constant stirring. More detailsof the reactive concentrations and the procedure to oxidizeand silanize CNTs were described in previous publication[28]. Polymer samples and carbon nanotube compositeswere produced by in situ polymerization using AIBN as theinitiator. The AIBN quantity, reaction time, and temperaturewere controlled in order to achieve narrow molecular weightdistributions. The reaction to produce each composite wascarried out in a flask using MMA and AIBN in a refluxsystem. In each type of the samples, unmodified CNTs(uCNTs) and previously silanized CNTs (sCNTs) were addedafter 30 minutes since the reaction beginning; then samplewas maintained at 70◦C for 2 hours under stirring. Theresulting mixture was placed in a glass mold with a latexframe in order to control shrinkage. Finally, the systemwas controlled at 70◦C in an oven for 24 hours to achievecomplete polymerization. The materials obtained have thethickness of ≈1.8 mm. The samples are identified as follows:
oCNTssCNTs uCNTs
Figure 1: Carbon nanotubes dissolved in acetone: untreated(uCNTs), oxidized (oCNTs), and silanized (sCNTs).
neat PMMA (PMMA), a composite with 1 wt.% of uCNTs,and a composite with 1 wt.% of sCNTs.
Two extra samples for each material (PMMA, uCNTcomposite, and sCNT composite) were prepared to cor-roborate the nanocomposites and the PMMA behaviour indynamical mechanical analysis (DMA). The procedure tosynthesize the materials was the same described previously.
Infrared analysis was performed using a Vector 33 Brukerspectrophotometer, at 100 scans, with resolution of 1 cm−1.Samples were prepared using KBr tablets.
For dynamical mechanical analysis, the samples were cutto 6 mm width and 25 mm length and tested in a Perkin-Elmer DMA-7 apparatus, using 3-point bending module atthe 1.0 Hz frequency. Samples were running three times foreach material developed.
Raman’s spectra of PMMA and composites were obtain-ed in a Micro-Raman Dilor; a 632 nm laser was used, pro-viding a spectral resolution of 3 cm−1.
Microscratch testing was performed in a machine fromCSM, Neuchatel, Switzerland, with their Version 2.3 soft-ware. Scratches of 5.00 mm length were performed using adiamond tip with a 200 μm diameter. Samples were testedseven times in different parts of the composite at variableloads from 3.0 N up to 20.0 N.
3. Results and Discussion
3.1. Dispersion in Solvent. Silanization was performed using3-mercaptopropyl-trimethoxysilane (3-MPT) and 3-(tri-methoxysilyl)-propyl methacrylate (3-MAT). CNTs werethen dissolved in acetone for 5 minutes using an ultrasonicbath for dispersion and left for further 1 hour without ultra-sound. As expected, the dispersion is different, higher for 3-MAT than for 3-MTP. Photographs of suspensions obtainedusing 3-MAT are displayed in Figure 1.
In this figure, it is possible to observe that the darkestsuspension corresponds to the system containing sCNTs.These CNTs stay a longer time (several hours) in suspension,while, in the other two systems, precipitation occurs sooner.Even when the acetone is evaporated and sCNTs are washedonce more with hot water and acetone in order to eliminatepossible remainders of unattached organosilanes, the nano-tubes do not lose their dispersion in the solvent. This effect isproduced due to the organosilane’s R group attached to car-bon nanotube surfaces. Organosilanes can be represented as

Journal of Nanomaterials 3
OH
OH
OHOH
OH
OHOH
R = O
O
O O
O O
O
O O OO
O
O
O
CH2 CH
2
CH
2
CH
2
CH3
CH
3
CH
3
CH
3
R-Si
Si Si Si
(OCH3) + 3H2O
(a)
(b)
(c)
HO
R-Si-OH + 3CH3OH
R-SiR′3
Figure 2: Silanization reactions on carbon nanotube surfaces: (a) a general chemical formula of organosilanes, (b) silanization reaction, (c)schematic representation of carbon nanotubes modified with 3-mercaptopropyl-trimethoxysilane.
R-Si-R′3,where R is an organofunctional group. The R groupcan be selected to be reactive or compatible depending onthe organic matrix being used. The R′ group is typicallytrimethoxy 3(OCH3); silicon-oxygen bonds are formedfollowed by an easy hydrolysis to trisilanol.
Figure 2 shows a schematic representation of silanizationwith 3-MAT on carbon nanotube surfaces. The dispersionof sCNTs in the suspension depends on the R group. Our3-MAT silanization produces good dispersion of CNTs inorganic solvents such as acetone or ethanol. The R moiety,in this case the methacrylate chain, changes the behaviorof MWNTs when attached to the carbon nanotube surface.When 3-MPT is attached to sCNTs, the thiol group produceslower dispersion in acetone.
3.2. Infrared Spectroscopy. Figure 3 shows the infrared spec-tra for CNTs, oxidized carbon nanotubes (oCNTs), andsCNTs modified with 3-MAT. Spectrum 3(a) shows twobands in the zone of A2u and E1u IR phonon modes at850 cm−1 and 1576 cm−1, which are typical signals of CNTs[29]. In the oCNTs spectrum 3(b) new peaks are seen.Characteristic bands due to oxidation appear; the signals at1200 cm−1 and 1346 cm−1 are due to v(C-O) and δ(O-H)in plane, respectively; small bands between 1680 cm−1 and1740 cm−1 correspond to v(C=O) [30].
In the spectrum of oCNT, carboxylate groups prevail, andonly few carboxyl groups are produced. This is seen in lowintensities of the bands around 1740 cm−1 and 3320 cm−1
which correspond to v(C=O) and v(O-H), typical signalsof carboxyl moieties. Other evidence of carboxyl group is aslight increase in 1346 cm−1 δ(O-H) and 960 cm−1 δ(O-H)related with in-plane and out-of-plane vibrations, respec-tively [30]. By contrast, a higher intensity is seen in the bandaround 1495 cm−1, and in the peaks between 1600 cm−1 and
3500 3000 2500 2000 1500 1000
Wavenumber (cm−1)
794
919
960
8501576
17401680 1495
13461200
3320
3300
2947 2880
1111 10451740
CNTs
Refl
ecta
nce
(a.u
.)
sCNTsoCNTs
(a)
(b)
(c)
Figure 3: Infrared spectroscopy of CNTs, oCNTs, and sCNTs.
1680 cm−1 in comparison with the zone above 1700 cm−1,these corroborate that quinone and carboxylate groups existin these oxidized nanotubes [30–33]. The peak at 1576 cm−1,assigned to −C=C in spectrum (a), is notably weaker thanthat in spectrum (b); this indicates changes in CNT surfacedue to oxidation [31]; it is known that some damage isproduced in CNT walls. In Figure 3(c) we find results ofsuccessful silanization process; the bands at 794 cm−1 and919 cm−1 are typical for v(Si-OH) and δ(OH) out of plane.These bands appear when trimethoxy groups are broken inorder to form silanol groups. The silanol groups provide
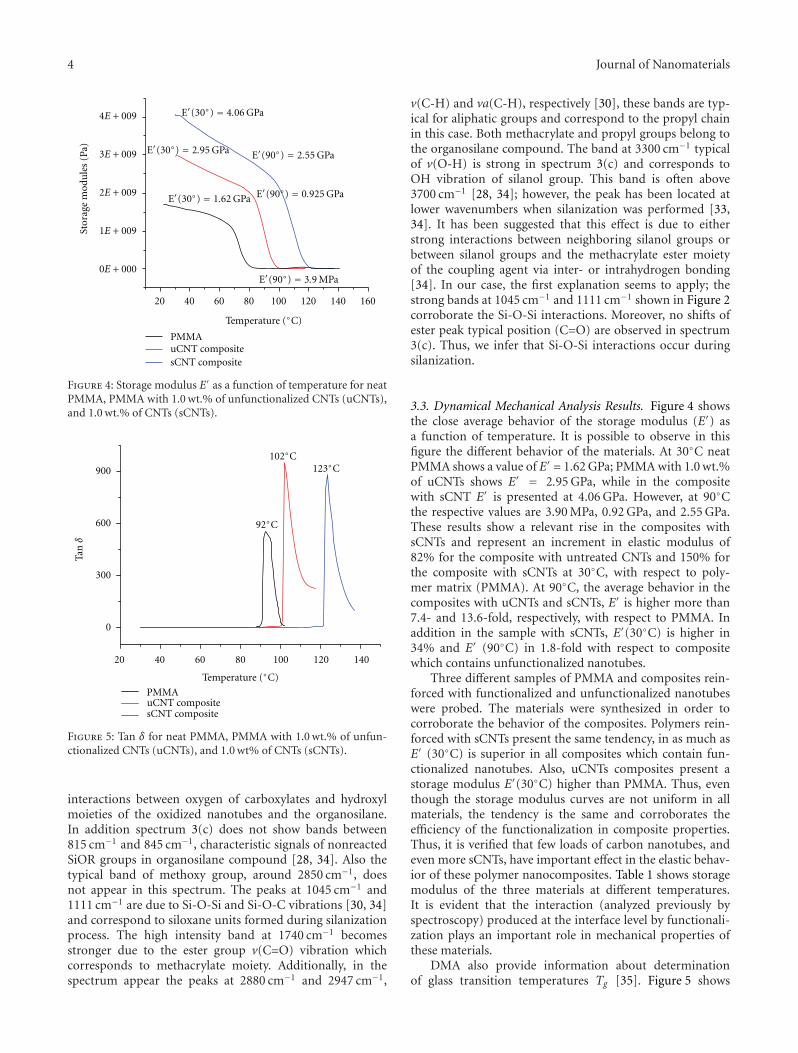
4 Journal of Nanomaterials
4E + 009
3E + 009
2E + 009
1E + 009
0E + 000
Stor
age
mod
ule
s(P
a)
20 40 60 80 100 120 140 160
Temperature (◦C)
PMMA
E′(30◦) = 1.62 GPa
E′(30◦) = 2.95 GPa E′(90◦) = 2.55 GPa
E′(90◦) = 0.925 GPa
E′(30◦) = 4.06 GPa
E′(90◦) = 3.9 MPa
uCNT compositesCNT composite
Figure 4: Storage modulus E′ as a function of temperature for neatPMMA, PMMA with 1.0 wt.% of unfunctionalized CNTs (uCNTs),and 1.0 wt.% of CNTs (sCNTs).
900
600
300
0
PMMA
20 40 60 80 100 120 140
Temperature (◦C)
102◦C123◦C
92◦C
Tanδ
uCNT compositesCNT composite
Figure 5: Tan δ for neat PMMA, PMMA with 1.0 wt.% of unfun-ctionalized CNTs (uCNTs), and 1.0 wt% of CNTs (sCNTs).
interactions between oxygen of carboxylates and hydroxylmoieties of the oxidized nanotubes and the organosilane.In addition spectrum 3(c) does not show bands between815 cm−1 and 845 cm−1, characteristic signals of nonreactedSiOR groups in organosilane compound [28, 34]. Also thetypical band of methoxy group, around 2850 cm−1, doesnot appear in this spectrum. The peaks at 1045 cm−1 and1111 cm−1 are due to Si-O-Si and Si-O-C vibrations [30, 34]and correspond to siloxane units formed during silanizationprocess. The high intensity band at 1740 cm−1 becomesstronger due to the ester group v(C=O) vibration whichcorresponds to methacrylate moiety. Additionally, in thespectrum appear the peaks at 2880 cm−1 and 2947 cm−1,
v(C-H) and va(C-H), respectively [30], these bands are typ-ical for aliphatic groups and correspond to the propyl chainin this case. Both methacrylate and propyl groups belong tothe organosilane compound. The band at 3300 cm−1 typicalof v(O-H) is strong in spectrum 3(c) and corresponds toOH vibration of silanol group. This band is often above3700 cm−1 [28, 34]; however, the peak has been located atlower wavenumbers when silanization was performed [33,34]. It has been suggested that this effect is due to eitherstrong interactions between neighboring silanol groups orbetween silanol groups and the methacrylate ester moietyof the coupling agent via inter- or intrahydrogen bonding[34]. In our case, the first explanation seems to apply; thestrong bands at 1045 cm−1 and 1111 cm−1 shown in Figure 2corroborate the Si-O-Si interactions. Moreover, no shifts ofester peak typical position (C=O) are observed in spectrum3(c). Thus, we infer that Si-O-Si interactions occur duringsilanization.
3.3. Dynamical Mechanical Analysis Results. Figure 4 showsthe close average behavior of the storage modulus (E′) asa function of temperature. It is possible to observe in thisfigure the different behavior of the materials. At 30◦C neatPMMA shows a value of E′ = 1.62 GPa; PMMA with 1.0 wt.%of uCNTs shows E′ = 2.95 GPa, while in the compositewith sCNT E′ is presented at 4.06 GPa. However, at 90◦Cthe respective values are 3.90 MPa, 0.92 GPa, and 2.55 GPa.These results show a relevant rise in the composites withsCNTs and represent an increment in elastic modulus of82% for the composite with untreated CNTs and 150% forthe composite with sCNTs at 30◦C, with respect to poly-mer matrix (PMMA). At 90◦C, the average behavior in thecomposites with uCNTs and sCNTs, E′ is higher more than7.4- and 13.6-fold, respectively, with respect to PMMA. Inaddition in the sample with sCNTs, E′(30◦C) is higher in34% and E′ (90◦C) in 1.8-fold with respect to compositewhich contains unfunctionalized nanotubes.
Three different samples of PMMA and composites rein-forced with functionalized and unfunctionalized nanotubeswere probed. The materials were synthesized in order tocorroborate the behavior of the composites. Polymers rein-forced with sCNTs present the same tendency, in as much asE′ (30◦C) is superior in all composites which contain fun-ctionalized nanotubes. Also, uCNTs composites present astorage modulus E′(30◦C) higher than PMMA. Thus, eventhough the storage modulus curves are not uniform in allmaterials, the tendency is the same and corroborates theefficiency of the functionalization in composite properties.Thus, it is verified that few loads of carbon nanotubes, andeven more sCNTs, have important effect in the elastic behav-ior of these polymer nanocomposites. Table 1 shows storagemodulus of the three materials at different temperatures.It is evident that the interaction (analyzed previously byspectroscopy) produced at the interface level by functionali-zation plays an important role in mechanical properties ofthese materials.
DMA also provide information about determinationof glass transition temperatures Tg [35]. Figure 5 shows
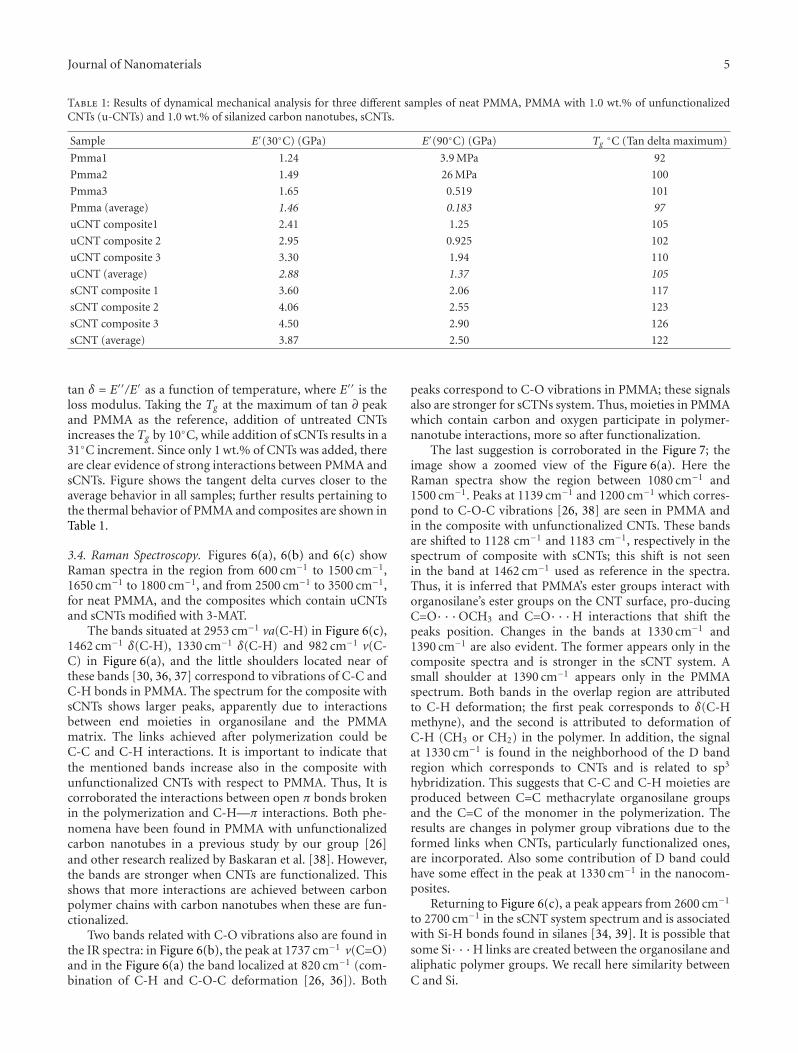
Journal of Nanomaterials 5
Table 1: Results of dynamical mechanical analysis for three different samples of neat PMMA, PMMA with 1.0 wt.% of unfunctionalizedCNTs (u-CNTs) and 1.0 wt.% of silanized carbon nanotubes, sCNTs.
Sample E′(30◦C) (GPa) E′(90◦C) (GPa) Tg◦C (Tan delta maximum)
Pmma1 1.24 3.9 MPa 92
Pmma2 1.49 26 MPa 100
Pmma3 1.65 0.519 101
Pmma (average) 1.46 0.183 97
uCNT composite1 2.41 1.25 105
uCNT composite 2 2.95 0.925 102
uCNT composite 3 3.30 1.94 110
uCNT (average) 2.88 1.37 105
sCNT composite 1 3.60 2.06 117
sCNT composite 2 4.06 2.55 123
sCNT composite 3 4.50 2.90 126
sCNT (average) 3.87 2.50 122
tan δ = E′′/E′ as a function of temperature, where E′′ is theloss modulus. Taking the Tg at the maximum of tan ∂ peakand PMMA as the reference, addition of untreated CNTsincreases the Tg by 10◦C, while addition of sCNTs results in a31◦C increment. Since only 1 wt.% of CNTs was added, thereare clear evidence of strong interactions between PMMA andsCNTs. Figure shows the tangent delta curves closer to theaverage behavior in all samples; further results pertaining tothe thermal behavior of PMMA and composites are shown inTable 1.
3.4. Raman Spectroscopy. Figures 6(a), 6(b) and 6(c) showRaman spectra in the region from 600 cm−1 to 1500 cm−1,1650 cm−1 to 1800 cm−1, and from 2500 cm−1 to 3500 cm−1,for neat PMMA, and the composites which contain uCNTsand sCNTs modified with 3-MAT.
The bands situated at 2953 cm−1 va(C-H) in Figure 6(c),1462 cm−1 δ(C-H), 1330 cm−1 δ(C-H) and 982 cm−1 v(C-C) in Figure 6(a), and the little shoulders located near ofthese bands [30, 36, 37] correspond to vibrations of C-C andC-H bonds in PMMA. The spectrum for the composite withsCNTs shows larger peaks, apparently due to interactionsbetween end moieties in organosilane and the PMMAmatrix. The links achieved after polymerization could beC-C and C-H interactions. It is important to indicate thatthe mentioned bands increase also in the composite withunfunctionalized CNTs with respect to PMMA. Thus, It iscorroborated the interactions between open π bonds brokenin the polymerization and C-H—π interactions. Both phe-nomena have been found in PMMA with unfunctionalizedcarbon nanotubes in a previous study by our group [26]and other research realized by Baskaran et al. [38]. However,the bands are stronger when CNTs are functionalized. Thisshows that more interactions are achieved between carbonpolymer chains with carbon nanotubes when these are fun-ctionalized.
Two bands related with C-O vibrations also are found inthe IR spectra: in Figure 6(b), the peak at 1737 cm−1 v(C=O)and in the Figure 6(a) the band localized at 820 cm−1 (com-bination of C-H and C-O-C deformation [26, 36]). Both
peaks correspond to C-O vibrations in PMMA; these signalsalso are stronger for sCTNs system. Thus, moieties in PMMAwhich contain carbon and oxygen participate in polymer-nanotube interactions, more so after functionalization.
The last suggestion is corroborated in the Figure 7; theimage show a zoomed view of the Figure 6(a). Here theRaman spectra show the region between 1080 cm−1 and1500 cm−1. Peaks at 1139 cm−1 and 1200 cm−1 which corres-pond to C-O-C vibrations [26, 38] are seen in PMMA andin the composite with unfunctionalized CNTs. These bandsare shifted to 1128 cm−1 and 1183 cm−1, respectively in thespectrum of composite with sCNTs; this shift is not seenin the band at 1462 cm−1 used as reference in the spectra.Thus, it is inferred that PMMA’s ester groups interact withorganosilane’s ester groups on the CNT surface, pro-ducingC=O· · ·OCH3 and C=O· · ·H interactions that shift thepeaks position. Changes in the bands at 1330 cm−1 and1390 cm−1 are also evident. The former appears only in thecomposite spectra and is stronger in the sCNT system. Asmall shoulder at 1390 cm−1 appears only in the PMMAspectrum. Both bands in the overlap region are attributedto C-H deformation; the first peak corresponds to δ(C-Hmethyne), and the second is attributed to deformation ofC-H (CH3 or CH2) in the polymer. In addition, the signalat 1330 cm−1 is found in the neighborhood of the D bandregion which corresponds to CNTs and is related to sp3
hybridization. This suggests that C-C and C-H moieties areproduced between C=C methacrylate organosilane groupsand the C=C of the monomer in the polymerization. Theresults are changes in polymer group vibrations due to theformed links when CNTs, particularly functionalized ones,are incorporated. Also some contribution of D band couldhave some effect in the peak at 1330 cm−1 in the nanocom-posites.
Returning to Figure 6(c), a peak appears from 2600 cm−1
to 2700 cm−1 in the sCNT system spectrum and is associatedwith Si-H bonds found in silanes [34, 39]. It is possible thatsome Si· · ·H links are created between the organosilane andaliphatic polymer groups. We recall here similarity betweenC and Si.

6 Journal of Nanomaterials
1000 1500
820
1330
9821462
PMMA
Wavenumber (cm−1)
Inte
nsi
ty(a
.u.)
uCNT composite
sCNT composite
(a)
1737
PMMA
Wavenumber (cm−1)
1700 1800
Inte
nsi
ty(a
.u.)
uCNT composite
sCNT composite
(b)
2676
2953
PMMA
Inte
nsi
ty(a
.u)
Wavenumber (cm−1)
3000
uCNT compositesCNT composite
(c)
Figure 6: Raman spectra of PMMA and carbon nanotube polymer nanocomposites (a) from 600 cm−1 to 1500 cm−1, (b) 1650 cm−1 to1800 cm−1, and (c) from 2500 cm−1 to 3500 cm−1.
3.5. Scratching Behavior. Figure 8 shows penetration depthsas a function applied force achieved in PMMA and nano-composites. Several tests for each kind of material areshown. PMMA samples show regular behavior which isindependent of the material section; inasmuch as, the sevenanalyses present similar penetration depth at the same loads.Thus, PMMA presents homogenous behavior that indicatessimilar features in any point of its surface. sCNT com-posite present two zones; in the region from 7.5 N to 9 N,
the majority of the determinations in sCNT compositepresent better resistance to be penetrated with respect toPMMA; however, in the zone above 9 N, the majority ofthese samples show lower resistance to the penetration thanPMMA. Nevertheless, the largest part of the analysis realizedin sCNT composite presents better tribological propertiesthan uCNT composite. Therefore, although a small quantityof sCNTs is incorporated in polymer; better wear resistanceis presented at low load with respect to polymer matrix.

Journal of Nanomaterials 7
PMMA
Wavenumber (cm−1)1250 1500
1330
1462
1390
1200
11831139
1128Inte
nsi
ty(a
.u.)
uCNT composite
sCNT composite
Figure 7: Raman spectra of PMMA and carbon nanotube polymernanocomposites from 1080 cm−1 to 1500 cm−1.
Scratched tests forScratched tests for
PMMAsamples
0 2 4 6 8 10 12 14 16 18 20 22
200
180
160
140
120
100
80
60
40
20
0
Progressive force (N)
Pen
etra
tion
dept
h(μ
m)
composite
Scratched test for PMMAuCNT compositesCNT composite
uCNTcomposite
sCNT
Figure 8: Microscratch testing results represented by penetrationdepth. Black line: Poly(methyl methacrylate) (PMMA), red line:1 wt% unfunctionalized carbon nanotube polymer nanocomposite(uCNTs composite), blue line: 1 wt% functionalized silanized car-bon nanotube polymer nanocomposite (uCNT composite).
Thus, neat PMMA has better scratch resistance than CNT’sreinforced materials except for the composite with sCNTsat low forces. In addition, curves show that the behaviorof the composite with sCNTs is more uniform than thecomposite with uCNTs. The fact related with the variety ofcurves, relatively far apart from each other, can be explainedby formation of CNT bundles for uCNT composite. Thus,also in our systems, uniform distribution of CNTs in the
matrix apparently achieved for sCNTs is important. It is sup-posed that good distribution of silanized carbon nanotubes(sCNTs) results in efficient tribological properties only atlow loads as sCNTs could support the mechanical behavior.However, it is possible that the interaction produced betweensCNTs and polymer chains could produce shorter chainsthan those produced in uCNT composites or PMMA. Thus,shorter chains at high loads could produce easy penetrationin the material. As discussed by Dzenis [4], CNTs canproduce improvement as well as worsening of the propertiesof matrices. This depends on diverse factors involved in themodification and synthesis of the nanocomposites.
3.6. General Discussion. Successful silanization of carbonnanotubes is useful for changing their surface behavior and,therefore, their dispersion in organic solvents. Substituentsin the organosilane, here, play an important role.
When using 3-MAT, sCNT surfaces seem to have a varietyof interactions with the PMMA matrix: C-C, C=C· · ·π,C=O· · ·O, C=O· · ·H and Si· · ·H. The majority of theseinteractions begin in the polymerization.
The links produced in nanocomposites play an impor-tant role to improve thermomechanical properties in thesematerials, in as much as, storage modulus (E′) at differenttemperatures increase notably in the composites with sCNTswith respect to the composite with uCNTs and PMMA.In addition, the glass transition temperature is increasedaround 31◦C in the composite with sCNTs with respect topolymer matrix, in comparison with uCNT system where Tg
only increase by 10◦C.In other works moderate increments in mechanical
properties have been achieved in PMMA matrix or copoly-mers using MMA when uCNTs have been incorporated, forinstance with very low loads (0.01 wt%) of SWMTs, andMWNTs have improved tensile modulus of polymer matrix[9], and storage modulus E′ has been enhanced with 1 wt%of MWNTs using dissolving processing [13]. In additionother processing methods which involve uCNTs with otherpolymer matrices have reached good increments in storagemodulus when uCNTs are aligned [9]. Nevertheless whenCNTs are modified by oxidation [26], cover by polymers[27], or functionalized using other molecules [25, 27],better results have been reached in mechanical and thermalproperties.
Recently, silanization have been an important route tomodify CNTs, and the results agree with the thermomech-anical properties reported here. Important increments intensile strength in Poly(propylene) (PP) and polyimide (PI)matrices [40, 41] and and thermal stability in epoxymatrix [42] have been gotten at 1 wt% of sCNTs (PP andPI) and 0.5 wt% (in the case of epoxy matrix). The silanesused in these researches were 3-methacryloxypropyltrimeth-oxysilane, vinyltriethoxysilane, and 3-Glycidoxypropyltri-methoxysilane, respectively. Also in recent times interestingdielectric properties have been reported in polyethylenereinforced with carbon nanofibers modified with silanes[43]. Thus, it is corroborated that silane functionalization inCNTs is useful to improve interface and thermomechanical

8 Journal of Nanomaterials
properties in different polymer matrices including PMMAstudied in this paper.
Also, functionalization effect is reflected in tribologicalproperties; however, other factors such as the polymer chainsizes and the low concentration of sCNTs could influence thedifferent behavior in tribological properties at low and highforce. Nevertheless, the clear differences in the tribologicalbehavior between sCNT and uCNT composites give evidencethat silanization takes part in this property; the evidenceof that influence is the low quantity used as reinforcementof sCNTs and the notable effect. The curves of penetrationdepth and progressive force are more consistent in thecomposite which contains more sCNTs than that in thecomposite with uCNTs. This allows concluding that fun-ctionalization, furthermore, assists the dispersion of carbonnanotubes in polymer composite.
Thus, this research gives evidence that the synergic effectsproduced in polymer composites are reached by interactionsbetween organosilane chemical groups of modified nan-otubes and polymer matrix. The incorporation of a smallquantity of sCNTs is enough to produce significant chang-es at polymer matrix; even uCNTs provide considerablechanges in polymer, taking into account the CNT quantitythat is added; as well functionalization provides to thecomposites extra qualities, because of not only improvingstorage modulus and Tg , also uniform behavior is obser-ved in any point of the sample when tribological propertiesare analyzed. These characteristics confer to this kind ofnanocomposites’ additional functional properties and thepossibility to be incorporated in promising uses such astransportation industry, commercial aircraft, sports indust-ry, and textile smart polymer fibers among others possibleapplications. Research using different concentrations ofCNTs and other organosilanes with other R group related tothe features of the polymer matrices is in current study.
Acknowledgments
The authors are grateful to Dr. G. Hernandez-Padron for herassistance in the IR analysis and to CINVESTAV Queretaro,particularly Dr. S. Jimenez and Mr. F. Rodrıguez for theirassistance in Raman measurements. Financial support hasbeen provided by the American Chemical Society, Washing-ton, DC, the Mexican National Academy of Sciences (AMC),Mexico City, the DGEST under project DGEST 2006 333.06,and the Consejo Nacional de Ciencia y Tecnologia (CONA-CyT), Mexico City under project JI-58232.
References
[1] M. Zhang, K. R. Atkinson, and R. H. Baughman, “Multi-functional carbon nanotube yarns by downsizing an ancienttechnology,” Science, vol. 306, no. 5700, pp. 1358–1361, 2004.
[2] C. Velasco-Santos, A. L. Martinez-Hernandez, and V. M. Cas-tano, “Carbon nanotube-polymer nanocomposites: the role ofinterfaces,” Composite Interfaces, vol. 11, no. 8-9, pp. 567–586,2005.
[3] C. Velasco-Santos, A. L. Martınez-Hernandez, and V. M.Castano, “Carbon nanotube-polymer nanocomposites: prin-ciples and applications,” in Focus on Nanotube Research, D.A. Martin, Ed., vol. I, pp. 97–126, Nova Science Publishers,Huntington, NY, USA, 2006.
[4] Y. Dzenis, “Materials science: structural nanocomposites,”Science, vol. 319, no. 5862, pp. 419–420, 2008.
[5] M. M. Treacy, T. W. Ebbesen, and J. M. Gibson, “Exceptionallyhigh Young’s modulus observed for individual carbon nano-tubes,” Nature, vol. 381, no. 6584, pp. 678–680, 1996.
[6] J. Hone, M. Whitney, C. Piskoti, and A. Zettl, “Thermal con-ductivity of single-walled carbon nanotubes,” Physical ReviewB: Condensed Matter & Materials Physics, vol. 59, no. 4, pp.R2514–R2516, 1999.
[7] T. W. Ebbesen, H. J. Lezec, H. Hiura, J. W. Bennett, H. F.Ghaemi, and T. Thio, “Electrical conductivity of individualcarbon nanotubes,” Nature, vol. 382, no. 6586, pp. 54–56,1996.
[8] J.-P. Salvetat, J.-M. Bonard, N. H. Thomson et al., “Mechanicalproperties of carbon nanotubes,” Applied Physics A: MaterialsScience and Processing, vol. 69, no. 3, pp. 255–260, 1999.
[9] C. A. Cooper, D. Ravich, D. Lips, J. Mayer, and H. D. Wag-ner, “Distribution and alignment of carbon nanotubes andnanofibrils in a polymer matrix,” Composites Science and Tech-nology, vol. 62, no. 7-8, pp. 1105–1112, 2002.
[10] C. Velasco-Santos, A. L. Martınez-Hernandez, and V. M.Castano, “Nanocomposites,” in Proceedings of the NanoTechConference Technical Proceedings (NSTI ’05), vol. 2, p. 139,Anaheim, Calif, USA, 2005.
[11] L. Valentini, J. Biagiotti, J. M. Kenny, and M. A. LopezManchado, “Physical and mechanical behavior of single-wall-ed carbon nanotube/polypropylene/ethylene-propylenedienerubber nanocomposites,” Journal of Applied Polymer Science,vol. 89, no. 10, pp. 2657–2663, 2003.
[12] H. Zhang and Z. Zhang, “Impact behaviour of polypropylenefilled with multi-walled carbon nanotubes,” European PolymerJournal, vol. 43, no. 8, pp. 3197–3207, 2007.
[13] C. Velasco-Santos, A. L. Martınez-Hernandez, F. Fisher, R. S.Ruoff, and V. M. Castano, “Dynamicalmechanical and thermalanalysis of carbon nanotube-methylethyl methacrylate nano-composites,” Journal of Physics D: Applied Physics, vol. 36, no.12, pp. 1423–1428, 2003.
[14] H. Xia and M. Song, “Preparation and characterization ofpolyurethane-carbon nanotube composites,” Soft Matter, vol.1, no. 5, pp. 386–394, 2005.
[15] Y.-K. Choi, Y. Gotoh, K. Sugimoto, S.-M. Song, T. Yanagisawa,and M. Endo, “Processing and characterization of epoxy nano-composites reinforced by cup-stacked carbon nanotubes,”Polymer, vol. 46, no. 25, pp. 11489–11498, 2005.
[16] L. F. Giraldo, W. Brostow, E. Devaux, B. L. Lopez, and L. D.Perez, “Scratch and wear resistance of polyamide 6 reinforcedwith multiwall carbon nanotubes,” Journal of Nanoscience andNanotechnology, vol. 8, no. 6, pp. 3173–3183, 2008.
[17] A. Allaoui, H. Bai, M. Cheng, and J. B. Bai, “Mechanical andelectrical properties of a MWNT/epoxy composite,” Compo-sites Science and Technology, vol. 62, no. 15, pp. 1993–1998,2002.
[18] J. Sandler, M. S. P. Shaffer, T. Prasse, W. Bauhofer, K. Schulte,and A. H. Windle, “Development of a dispersion process forcarbon nanotubes in an epoxy matrix and the resulting elec-trical properties,” Polymer, vol. 40, no. 21, pp. 5967–5971,1999.
[19] J. K. W. Sandler, J. E. Kirk, I. A. Kinloch, M. S. P. Shaffer, andA. H. Windle, “Ultra-low electrical percolation threshold in

Journal of Nanomaterials 9
carbon-nanotube-epoxy composites,” Polymer, vol. 44, no. 19,pp. 5893–5899, 2003.
[20] Y. J. Kim, T. S. Shin, H. D. Choi, J. H. Kwon, Y.-C. Chung, andH. G. Yoon, “Electrical conductivity of chemically modifiedmultiwalled carbon nanotube/epoxy composites,” Carbon, vol.43, no. 1, pp. 23–30, 2005.
[21] J. Suhr, N. Koratkar, P. Keblinski, and P. Ajayan, “Viscoelastic-ity in carbon nanotube composites,” Nature Materials, vol. 4,no. 2, pp. 134–137, 2005.
[22] J. W. Cho, J. W. Kim, Y. C. Jung, and N. S. Goo, “Electroactiveshape-memory polyurethane composites incorporating car-bon nanotubes,” Macromolecular Rapid Communications, vol.26, no. 5, pp. 412–416, 2005.
[23] J. D. W. Madden, N. A. Vandesteeg, P. A. Anquetil et al.,“Artificial muscle technology: physical principles and navalprospects,” IEEE Journal of Oceanic Engineering, vol. 29, no.3, pp. 706–728, 2004.
[24] W. Brostow, J-.L. Deborde, M. Jaklewicz, and P. Olszynski,“Tribology with emphasis on polymers: friction,scratch resis-tance and wear,” Journal of Materials Education, vol. 25, pp.119–126, 2003.
[25] M. C. Paiva, B. Zhou, K. A. S. Fernando et al., “Physicaland mechanical characterization of nanocomposites with car-bon nanotubes functionalized with the matrix polymer,” Com-posite Interfaces, vol. 12, no. 8-9, pp. 757–768, 2005.
[26] C. Velasco-Santos, A. L. Martınez-Hernandez, F. T. Fisher,R. Ruoff, and V. M. Castano, “Improvement of thermaland mechanical properties of carbon nanotube compositesthrough chemical functionalization,” Chemistry of Materials,vol. 15, no. 23, pp. 4470–4475, 2003.
[27] M. Wang, K. P. Pramoda, and S. H. Goh, “Enhancement of themechanical properties of poly(styrene-co-acrylonitrile) withpoly(methyl methacrylate)-grafted multiwalled carbon nano-tubes,” Polymer, vol. 46, no. 25, pp. 11510–11516, 2005.
[28] C. Velasco-Santos, A. L. Martınez-Hernandez, M. Lozada-Cassou, A. Alvarez-Castillo, and V. M. Castano, “Chemicalfunctionalization of carbon nanotubes through an organosi-lane,” Nanotechnology, vol. 13, no. 4, pp. 495–498, 2002.
[29] J. Kastner, T. Pichler, H. Kuzmany et al., “Resonance Ramanand infrared spectroscopy of carbon nanotubes,” ChemicalPhysics Letters, vol. 221, no. 1-2, pp. 53–58, 1994.
[30] J. Coates, “Interpretation of infrared spectra, a practicalapproach,” in Encyclopedia of Analytical Chemistry, R. A.Meyers, Ed., pp. 10815–10837, John Wiley & Sons, Chichester,UK, 2000.
[31] J. Zhang, H. Zou, Q. Qing et al., “Effect of chemical oxidationon the structure of single-walled carbon nanotubes,” Journalof Physical Chemistry B, vol. 107, no. 16, pp. 3712–3718, 2003.
[32] J. Chen, A. M. Rao, S. Lyuksyutov et al., “Dissolution of full-length single-walled carbon nanotubes,” Journal of PhysicalChemistry B, vol. 105, no. 13, pp. 2525–2528, 2001.
[33] P. C. Ma, J.-K. Kim, and B. Z. Tang, “Functionalization ofcarbon nanotubes using a silane coupling agent,” Carbon, vol.44, no. 15, pp. 3232–3238, 2006.
[34] E. Bourgeat-Lami, I. Tissot, and F. Lefebvre, “Synthesisand characterization of SiOH-functionalized polymer latexesusing methacryloxy propyl trimethoxysilane in emulsion poly-merization,” Macromolecules, vol. 35, no. 16, pp. 6185–6191,2002.
[35] E. F. Lucas, B. G. Soares, and E. Monteiro, Caracterizacao dePolimeros, Determinacao de peso Molecular e Analise Termica,E-Papers, Rio de Janeiro, Brazil, 2001.
[36] A. L. Martinez-Hernandez, C. Velasco-Santos, M. de Lcaza,and V. M. Castano, “Grafting of methyl methacrylate onto na-tural keratin,” e-Polymers, no. 016, pp. 1–11, 2003.
[37] A. Matsushita, Y. Ren, K. Matsukawa et al., “Two-dimensionalFourier-transform Raman and near-infrared correlation spec-troscopy studies of poly(methyl methacrylate) blends. 1.Immiscible blends of poly(methyl methacrylate) and atacticpolystyrene,” Vibrational Spectroscopy, vol. 24, no. 2, pp. 171–180, 2000.
[38] D. Baskaran, J. W. Mays, and M. S. Bratcher, “Noncovalent andnonspecific molecular interactions of polymers with multi-walled carbon nanotubes,” Chemistry of Materials, vol. 17, no.13, pp. 3389–3397, 2005.
[39] R. W. Hannah and D. W. Mayo, “Introduction in courses notesin the interpretation of infrared and raman spectra,” in Infra-red Spectra of Polymers, D. Mayo, F. Miller, and R. Hannah,Eds., p. 261, John Wiley & Sons, Chichester, UK, 2003.
[40] Z. Zhou, S. Wang, L. Lu, Y. Zhang, and Y. Zhang, “Func-tionalization of multi-wall carbon nanotubes with silane andits reinforcement on polypropylene composites,” CompositesScience and Technology, vol. 68, no. 7-8, pp. 1727–1733, 2008.
[41] S.-M. Yuen, C.-C. M. Ma, C. L. Chiang, C.-C. Teng, and Y.-H.Yu, “Poly(vinyltriethoxysilane) modified MWCNT/polyimidenanocomposites—preparation, morphological, mechanical,and electrical properties,” Journal of Polymer Science, Part A,vol. 46, no. 3, pp. 803–816, 2008.
[42] P. Cheng, J.-K. Kim, and B.-Z. Tang, “Effects of silanefunctionalization on the properties of carbon nanotube/epoxynanocomposites,” Composites Science and Technology, vol. 67,no. 14, pp. 2965–2972, 2007.
[43] T. Liu, W. Wood, and W.-H. Zhong, “Sensitivity of DielectricProperties to Wear Process on Carbon Nanofiber/High-Density Polyethylene Composites,” Nanoscale Research Letters,vol. 6, no. 1, pp. 1–9, 2011.

Hindawi Publishing CorporationJournal of NanomaterialsVolume 2011, Article ID 265720, 6 pagesdoi:10.1155/2011/265720
Research Article
Nanofibrous Resonant Membrane for Acoustic Applications
K. Kalinova
Department of Nonwovens, Faculty of Textile Engineering, Technical University of Liberec, Studentska 2, 46117 Liberec, Czech Republic
Correspondence should be addressed to K. Kalinova, [email protected]
Received 16 May 2011; Accepted 22 July 2011
Academic Editor: Sadhan C. Jana
Copyright © 2011 K. Kalinova. This is an open access article distributed under the Creative Commons Attribution License, whichpermits unrestricted use, distribution, and reproduction in any medium, provided the original work is properly cited.
Because the absorption of lower-frequency sound is problematic with fibrous material made up of coarser fibers, highly efficientsound absorption materials must be developed. The focus of this paper is on the development of a new material with high acousticabsorption characteristics. For low-frequency absorption, structures based upon the resonance principle of nanofibrous layers areemployed in which the resonance of some elements allows acoustic energy to be converted into thermal energy. A nanofibrousmembrane was produced by an electrostatic spinning process from an aqueous solution of polyvinyl alcohol and the acousticcharacteristics of the material measured. The resonant frequency prediction for the nanofibrous membrane is based on researchinto its production parameters. The distance between electrodes during the electrostatic spinning process determines the averagediameter of the nanofibers, and the outlet velocity of the material determines its area density. The average diameter of nanofiberswas measured using the Lucia software package directly from an electron microscope image. The resonant frequency of nanofibrousmembranes was determined from the sound absorption coefficient and transmission loss measurement.
1. Introduction
This paper deals with the acoustic behavior of a nanofibrousresonant membrane. A nanofibrous layer was produced byan electrical spinning process from an aqueous solutionof polyvinyl alcohol and the resonance effect created bythe nanofibrous layer then studied. Acoustic waves causevibration in the resonant nanofibrous system with acousticenergy at the resonance frequency partially converted tokinetic energy, the remainder being acoustic energy atother frequencies. These frequencies are damped so thatthe majority of the acoustic energy, accumulated in theresonator, may be converted into heat.
This theoretical study of sound absorption characteristics[1] focuses on a membrane-type sound absorber. To analyzethe absorption mechanism, the solution is rearranged in aform which points out the contribution from each elementin the membrane-type sound absorber. The effects of theparameters of the sound absorption system are discussed inthe light of the calculated results. In addition, the methodused for predicting peak frequency and the peak value of theoblique-incident absorption coefficient of the membrane-type sound absorber is presented. This method satisfactorily
explains the relationship between the absorption character-istics and the parameters.
A sound-absorbing structure using thin film is describedin a patent [2]. When a soundwave makes contact with thesound-absorbing structure of the invention, the thin filmsvibrate and contacts between the overlapping portions rubagainst each other. The energy contained in the soundwavedissipates as a result, and a high sound absorption coefficientover a broad frequency band is obtained. The sound absorp-tion effect is intensified by the addition of the damping effectas the soundwave passes through the interstices.
Because the absorption of lower-frequency sound is pro-blematic with fibrous material made up of coarser fibers,highly efficient sound absorption materials must be devel-oped. The focus of this paper is therefore on the developmentof a new material with high acoustic absorption characteris-tics.
Previous work [3, 4] has shown this nanofibrous materialto be a highly efficient sound absorber. For low-frequencyabsorption, structures based upon the resonance principleare employed in which the resonance of some elementsallows acoustic energy to be converted into thermal energy.Earlier work [3] has demonstrated that the nanofibrous

2 Journal of Nanomaterials
Nanofibrous layersSeparated nanofibers
100001000100
f (Hz)
0
0.2
0.4
0.6
0.8
1
α
Figure 1: Frequency dependence of sound absorption coefficient α.Nanofibers creating a layer (black curve) and nanofibers distributedseparately in the sample (grey curve). The final thickness of bothmaterials is 30 mm, with a bulk density of 21 kg/m−3.
SEM MAG: 10 kxHV: 30 kVVAC: HiVac
DET: BE detectorDate: 02/05/08Device: TS5130
10 μm Vega Tescan
TU Liberec
Figure 2: Snapshot of the nanofibrous structure.
layer has a resonant effect on sound absorption when thenanofibers are arranged with respect to the layer. Thenthe tops of sound absorption coefficient are displaced tothe lower frequencies than those of sample with nanofibersdistributed separately (see Figure 1).
The sound absorption peaks of longitudinally laid sam-ples occur at frequencies lower than those of samples laidperpendicularly [4].
This is attributable to motion in the nanofibrous layer.When the longitudinal soundwave propagates perpendicu-larly to the alignment of the membrane, the nanolayer isable to move and changes in acoustic energy may occur.The second effect is due to the viscosity of the surroundingair, where acoustic energy is consumed by the drag between
3
12
4
Figure 3: A device for the production of nanofibers from apolymer solution. The polymer solution (1) wets the cylindricalelectrode (2). This electrode is matched with a counter electrode(3) whose potential differs. By rotating electrode (2), the polymersolution is drawn from the container into the counter electrode.The nanofibers form in the electrical field and are deposited onthe support material (4). The electrode distance during electrostaticspinning and the outlet velocity of the material, which controls itsarea, may be altered.
Figure 4: Nanofibrous membrane vibration at the first resonantfrequency.
vibrating air particles and the pore surface, converting theacoustic energy into thermal energy. These two nanofibrouslayer phenomena together constitute the innovation of thisacoustic product compared to current materials used forsound absorption such as foil and fibrous board.
2. Experimental
The nanofibrous membrane was produced by an electrostaticspinning process from an aqueous solution of polyvinylalcohol (see Figure 2), and two acoustic characteristics ofthe material, the sound absorption coefficient and the trans-mission loss, were measured. In this case, the nanofibrousmembrane was created without any support materials froman aqueous solution, but a nonsoluble solution may alsobe used to produce a nanofibrous membrane possessing thesame parameters and physical characteristics.
Two production parameters, the electrode distance dur-ing the electrostatic spinning process and the outlet velocity

Journal of Nanomaterials 3
100001000100
f (Hz)
0
1
2
3
L(d
B)
(a)
100001000100
f (Hz)
0
0.2
0.4
0.6
0.8
1
α
(b)
Figure 5: Frequency dependence of transmission loss L (dB) withdenoted resonant peaks (a) and frequency dependence of soundabsorption coefficient α with denoted resonant peaks (b).
100001000100
f (Hz)
0
2
4
6
8
L(d
B)
(a)
100001000100
f (Hz)
0
0.2
0.4
0.6
0.8
1
α
(b)
Figure 6: Measured frequency dependence of transmission loss L(dB) (a) and sound absorption coefficient α (b). The area density ofthe nanofibrous layer is 28.8 g·m−2.
100001000100
f (Hz)
0
1
2
3
4
L(d
B)
(a)
100001000100
f (Hz)
0
0.2
0.4
0.6
0.8
1
α
(b)
Figure 7: Measured frequency dependence of transmission loss L(dB) (a) and sound absorption coefficient α (b). The area density ofthe nanofibrous layer is 17.2 g·m−2.
100001000100
f (Hz)
0
0.4
0.8
1.2
1.6
L(d
B)
(a)
100001000100
f (Hz)
0
0.2
0.4
0.6
0.8
1
α
(b)
Figure 8: Measured frequency dependence of transmission loss L(dB) (a) and sound absorption coefficient α (b). The area density ofthe nanofibrous layer is 6.3 g·m−2.
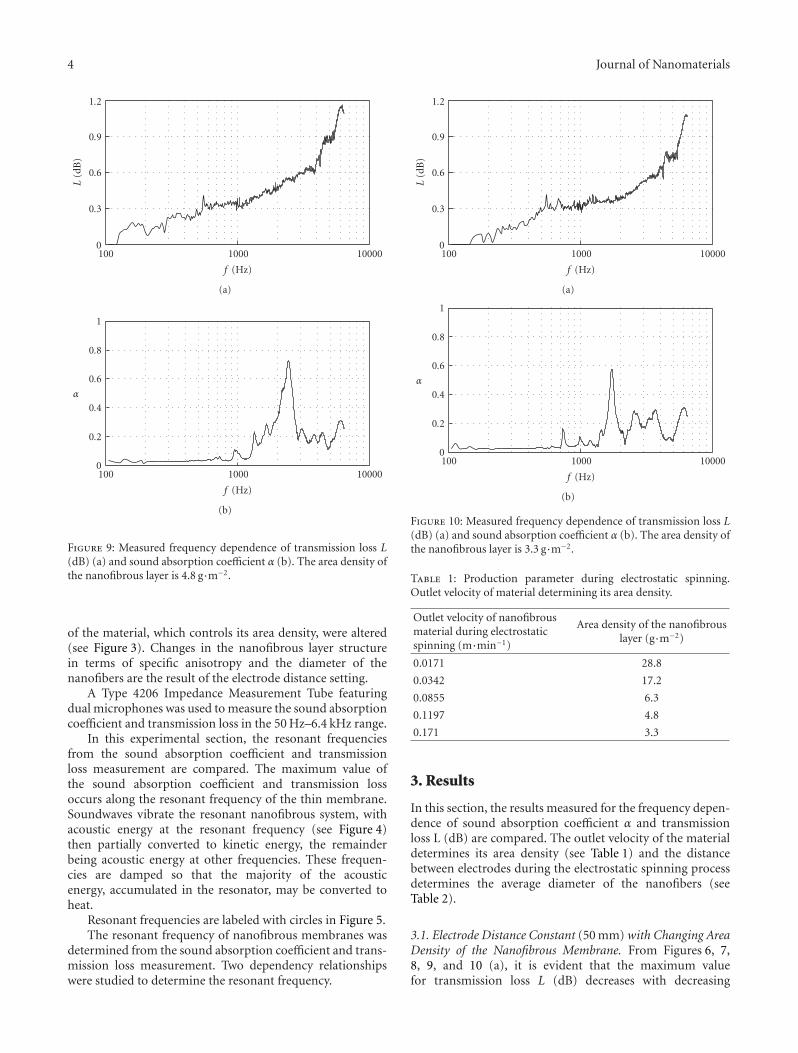
4 Journal of Nanomaterials
100001000100
f (Hz)
0
0.3
0.6
0.9
1.2
L(d
B)
(a)
100001000100
f (Hz)
0
0.2
0.4
0.6
0.8
1
α
(b)
Figure 9: Measured frequency dependence of transmission loss L(dB) (a) and sound absorption coefficient α (b). The area density ofthe nanofibrous layer is 4.8 g·m−2.
of the material, which controls its area density, were altered(see Figure 3). Changes in the nanofibrous layer structurein terms of specific anisotropy and the diameter of thenanofibers are the result of the electrode distance setting.
A Type 4206 Impedance Measurement Tube featuringdual microphones was used to measure the sound absorptioncoefficient and transmission loss in the 50 Hz–6.4 kHz range.
In this experimental section, the resonant frequenciesfrom the sound absorption coefficient and transmissionloss measurement are compared. The maximum value ofthe sound absorption coefficient and transmission lossoccurs along the resonant frequency of the thin membrane.Soundwaves vibrate the resonant nanofibrous system, withacoustic energy at the resonant frequency (see Figure 4)then partially converted to kinetic energy, the remainderbeing acoustic energy at other frequencies. These frequen-cies are damped so that the majority of the acousticenergy, accumulated in the resonator, may be converted toheat.
Resonant frequencies are labeled with circles in Figure 5.The resonant frequency of nanofibrous membranes was
determined from the sound absorption coefficient and trans-mission loss measurement. Two dependency relationshipswere studied to determine the resonant frequency.
100001000100
f (Hz)
0
0.3
0.6
0.9
1.2
L(d
B)
(a)
100001000100
f (Hz)
0
0.2
0.4
0.6
0.8
1
α
(b)
Figure 10: Measured frequency dependence of transmission loss L(dB) (a) and sound absorption coefficient α (b). The area density ofthe nanofibrous layer is 3.3 g·m−2.
Table 1: Production parameter during electrostatic spinning.Outlet velocity of material determining its area density.
Outlet velocity of nanofibrousmaterial during electrostaticspinning (m·min−1)
Area density of the nanofibrouslayer (g·m−2)
0.0171 28.8
0.0342 17.2
0.0855 6.3
0.1197 4.8
0.171 3.3
3. Results
In this section, the results measured for the frequency depen-dence of sound absorption coefficient α and transmissionloss L (dB) are compared. The outlet velocity of the materialdetermines its area density (see Table 1) and the distancebetween electrodes during the electrostatic spinning processdetermines the average diameter of the nanofibers (seeTable 2).
3.1. Electrode Distance Constant (50 mm) with Changing AreaDensity of the Nanofibrous Membrane. From Figures 6, 7,8, 9, and 10 (a), it is evident that the maximum valuefor transmission loss L (dB) decreases with decreasing

Journal of Nanomaterials 5
100001000100
f (Hz)
0
1
2
3
L(d
B)
(a)
100001000100
f (Hz)
0
0.2
0.4
0.6
0.8
1
α
(b)
Figure 11: Measured frequency dependence of transmission lossL (dB) (a) and sound absorption coefficient α (b). The electrodedistance is 50 mm.
Table 2: Production parameter during electrostatic spinning. Dis-tance of electrodes during electrostatic spinning which determinesthe average diameter of nanofibers.
Distance of electrodes duringelectrostatic spinning (mm)
Average diameter of nanofibers(nm)
50 79.9
70 77.6
90 76.3
110 73.3
130 68.6
area density of the nanofibrous membrane. The resonantfrequencies of the lower area density of the membrane (seeFigures 8–10 (a)) are not uniquely determined.
Figures 6–10 (b) show that the first significant peakin the sound absorption coefficient α has been displacedin the direction of lower frequencies with increasing areadensity of the material, when the average nanofiber diameter(the electrode distance during electrostatic spinning) isheld constant. The resonant frequency of the nanofibrousmembrane thus decreases with the area density of thenanofibrous membrane.
Comparing results from the examination of both acous-tic characteristics (see Figures 6–10, with transmission loss
100001000100
f (Hz)
0
2
4
6
8
L(d
B)
(a)
100001000100
f (Hz)
0
0.2
0.4
0.6
0.8
1
α
(b)
Figure 12: Measured frequency dependence of transmission lossL (dB) (a) and sound absorption coefficient α (b). The electrodedistance is 90 mm.
L (dB) (a) and the sound absorption coefficient α (b)) showsthat the resonant frequencies are not in agreement. The peaksoccurring under each measurement are formed at differentfrequencies.
3.2. Area Density of the Nanofibrous Membrane is Constant(17.2 g·m−2) with Changing Electrode Distance. Figures 11,12, 13, and 14 (b) show that the first significant peak inthe sound absorption coefficient α has been displaced inthe direction of higher frequencies with decreasing averagenanofiber diameter (increasing electrode distance duringelectrostatic spinning) when the area density of the materialis held constant. The resonant frequency of the nanofibrousmembrane thus increases with decreasing average nanofiberdiameter.
Comparing results from the examination of both acous-tic characteristics (see Figures 11–14, with transmission lossL (dB) (a) and the sound absorption coefficient α (b)) showsthat the resonant frequencies are not in agreement. The peaksoccurring under each measurement are formed at differentfrequencies.
The measurement of transmission loss shows two peaks,one at 530 Hz and one at 2700 Hz, for all measurementsusing constant area density (see Figures 11–14 (a)). 530 Hzand 2700 Hz would thus be resonant frequencies of themeasuring apparatus during transmission loss measurement.

6 Journal of Nanomaterials
100001000100
f (Hz)
0
2
4
6
L(d
B)
(a)
100001000100
f (Hz)
0
0.2
0.4
0.6
0.8
1
α
(b)
Figure 13: Measured frequency dependence of transmission lossL (dB) (a) and sound absorption coefficient α (b). The electrodedistance is 110 mm.
One peak is constant for all measurements using bothdependencies and both acoustic characteristics measured(see Figures 6, 7, and 11–14). The resonant frequency ofthe measuring apparatus while measuring both acousticcharacteristics is around 2700 Hz.
4. Conclusions
These two phenomena, the vibration of the nanolayer andair friction inside the nanopores, constitute the innovationof this acoustic product compared to current materials usedfor sound absorption such as foil and fibrous board.
Sound absorption coefficient measurements show thatthe resonant frequency of the nanofibrous membranedecreases with increasing area density of the membrane andincreases with decreasing average diameter of the nanofibers.
Comparing results from the examination of both acous-tic characteristics (transmission loss L (dB) and the soundabsorption coefficient α) shows that the resonant frequenciesare not in agreement. The peaks occurring under eachmeasurement are formed at different frequencies.
The transmission loss measurement shows that 530 Hzand 2700 Hz would be the resonant frequencies of themeasuring apparatus during transmission loss measurement.
One peak is constant for all measurements using bothdependencies and both acoustic characteristics measured.
100001000100
f (Hz)
0
2
4
6
L(d
B)
(a)
100001000100
f (Hz)
0
0.2
0.4
0.6
0.8
1
α
(b)
Figure 14: Measured frequency dependence of transmission lossL (dB) (a) and sound absorption coefficient α (b). The electrodedistance is 130 mm.
The resonant frequency of the measuring apparatus whilemeasuring both acoustic characteristics is around 2700 Hz.
Acknowledgement
The contribution was sponsored by the postdoctoral projectof the Czech Science Foundation (GACR), 106/07/P044Transport and Absorption of Sound in Nanofibres Assem-blies.
References
[1] K. Sakagami, M. Kiyama, M. Morimoto, and D. Takahashi,“Sound absorption of a cavity-backed membrane: a steptowards design method for membrane-type absorbers,” AppliedAcoustics, vol. 49, no. 3, pp. 237–247, 1996.
[2] Z. Yamaguchi et al., “A sound-absorbing structure using thinfilm,” EP1598808, 2005-11-23.
[3] K. Kalinova and O. Jirsak, “Resonance effect of nanofibrouslayer,” in Proceedings of the 5th AUTEX World Textile Conference,Portoroz, Slovenia, 2005.
[4] K. Kalinova, “Influence of nanofibrous membrane config-uration on the sound absorption coefficient and resonantfrequency,” in Proceedings of the 6th AUTEX World TextileConference, Raleigh, NC, USA, 2006.

Hindawi Publishing CorporationJournal of NanomaterialsVolume 2011, Article ID 729085, 5 pagesdoi:10.1155/2011/729085
Research Article
Electrical Properties of Zn-Phthalocyanine and Poly(3-hexylthiophene) Doped Nematic Liquid Crystal
Y. Karakus,1 M. Okutan,2 A. Kosemen,3 S. E. San,4 Z. Alpaslan,4 and A. Demir4
1 Department of Physics, Sakarya University, Esentepe Campus, 54187 Sakarya, Turkey2 Department of Physics, Yildiz Technical University, Davutpasa, 34210 Istanbul, Turkey3 Department of Physics, Mus Alparslan University, 49100 Mus, Turkey4 Department of Physics, Gebze Institute of Technology, Gebze, 41400 Kocaeli, Turkey
Correspondence should be addressed to M. Okutan, [email protected]
Received 19 April 2011; Revised 24 June 2011; Accepted 10 July 2011
Academic Editor: Gaurav Mago
Copyright © 2011 Y. Karakus et al. This is an open access article distributed under the Creative Commons Attribution License,which permits unrestricted use, distribution, and reproduction in any medium, provided the original work is properly cited.
An E7 coded nematic liquid crystal was doped with zinc phthalocyanine and poly (3-hexylthiophene). A variety of properties in-cluding relaxation time, absorption coefficient, and critical frequency of this doped system were investigated using impedancespectroscopy. The doped systems displayed increased absorption coefficients in the range 0.22–0.55 and relaxation times from5.05× 10−7 s to 3.59× 10⁻⁶ s with a decrease in the critical frequency from 3.54 MHz to 2.048 MHz.
1. Introduction
Liquid crystals (LCs) are molecules that have high nonlin-earity and are sensitive to low optical fields. These materialsare partially thermally stable in regular phases. Doped LCshave attracted the attention of so many researchers. Becauseof these characteristics LCs have been used in technologi-cal applications intensively [1, 2]. Poly (3-hexylthiophene)(P3HT) is also a well-known conductive polymer in whichholes are dominant charge carriers. This polymer has ahigh absorption coefficient in almost all along the visiblerange. Because of this unique property it has been usedas an organic-based solar cell [3, 4]. With the mobility of0.1 cm2/V·s (which is quite high for a polymer), P3HT hasbeen used in organic field effect transistors as well (OFET)[5, 6].
Phthalocyanines (Pc) are also important materials forchemical applications. These thermally stable molecules havehigh absorption coefficient in the visible range. Pcs which aren-type materials have been used as gas sensors [7], as OFETs[8], and as solar cells [9]. Dielectric properties of Pcs havebeen investigated in different ways. The dielectric propertiesof certain Zn-Pc molecules are studied by evaporating a thinfilm of this material on a gold electrode [10]. Dielectricproperties of Ni-Pcs are investigated by doping them in a
liquid crystal [11]. The complex expression of the dielectricconstant can be written as ε∗ = ε′ + iε′′ in terms of ε′
and ε′′, which are the real and imaginary parts of dielectricconstant, respectively. The frequency-dependent Cole-Coleform of this equation is [12]
ε∗ = ε∞ +(εs − ε∞)
1 + (i�τ)1−α . (1)
Here εs is the value of the low frequency dielectric constant,and ε∞ is the value of the high frequency dielectric constantin the measured frequency range, � is the angular frequency,τ is the relaxation time, and α is the absorption coefficient.
To understand the electrical properties of the materialwith different structures, the dielectric spectroscopy (DS)technique is used. Mentioned real part of the dielectric con-stant ε′ can also be deduced from the following equation:
C = εoε′Ad. (2)
Here C is capacitance, εo is the dielectric constant of thefree space, A is the surface area, and d is the thickness ofthe cell. Actually imaginary part of the dielectric constant

2 Journal of Nanomaterials
CN
CN
CN
CNO
(a)
ZnPc: Zn-phthalocyanine
N
N
N
N N
N
N
N
Zn
R R
R R1
(b)
P3HT: Poly(3-hexylthiophene)
C6H13
S n
(c)
Figure 1: Chemical structures of: (a) nematic host, E7, (b) Zn-phthalocyanine, (c) Poly(3-hexylthiophene).
ε′′ is known as the dielectric loss. The dielectric loss ε′′ iscalculated from the following equation:
ε′′ = ε′ tan δ, (3)
where δ = 90 − ϕ and ϕ is the phase angle. In the scopeof this work, relaxation times, absorption coefficient, andcritical frequency are measured by DS technique. The acconductivity and the impedance of these materials, whichdepend on the frequency, are studied by using the impedancespectroscopy. In fact, impedance spectroscopy is a strong toolwhich could be applied to overview important parameters ofLCs as mentioned in [13, 14].
It is also well known that the complex impedance for theLC is expressed as
Z∗ = Z′ + Z′′, (4)
where Z′ and Z′′ are the real and the imaginary parts ofthe complex impedance, respectively, and the real part of thecomplex impedance is expressed as [15]
Z′ = Rs +Rp
1 + (�/�0)2 , (5)
where Rs is the serial resistance, � is the angular frequencyof the applied field, and�0 is the characteristic (or natural)angular frequency of the system, �0 = 1/(RpCp). Rp is theparallel resistance, and Cp is the parallel capacitance.
2. Experimental
The measurement cells are made of two glass slides separatedby Mylar sheets having a thickness of about 10 μm. Beforethe construction of the cells, Indium tin oxide (ITO) coveredglass substrates were spin coated with Polyvinyl alcohol
(PVA) at 2000 rpm and were cured at 50◦C for 2 hours. Thethickness of the coating is about 100 nm. In order to obtainpreliminary molecular orientation, these coating layers wereexposed to surface treatment of unidirectional rubbing withvelvet. This is indeed the so-called planar reorientation,where the LC molecules will be parallel to the ITO wallswhatever agent is doped in small amounts. Zn-Pc (Zn-Phthalocyanine) and P3HT (poly(3-hexylthiophene)) weredissolved in LC under the reinforcement of ultrasonic effect.The structural formula of Zn-Pc, P3HT, and the nematicLC (E7) are shown in Figure 1. P3HT was purchased fromSigma-Aldrich Inc. and the Liquid Crystal was attained fromMerck.
In this study four different samples were prepared:Undoped E7, a 2% w/w Zn-Pc, a 2% w/w P3HT, and amixture of 2% w/w Zn-Pc and 2% w/w P3HT, all doped intoan E7 host.
Dependency of the impedance on the frequency andthe dielectric properties were investigated by making severalmeasurements. Dielectric constant was also calculated fromthe parallel capacitance technique (see results and discus-sion). HP 4194A Impedance Analyzer was utilized for thesemeasurements. Complex dielectric response was consideredbetween 1 kHz to 15 MHz. RMS amplitude of this device is∼495 mV.
3. Results and Discussion
Figure 2 shows the real part of the complex impedancefor different LC cells. As can be seen in Figure 2, at lowfrequencies the real part of the impedance for Pc-Zn andP3HT doped LC samples indicates a plateau region. After theplateau region, the impedance decreases drastically with theincreasing frequency. At high frequencies, the impedance is
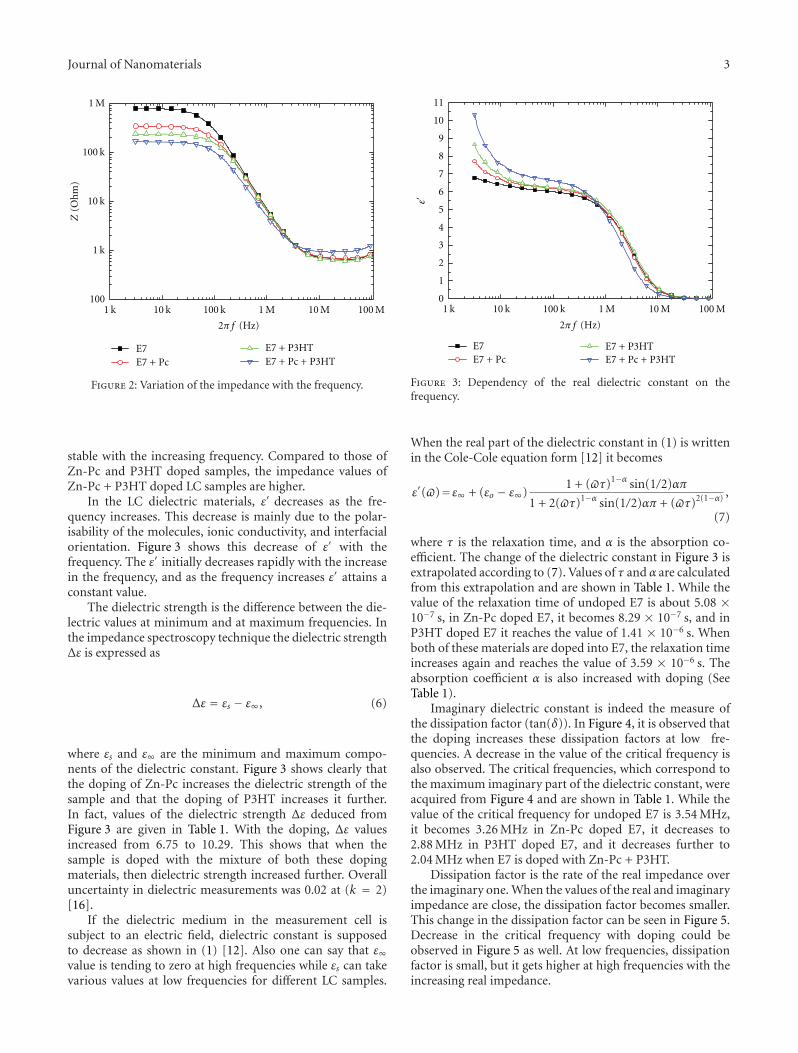
Journal of Nanomaterials 3
1 k
1 k
10 k
10 k
100 k
100 k
1001 M
1 M
10 M 100 M
E7E7 + Pc
E7 + P3HTE7 + Pc + P3HT
Z(O
hm
)
2π f (Hz)
Figure 2: Variation of the impedance with the frequency.
stable with the increasing frequency. Compared to those ofZn-Pc and P3HT doped samples, the impedance values ofZn-Pc + P3HT doped LC samples are higher.
In the LC dielectric materials, ε′ decreases as the fre-quency increases. This decrease is mainly due to the polar-isability of the molecules, ionic conductivity, and interfacialorientation. Figure 3 shows this decrease of ε′ with thefrequency. The ε′ initially decreases rapidly with the increasein the frequency, and as the frequency increases ε′ attains aconstant value.
The dielectric strength is the difference between the die-lectric values at minimum and at maximum frequencies. Inthe impedance spectroscopy technique the dielectric strengthΔε is expressed as
Δε = εs − ε∞, (6)
where εs and ε∞ are the minimum and maximum compo-nents of the dielectric constant. Figure 3 shows clearly thatthe doping of Zn-Pc increases the dielectric strength of thesample and that the doping of P3HT increases it further.In fact, values of the dielectric strength Δε deduced fromFigure 3 are given in Table 1. With the doping, Δε valuesincreased from 6.75 to 10.29. This shows that when thesample is doped with the mixture of both these dopingmaterials, then dielectric strength increased further. Overalluncertainty in dielectric measurements was 0.02 at (k = 2)[16].
If the dielectric medium in the measurement cell issubject to an electric field, dielectric constant is supposedto decrease as shown in (1) [12]. Also one can say that ε∞value is tending to zero at high frequencies while εs can takevarious values at low frequencies for different LC samples.
1 k 10 k 100 k 1 M 10 M 100 M0
1
2
3
4
5
6
7
8
9
10
11
ε
E7E7 + Pc
E7 + P3HTE7 + Pc + P3HT
2π f (Hz)
Figure 3: Dependency of the real dielectric constant on thefrequency.
When the real part of the dielectric constant in (1) is writtenin the Cole-Cole equation form [12] it becomes
ε′(�)=ε∞ + (εo − ε∞)1 + (�τ)1−α sin(1/2)απ
1 + 2(�τ)1−α sin(1/2)απ + (�τ)2(1−α) ,
(7)
where τ is the relaxation time, and α is the absorption co-efficient. The change of the dielectric constant in Figure 3 isextrapolated according to (7). Values of τ and α are calculatedfrom this extrapolation and are shown in Table 1. While thevalue of the relaxation time of undoped E7 is about 5.08 ×10⁻⁷ s, in Zn-Pc doped E7, it becomes 8.29 × 10⁻⁷ s, and inP3HT doped E7 it reaches the value of 1.41 × 10⁻⁶ s. Whenboth of these materials are doped into E7, the relaxation timeincreases again and reaches the value of 3.59 × 10⁻⁶ s. Theabsorption coefficient α is also increased with doping (SeeTable 1).
Imaginary dielectric constant is indeed the measure ofthe dissipation factor (tan(δ)). In Figure 4, it is observed thatthe doping increases these dissipation factors at low fre-quencies. A decrease in the value of the critical frequency isalso observed. The critical frequencies, which correspond tothe maximum imaginary part of the dielectric constant, wereacquired from Figure 4 and are shown in Table 1. While thevalue of the critical frequency for undoped E7 is 3.54 MHz,it becomes 3.26 MHz in Zn-Pc doped E7, it decreases to2.88 MHz in P3HT doped E7, and it decreases further to2.04 MHz when E7 is doped with Zn-Pc + P3HT.
Dissipation factor is the rate of the real impedance overthe imaginary one. When the values of the real and imaginaryimpedance are close, the dissipation factor becomes smaller.This change in the dissipation factor can be seen in Figure 5.Decrease in the critical frequency with doping could beobserved in Figure 5 as well. At low frequencies, dissipationfactor is small, but it gets higher at high frequencies with theincreasing real impedance.

4 Journal of Nanomaterials
Table 1: The dielectric strength Δε, the relaxation time τ, theabsorption coefficient α, and the critical frequency fc of the samples.
Sample Δε τ(s) α fc (Hz)
E7 6.75 5.08 × 10⁻⁷ 0.22 3.54 × 10⁶
E7 + Zn-Pc 7.68 8.26 × 10⁻⁷ 0.37 3.2 × 10⁶
E7 + P3HT 8.6 1.41 × 10⁻⁶ 0.51 2.88 × 10⁶
E7 + ZnPc + P3HT 10.29 3.59 × 10⁻⁶ 0.55 2.04 × 10⁶
1 k 10 k 100 k 1 M 10 M 100 M
E7E7 + Pc
E7 + P3HTE7 + Pc + P3HT
0.1
1
10
ε
2π f (Hz)
Figure 4: Dependency of the imaginary dielectric constant on thefrequency.
Table 2: The dielectric constants εo, ε∞, and εmax of the samples.
Specimens εo ε∞ εmax
E7 67.81 0.03 2.52
E7 + Pc 77.09 0.03 2.62
E7 + P3HT 86.33 0.03 2.62
E7 + Pc + P3HT 10.32 0.03 2.72
When the value of absorption coefficient (α) is zero,the material shows Debye type relaxation, if the values ofα gets bigger than zero, and less than one, the materialshows non-Debye type relaxation [12]. Existence of Debyetype relaxation can be determined from the Cole-Cole plots.As shown in Figure 6, the centers of the arcs are locatedbelow the x-axis for all samples, indicating that non-Debyetype relaxation is dominant when there is no bias fieldapplied [15, 16]. From the analysis of the Cole-Cole plotsthat are shown in Figure 6, one can get information about thedielectric constants at minimum and maximum frequencies.
The value of the dielectric constant at the maximumpoint of the semicircles εmax can also be obtained from theseplots for the different doping materials. All the dielectric con-stants deduced from Cole-Cole plots are shown in Table 2.
Cole-Cole plots can give information about the equiv-alent circuit structures. Our LC cells show properties of aparallel RC equivalent circuit in series to a resistance.
E7E7 + Pc
E7 + P3HTE7 + Pc + P3HT
1 k 10 k 100 k 1 M 10 M 100 M0
1
2
3
4
5
6
7
8
9
10
11
12
tan
(δ)
2π f (Hz)
Figure 5: Variation of the dissipation factor with the frequency.
0 1 2 3 4 5 6 7 80
1
2
3
4ε
ε
E7E7 + Pc
E7 + P3HTE7 + Pc + P3HT
Figure 6: Cole-Cole plots of the pure and the doped samples.
Critical frequency decreases exponentially with theabsorption coefficient α with the addition of different dopingmaterials (Figure 7(a)), and the relaxation time increasesexponentially with the increase of the absorption coefficientα (Figure 7(b)).
4. Conclusions
In this study, the doping of Zn-Pc and P3HT into E7 de-creased the impedance. From this study we concluded thatP3HT is a better conductor than Zn-Pc, and when thesample is doped with both of these materials in the sameproportion, then the impedance is decreased further. A studyof the critical frequency, relaxation time, and absorptioncoefficients using DS is also carried out. As a result, we havenoticed that the doping decreased the critical frequency andincreased the conductivity. It also increased the relaxationtime. Increase in the values of absorption coefficient bydoping implies the non-Debye type relaxation behaviors in
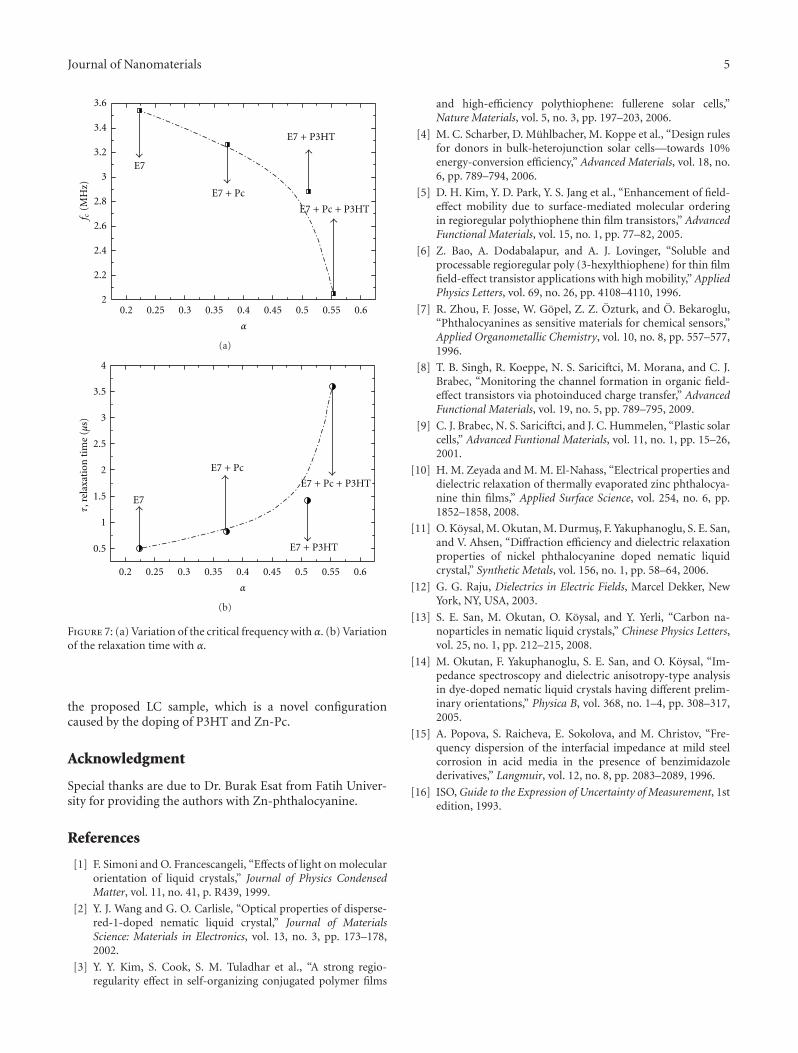
Journal of Nanomaterials 5
E7
E7 + Pc
E7 + P3HT
E7 + Pc + P3HT
0.2 0.25 0.3 0.35 0.4 0.45 0.5 0.55 0.62
2.2
2.4
2.6
2.8
3
3.2
3.4
3.6
f c(M
Hz)
α
(a)
E7
E7 + Pc
E7 + P3HT
E7 + Pc + P3HT
0.5
1
1.5
2
2.5
3
3.5
4
α
0.2 0.25 0.3 0.35 0.4 0.45 0.5 0.55 0.6
τ,re
laxa
tion
tim
e(μ
s)
(b)
Figure 7: (a) Variation of the critical frequency with α. (b) Variationof the relaxation time with α.
the proposed LC sample, which is a novel configurationcaused by the doping of P3HT and Zn-Pc.
Acknowledgment
Special thanks are due to Dr. Burak Esat from Fatih Univer-sity for providing the authors with Zn-phthalocyanine.
References
[1] F. Simoni and O. Francescangeli, “Effects of light on molecularorientation of liquid crystals,” Journal of Physics CondensedMatter, vol. 11, no. 41, p. R439, 1999.
[2] Y. J. Wang and G. O. Carlisle, “Optical properties of disperse-red-1-doped nematic liquid crystal,” Journal of MaterialsScience: Materials in Electronics, vol. 13, no. 3, pp. 173–178,2002.
[3] Y. Y. Kim, S. Cook, S. M. Tuladhar et al., “A strong regio-regularity effect in self-organizing conjugated polymer films
and high-efficiency polythiophene: fullerene solar cells,”Nature Materials, vol. 5, no. 3, pp. 197–203, 2006.
[4] M. C. Scharber, D. Muhlbacher, M. Koppe et al., “Design rulesfor donors in bulk-heterojunction solar cells—towards 10%energy-conversion efficiency,” Advanced Materials, vol. 18, no.6, pp. 789–794, 2006.
[5] D. H. Kim, Y. D. Park, Y. S. Jang et al., “Enhancement of field-effect mobility due to surface-mediated molecular orderingin regioregular polythiophene thin film transistors,” AdvancedFunctional Materials, vol. 15, no. 1, pp. 77–82, 2005.
[6] Z. Bao, A. Dodabalapur, and A. J. Lovinger, “Soluble andprocessable regioregular poly (3-hexylthiophene) for thin filmfield-effect transistor applications with high mobility,” AppliedPhysics Letters, vol. 69, no. 26, pp. 4108–4110, 1996.
[7] R. Zhou, F. Josse, W. Gopel, Z. Z. Ozturk, and O. Bekaroglu,“Phthalocyanines as sensitive materials for chemical sensors,”Applied Organometallic Chemistry, vol. 10, no. 8, pp. 557–577,1996.
[8] T. B. Singh, R. Koeppe, N. S. Sariciftci, M. Morana, and C. J.Brabec, “Monitoring the channel formation in organic field-effect transistors via photoinduced charge transfer,” AdvancedFunctional Materials, vol. 19, no. 5, pp. 789–795, 2009.
[9] C. J. Brabec, N. S. Sariciftci, and J. C. Hummelen, “Plastic solarcells,” Advanced Funtional Materials, vol. 11, no. 1, pp. 15–26,2001.
[10] H. M. Zeyada and M. M. El-Nahass, “Electrical properties anddielectric relaxation of thermally evaporated zinc phthalocya-nine thin films,” Applied Surface Science, vol. 254, no. 6, pp.1852–1858, 2008.
[11] O. Koysal, M. Okutan, M. Durmus, F. Yakuphanoglu, S. E. San,and V. Ahsen, “Diffraction efficiency and dielectric relaxationproperties of nickel phthalocyanine doped nematic liquidcrystal,” Synthetic Metals, vol. 156, no. 1, pp. 58–64, 2006.
[12] G. G. Raju, Dielectrics in Electric Fields, Marcel Dekker, NewYork, NY, USA, 2003.
[13] S. E. San, M. Okutan, O. Koysal, and Y. Yerli, “Carbon na-noparticles in nematic liquid crystals,” Chinese Physics Letters,vol. 25, no. 1, pp. 212–215, 2008.
[14] M. Okutan, F. Yakuphanoglu, S. E. San, and O. Koysal, “Im-pedance spectroscopy and dielectric anisotropy-type analysisin dye-doped nematic liquid crystals having different prelim-inary orientations,” Physica B, vol. 368, no. 1–4, pp. 308–317,2005.
[15] A. Popova, S. Raicheva, E. Sokolova, and M. Christov, “Fre-quency dispersion of the interfacial impedance at mild steelcorrosion in acid media in the presence of benzimidazolederivatives,” Langmuir, vol. 12, no. 8, pp. 2083–2089, 1996.
[16] ISO, Guide to the Expression of Uncertainty of Measurement, 1stedition, 1993.