polymer hydrogel nanoparticles and their networks
TRANSCRIPT

POLYMER HYDROGEL NANOPARTICLES AND THEIR NETWORKS
Xihua Lu, B.E., M.S.
Dissertation Prepared for the Degree of
DOCTOR OF PHILOSOPHY
UNIVERSITY OF NORTH TEXAS
August 2002
APPROVED:
Zhibing Hu, Major Professor Nandika A. D’Souza, Committee Member Samuel Matteson, Committee Member Robert M. Wallace, Committee Member Brace Gnade, Committee Member and Chairman
Department of Materials Science C. Neal Tate, Dean of the Robert B. Toulouse School of Graduate Studies
Lu, Xihua, Polymer hydrogel nanoparticles and their networks. Doctor of
Philosophy (Materials Science), August 2002, 105 pp., 1 table, 29 illustrations, 98
references.
The thermally responsive hydroxypropyl cellulose (HPC) hydrogel nanoparticles
have been synthesized and characterized. The HPC particles were obtained by
chemically crosslinking collapsed HPC polymer chains in water-surfactant
(dodecyltrimethylammonium bromide) dispersion above the lower critical solution
temperature (LCST) of the HPC. The size distributions of microgel particles, measured
by dynamic light scattering, have been correlated with synthesis conditions including
surfactant concentration, polymer concentration, and reaction temperature. The swelling
and phase transition properties of resultant HPC microgels have been analyzed using both
static and dynamic light scattering techniques.
By first making gel nanoparticles and then covalently bonding them together, we
have engineered a new class of gels with two levels of structural hierarchy: the primary
network is crosslinked polymer chains in each individual particle, while the secondary
network is a system of crosslinked nanoparticles. The covalent bonding contributes to the
structural stability of the nanostructured gels, while self-assembly provides them with
crystal structures that diffract light, resulting in colors. By using N-isopropylacrylamide
copolymer hydrogel nanoparticles, we have synthesized nanoparticle networks that
display a striking iridescence like precious opal but are soft and flexible like gelatin. This
is in contrast to previous colored hydrogels, which were created either by adding dyes or
fluorescent, or by organic solvent or by embedding a colloidal crystal array of polymer
solid spheres . Creating such periodic 3D structures in materials allows us to obtain
useful functionality not only from the constituent building blocks but also from the long-
range ordering that characterizes these structures.
Hydroxypropyl cellulose (HPC) and poly (acrylic acid ) (PAA) complexes were
studied using turbidity measurement and laser light scattering. The phase transition
temperature of the complexes is found to depend on pH and molecular weights of PAA
and HPC. The driving force for this phenomenon is due to the hydrogen bonding and
hydrophobic interaction of the macromolecules. Based on the principle of the PAA/HPC
complexes, the PAA nanoparticles were synthesized in 0.1wt % HPC aqueous solution at
room temperature.

ii
Copyright 2002
by
Xihua Lu

iii
ACKNOWLEDGMENT
I am greatly indebted to my advisor Professor Zhibing Hu for his instruction and
enthusiastic encouragement throughout this research. I particularly give my thanks to
him for his financial support.
Special thanks are given to all the committee members for their advice.
The help of the warm support of other students in Dr. Hu’s group is greatly
acknowledged.
I should like to acknowledge my gratitude to my wife Hong Su for inestimable help and
to my son Bowen Lu for his love.
I am grateful to support of this research by the U. S. Army Research Office under
Grant No. DAAD 19-01-1-0596, the National Science Foundation under Grant No.
DMR-0102468 , and the Petroleum Research Fund, administered by the American
Chemical Society.

iv
TABLE OF CONTENTS
Page
LIST OF TABLE ······································································································ v
LIST OF ILLUSTRATIONS ······················································································ vi
CHAPTER
1. INTRODUCTION··························································································· 1
2. PRINCIPLE AND APPLICATION OF LASER LIGHT SCATTERING······ 11
3. SYNTHESIS AND LIGHT SCATTERING STUDY OF HYDROXYPROPYL
CELLULOSE MICROGELS ·········································································· 26
4. POLYMER GEL NANOPARTICLE NETWORKS ······································ 48
5. POLYMER HYDROGEL CRYSTALS·························································· 60
6. PHASE TRANSITION BEHAVIOR OF HYDROXYPROPYL CELLULOSE
UNDER INTERPOLYMER COMPLEXATION WITH POLY(ACYLIC
ACID) ·············································································································· 75
7. CONCLUSION································································································· 95
BIBLIOGRAPHY ········································································································100

v
LIST OF TABLE Table Page 3.1 Synthesis Condition, Average Radii <Rh>, and Polydispersity Index )/(
2
2 Γµ of HPC Microgels ····································································································· 30

vi
LIST OF ILLUSTRATIONS Figure Page 2.1 A commercial ALV/DLS/SLS-5000 laser light scattering (LLS) ·························23 2.2 Schematic Setup of the Laser Light Scattering Instrument ···································24
3.1 Chemical structure of the HPC polymer································································· 28
3.2 Hydrodynamic radius distributions (f(Rh)) of HPC microgel particles (C=8.94×10⁻⁶
g/ml) in deionized water at 25oC. These particles were prepared in 0.1wt% HPC
solution at various DTAB concentrations. Here the CMC is the critical micelle
concentration of DTAB in pure water at 25°C and equals to 1.54 x 10⁻² mol/l
································································································································ 32
3.3 Hydrodynamic radius distributions (f(Rh)) of HPC microgel particles
(C=8.94×10⁻⁶ g/ml) in deionized water at 25oC. These particles were prepared
with various HPC concentrations at 1 CMC DTAB and at the reaction
temperature 550C. ··································································································· 34
3.4a Hydrodynamic radius distributions (f(Rh)) of HPC microgel particles (C=
8.94×10⁻⁶ g/ml) in de-ionized water at 25oC. These particles were made at various
reaction temperatures in 0.1wt% HPC solution and at 1 CMC DTAB concentration.
································································································································· 35
3.4b Hydrodynamic radius distributions (f(Rh)) of HPC microgel particles (C=
8.94×10⁻⁶ g/ml) in de-ionized water at 25oC. These particles were made at 550C

vii
reaction temperature in 0.1wt% HPC solution and at 1 CMC DTAB concentration.
································································································································· 36
3.5a The average hydrodynamic radius <Rh> of HPC microgel with different
crosslinking density changes as a function of temperature in deionized water.···· 38
3.5b Volume phase transition temperature of the HPC microgels with 10 wt%
crosslinking density. ··························································································· 39
3.6 Inverse of Time-averaged scattered intensity I-1 vs wave vector square q2 of HPC
microgel particles in de-ionized water at 25 oC and at 44 oC, respectively.
································································································································ 40
3.7 (a) Intensity autocorrelation functions of the HPC microgel in de-ionized water at
25 oC and 44 oC, respectively. (b) Corresponding hydrodynamic radius
distributions (f(Rh)) of the samples. ······································································ 42
3.8 The average hydrodynamic radius <Rh> of HPC microgels changes as a function of
temperature in de-ionized water and in 0.9 wt% NaCl aqueous solution,
respectively. ·········································································································· 43
4.1 Structure of a polymer gel nanoparticle network. ················································· 51
4.2 Swelling and shrinking kinetics of the HPC nanoparticle network that was formed
at room temperature. ··························································································· 53
4.3 The NIPA-AA nanoparticles and its network with blue color. ···························· 55
5.1 The covalently bonded, self-assembled NIPA nanoparticles································ 64
5.2 Optical properties of self-assembled NIPA nanoparticles.···································· 65

viii
5.3 Environmentally responsive color and shape changes of bonded NIPA nanoparticle
assemblies. ········································································································· 68
5.4 The NIPA crystal hydrogels made with Scheme 2.··············································· 70
6.1 Schematic hydrogen bonding between HPC and PAA. ········································ 79
6.2a The turbidity of the HPC/PAA for different HPC concentrations of Mw=1.0×10⁶
at PAA concentration CPAA=1.0wt% at pH=3.2. ················································ 81
6.2b The turbidity of the HPC/PAA for different HPC concentrations of Mw=1.0×10⁵
at 1.0wt% PAA concentration at pH=3.2. ·························································· 82
6.3 The turbidity of the HPC/PAA for two different PAA molecular weights at
0.3wt%HPC and 1.0wt%PAA. . ··········································································· 83
6.4 a. The turbidity of the HPC/PAA for different pHs at 0.6wt% HPC and 1.0wt%.
······························································································································· 84
6. 4b. The LCST of the HPC/PAA for different pHs at 0.6wt% HPC and
1.0%wt PAA. ····························································································· 85
6.5. The turbidity of the 1.0wt% HPC/PAA at pH=7.4. ········································· 86
6.6a. Hydrodynamic radius distributions (f(Rh)) of self-assembly HPC/PAA
nanoparticles (C=1.6×10⁻⁵g/ml) at pH=3.2. ················································· 87
6.6b. Average hydrodynamic radius < Rh > of self-assembly HPC/PAA nanoparticles
at pH=3.2. ····································································································· 88
6.7 Hydrodynamic radius distribution (f(Rh)) of PAA microgel particles
(C=1.32×10⁻⁵ g/mL) in pH=3.2 and pH=7.4 at 250C. ········································ 90

1
CHAPTER 1
INTRODUCTION
Hydrogel nanoparticles ( also called microgels) are crosslinked colloidal particles that
can swell by the absorption of many times their weight of solvent (water). They exhibit
a behavior ranging from that of polymer solutions to that of hard spheres.1 Treating a
dispersion of identical colloidal particles as a one-component assembly of superatoms
dispersed in a continuous background, hydrogel nanoparticle systems lead to the
fundamental study of modeling the transition from liquid to crystal and from the
supercooled liquid to the glassy state of atomic fluids.2 From an application point of
view, the hydrogel nanoparticles can respond to environmental change much faster than
the bulk gel due to the much smaller size of the particles. Unusual properties of the
nanoparticles lead to various applications, including automotive surface coatings,
printing, and controlled drug delivery.3
Many methods have been developed for preparing hydrogel nanoparticles, including
emulsion polymerization,4 inverse microemulsion polymerization, anionic
copolymerization, and crosslinking of neighboring polymer chains. Currently, thermally-
responsive hydrogel nanoparticles, as represented by N-isopropylacrylamide (NIPA)
have attracted a great deal of attention due to their scientific importance and
technological applications. The NIPA microgel was first synthesized by Pelton and

2
Chibante in 1986.4 In their study, the pre-gel solution of the NIPA monomer was
heated above the lower critical solution temperature (LCST) of the NIPA polymer
solution. The polymerization of the NIPA monomers and crosslinking polymer chains
occurred simultaneously at the reaction temperature T > LCST. Narrowly distributed
NIPA hydrogel particles were obtained with their swelling properties similar to those of
the bulk NIPA gel.
Hydrogels with nanometer-scale structures have been previously studied.5,6 The
nanostrucutred hydrogels with crystal structures were usually made: Nanoparticles
were dispersed in the monomers and self-assembled to form periodical crystal structure
through electrostatic repulsion, and then monomers were photopolymerized to form
hydrogels and immobilize the ordered crystal structures. The major problem in previous
work is that the nanoparticles embedded in the hydrogels are hydrophobic polymers like
polystyrene. The interparticle distance can only be controlled by swelling and shrinking
the hydrogel matrix.
This dissertation firstly investigates the synthesis and properties of hydroxypropyl
cellulose (HPC) hydrogel nanoparticles. The HPC hydrogel nanoparticles were made
directly from natural HPC polymer chains. Natural polymers are macromolecular
structures in their original, while synthetic polymers are made from small molecules
called monomers. The synthesis of the HPC nanoparticles will provide an important
guide to preparation and study of other hydrogel nanoparticles directly from polymer
chains. In contrast to most synthetic hydrogel nanoparticles that are made from
carcinogenic or teratogenic monomers, the HPC nanoparticles comprise natural cellulose

3
ether macromolecules approved by the United State Food and Drug Administration
(FDA) and thus have significant practical advantages over the synthetic hydrogel
nanoparticles. Secondly, this dissertation contributes to novel nanostructured hydrogels
--- hydrogel nanoparticle networks. Hydrogel nanoparticle networks are formed by
covalently crosslinking nanoparticles, including the HPC nanoparticle network, the HPC
nanoparticle co- poly(vinyl alcohol) (PVA) nanoparticle network, NIPA-co-AA (acrylic
acid) copolymer nanoparticle network, and NIPA-co-HEAc (2-hydroxyethyl acrylate)
copolymer nanoparticle network. Finally, the dissertation investigates the phase
transition behavior of the HPC in the presence of poly(acrylic acid) (PAA). The phase
transition of the HPC shifted to lower temperature in the presence of PAA at low pH.
Dilute HPC/PAA solution can self-assemble to form the HPC/PAA hydrogel
nanoparticles. The complexation between HPC and PAA at low pH leads to a new
method of developing PAA microgels directly in aqueous solution. The dissertation has
been divided into seven chapters. Chapter 2-7 are briefly described as follows:
In Chapter 2, the principle and application of laser light scattering are briefly
reviewed.7 In macromolecule and colloid science, laser light scattering (LLS)8 is
normally referred to the light scattering of the nonabsorbing macromolecules or colloidal
particles. The two measurements of the LLS are respectively referred to as static (
elastic, i.e., no absorption) and dynamic (quasi-elastic) laser light scattering (LLS).
The static LLS measures the time-average scattered intensity, from which three
parameters of macromolecules or colloidal particles, namely the weight-average
molecular weight (Mw), the z-average root-mean-square radius of gyration (<Rg2>1/2 ,

4
simply Rg) and the second-order virial coefficient (A2), can be obtained. Here, the
second-order virial coefficient A2 describes the interaction between a polymer and a
solvent in the polymer solution. The dynamic LLS measures the intensity fluctuation (
this is also where the word ‘dynamic’ comes from) and can be used to investigate the
properties of the motion of the particles. The most commonly used method in dynamic
LLS is the digital technique of photon correction spectroscopy ( or optical mixing ),
which measures the intensity fluctuation of the scattered light in the time domain.
In Chapter 3, we report on the synthesis and study of another important thermally
responsive microgel-- hydroxypropyl cellulose (HPC). Bulk HPC hydrogel, including
the homogeneous gel and the porous gel have been extensively studied before.9 The
HPC gel collapses and shrinks above the volume phase transition temperature(Tc),
around 41°C, but swells and expands below Tc.
To our knowledge, however, the synthesis of the HPC microgels has not been
reported. In contrast to previous work on the NIPA microgel that started from NIPA
monomers, we demonstrated a process whereby HPC chains in a surfactant solution
were heated above the LCST to give colloidal particles that were then crosslinked to
form microgel particles. In this chapter, our results will be divided into two parts. The
first is to discuss synthesis of HPC microgels that involved fundamental interaction
between high molecular weight polymer chains and surfactant. The second is to discuss
swelling properties and the volume phase transition of HPC microgel particles as a
function of temperature, crosslinker concentration and quality of solvent. Light
scattering techniques have been used for both monitoring microgel formation and

5
characterizing the microgel particles. Such techniques have been widely used to study
various microgels.10
In Chapter 4, novel nanostructured hydrogels are investigated. Polymer gels are a
unique class of macromolecular networks that contain a large fraction of solvent within
their structure. They are particularly suitable for biomedical applications because of
their ability to simulate biological tissues.11 In response to environmental stimuli such
as temperature and pH, gels can reversibly swell or shrink up to 1000 times in volume
and have varied applications such as artificial muscles, controlled drug release, and
sensors.12-15 Gels are usually formed by the free radical polymerization of monomers in
the presence of a difunctional crosslinking agent. They can be made either in bulk or in
nano- or micro-particles. The bulk gels are easy to handle, but have very slow swelling
rate, while the gel nanoparticles act quickly to an external stimulus, but are too small for
some applications. By first making gel nanoparticles and then covalently bonding them
together, we have engineered a new class of gels with two levels of structural hierarchy:
the primary network is the crosslinked polymer chains in each individual particle, while
the secondary network is a system of crosslinked nanoparticles. Such nanostructured
gels have new and unique properties that conventional gels do not have, including a high
surface area, a bright blue color at room temperature, and temperature-tunable
heterogeneity on the nanometer scale. This work may lead to creating opportunities for
technological applications, ranging from controlled drug delivery, sensors, bio-
adhesives, to displays.
6
In Chapter 5, we show a new class of bulk hydrogels with mesoscopical crystal
structures. Hydrogels usually consist of randomly crosslinked polymer chains and
contain a large amount of water filling interstitial spaces of the network, resulting in
amorphous structures. Without a coloring agent, the hydrogels are clear when they
fully swell in water. The central idea is to covalently bond self-assembled hydrogel
nanoparticles. The covalent bonding contributes to the structural stability, while self-
assembly provides the crystal structure that diffracts light, resulting in different colors.
As a result, these novel materials, which contain up to 97 wt % water, display a striking
iridescence, like precious opal, but are soft and flexible like gelatin. This is in contrast
to previous colored hydrogels, which were created either by adding dyes or fluorescent
molecules, organic solvents, or by embedding a colloidal crystal array of polymer solid
spheres. In this chapter, three simple applications based on crystal hydrogels are presented:
a gel sensor with environmentally-tunable colors, a gel “opal” that displays a striking
iridescence but is elastic and soft, and a gel display whose iridescent pattern can be
made either visible or invisible by simply switching temperature. Creating such periodic
3D structures in materials allows us to obtain useful functionality not only from the
constituent building blocks, but also from the long-range ordering that characterizes
these structures.16
In Chapter 6, the phase transition behavior of hydroxypropyl cellulose (HPC) in the
presence of poly(acrylic acid) (PAA) is studied. Interpolymer complexes are physically
interacting polymer chains in solution and have been extensively investigated.17,18 The
complexation of different polymers in solution is a commonly used procedure for

7
tailoring polymer properties to specific needs, without chemical modification of
macromolecules. Most studies have been performed on the polymer complex systems,
mainly focusing on the factors that affect complexation, including stoichiometric ratio
of two complementary polymers, pH, ionic strength, solvent, concentration, and
structure of the component polymers.19, 20 However, only a few studies have been
reported so far on the effect of complexation on the low critical solution temperature
(LCST) of a nonionic polymer, that is the minimum point at which phase separation will
invariably occur in a polymer solution. Hence, for a model study, we have chosen
hydroxypropyl cellulose (HPC) as a proton-accepting polymer and poly(acrylic acid)
(PAA) as a proton-donating polymer to study how the complexation between these two
polymers affect the LCST of the HPC polymer under various conditions.
HPC exhibits a lower critical solution temperature (LCST) at 41 0C, and remarkable
hydration-dehydration changes in aqueous solution in response to relatively small
changes in temperate around the LCST. 21 Below the LCST, the HPC chains hydrate to
form an expanded structure; above the LCST, the HPC chains dehydrate to form a
shrinken structure. This property is due to the reversible formation and cleavage of the
hydrogen bonds between the HPC and surrounding water molecules with changing
temperature. The swelling behavior of HPC bulk gels, microgels, as polymer chains
have been previously reported.22,23 It is well known that incorporating hydrophobic
comonomers leads to a lower LCST, and incorporating hydrophilic comonomers leads to
a higher LCST. The changes in LCST caused by incorporating comonomers are due to
changes in the overall hydrophilic properties of the polymer. This effect has been

8
investigated for another important thermally responsive polymer N-isopropylacrylamide
(NIPA).24
We will show that based on complexation between the HPC and the PAA, the LCST
of the HPC can be drastically changed. Studies of the structure and properties of
interpolymer complexes between poly(acrylic acid) and nonionic cellulose ethers have
been reported.25-28 Specifically, Budtova and coworkers29 investigated the formation and
properties of the interpolymer complexation between PAA and cellulose ethers
including hydroxyethylcellulose (HEC) and methylcellulose (MC). Their experimental
results showed that the mixtures of the cellulose ethers and non-ionized PAA in aqueous
solution formed interpolymer complexes due to hydrogen bonding. However, to our
knowledge, systematic studies of the phase transition behavior of the HPC/PAA
complex with change of pH have not been reported. In this chapter, the results of phase
transition behavior of HPC/PAA complex in water will be given, studied by turbidity
and dynamic laser light scattering measurements as functions of polymer concentration,
temperature, pH value, and macromolecular weight.
The complexation between the HPC and the PAA also leads to a new method for the
formation of surfactant-free PAA nanoparticles directly in aqueous media at room
temperature. Such nanoparticles have very narrow size distributions as characterized by
light scattering techniques, and can reversibly swell and shrink in response to external
stimuli such as pH. These nanoparticles may be used as building blocks for the
formation of nanoparticle networks30 or carriers for controlled drug delivery.
In Chapter 7, the main conclusions of this dissertation are summarized.

9
REFERENCES
(1) Pelton, R. Adv. Colloid Interf. Sci. 2000, 85, 1.
(2) Senff, H.; Richtering, W. J. Chem. Phys. 1999, 111, 1705.
(3) Kiser, P. F.; Wilson, G.; Needham, D.; Nature 1998, 394, 459.
(4) Pelton, R.H.; Chibanate, P. Colloids Surf. 1986, 120, 247.
(5) Weissman, J. M.; Sunkara, H. B.; Tse, A. S.; Asher, S. A. Science 1996, 274, 959.
(6) Liu, L.; Li, P.; Asher, S. A. Nature 1998, 397, 141.
(7) Chu, B. Laser Light Scattering, 2nd edition; Academic Press, 1991.
(8) Tanaka, T. Experimental Methods in Polymer Science; Academic Press, 2000.
(9) Kabra, B. G.; Gehrke, S. H.; Spontak, R. J. Macromolecules 1998, 31, 2166.
(10) Zhou, S; Chu, B. J. Phys. Chem. 1998, 102, 1364.
(11) Peppas, N. A.; Langer, R. Science 1994, 263, 1715.
(12) Tanaka, T. Phys. Rev. Lett. 1978, 40, 820.
(13) Chen, G.; Hoffman, A. S. Nature 1995, 373, 49.
(14) Osada, Y.; Gong, J. P. Adv. Mater. 1998, 10, 827.
(15) Hu, Z.; Zhang, X.; Li, Y. Science 1995, 269, 525.
(16) Xia, Y.; Gates, B.; Yin, Y.; Lu, Y. Adv. Mater. 2000, 12, 693; Xia, Y. Adv. Mater.
2001, 13, 369.
(17) Tshuchi, E; Abe, K. Adv. Polym. Sci. 1982, 45, 1.
(18) Jiang, M.; Li, M.; Xiang, M.; Zhou, H. Adv. Polym. Sci. 1998, 146, 121.
(19) Dan,Y.; Chen, S. Y.; Zhang, Y. F.; Xiang, F. R. J. Polym. Sci. Part B-Polym.
Phys. 2000, 38, 1069.

10
(20) Kaczmarek, H.; Szalla, A.; Kaminska, A. Polymer 2001, 42, 6057.
(21) Gao, J.; Haidar, G.; Lu, X. H.; Hu, Z. B. Macromolecules 2001, 34, 2242.
(22) Harsh, D.C.; Gehrke, S.H. J. Controlled Release 1991, 17, 175.
(23) Lu, X. H.; Hu, Z. B.; Gao, J. Macromolecules 2000, 33, 8698.
(24) Shibayama, M.; Ikkai, F.; Inamoto, S.; Nomura, S.; Han, C. C. J. Chem. Phys.1996,
105, 4358.
(25) Barkalow, D. G.; Richey, L. C.; Zuehlke, J. W. US 6303159.
(26) Nikolaeva, O.; Budtova, T.; Alexeev, V.; Frenkel, S. J. Polym. Sci.: Part B:
Polymer Physics 2000, 38, 1323.
(27) Nikolaeva, O. V.; Budtova, T. V.; Kalyuzhnaya, L. M.; Bel'nikevich, N. G.;
Vlasova, E. N.; Frenkel, S. Y. Polymer Science, Ser. A 1999, 41, 771.
(28) Doseva, V; Senkov, S.; Baranovsky, Y. V. Polymer 1997, 38, 1339.
(29) Staikos, G.; Bokias, G.; Macromol. Chem. 1991, 192, 2649.
(30) Hu, Z.; Lu, X.; Gao, J.; Wang, C. Advanced Materials 2000, 12, 1173.

11
CHAPTER 2
PRINCIPLE AND APPLICATION OF LASER LIGHT SCATTERING
2.1 Introduction
Laser light scattering (LLS) can be classified as elastic (no absorption) and inelastic
(absorption, e.g., fluorescence, phosphorescence, and Raman) light scattering. In
macromolecule and colloid science, laser light scattering normally refers to light
scattering of nonabsorbing macromolecules or colloidal particles. When a
monochromatic, coherent beam of light passes through a dilute macromolecular
solution, or a suspension of colloidal dispersion, and the refractive index of the solute
(macromolecules or colloidal particles) is different from that of the solvent, the incident
light can be scattered by each macromolecule or particle in all directions. This scattered
light contains information on the macromolecules or particles in solution, such as the
size, the molar mass, and the conformation of the macromolecules or particles. By
placing a detector ( e.g., a photon multiplier tube) at a distance and focusing it on a small
volume of scattered medium, you can obtain information about the macromolecules or
the colloidal particles in solution from two different measurements: measurement of the
time-average scattered intensity <I > of photon counts <n > and the fluctuation of I(t) or
n(t) with time. In polymer and colloid science, these two measurements are respectively
referred to as static ( elastic, i.e., no absorption) and dynamic (quasi-elastic) laser light
scattering (LLS).

12
If all the macromolecules or particles are stationary, the scattered light intensity at
each direction will be a constant, i.e., independent of time. In reality, all the scatterers in
solution are undergoing constant Brownian motion. This Brownian motion leads to a
fluctuation of the scattered intensity pattern. The fluctuation rate can be related to
different kinds of relaxation processes such as diffusion (transition and rotation) and
internal motions of the macromolecules. The faster the relaxation process, the faster the
intensity fluctuation may be.
The static LLS measures the time-average scattered intensity, whereas the dynamic
LLS measures the intensity fluctuation ( this is also where the word ‘dynamic’ comes
from). The dynamic LLS is essentially caused by the Doppler effect. When an incident
light is scattered by a moving macromolecule or particle, the frequency of the scattered
light will be slightly higher or lower than that of the incident light, depending on the
distance between the detected particle and the detector. Thus, for a macromolecule
solution or a colloid dispersion, the frequency distribution of the scattered light is
slightly broader than that of the incident light. This is why the dynamic LLS is also
called quasi-elastic light scattering (QELS). The frequency broadening (≈105-107 Hz) is
so small in comparison with the incident light frequency (≈1015 Hz), it is very difficult
to detect it in the frequency domain. However, it can be effectively recorded in the time
domain through a time correlation function. For this reason, dynamic light scattering is
sometimes referred to as photon correlation spectroscopy (PCS).
The static LLS is used in measuring time-average scattered intensity at different
angles and concentrations, from which three parameters of macromolecules, namely the

13
weight-average molecular weight (Mw), the z-average root-mean-square radius of
gyration (<Rg2>1/2 , simply Rg), and the second-order virial coefficient (A2) can be
obtained. The dynamic LLS is designed to measure the fluctuation of scattered
intensity. Translational diffusion coefficient (D), relaxation rate (Γ), hydrodynamic
radius can be obtained from dynamic LLS. In the last two decades, thanks to the
advance of laser technology, ultra-fast electronics and personal computers, LLS,
especially dynamic LLS, has evolved from a very special instrument for fundamental
research work to a routine analytical tool in polymer laboratories. It is even used as a
quality-control device in production lines. Commercially available LLS instruments are
normally capable of making both static and dynamic measurements simultaneously to
study colloidal particles or macromolecules in solutions, as well as in gels and viscous
media.
2.2 Static Laser Light Scattering1-2
In a real static LLS measurement of macromolecules or particles, two kinds of
interference must be considered. One is the inner interference arising from different
parts of a larger (dimension > λ/10) particle, whereas the intraparticle interference from
small particles (dimension < λ/10) may be neglected. The other is from the interparticle
interference between different particles. For dilute solutions, the interparticle
interference could be neglected.
The Rayleigh ratio is a very important factor in static LLS, defined as

14
( )120
2
−=IIrR
where I is the scattered intensity per unit scattering volume, I0 is the incident light
intensity, and r is the average distance between the scatterers and the observer. Thus,
the dimension of the Rayleigh ratio R is the reciprocal of the dimension of length. Based
on the electromagnetic principle and concentration fluctuation theory, we can get the
excess Rayleigh ratio of the dilute solution (Rexcess):2
)22(/
)(4 24
0
22
0
2
−∂Π∂
==C
kTCdCdnn
IrIR excess
excess λπ
Where Iexcess ( =Isolution-Isolvent ) is the net scattering intensity of the solute by subtracting
the intensity of solvent from that of the solution, and n, λ0, C, k, T, Π are the refractive
index of the solution, the wave length of the incident light, the concentration of the
solute, the Boltzmann constant, the absolute temperature, and the osmotic pressure,
respectively.
For dilute macromolecule or particle solutions, the change of osmotic pressure
induced by the change in concentration can be written3
)32()1( 20 −⋅⋅⋅++=Π CMAM
kTNC
Thus )42()21( 20 −⋅⋅⋅++=
∂Π∂ MA
MkTN
C
where N0, M, and A2 are the Avogadro’s number, the weight-average molecular weight,
and the second –order virial coefficient, respectively.

15
By substitution of equation (2-4) into equation (2-2), we can get the excess Rayleigh
ratio:
)52(21
)(4
2
2
04
0
22
−⋅⋅⋅++
=CMA
CMdCdn
NnRexcess λ
π
Rexcess is the net scattering intensity of the solute by subtracting the intensity of solvent
from that of the solution. By defining K= 4π2n2(dn/dC)2 / (N0λ04), we get
)62(212 −⋅⋅⋅++= CA
MRKC
where we have omitted the footnote “excess” in Rexcess. For larger macromolecules or
colloidal particles, a construction factor must be introduced. Here, P(θ) is defined as an
angular scattering function
)72(311
)0()()( 22 −><−== gRq
RRP θθ
where q=4πn sin(θ/2)/λ is the magnitude of the scattering vector, <Rg2> is the mean
square of the radius of gyration. Thus,
)82(2)(
1)( 2 −+= CA
MPRKC
θθ
when the concentration C→ 0,
R(θ) = KCMP(θ) = KCM [1-(1/3)q2<Rg2> + · · · ]
)92(]311[)( 22 −⋅⋅⋅+><−= zgw RqM
KCR θ
When q2<Rg2> << 1, omitting the higher order (>2) terms in series, we get
)102(2]311[1
)( 222 −+><+= CARq
MRKC
zgwθ
16
This is the basic equation of static LLS which is frequently shown in the literature.4-6
It should be noted that Equation (2-10) is valid under the restriction that the polymer
solution exhibits no adsorption, no fluorescence, and no depolarized scattering.
Naturally, the molar mass in the equation, ∑∑=i
iii
iw CMCM / , is the weight-average;
and the mean square radius of gyration, ii
ii
igiizg MCRMCR ∑∑=>< /2,
2 , is the z-
average. It can be seen that when R(θ) is measured at a series of C and q, we are able to
determine <Rg2>z from the slope of [KC/R(θ)]c→0 versus q2; A2 from the slope of
[KC/R(θ)]θ→0 versus C; and Mw from [KC/R(θ)]c→0, k→0. In practice, the Rayleigh ratio
is determined by a relative method; namely, by measuring the scattering intensity of a
standard solvent such as benzene or toluene, we can calculate the Rayleigh ratio of a
given solution by
)112()()(
)()()()(
tantan
−−
= γνν θ
θθθθdards
solvent
dards
solventsolutionovv n
nI
IIRR
The subscript “νν” means both the incident and the scattered light are vertically
polarized; I and n are, respectively, the time-averaged scattering intensity and the
refractive index. The term (nsolvent/nstandard)γ is a refraction correction for the scattering
volume and γ is a constant between 1 and 2, depending on the detection geometry of the
light scattering instrument, because we should compare the same scattering volumes
from the solution and the reference standard.

17
2.3 Dynamic Laser Light Scattering
Dynamic LLS can be used to study the properties of the motion of the particles.7,8
The motion of the particles includes transitional, rotational or internal motion. The
moving macromolecules or particles scatter the incident light passing through the
macromolecules or particles and result in two main effects: the fluctuation of the
scattered intensity and the broadening of the frequency distribution. In frequency
domain, the frequency shift of the scattered light is very difficult to precisely detect,
because the frequency broadening (≈105-107 Hz) is much smaller than the incident light
frequency (≈1015 Hz). However, in the time domain, the fluctuation of the scattered
intensity is closely related to the frequency broadening and can be detected if the
detector is sensitive enough and has a fast responsive time. It is equally efficient to
have either the fluctuation of the scattered intensity or the frequency broadening because
the two effects are related to each other. For an extremely dilute macromolecular or
colloidal particle system, we don’t consider the fluctuation of scattered intensity caused
by the change in the number of the macromolecules or colloidal particles. The most
commonly used method in quasi-elastic light scattering ( QELS) is the digital technique
of photon correction spectroscopy ( or optical mixing ) which measures the intensity
fluctuation of the scattered light in the time domain. There are two basic forms of the
optical mixing: heterodyne and homodyne (self-beating). Heterodyne mixing is the
mixture of the scattered light with a reference beam (local oscillator) unshifted in
frequency from the incident light beam. In self-beating optical mixing the scattered
18
wave is not mixed with a reference signal but directly detected. We will describe only
the self-beating intensity-intensity time correction spectroscopy. It is worth to
mentioning that averaging the detected intensity in dynamic LLS with time is the same
as static LLS.
The Siegert relation is an important equation in dynamic LLS. When the scattered
field is a Gaussian process, the correlation functions g(1)(t) and g(2)(t) are connected
through the Siegert relation2
g(2)(t) = 1 + | g(1)(t) |2 ( 2-12)
where g(1)(t) ≡ [<E(0)E*(t)> / <E(0)E*(0)>] and g(2)(t) ≡ [<I(0)I(t)> / <I(0)>2] are the
normalized field-field and normalized intensity-intensity autocorrelation functions,
respectively. Thus, the intensity-intensity time autocorrelation function becomes
G(2)(t) = <I(0)I(t)> = <I(0)>2g(2)(t) = <I(0)>2 [1 + | g(1)(t) |2] ( 2-13 )
The significance of introducing g(2)(t) and G(2)(t) lies in that G(2)(t) and <I(0)> can be
measured experimentally. In practice, the detection area can not be zero. Therefore, the
scattered light can’t be purely coherent and an instrument parameter, β (<1), is
introduced in equation (2-14)
G(2)(t) = A [1 + β | g(1)(t) |2] ( 2-14 )
where A(≡<I(0)>2 ) , t, and β are the measured baseline, the delay time, and the
parameter depending on the coherence of the detection optics, respectively, and I(t) is
the scattered intensity, or photon counts, at time t, which includes contributions from
both the solvent and the solute. Therefore,
G(2)(t) = <I(0)I(t)> = < [I solvent (0) + I solute(0)][I solvent (t) + I solute(t)]>

19
and equation (2-12) becomes
)152(|])(||)(|[1{)([ 2)1()1()2( −++= tgII
tgII
AtG solutesolution
solutesolvent
solution
solventβ
where all the cross terms disappear since the light scattered by solvent molecules and
solute particles are not correlated. It should be noted that )(| )1( tgsolvent | decays much faster
than )(| )1( tgsolute | because small solvent molecules diffuse faster than particles do. Thus,
after a very short delay time, equation (2-13) becomes1
)162(]||1[]|)(|)(1[)( 2)1(2)1(2(2( −+=+= soluteappsolutesolution
solute gAtgII
AtG ββ
where βapp = β(I solute / I solution)2. For a dilute solution, the scattered intensity from
solvent molecules could become appreciable, i.e., I solute ≤ I solution, so that the apparent
coherence βapp would be even lower, i.e., G(2)(0) appears to have a lower value than
expected. We should be aware of this situation, especially for the weakly scattered,
dilute, and low molar mass polymer solutions. For example, if I solute = I solvent, βapp=
β/4. It should be noted that β is constant for each particular optical geometry of the
scattering instrument. In fact, I solute can be estimated from βapp ( certainly I solute can be
measured in static LLS by comparing the scattered intensity of solution and solvent. ) if
the values of β at different scattering angles have been pre-calibrated with a narrowly
distributed latex standard whose scattering intensity is much stronger than water
(solvent).
Now we will see how to get the information about the motion of the particles from
the measured intensity-intensity time correlation function G(2)(t). Generally, the

20
relaxation of |g(1) (t)| includes both diffusion (translation and rotation) and internal
motions. Let us only consider the translational diffusion relaxation of the particles. For
monodisperse, spherical scatterers, |g(1) (t)| is theoretically represented as an exponential
decay function:
|g(1) (t)| = G e-Γ t (2-17)
where G and Γ are the factor of proportionality and the line-width, respectively and
Γ-1= τc, the characteristic decay time representing the rate of dynamic relaxation in self-
beating. For a polydisperse polymer sample with a continuous distribution of molar
mass M, equation (2-17) may be generalized as
)182()()(|0
)1( −ΓΓ= Γ−∞
∫ deGtg t
where G(Γ) is called the line-width distribution and G(Γ)dΓ is the statistic weight of the
particles or macromolecules which possess line-width Γ . By using a Laplace inversion
program, CONTIN,10,11 the normalized distribution function of the characteristic line
width G(Γ) was obtained. For a dilute solution, Γ measured at a finite scattering angle is
related to C and q by
)192()1)(1( 222 −><++=Γ
zgd RfqCkDq
where D is the transitional diffusion coefficient of the solute molecule at C → 0, kd is
the diffusion second virial coefficient, and f is a dimensionless parameter depending on
polymer chain structure and solvent ( For polymers with flexible chains in a good
solvent, f is between 0.1 and 0.2). Hence, for small C and q, D ≈ Γ/q2. It should be
noted that by the definition of |g(1) (t)|, G(D) = q2G(Γ), the translational diffusion

21
coefficient distribution, is an intensity distribution. And, since |g(1) (t)| approaches unity
as t→0, we have
1)()()0()0(
)0()0()0(|0 0*
*)1( ==ΓΓ=
><>→<=→ ∫ ∫
∞ ∞dDDGdG
EEtEEtg
Here, the average diffusion coefficient <D> is defined as
)202()(0
−>=< ∫∞
DdDDGD
Further, the transitional diffusion coefficient D may be related to the molecular friction
factor f through the Stokes-Einstein relation
D = kBT / f ( 2-21 )
where kB and T are the Boltzmann constant and the absolute temperature, respectively.
For a hard sphere with a radius of R, f = 6πηR, where η is the viscosity of the solvent.
For a polymer coil, R is replaced by its hydrodynamic radius Rh, so that
)222(6
−=D
TkR Bh πη
In dynamic light scattering, translational motion of macromolecules or particles
within size range of 1-1,000 nm can be measured. The characteristic time (τc) of
dynamic relaxation in self-beating, which includes transitional , rotational, and internal
motion, could very from seconds to tens of nanoseconds.
Dynamic LLS plays a very important role in particle sizing. 4-6, 9 In a dilute
dispersion, if the colloidal particles are spherical, or in other words, in the absence of
rotational and internal motions, G(Γ) can be converted to the hydrodynamic size
distribution f(Rh). All the parameters in the conversion are either well-known constants

22
or precisely measurable by the other methods. Therefore, particle sizing based on
dynamic LLS can be considered as an absolute method without calibration. This is why
dynamic LLS is so successful in particle sizing and many commercial instruments have
been developed using the dynamic LLS principle.
2.4 LLS Instrumentation
A commercial laser light scattering (LLS) spectrometer (ALV/DLS/SLS-5000)
equipped with an ALV-5000 digital time correlator was used with a Helium-Neon laser
(Uniphase 1145P, output power of 22mW and wavelength of 632.8 nm) as the light
source (Figure 2.1). The incident light was vertically polarized with respect to the
scattering plane and the light intensity was regulated with a beam attenuator (Newport
M-925B). The scattered light was transmitted through a very thin(~ 40 µm in diameter)
optical fiber leading to an active, quenched, avalanche photo diode (APD) as the
detector. As a result, the coherent factor β in dynamic laser light scattering was about
0.98. The avalanche photo diode has a sensitivity 2 orders higher than that of a normal
photon multiplier (PM) tube, while its dark count increases no more than 10 times.
Thus, a 22-mW laser could have a measured count rate similar to a 400 mW laser for a
normal PM tube. For DLS experiments in this dissertation, the standard deviation of
every measurement of hydrodynamic radius (Rh) can be automatically calculated and is
below 1%. The schematic setup of the LLS is given in Figure 2.2.

23
Figure 2.1 A commercial ALV/DLS/SLS-5000 laser light scattering (LLS).

24
Figure 2.2 Schematic Setup of the Laser Light Scattering Instrument

25
REFERENCES
(1) Tanaka, T. Experimental Methods in Polymer Science; Academic Press, 2000.
(2) Chu, B. Laser Light Scattering, 2nd edition; Academic Press, 1991.
(3) Allcock, H. R.; Lampe, F. W. Contemporary Polymer Chemistry, 2nd edition;
Prentice-Hall, Ins.: New Jersey, 1990.
(4) Lu, X.; Hu, Z.; Gao, J. Macromolecules 2000, 33, 8698.
(5) Wu, C.; Chan, K. K.; Xia, K. Q. Macromolecules 1995, 28, 1032.
(6) Zhang, G.; Wu, C. J. Am. Chem. Soc. 2001, 123, 1376.
(7) Berne, B. J.; Pecora, R. Dynamic Light Scattering; John Wiley & Sons, Inc: New
York, 1976.
(8) Brown, W. Dynamic Light Scattering; Oxford University Press: Oxford, 1993.
(9) Gao, J.; Haidar, G.; Lu, X. H.; Hu, Z. B. Macromolecules 2001, 34, 2242.
(10) Provencher, S. W. Biophys. J. 1976, 16, 29.
(11) Provencher S. W. Makromol. Chem. 1979, 180, 201.

26
CHAPTER 3
SYNTHESIS AND LIGHT SCATTERING STUDY OF HYDROXYPROPYL
CELLULOSE MICROGELS1
3.1 INTRODUCTION
Microgels are crosslinked colloidal particles that can swell by the absorption of many
times their weight of solvent and exhibit a behavior ranging from that of polymer
solutions to that of hard spheres.2-5 Treating a dispersion of identical colloidal particles
as a one-component assembly of superatoms dispersed in a continuous background,
microgel systems lead to the fundamental study of modeling the transition from liquid to
crystal and from the supercooled liquid to the glassy state of atomic fluids.5 From
application point of view, the microgel particles can respond to environmental change
much faster than bulk gels due to the much smaller size of the particles.6 Unusual
properties of microgels lead to various applications, including automotive surface
coatings,7 printing,8 and controlled drug delivery.9,10
Many methods have been developed for preparing microgels, including emulsion
polymerization,11 inverse microemulsion polymerization,12 anionic
copolymerization,13and crosslinking of neighboring polymer chains.14 Currently,
thermally-responsive microgels as represented by N-isopropylacrylamide (NIPA), have
attracted great attention due to their scientific importance and technological
applications.2 The important applications of NIPA include controlled drug release,
27
biosensor, and tissue engineering. The NIPA microgel was first synthesized by Pelton
and Chibante in 1986.11 In their study, the pre-gel solution of the NIPA monomer was
heated above the lower critical solution temperature (LCST) of the NIPA polymer
solution. The polymerization of the NIPA monomers and crosslinking polymer chains
occurred simultaneously at the reaction temperatures above the LCST. Narrowly
distributed NIPA microgel particles were obtained with their swelling properties similar
to those of the bulk NIPA gel.15
In this chapter, we report synthesis and study of another important thermally
responsive microgel -- hydroxypropyl cellulose (HPC). Bulk HPC hydrogel, including
the homogeneous gel and the porous gel have been extensively studied before.16,17 The
HPC gel collapses and shrinks above the volume phase transition temperature Tc (~
43°C), but swells and expands below Tc. In contrast to most synthetic gels that are made
from carcinogenic or teratogenic monomers, the HPC gels, comprising natural cellulose
ether macromolecules, have been approved by the United State Food and Drug
Administration (FDA) and thus have significant practical advantages over the synthetic
gels.17 The chemical structure of the HPC is shown in Figure 3.118
To our knowledge, however, synthesis of HPC microgels has not been reported. In
contrast to previous work on the NIPA microgel that started from NIPA monomers, we
demonstrated a process whereby HPC chains in a surfactant solution were heated above
the LCST to give colloidal particles that were then crosslinked to form microgel particles.
In this paper, our results will be divided into two parts. The first is to discuss synthesis of
HPC microgels that involved fundamental interaction between high molecular weight

28
polymer chains and surfactant. The second is to discuss swelling properties and the
volume phase transition of HPC microgel particles as a function of temperature,
crosslinker concentration and quality of solvent. Light scattering techniques have been
used for both monitoring microgel formation and characterizing the microgel particles.
Such techniques have been widely used to study various microgels.19,20
Figure 3.1. The chemical structure of the HPC polymer.
3.2 EXPERIMENTAL
Materials Dry hydroxypropyl cellulose(HPC) powder (average Mw =1x10⁶),
dodecyltrimethylammonium bromide (DTAB), divinyl sulfone (DVS), sodium hydroxide
(NaOH) pellets and sodium chloride (NaCl) were purchased from Aldrich Chemical
Company. The substitution level of the HPC polymer for this study was MS=3.9, where
MS is the average number of molecules of propylene oxide combined per anhydroglucose
unit. Deionized and distilled water was used throughout.
O
OCH 2CHCH 3
OH
H
H
H
HO
CH2
O
H HH
H
H
OH H
O
OCH2CHCH 3
OH
OCH2CHCH 3
OH
OCH 2CHCH 3
OH
OCH2CHCH 3
OH
CH2
29
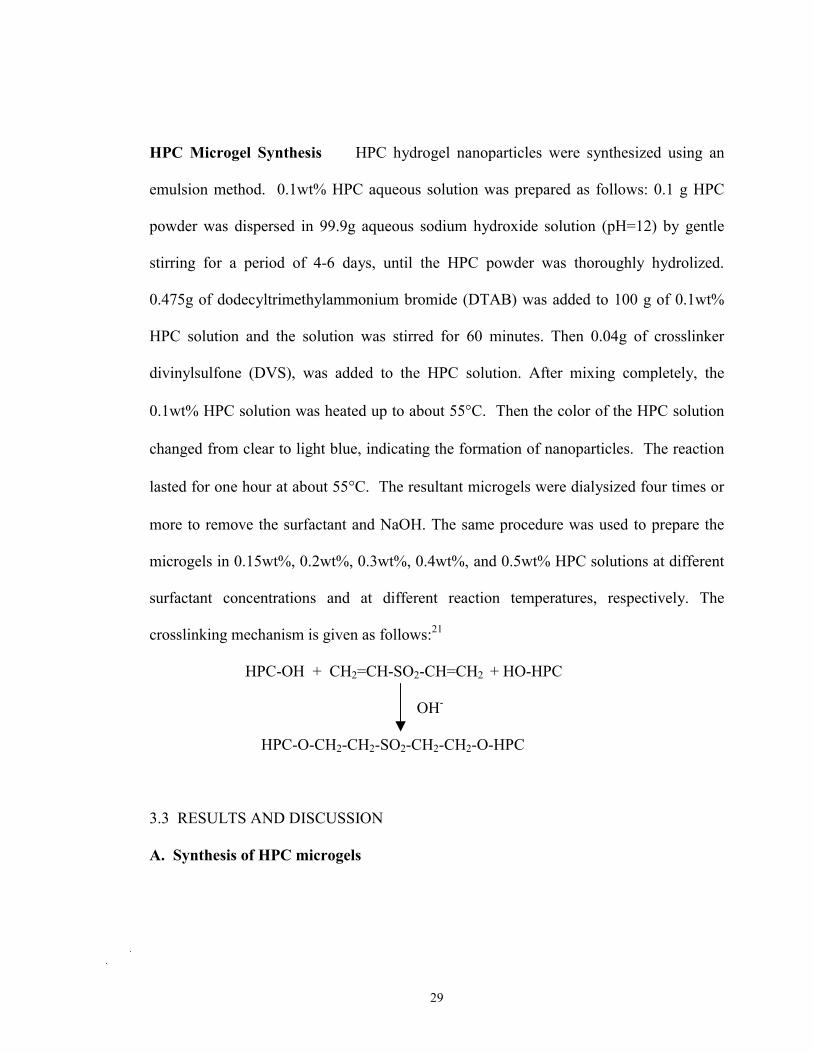
HPC Microgel Synthesis HPC hydrogel nanoparticles were synthesized using an
emulsion method. 0.1wt% HPC aqueous solution was prepared as follows: 0.1 g HPC
powder was dispersed in 99.9g aqueous sodium hydroxide solution (pH=12) by gentle
stirring for a period of 4-6 days, until the HPC powder was thoroughly hydrolized.
0.475g of dodecyltrimethylammonium bromide (DTAB) was added to 100 g of 0.1wt%
HPC solution and the solution was stirred for 60 minutes. Then 0.04g of crosslinker
divinylsulfone (DVS), was added to the HPC solution. After mixing completely, the
0.1wt% HPC solution was heated up to about 55°C. Then the color of the HPC solution
changed from clear to light blue, indicating the formation of nanoparticles. The reaction
lasted for one hour at about 55°C. The resultant microgels were dialysized four times or
more to remove the surfactant and NaOH. The same procedure was used to prepare the
microgels in 0.15wt%, 0.2wt%, 0.3wt%, 0.4wt%, and 0.5wt% HPC solutions at different
surfactant concentrations and at different reaction temperatures, respectively. The
crosslinking mechanism is given as follows:21
HPC-OH + CH2=CH-SO2-CH=CH2 + HO-HPC
OH-
HPC-O-CH2-CH2-SO2-CH2-CH2-O-HPC
3.3 RESULTS AND DISCUSSION
A. Synthesis of HPC microgels

30
Table 3.1. Synthesis Condition, Average Radii <Rh>, and Polydispersity Index
)/(2
2 Γµ of HPC Microgels 0.1 wt %HPC DTAB DVS reaction T reaction time colloidally <Rh>
22 / Γµ
(ml) (cmc*) ( g) (LCST, oC) (h) stable (nm) 100 1.0 0.04 55 1 yes 182 0.308 100 1.0 0.04 61 1 yes 179 0.204 100 1.0 0.04 64 1 yes 179 0.178
Note: The reaction occurred at the lower critical solution temperature (LCST) of 0.1 wt
% HPC at various surfactant DTAB concentration. The cmc* is the critical micelle
concentration, 1.54 ×10⁻² mol/L, of surfactant DTAB in pure water at 250C.
The LCST of the 0.1wt% HPC solution increases with surfactant concentration as
shown in Table 3.1. It is known that the pure HPC is more soluble in water at the
temperatures below LCST (∼41°C) than it is at the temperatures above the LCST.16 This
phase transition phenomenon may be explained by assuming that there are a number of
equilibrium bond configurations for the propylene oxide moiety.22-24 Each propylene
oxide moiety in HPC comprises two C-O bonds and two C-C bonds. At low temperatures
in polar solvents, oxygen atoms preferentially maintain a gauche orientation about the C-
C bonds and a trans-configuration about the C-O bonds.22-24 This particular bond
conformation has a relatively large dipole moment. If the temperature is increased, or the
solvating environment becomes less polar, then bond conformations that have a lower

31
dipolar moment may become more favorable. The dipole moment of the propylene oxide
moieties may be reduced to such an extent that phase separation occurs.22-24
After introducing the cationic surfactant DTAB into nonionic HPC polymer in water,
surfactant molecules self-assemble on the polymer chains, forming aggregates when a
critical aggregation concentration is reached.25 These aggregates are smaller in size than
micelles. As more surfactant molecules accumulate on the HPC linear polymer, the
micelles eventually form. When the surfactant concentration exceeds the CMC, which is
the critical micelle concentration (1.54 × 10⁻² mol/l) of DTAB in pure water at 25 oC, 26
the number of absorbed surfactant aggregates increases. The polymer chains attached
with surfactant micelles become more hydrophilic due to the inter-aggregate electrostatic
repulsion. As a result, the LCST of the HPC dispersion increases with surfactant
concentration.
It is found that HPC polymer chains in a water-surfactant solution can collapse into
colloidal particles at the LCST for DTAB surfactant concentrations ranging from 1 CMC
to 1.5 CMC. Below 1 CMC, only very large particles (∼10 µm) were observed. The
collapsed polymer chains were stabilized by the charges on the surfactant micelles that
are attached on the polymer chains. The collapsed HPC polymer chains in each colloid
were chemically crosslinked by divinyl sulfone, and formed microgel particles.

32
102 1030.0
0.5
1.0
1.5f z(R
h) (10
-2)
Rh (nm)
1.0CMC1.2CMC1.5CMC
Figure 3.2. Hydrodynamic radius distributions (f(Rh)) of HPC microgel particles
(C=8.94×10⁻⁶ g/ml) in deionized water at 25oC. These particles were prepared in 0.1wt%
HPC solution at various DTAB concentrations. Here the CMC is the critical micelle
concentration of DTAB in pure water at 25°C and equals to 1.54 x 10⁻² mol/l.
Figure 3.2 shows hydrodynamic radius distributions (f(Rh)) of HPC microgels
(C=8.94×10⁻⁶ g/ml) in deionized water at 25oC. These particles were prepared in 0.1wt%
HPC solution with various DTAB concentrations at the LCST that corresponds to each
DTAB concentration. In the surfactant concentration range studied, the average radii
<Rh> of the microgels were about the same. However, the radius distribution f(Rh)
33
becomes narrower with increasing surfactant concentration. This phenomenon could be
due to the formation of more micelles in higher surfactant concentrations. The more
charged micelles, the stronger electrostatic repulsion. This helps to stabilize the colloidal
dispersion and make the particle size distribution narrower.
We also studied microgel formation as a function of HPC polymer concentration. In
this experiment, the HPC concentration varied from 0.1 wt% to 0.3 wt%, while the
DTAB concentration and the reaction temperature were fixed at 1 CMC and 55oC,
respectively. Figure 3.3 shows hydrodynamic radius distributions (f(Rh)) of HPC
microgel particles (C= 8.94×10⁻⁶ g/ml) in de-ionized water at 25 oC. The average radius
< Rh> of the microgels becomes larger and its distribution becomes broader with the
increase of HPC concentration. This result may be explained in terms of interaction of
surfactant DTAB with HPC. As the HPC concentration increases, the average number of
absorbed surfactant aggregates on each HPC polymer chain should decrease, reducing the
inter-aggregate electrostatic repulsion force. This causes HPC linear chains to become
more aggregated at higher HPC concentration. Thus, the average radius <Rh> of the
nanoparticles increases and its distribution becomes broader.
The reaction temperature plays an important role for the formation of the HPC
microgel particles. Figure 3.4a shows hydrodynamic radius distributions (f(Rh)) of HPC
microgel particles (C= 8.94×10⁻⁶ g/ml) in de-ionized water at 25oC. These particles were

34
102 1030.0
2.5
5.0
0.1wt% 0.15wt% 0.3wt%
f z(Rh) (
10-3)
Rh(nm)
Figure 3.3. Hydrodynamic radius distributions (f(Rh)) of HPC microgel particles
(C=8.94×10⁻⁶ g/ml) in deionized water at 25oC. These particles were prepared with
various HPC concentrations at 1 CMC DTAB and at the reaction temperature 550C.
made at various reaction temperatures in 0.1wt% HPC solution and at 1 CMC DTAB
concentration. The reaction temperature at which microgels formed is in a small range
within about three degrees above the LCST, which is 55 °C for this dispersion. At each
reaction temperature, experiments were repeated at least three times. The size distribution
and average size of the HPC microgels are repeatable as shown in Figure 3.4b. Here,
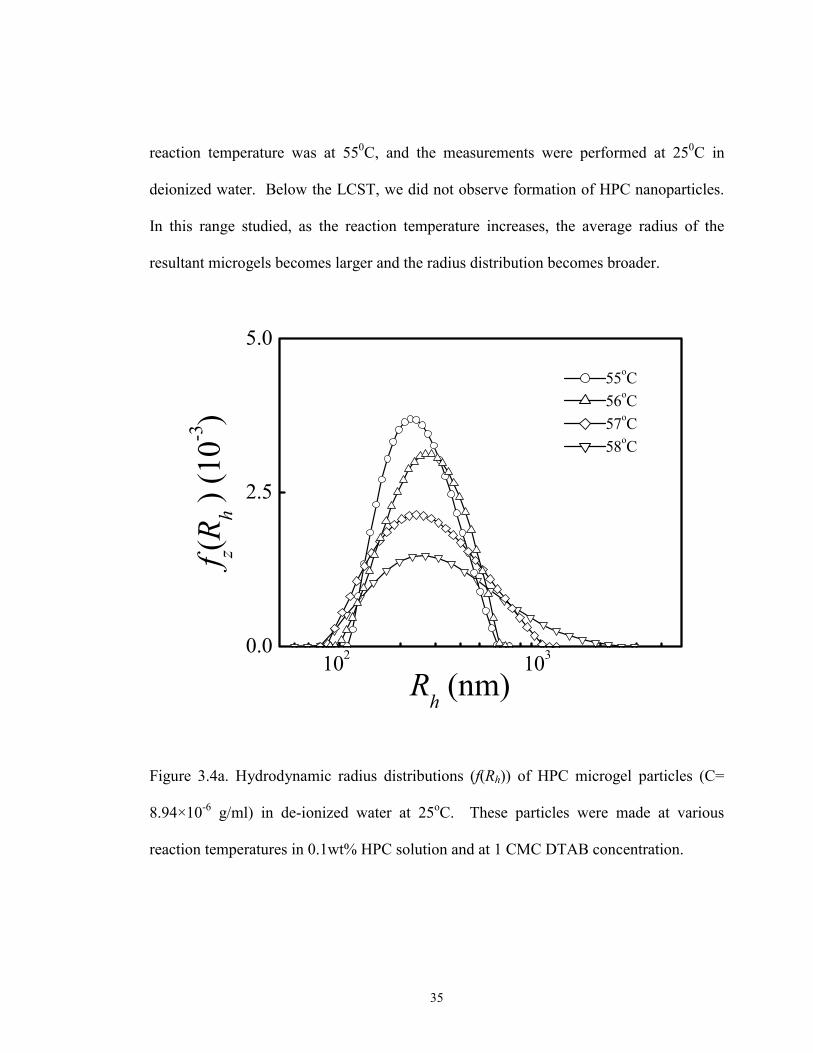
35
reaction temperature was at 550C, and the measurements were performed at 250C in
deionized water. Below the LCST, we did not observe formation of HPC nanoparticles.
In this range studied, as the reaction temperature increases, the average radius of the
resultant microgels becomes larger and the radius distribution becomes broader.
102 1030.0
2.5
5.0
f z(Rh )
(10-3
)
55oC56oC57oC58oC
Rh (nm)
Figure 3.4a. Hydrodynamic radius distributions (f(Rh)) of HPC microgel particles (C=
8.94×10⁻⁶ g/ml) in de-ionized water at 25oC. These particles were made at various
reaction temperatures in 0.1wt% HPC solution and at 1 CMC DTAB concentration.

36
102 1030.0
2.5
5.0f z(R
h ) (1
0-3)
Rh (nm)
Figure 3.4b. Hydrodynamic radius distributions (f(Rh)) of HPC microgel particles (C=
8.94×10⁻⁶ g/ml) in de-ionized water at 25oC. These particles were made at 550C reaction
temperature in 0.1wt% HPC solution and at 1 CMC DTAB concentration.
The reaction temperature-dependent size of the microgels is related to the HPC
hydrophobicity and the interaction of surfactant with the HPC. As the reaction
temperature just reached LCST, the aggregated HPC chains can form stable nanoparticles
due to inter-micelle electrostatic repulsion. With the increase of reaction temperature
above the LCST, the driving force for polymer-polymer aggregation increases. On the

37
other hand, the inter-particle electrostatic repulsion increases as particle size increases. As
a result, more HPC chains aggregate to form larger particles until the new equilibrium
between the hydrophobic interaction and inter-micelle electrostatic repulsion is reached.
B. Characterization of HPC microgels The swelling properties of HPC microgels were
characterized using light scattering techniques after exhaustive dialysis to wash out
surfactant and residual chemicals. The HPC microgels undergo a volume phase
transition in water from a swollen state to a collapsed state as the temperature increases.
The driving forces for the thermal-sensitive volume phase transition were considered to
be a balance between the hydrophilic and hydrophobic interactions of inter- and intra-
polymer chains.
We first discuss the volume phase transition of HPC microgels at various crosslinker
concentrations. The volume phase transition temperature, Tc, is defined as the one that
causes the sharpest rate of the change in gel volume. The average hydrodynamic radius
plotted as a function of temperature is shown in Figure 3.5a. The volume phase transition
temperature (Tc) was determined by taking a derivative of the Rh verse T curve. The peak
location corresponds to Tc . As an example shown in Fig. 3.5 b, the volume phase
transition temperature of the HPC microgels with 10 wt% crosslinking density is 410C.
Although up to 20 wt% of crosslinker, relative to the HPC, is used during synthesis,
solubility properties of the linear HPC polymer are expected to dominate the gel swelling
behavior. The average molar mass of the segment between two neighboring crosslinking
points, M c, is inversely proportional to the crosslinking concentration. As a result, the
38
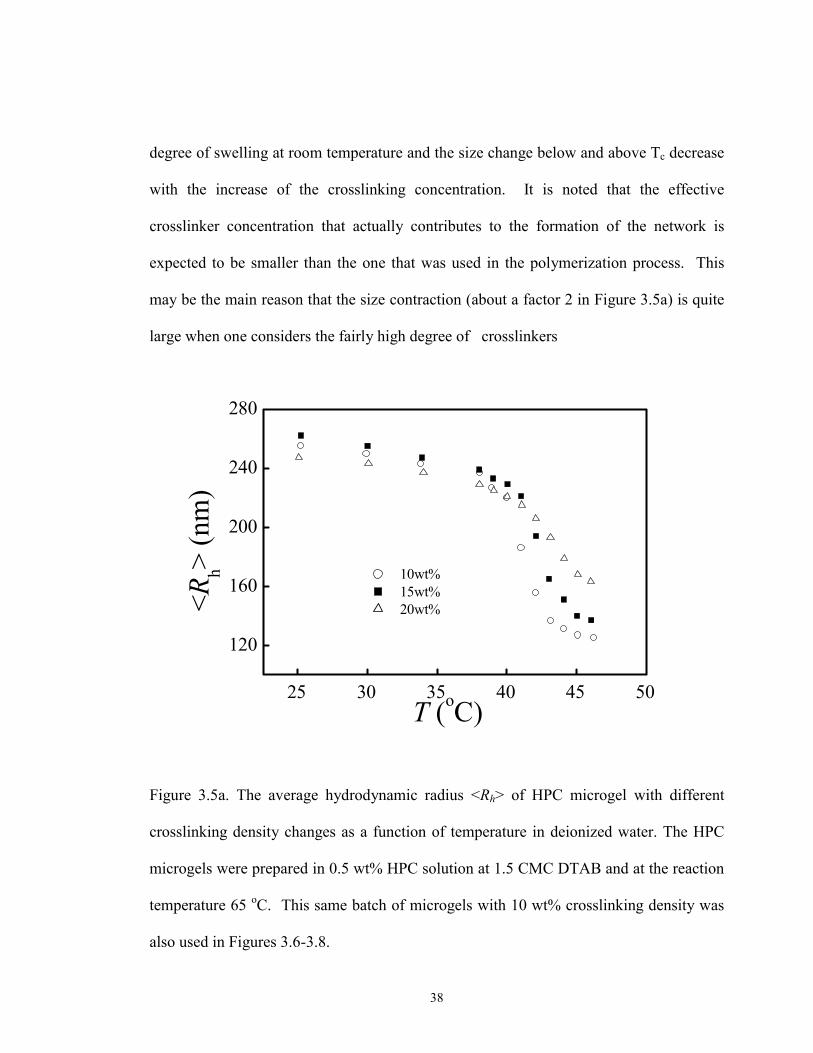
degree of swelling at room temperature and the size change below and above Tc decrease
with the increase of the crosslinking concentration. It is noted that the effective
crosslinker concentration that actually contributes to the formation of the network is
expected to be smaller than the one that was used in the polymerization process. This
may be the main reason that the size contraction (about a factor 2 in Figure 3.5a) is quite
large when one considers the fairly high degree of crosslinkers
25 30 35 40 45 50
120
160
200
240
280
10wt% 15wt% 20wt%<R
h> (n
m)
T (oC)
Figure 3.5a. The average hydrodynamic radius <Rh> of HPC microgel with different
crosslinking density changes as a function of temperature in deionized water. The HPC
microgels were prepared in 0.5 wt% HPC solution at 1.5 CMC DTAB and at the reaction
temperature 65 oC. This same batch of microgels with 10 wt% crosslinking density was
also used in Figures 3.6-3.8.
39
25 30 35 40 45 50-35
-30
-25
-20
-15
-10
-5
0
d<R
h>/d
T
T / 0C
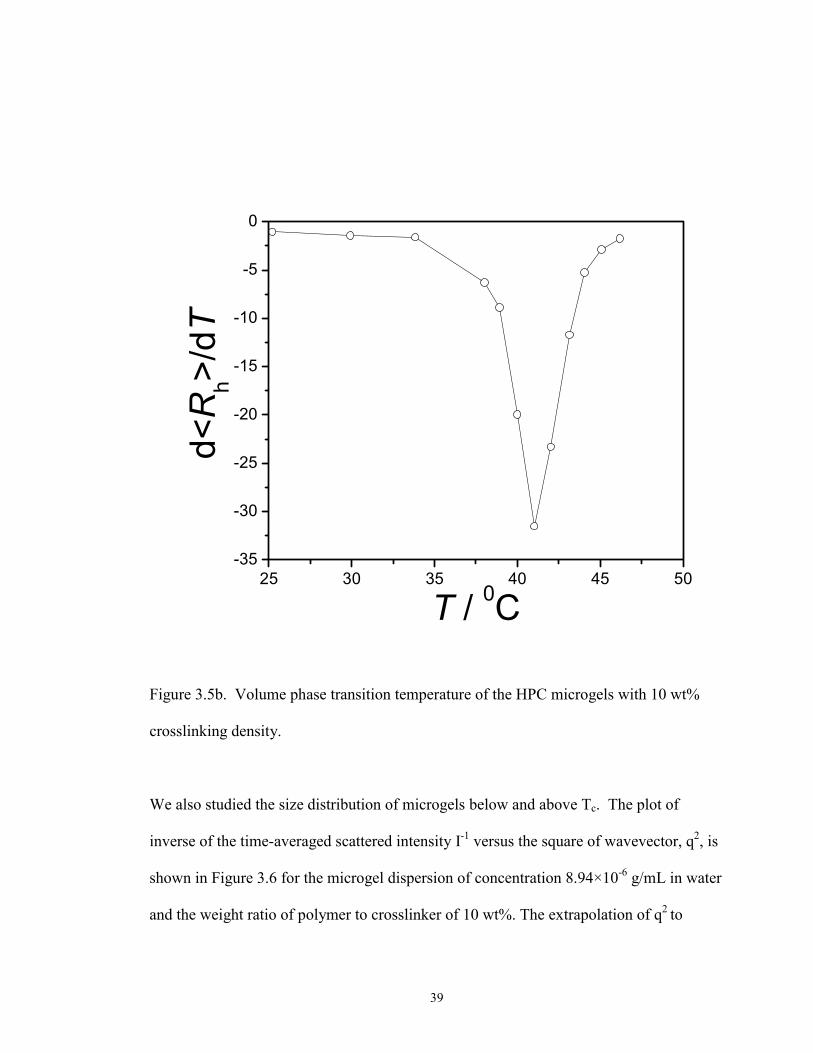
Figure 3.5b. Volume phase transition temperature of the HPC microgels with 10 wt%
crosslinking density.
We also studied the size distribution of microgels below and above Tc. The plot of
inverse of the time-averaged scattered intensity I-1 versus the square of wavevector, q2, is
shown in Figure 3.6 for the microgel dispersion of concentration 8.94×10⁻⁶ g/mL in water
and the weight ratio of polymer to crosslinker of 10 wt%. The extrapolation of q2 to

40
0 1 20
1
2I -1
(10-2
kH
z-1)
q2 (10-4nm-2)
25oC44oC
Figure 3.6. Inverse of time-averaged scattered intensity I-1 vs the wave vector square (q2)
of HPC microgel particles in de-ionized water at 25 oC and at 44 oC, respectively. The
solid lines are the least square-fit to the data.
q→ 0 led to the same intercept at θ=0. This indicates that the microgels are still stable at
44 0C, which is above Tc. It is noted that the HPC microgels have no electric charge on
the surface, in contrast to the NIPA microgels. Although the NIPA polymer does not
have charge, the NIPA microgel particles have charge, which are sulfate and carboxyl
groups that originate from the ionic free radical polymerization initiator.1 Thus,

41
stabilization of the HPC microgels at T> Tc is different from that of the NIPA microgels.
The stability of the HPC microgel particles could be due to the steric interactions between
these particles. The steric interaction produces the energy barrier to prevent microgels
from aggregation at temperatures higher than Tc.27
Figure 3.7 shows the intensity auto-correlation functions and corresponding
hydrodynamic radius distributions (f(Rh)) of the HPC microgels of concentration of
8.94×10⁻⁶ g/mL in de-ionized water at 25 oC and 44 oC, respectively. At 25 oC, the size
distribution is very broad. This may be attributed to the relative broad length distribution
of the tangling HPC chains on the particle surface. Since the crosslinking was directly
performed on the long polymer chains that have an average molecular weight of about
1,000,000 , the variation of the length of the surface tangling chains could be quite large.
As the microgels were heated above Tc, the loose surface tangling chains collapse,
resulting in narrower particle size distribution.
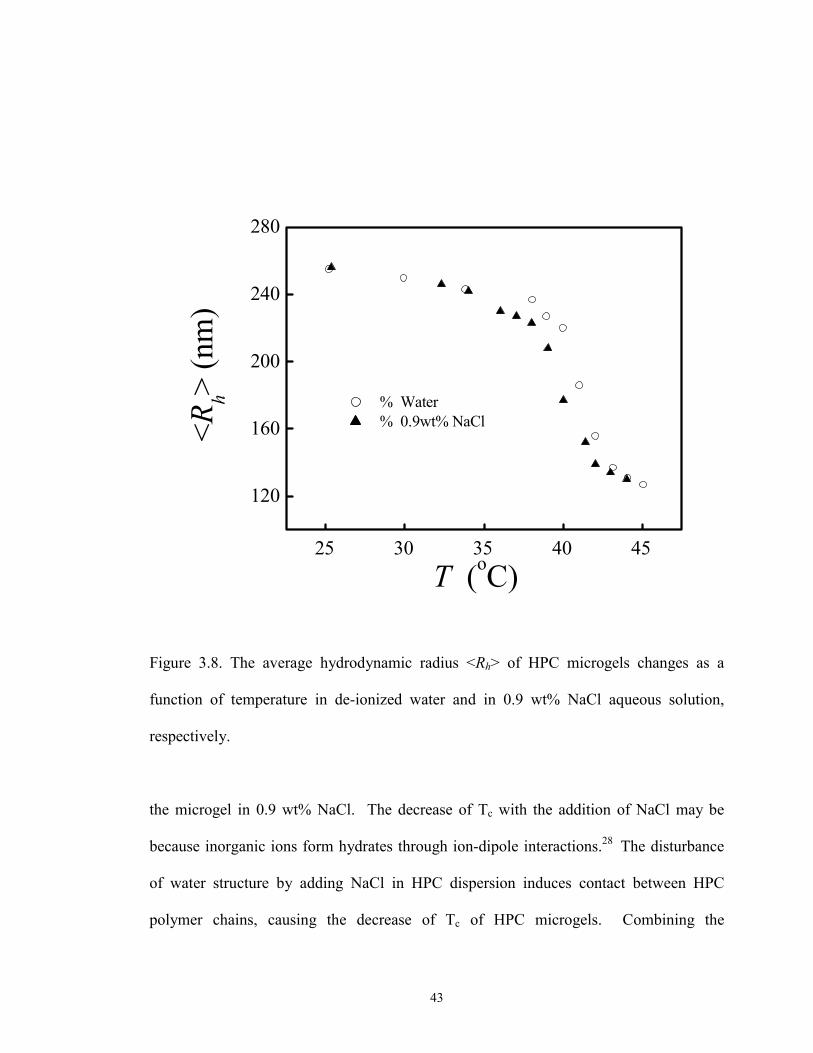
The salt effect on the phase transition temperature of a dilute HPC microgel
dispersion was also investigated. Figure 3.8 shows the average hydrodynamic radius
<Rh> as a function of temperature for HPC microgel particles(C= 8.94×10⁻⁶ g/ml ) in
water and in 0.9 wt% NaCl solution (0.15mol.l-1, physiological ionic strength),
respectively. Tc is about 41 oC for the microgels in pure water, while it is about 39 oC for

42
0 1 2 3 4 50.01
0.1
1
(a)
25 oC 44 oC
log
(G(2
) -1)
τ (ms)
102 1030.0
3.5
7.0
(b)
25oC44oC
f z(Rh )
/ 10-2
Rh / nm
Figure 3.7. (a) Intensity autocorrelation functions of the HPC microgel in de-ionized
water at 25 oC and 44 oC, respectively. (b) Corresponding hydrodynamic radius
distributions (f(Rh)) of the samples.
43
25 30 35 40 45
120
160
200
240
280
T (oC)
<Rh>
(nm
)
% Water % 0.9wt% NaCl
Figure 3.8. The average hydrodynamic radius <Rh> of HPC microgels changes as a
function of temperature in de-ionized water and in 0.9 wt% NaCl aqueous solution,
respectively.
the microgel in 0.9 wt% NaCl. The decrease of Tc with the addition of NaCl may be
because inorganic ions form hydrates through ion-dipole interactions.28 The disturbance
of water structure by adding NaCl in HPC dispersion induces contact between HPC
polymer chains, causing the decrease of Tc of HPC microgels. Combining the
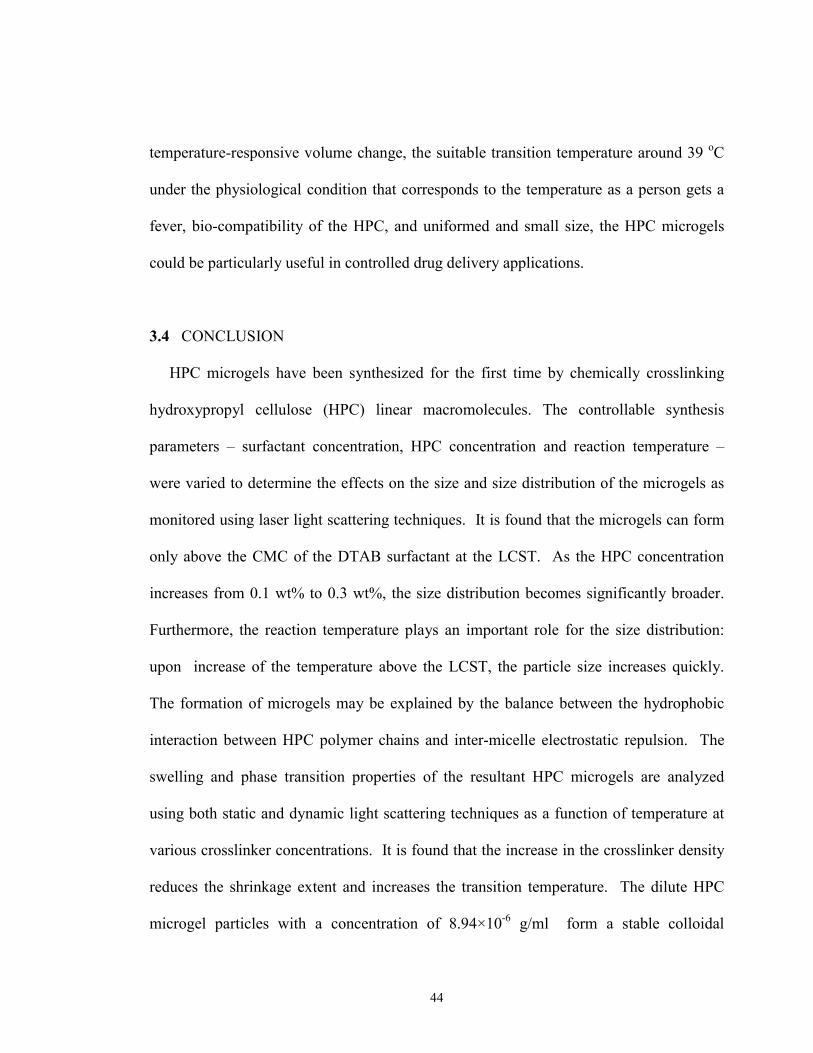
44
temperature-responsive volume change, the suitable transition temperature around 39 oC
under the physiological condition that corresponds to the temperature as a person gets a
fever, bio-compatibility of the HPC, and uniformed and small size, the HPC microgels
could be particularly useful in controlled drug delivery applications.
3.4 CONCLUSION
HPC microgels have been synthesized for the first time by chemically crosslinking
hydroxypropyl cellulose (HPC) linear macromolecules. The controllable synthesis
parameters – surfactant concentration, HPC concentration and reaction temperature –
were varied to determine the effects on the size and size distribution of the microgels as
monitored using laser light scattering techniques. It is found that the microgels can form
only above the CMC of the DTAB surfactant at the LCST. As the HPC concentration
increases from 0.1 wt% to 0.3 wt%, the size distribution becomes significantly broader.
Furthermore, the reaction temperature plays an important role for the size distribution:
upon increase of the temperature above the LCST, the particle size increases quickly.
The formation of microgels may be explained by the balance between the hydrophobic
interaction between HPC polymer chains and inter-micelle electrostatic repulsion. The
swelling and phase transition properties of the resultant HPC microgels are analyzed
using both static and dynamic light scattering techniques as a function of temperature at
various crosslinker concentrations. It is found that the increase in the crosslinker density
reduces the shrinkage extent and increases the transition temperature. The dilute HPC
microgel particles with a concentration of 8.94×10⁻⁶ g/ml form a stable colloidal

45
dispersion at room temperature and at 44oC (>Tc), probably due to steric effects. In the
aqueous solution of physiological salt concentration, the phase transition of the HPC
microgels occur at about 39°C, which corresponds to fever temperature of human body.
Combining the temperature-responsive volume change, bio-compatibility of the HPC,
and uniform and small size, the HPC microgels could be particularly useful in controlled
drug delivery applications.
46
REFERENCES
(1) Lu, X.; Hu, Z.; Gao, J. Macromolecules 2000, 33, 8698.
(2) Pelton, R. Adv. Colloid Interf. Sci. 2000, 85, 1.
(3) Saunders, B. R.; Vincent, B. Adv. Colloid Interf. Sci. 1999, 80, 1.
(4) Murry, M. J.; Snowden, M. J. Adv. Colloid Interf. Sci. 1995, 54, 73.
(5) Senff, H.; Richtering, W. J. Chem. Phys. 1999, 111, 1705.
(6) Li, Y.; Tanaka, T. J. Chem. Phys. 1990, 40, 820.
(7) Bradna, P.; Quadrat, Q.; Snuparck, J. Colloid Polym. Sci. 1995, 273, 324.
(8) Sasa, N.; Yamaoks, T. Adv. Mater. 1994, 6, 417.
(9) Sahoo, S. K.; De, T. K.; Ghosh, P. K.; Maitra, A. J. Coll. Interf. Sci. 1998, 206, 361.
(10) Kiser, P. F.; Wilson, G.; Needham, D.; Nature 1998,394, 459.
(11) Pelton, R.H.; Chibanate, P. Colloids Surf. 1986, 120, 247.
(12) Neyret, S.; Vincent, B. Polymer 1997, 38, 6129.
(13) Antionietti, M.; Pakula, T.; Bremser, W. Macromolecules 1995, 28, 4227.
(14) Frank, M.; Burchard, W. Makromol. Chem. Rapid Commun. 1991, 12, 64.
(15) Hirotsu, S.; Hirokawa, Y.; Tanaka, T. J. Chem. Phys. 1987, 87, 1392.
(16) Kabra, B. G.; Gehrke, S. H.; Spontak, R. J. Macromolecules 1998, 31, 2166.
(17) Harsh, D.C.; Gehrke, S. H. J. Controlled Release 1991, 17, 175.
(18) Winnik, F.M.; Tamai, N.; Yonezawa, J.; Nishimura, Y.; Yamazaki, I. J. Phys. Chem.
1992, 96, 1967.
(19) Wu, C. Polymer 1998, 39, 4609.
(20) Zhou, S; Chu, B. J. Phys. Chem. 1998, 102, 1364.
47
(21) Anbergen, U.; Oppermann, W. Polymer 1990, 31, 1854.
(22) Karlstrom, G.; Carlsson, A.; Lindman, B. J. Phys.Chem. 1990, 94, 5005.
(23) Ahlnas, T.; Karlstrom, G.; Lindman, B. J. Phys. Chem. 1987, 91, 4030.
(24) Karlstrom, G. J. Phys. Chem. 1985, 89, 4962.
(25) Hormnirun, P.; Sirivat, A.; Jamieson, A. M. Polymer 2000, 41, 2127.
(26) Drummond, C. J.; Albers, S.; Furlong, D. N. Colloids Surf. 1992, 62, 75.
(27) Lashkevich, O. V.; Dyagileva, A. B.; Chernoberezhskii, Y. M. Colloid J. 1997, 59,
467.
(28) Inomata, H.; Goto, S.; Otake, K.; Saito, S. Langmuir 1992, 8, 687.

48
CHAPTER 4
POLYMER GEL NANOPARTICLE NETWORK
4.1 INTRODUCTION
Polymer gels are a unique class of macromolecular networks that contain a large
fraction of solvent within their structure. They are particularly suitable for biomedical
applications because of their ability to simulate biological tissues.1 In response to
environmental stimuli such as temperature and pH, gels can reversibly swell or shrink up
to 1000 times in volume2 and have varied applications such as artificial muscles,
controlled drug release, and sensors. 3-12 Gels are usually formed by the free radical
polymerization of monomers in the presence of a difunctional crosslinking agent. They
can be made either in bulk or in nano- or micro-particles. The bulk gels are easy to
handle, but have a very slow swelling rate, while the gel nanoparticles act quickly to an
external stimulus, but are too small for some applications. Here, by first making gel
nanoparticles and then covalently bonding them together, we have engineered a new class
of gels with two levels of structural hierarchy: the primary network is crosslinked
polymer chains in each individual particle, while the secondary network is a system of
crosslinked nanoparticles. Such nanostructured gels have new and unique properties that
conventional gels do not have, including a high surface area, a bright blue color at room
temperature, and temperature-tunable heterogeneity on the nanometer scale. This work
may lead to creating opportunities for technological applications, ranging from controlled
drug delivery, sensors, bio-adhesives, to displays.

49
4.2 EXPERIMENTAL
HPC Nanoparticle Synthesis The synthesis of the HPC nanoparticles was detailed in
Chapter 3. 1 g of HPC (average molecular weight of 1x10⁶, Adrich Chemical Company)
was dispersed to 200 ml of aqueous sodium hydroxide solution (pH=12). Divinylsulfone
(DVS) (Sigma) of 0.1~0.5 ml per 1 g of HPC as a crosslinker and
dodecyltrimethylammonium bromide of 1.425 g critical micelle concentration (c.m.c.) as
a surfactant were then added to the HPC solution. The HPC nanoparticles formed within
1 hr at about 65 oC.
NIPA-co-AA Nanoparticle Synthesis 3.79 g NIPA monomer, 0.099 g AA monomer,
66 mg methylene-bis-acrylamide as crosslinker, 0.116 g sodium dodecyl sulphate as
surfactant, and 240 mL deionized water were mixed in a reactor. The solution was heated
to 70 oC under nitrogen for 40 min. 0.166 g of potassium persulfate dissolved in 21 mL
of deionized water was added to start the reaction. The reaction was carried out at 70 oC
for 4.5 h.
4.2 RESULTS AND DISCUSSION
As a demonstration, we first made hydroxypropyl cellulose (HPC) nanoparticles
using an emulsion polymerization method. The nanoparticle dispersion was then
dialyzed four times to remove surfactant and un-reacted chemicals. The average
hydrodynamic radius (<Rh>) and Rh distribution function, f(Rh) of these nanoparticles,
were characterized using a commercial laser light scattering spectrometer
(ALV/DLS/SLS-5000) with a Helium-Neon laser (Uniphase 1145P, output power of

50
22mW and wavelength of 632.8 nm). <Rh> ranged from 120 nm to 250 nm depending on
chemical composition and reaction temperature. Crosslinking nanoparticles can be
carried out either at room temperature or at the temperature above the volume phase
transition temperature (Tc≈41 oC)13 of the HPC. When the reaction was set at T=55 oC
(>Tc), 20 g of 0.5 wt% HPC nanoparticles were added into an aqueous sodium hydroxide
solution of pH=12. After introducing divinylsulfone (DVS) of 0.02 ml, the residual
hydroxyl groups on the surfaces of neighboring HPC nanoparticles were bonded to form
a network. On the other hand, when the reaction was set at room temperature, the HPC
nanoparticles did not precipitate. They were first closely packed to the concentration of
1.1 wt% using ultra-centrifugation and then crosslinked by adding DVS of 19.4 % in
weight ratio of DVS to HPC at pH=12. The nanoparticle network was thoroughly
washed in water. Since the nanoparticles were linked together by covalent bonding, they
cannot be re-dispersed into solution, in contrast to well-known colloidal aggregates.
The gel nanoparticle networks prepared in this study have the water content ranging
from 92 wt% to 97 wt%. It is noted that the crosslinkers can react not only with the
functional groups of different nanoparticles but also with those of the same particles.
Only inter-particle crosslinking contributes to the gel formation and the swelling and
mechanical properties of the resulting materials.
Figure 4.1(a) and 4.1(b) show representative sketches of the HPC nanoparticle
network, and the network of individual nanoparticle, respectively. The optical
microscopic image of an HPC nanoparticle network in water at room temperature is

51
Figure 4.1. Structure of a polymer gel nanoparticle network. (a) Representative sketch of
the gel nanoparticle network; (b) sketch of the gel network in each nanoparticle. The
primary network (I) is crosslinked polymer chains in each individual nanoparticle, while
the secondary network (II) is a system of crosslinked nanoparticles. (c) Optical
microscopic image of the HPC nanoparticle network in water at room temperature. The
network was formed at 55 oC. The white bar is 10 µm.

52
presented in Figure 4.1(c). As suggested in Figure 4.1(a) and 4.1(b), there are two
different networks in a gel nanoparticle network. The primary network is crosslinked
polymer chains inside each nanoparticle, while the secondary network is a crosslinked
system of the nanoparticles themselves. The mesh size of the primary network depends
on the concentration ratio of the crosslinker to linear polymer chains or monomers and is
usually around 1-10 nm. In comparison, the mesh size of the secondary network depends
on the concentration of the crosslinker and nanoparticles, and the size of nanoparticle.
The mesh size is typically around 50-500 nm. As a result, the nanoparticle network could
be used to entrap and deliver small or/and very large biomolecules with its primary and
secondary structures, respectively. This will enhance the capability of polymer gels as
carriers for controlled drug delivery.
The kinetics of volume change of polymer gels plays an important role for most of
their applications ranging from sensors to actuators. Developing gel nanoparticle
networks could drastically change such kinetics. As shown in Figure 4. 2, the swelling
ratio of the HPC nanoparticle network with dimensions of 1 cm x 1 cm x 2.5 cm was
measured as a function of time when the sample was cycled between two thermal baths set
at 20 oC and 48 oC, respectively. This sample was synthesized using the same method as
described above and crosslinking gel nanoparticles was controlled at room temperature. The
HPC nanoparticle network swelled at 20 oC, but collapsed very quickly at 48 oC, which was
above Tc. The HPC nanoparticle network exhibited distinctive asymmetric kinetics: its
shrinking rate was faster by about two orders of magnitude than that of a conventional

53
Figure 4.2. Swelling and shrinking kinetics of the HPC nanoparticle network that was
formed at room temperature. Time-dependent swelling ratio of the sample that was cycled
between two thermal baths set at 20 oC and 48 oC, respectively (open circles with the solid
line). The temperature profile is represented using a solid line.
homogeneous gel with similar chemical composition and dimensions, while its swelling
rate was not significantly higher.
The fast shrinking rate comes from the unique structure of the nanoparticle network.
It is known that the shrinking or swelling time of a gel is dependent on the square of the
smallest linear dimension, and is very slow for a bulk gel. 14 The nanoparticles in the
network are so small that they should respond to an external stimulus extremely fast.
Therefore, the shrinking or swelling kinetics is mainly controlled by movement of water
through the spaces between nanoparticles. Such spaces may be better connected in the
shrinking process than in the swelling process, resulting in the faster response rate in

54
shrinking. In comparison with other fast response gels that were made by either creating
pores in the gel 15 or grafting hydrophobic chains into the gel,16 the nanoparticle network
has the advantages of highly uniform and easily tunable mesh sizes. For example, the
pore size in a nanoparticle network can be well controlled by varying either nanoparticle
size or the average number of nearest neighbors.
The nanoparticle networks can be made to retain some properties of their dispersions.
As a demonstration, we first made nanoparticles of co-polymer N-isopropylacrylamide
(NIPA, molar fraction of 96%) and acrylic acid (AA, 4%) using an emulsion method.17
The NIPA has a thermally responsive property, while the AA provides carboxyl groups (-
COOH) for crosslinking sites. The resulting NIPA-AA nanoparticles had an average
radius of 153 nm at 25 oC in water as shown in Figure 4.3 (a). Upon exhaustive ultra-
centrifugation, a concentrated NIPA-AA nanoparticle dispersion was obtained and it
exhibited bright blue color. The color may be due to light interference from the closely
packed nanoparticles. Epichlorohydrin was then added into the dispersion. The water in
the naoparticles was gradually replaced by epichlorohydrin. After incubation at 98 oC for
10 h, crosslinking between epichlorohydrin and carboxyl groups occurred and the
nanoparticles formed a network. This network was then transferred to acetone and finally
to de-ionized water for thorough washing.
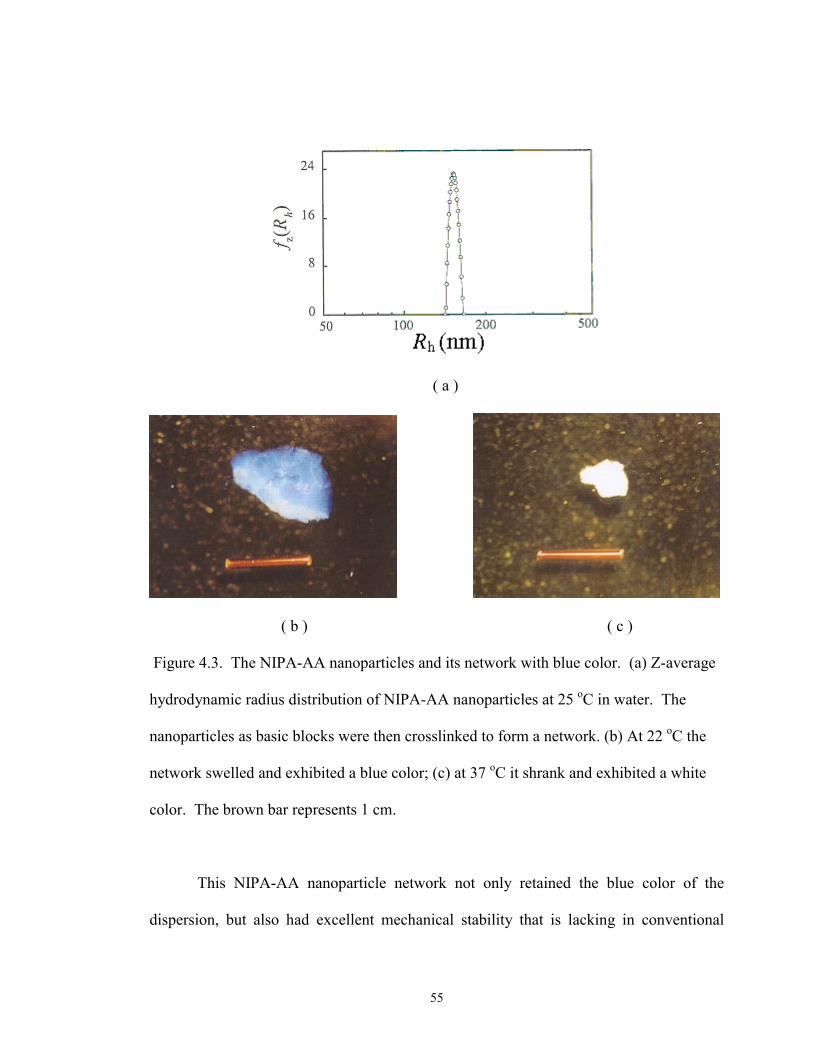
55
( a )
( b ) ( c ) Figure 4.3. The NIPA-AA nanoparticles and its network with blue color. (a) Z-average
hydrodynamic radius distribution of NIPA-AA nanoparticles at 25 oC in water. The
nanoparticles as basic blocks were then crosslinked to form a network. (b) At 22 oC the
network swelled and exhibited a blue color; (c) at 37 oC it shrank and exhibited a white
color. The brown bar represents 1 cm.
This NIPA-AA nanoparticle network not only retained the blue color of the
dispersion, but also had excellent mechanical stability that is lacking in conventional

56
dispersions. As shown in Figure 4.3 (b), the nanoparticle network kept its shape in water
without support of a container at room temperature. When the temperature was increased
to 37 oC (Figure 4.3 (c)), that is, above the volume phase transition temperature (Tc=34
oC) of the NIPA gel,18 the network completely shrank and exhibited white color due to
non-selective light scattering by microdomains formed during the volume transition.19
Combining environmentally responsive color change and volume change, the
nanoparticle network may potentially function as a display element or as a sensor for
biological and medical applications.
It is expected that the nanoparticle network method could also be extended to
stabilize crystal colloid arrays. The conventional colloid crystal arrays have found little
practical application due to their poor mechanical and thermal stability.20 To overcome
this shortcoming, such arrays are usually embedded in a gel matrix.9, 20 With our method,
the colloidal crystal array could be stabilized by directly linking nanoparticles through
chemical bonds without introducing another gel matrix.
Different nanoparticles can be used as basic building blocks for synthesis of co-
nanoparticle networks. We demonstrated this idea by first synthesizing nanoparticles of
poly(vinyl alcohol) (PVA) with radii about 125 nm and HPC with radii about 125 nm,
respectively. The synthesis of HPC nanoparticles was mentioned above. The PVA
nanoparticles were prepared using a surfactant-free method. PVA (88 mol% hydrolyzed,
MW~25,000, Polysciences, Inc.) was dissolved in distilled water. Sodium hydroxide
solution (5M) was added to yield 2 wt % PVA solution at pH=12. Then, 27 g of acetone
was added to the 50 g PVA solution. After stirring 30 mins, 0.1 ml DVS was added to

57
the solution. The reaction lasted about four hours and the resulting nanoparticle
dispersion was dialyzed five times. The PVA and HPC nanoparticles were then mixed.
Crosslinking was performed by adding divinylsulfone to the PVA-HPC dispersion at
pH=12 at 45 oC according to the following mechanism:
��������������������� ���� �� ��
������������������������ ��
���
The PVA-HPC co-nanoparticle network was formed within 1 hour. In contrast to
well-established co-polymerization with different monomers as building blocks, the co-
nanoparticle network retains properties of each type of polymer nanoparticles. As a
result, such a network could perform multifunctional tasks. For the PVA-HPC co-
nanoparticle network, PVA nanoparticles could act as bioadhesive agents while the HPC
particles act as drug carriers for temperature-controlled drug release. The bioadhesion of
the PVA could be further improved because the surface area is greatly increased due to
PVA nanoparticle structures. Furthermore, with an increase in the temperature, the PVA
nanoparticles expand while the HPC nanoparticles shrink, resulting in temperature-
tunable heterogeneity on the nanometer scale. The co-nanoparticle network technology
may open a new avenue for synthesis of many new nanostructured polymeric materials.
58
4.4 CONCLUSION
In summary, a new class of nanostructured polymer gel has been synthesized by
crosslinking gel nanoparticles through covalent bonds between functional groups on the
surfaces of neighboring particles in solutions. Thus, these gels have two levels of
structural hierarchy: the primary network is closslinked polymer chains in each
nanoparticle, while the secondary network is crosslinked nanoparticles as a whole. With
such a unique structure, they have new properties that conventional gels do not have,
including high surface area, controlled heterogeneity at the nanoscale, and uniform and
easily tunable mesh sizes. Architectures of nanostructured gels could be easily tailored by
selecting different gel nanoparticles and crosslinking agents. Several applications of gel
nanoparticle networks are presented in this chapter, including a nanoparticle network
with a fast shrinking rate, a scattering-colored nanoparticle network, and a co-
nanoparticle network as a potential multi-functional drug delivery carrier.
59
REFERENCES
(1) Peppas, N. A.; Langer, R. Science 1994, 263, 1715.
(2) Tanaka, T. Phys. Rev. Lett. 1978, 40, 820.
(3) Tanaka, T.; Nishio, I.; Sun, S. T.; Ueno-Nishio, S. Science 1982, 218, 467.
(4) Siegel, R. A.; Firestone, B. A. Macromolecules 1988, 21, 3254.
(5) Chen, G.; Hoffman, A. S. Nature 1995, 373, 49.
(6) Yoshida, R.; Takahashi, T.; Ichijo, H. Adv. Mater. 1997, 9, 175
(7) Osada, Y.; Gong, J. P. Adv. Mater. 1998, 10, 827.
(8) Weissman, J. M.; Sunkara, H. B.; Tse, A. S.; Asher, S. A. Science 1996, 274, 959.
(9) Holtz, J. H.; Asher, S. A. Nature 1997, 389, 829.
(10) Hu, Z.; Zhang, X.; Li, Y. Science 1995, 269, 525.
(11) Hu, Z.; Chen, Y.; Wang, C.; Zheng, Y.; Li, Y. Nature 1998, 393, 149.
(12) Snowden, M. J.; Murray, M. J.; Chowdry, B. Z. Chemistry & Industry 1996, 531.
(13) Harsh, D. C.; Gehrke, S. H. J. Controlled Release 1991, 17, 175.
(14) Li, Y.; Tanaka, T. J. Chem. Phys. 1990, 92, 1365.
(15) Kabra, B. G.; Gehrke, S. H. Polymer Comm. 1991, 32, 322.
(16) Yoshida, R.; Uchida, K.; Kaneko, Y.; Sakal, K.; Kikuchi, A.; Sakurai, Y.; Okano, T.
Nature 1995, 374, 240.
(17) Pelton, R. H.; Chibante, P. Colloids Surf. 1986, 20, 247.
(18) Hirotsu, S.; Hirokawa, Y.; Tanaka, T. J. Chem. Phys. 1987, 87, 1392.
(19) Li, Y.; Wang, G.; Hu, Z. Macromolecules 1995, 28, 4194.
(20) Kamenetzky, E. A.; Magliocco, L. G.; Panzer, H. P. Science 1994, 263, 207.
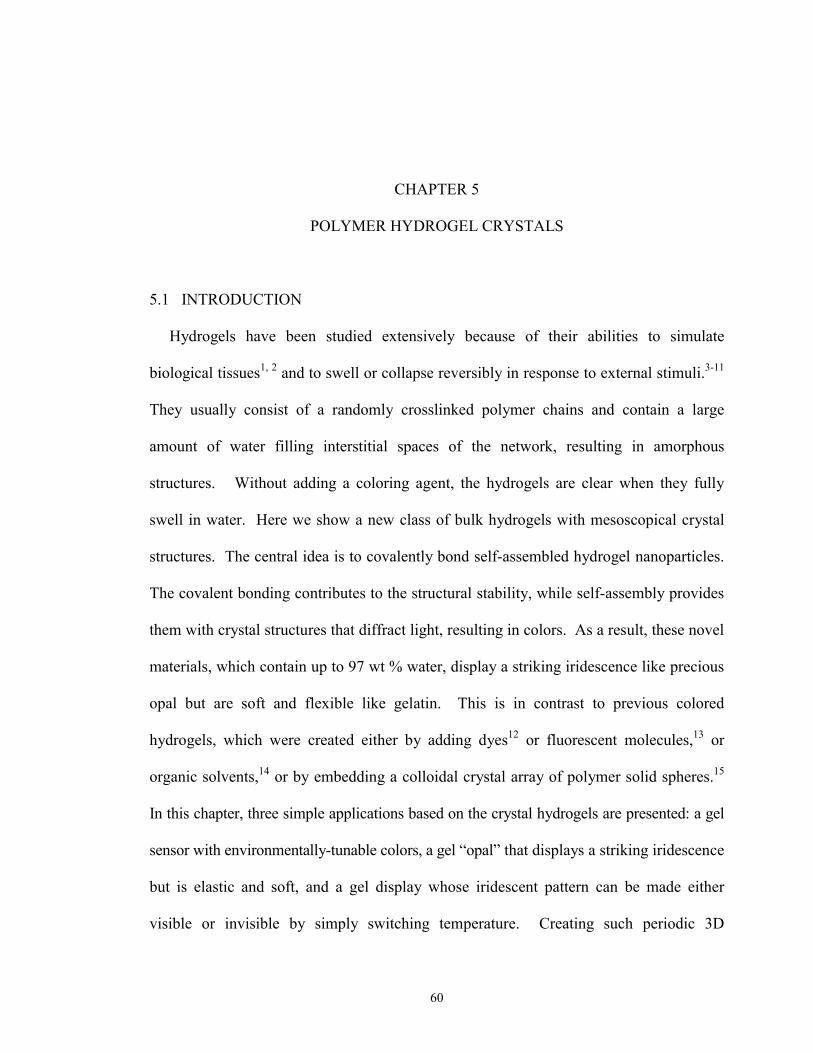
60
CHAPTER 5
POLYMER HYDROGEL CRYSTALS
5.1 INTRODUCTION
Hydrogels have been studied extensively because of their abilities to simulate
biological tissues1, 2 and to swell or collapse reversibly in response to external stimuli.3-11
They usually consist of a randomly crosslinked polymer chains and contain a large
amount of water filling interstitial spaces of the network, resulting in amorphous
structures. Without adding a coloring agent, the hydrogels are clear when they fully
swell in water. Here we show a new class of bulk hydrogels with mesoscopical crystal
structures. The central idea is to covalently bond self-assembled hydrogel nanoparticles.
The covalent bonding contributes to the structural stability, while self-assembly provides
them with crystal structures that diffract light, resulting in colors. As a result, these novel
materials, which contain up to 97 wt % water, display a striking iridescence like precious
opal but are soft and flexible like gelatin. This is in contrast to previous colored
hydrogels, which were created either by adding dyes12 or fluorescent molecules,13 or
organic solvents,14 or by embedding a colloidal crystal array of polymer solid spheres.15
In this chapter, three simple applications based on the crystal hydrogels are presented: a gel
sensor with environmentally-tunable colors, a gel “opal” that displays a striking iridescence
but is elastic and soft, and a gel display whose iridescent pattern can be made either
visible or invisible by simply switching temperature. Creating such periodic 3D

61
structures in materials allows us to obtain useful functionality not only from the
constituent building blocks, but also from the long-range ordering that characterizes these
structures.16
5.2 EXPERIMENTAL
Two different building blocks of N-isopropylacrylamide (NIPA)-derivative
nanoparticles, with various particle sizes, were synthesized using an emulsion
polymerization method :17,18 one was the NIPA co-polymerized with acrylic acid (AA)
and the other was the NIPA with 2-hydroxyethyl acrylate (HEAc). The NIPA had
thermally responsive properties ,19 while the AA and the HEAc provided carboxyl (-
COOH) and hydroxyl (-OH) groups, respectively, for the crosslinking sites. The size
Scheme 1
CH2 ClCH CH2
O
NIPACHO
O
NIPA C
O
O CH2 CH CH2 O C NIPA
O
OH
Scheme 2
OH CH2 CH SO2 CH CH2 NIPAHONIPA
OH-
NIPA O NIPACH2CHSO2CHCH2O 2 2
C OH
O
NIPA

62
distribution of nanoparticles was characterized using a light scattering spectrometer
(ALV-5000). The hydrodynamic radius of the resultant nanoparticles in water was
narrowly distributed with a size variance of about 1%.
We have developed two schemes for covalently bonding nanoparticle assemblies in
either organic or aqueous media. In the first scheme, the NIPA-AA nanoparticles in
water were first precipitated by adding acetone. These concentrated nanoparticles were
transferred to a mixture of acetone/epichlorohydrin (1:3 volume ratio) to form a short-
range-ordered structure by steric and electrostatic repulsion. After incubation at 98 oC for
10 h, the nanoparticles formed a three-dimensional network. This network was immersed
in acetone and finally in de-ionized water for thorough washing. In the second scheme,
the NIPA-HEAc nanoparticles first self-assembled into different structural arrays at
various concentrations in an aqueous solution (pH=12). Then, divinylsulfone (DVS)20
was added to bond them at room temperature. The second scheme can be carried out
directly in water and is particularly useful for hydrogels. Since the colloidal particles are
linked together by covalent bonding, they cannot be re-dispersed into a solution, in
contrast to well-known colloidal aggregates. It is noted that the crosslinkers can react not
only with the functional groups of different nanoparticles but also with those of the same
particles.
5.3 RESULTS AND DISCUSSION
The NIPA nanoparticle assemblies exhibit phase behavior similar to conventional
colloidal fluids discussed extensively elsewhere previousl.21-23 These phase structures of

63
nanoparticles with an average hydrodynamic radius of 145 nm, have been stabilized using
Scheme 2 as shown in Figure 5.1. In contrast to colloidal fluids, these assemblies are
solids, and thus do not significantly deform due to gravity, as is apparent from the
inverted orientation of the tubes. As shown in Figure 5.1(a), we found that it was
difficult to bond the nanoparticles when the concentration was below 2.9 wt%, where the
dispersions were in a liquid phase. In the concentration range 3.5 to 4.1 wt%, the
assemblies exhibited iridescent color patterns, indicating that the nanoparticles self-
assembled into a macro-crystal phase of long-range order. The crystal grain size
decreased with increasing concentration. When the concentration was above 5 wt%, the
crystals were too small to be observed, and the nanoparticles self-assembled into a glass
phase of short-range order. The color of the assemblies, for a fixed particle size, became
bluer because the scattering wavelength becomes shorter with increasing nanoparticle
concentration . On the other hand, as the particle size increased, the color shifted to the
red and the crystal phase occurred at a lower concentration (Figure 5.1(b)).
To quantify these observations, we have measured the turbidity of NIPA nanoparticle
dispersions as a function of the wavelength as shown in Figure 5. 2 (a) using a
spectrophotometer.24 Similar techniques have been used to study colloidal silica in
poly(methyl acrylate) film.25, 26 Corresponding to the appearance of colors, the turbidity
of the dispersions exhibited a shoulder-shaped increase as the wavelength decreased.
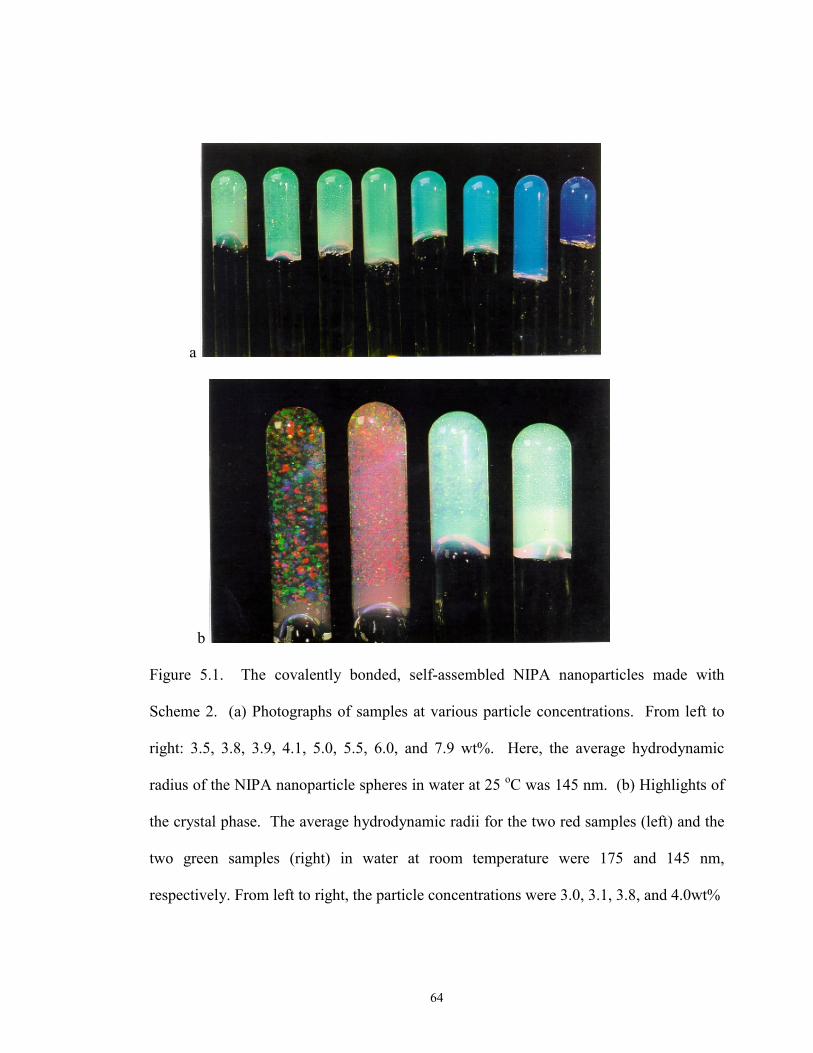
64
a
b
Figure 5.1. The covalently bonded, self-assembled NIPA nanoparticles made with
Scheme 2. (a) Photographs of samples at various particle concentrations. From left to
right: 3.5, 3.8, 3.9, 4.1, 5.0, 5.5, 6.0, and 7.9 wt%. Here, the average hydrodynamic
radius of the NIPA nanoparticle spheres in water at 25 oC was 145 nm. (b) Highlights of
the crystal phase. The average hydrodynamic radii for the two red samples (left) and the
two green samples (right) in water at room temperature were 175 and 145 nm,
respectively. From left to right, the particle concentrations were 3.0, 3.1, 3.8, and 4.0wt%
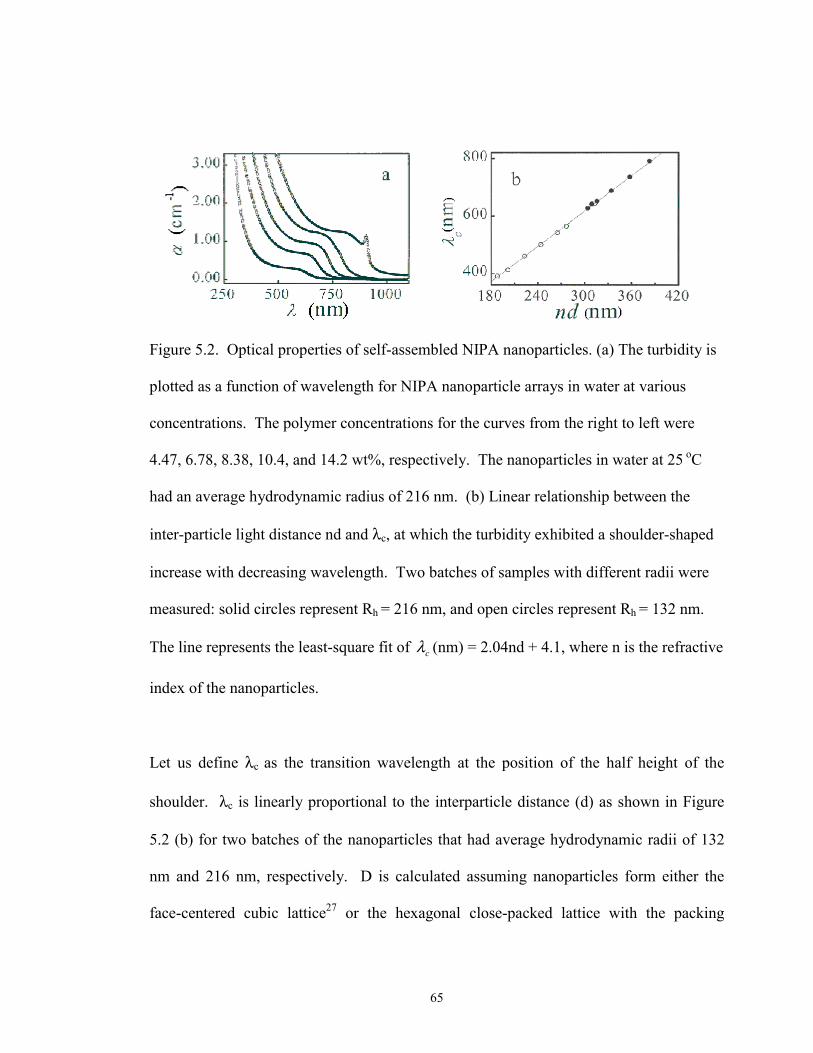
65
Figure 5.2. Optical properties of self-assembled NIPA nanoparticles. (a) The turbidity is
plotted as a function of wavelength for NIPA nanoparticle arrays in water at various
concentrations. The polymer concentrations for the curves from the right to left were
4.47, 6.78, 8.38, 10.4, and 14.2 wt%, respectively. The nanoparticles in water at 25 oC
had an average hydrodynamic radius of 216 nm. (b) Linear relationship between the
inter-particle light distance nd and λc, at which the turbidity exhibited a shoulder-shaped
increase with decreasing wavelength. Two batches of samples with different radii were
measured: solid circles represent Rh = 216 nm, and open circles represent Rh = 132 nm.
The line represents the least-square fit of cλ (nm) = 2.04nd + 4.1, where n is the refractive
index of the nanoparticles.
Let us define λc as the transition wavelength at the position of the half height of the
shoulder. λc is linearly proportional to the interparticle distance (d) as shown in Figure
5.2 (b) for two batches of the nanoparticles that had average hydrodynamic radii of 132
nm and 216 nm, respectively. D is calculated assuming nanoparticles form either the
face-centered cubic lattice27 or the hexagonal close-packed lattice with the packing

66
fraction of 0.74. A least-square fit yields cλ (nm) = 2.04nd + 4.1, indicating that the
Bragg diffraction condition of 2ndsinθ = mλc is satisfied with the diffraction angle θ =
90° and m = 1. Here n is the refractive index of hydrogel nanoparticles. For λ > λc, the
Bragg diffraction condition can never be satisfied, while for λ < λc, it can be satisfied by
polycrystals with different orientations of θ < 90o. The colors of the samples arise from
selective Bragg diffraction at λ < λc. Because the inter-particle distance can be adjusted
by varying either concentration or particle size, the colors of the samples can be shifted
accordingly.
Figure 5.3(a) shows a typical NIPA nano-structured hydrogel that was made using
Scheme 1 and that was immersed in acetone. A uniform and intense green color indicates
that it has retained the short-range order of its colloidal precursor. Color changes were
observed either when the sample was transferred from acetone to water at 21 oC or when
the sample was warmed from 21 oC to 31 oC in water (Figure 5.3(b)). Conventional gel
sensors based on volume phase transitions require a large size change from a swollen
state to a collapsed state, which is usually discontinuous and nonlinear. 28 In contrast, the
current systems based on distance between nanoparticles require only small size changes
that can be linearly correlated to the color as suggested by Figure 5.2b. The color of the
hydrogel could be further tuned by applying an electric field of 3.5V/cm in deionized
water at room temperature as shown in Figure 5. 3(c). The electric field caused
electrolysis in the water solvent and an ion gradient that resulted in gel volume change.29
This effect was not observed when the electrodes were placed outside the insulating
container holding the gel and its solvent while applying an electric field of 3.5 V/cm.
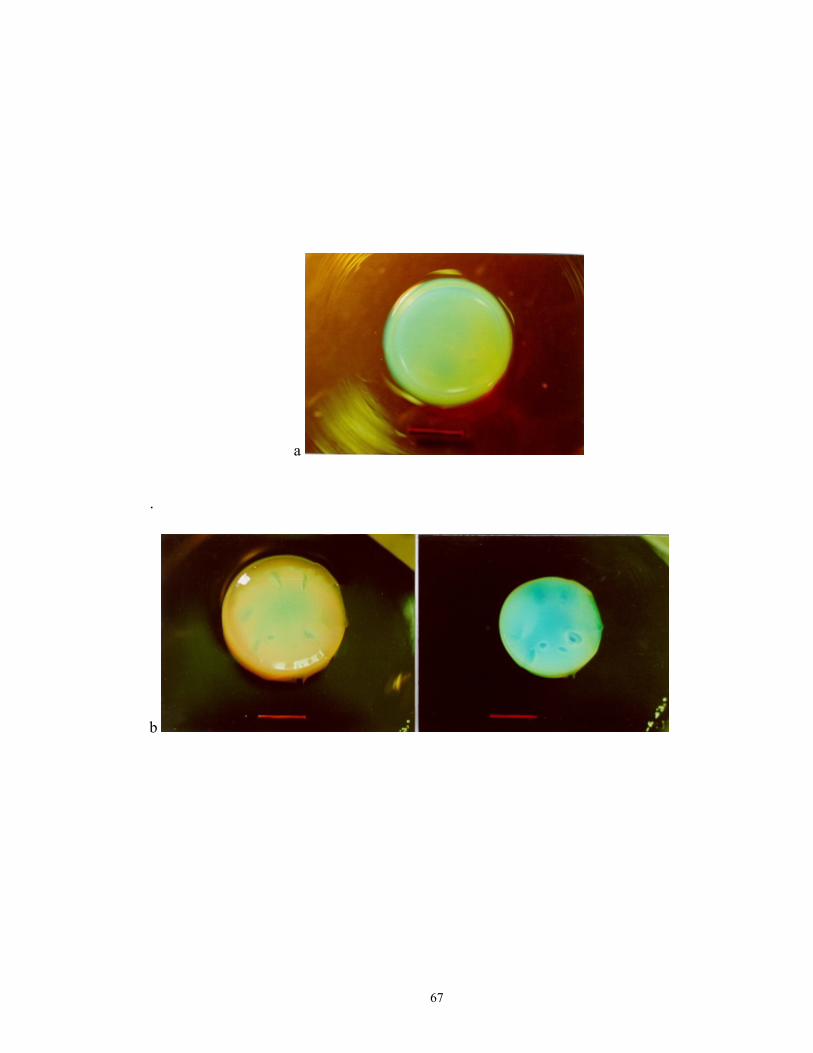
67
a
.
b
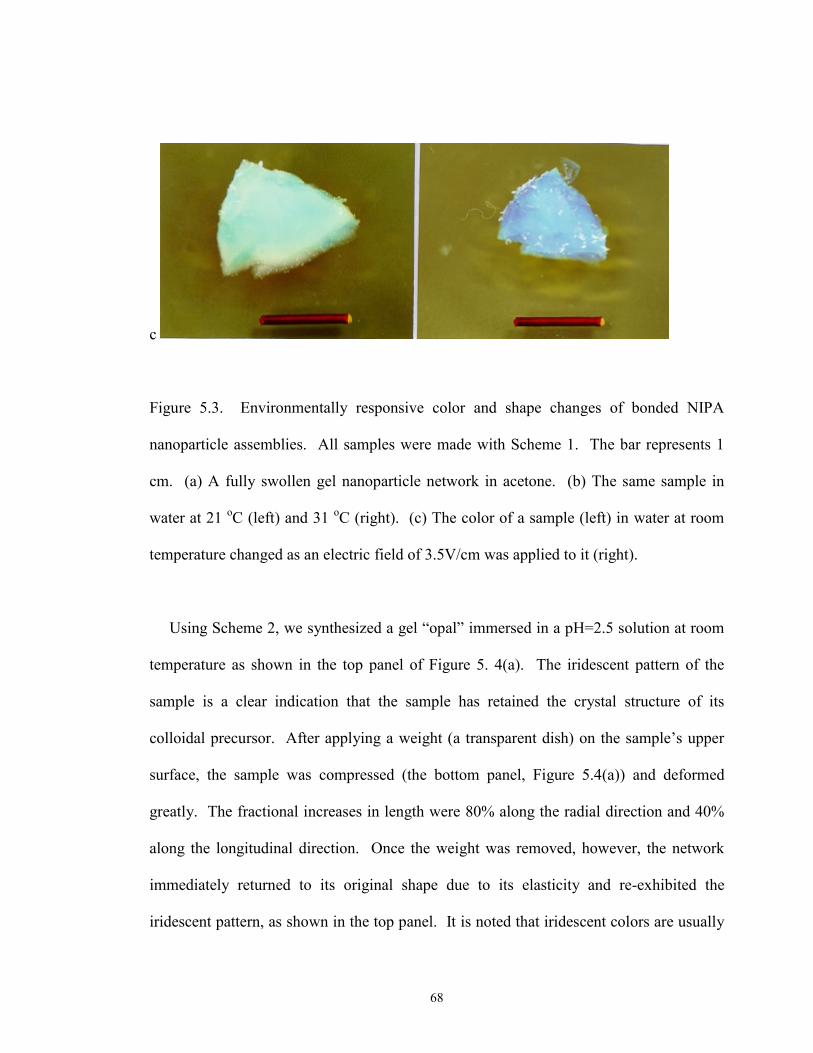
68
c
Figure 5.3. Environmentally responsive color and shape changes of bonded NIPA
nanoparticle assemblies. All samples were made with Scheme 1. The bar represents 1
cm. (a) A fully swollen gel nanoparticle network in acetone. (b) The same sample in
water at 21 oC (left) and 31 oC (right). (c) The color of a sample (left) in water at room
temperature changed as an electric field of 3.5V/cm was applied to it (right).
Using Scheme 2, we synthesized a gel “opal” immersed in a pH=2.5 solution at room
temperature as shown in the top panel of Figure 5. 4(a). The iridescent pattern of the
sample is a clear indication that the sample has retained the crystal structure of its
colloidal precursor. After applying a weight (a transparent dish) on the sample’s upper
surface, the sample was compressed (the bottom panel, Figure 5.4(a)) and deformed
greatly. The fractional increases in length were 80% along the radial direction and 40%
along the longitudinal direction. Once the weight was removed, however, the network
immediately returned to its original shape due to its elasticity and re-exhibited the
iridescent pattern, as shown in the top panel. It is noted that iridescent colors are usually
69
associated with rigid materials such as precious opal 30 that can deform slightly, or with
colloidal fluids31 that have no definite shape. Here, we have created a soft material that is
elastic, wet, and exhibits an iridescent pattern.
The covalent linkages between nanoparticles also lead to the remarkable thermal
stability of the crystal structure. Figure 5.4 (b) shows the temperature dependence of a
crystal hydrogel in a tube after polymerization with Scheme 2. The iridescent pattern
(left panel) at room temperature became invisible when the sample was heated to 50 oC,
at which point the gel became cloudy due to phase separation (right panel). When the
sample at 50 oC was cooled back to 21 oC, the pattern reappeared within 10 s, and this
process was reversible. In contrast, a non-crosslinked nanoparticle assembly with the
same concentration was completely disrupted as the temperature was raised to 32 oC. It
required about 1000 times longer for a non-crosslinked assembly to re-assemble into a
crystal structure. It is apparent that disturbed nanoparticles in a crosslinked assembly are
able to return to their equilibrium crystalline positions quickly through restoring forces
provided by the network elasticity. The fast response rate of the crystal hydrogels could
be a major advantage for developing sensor or display technologies over conventional
colloidal crystal arrays.
It is noted from the left panel in Figure 5.4(b) that the crystal hydrogel in water
displays an iridescent color with good transparency and no sedimentation (without adding
an index-matching or a density-matching fluid). This is because the building blocks are
hydrogel nanoparticles which contain up to 97 wt% water; both the refractive index and
the density of the particles are nearly matched with those of the surrounding water. The

70
(a)
(b)
Figure 5.4. The NIPA crystal hydrogels made with Scheme 2. (a) A hydrogel “opal”.
The sample was placed in a pH=2.5 solution before (top) and after (bottom) applying a
weight (a transparent dish) to compress it. The bar represents 1.165 cm. (b) A crystal
hydrogel display. The sample in the tube is transparent and exhibited an iridescent
pattern at 21 oC (left) until the temperature was raised to 50 oC (right), at which point the
pattern became invisible. As the sample at 50 oC was cooled back to 21 oC, the patterns
reappeared within 10 s.

71
crystal structures of our systems are further enriched by their unique two-level structural
hierarchy:32 The primary network consists of crosslinked polymer chains inside each
nanoparticle, while the secondary network is a crosslinked system of the nanoparticles.
The mesh sizes of the primary and the secondary networks are approximately 1-10 nm
and 10-500 nm respectively.
5.4 CONCLUSION
In summary, hydrogel opals have been synthesized by covalently bonding self-
assembled hydrogel nanoparticles. The covalent bonding contributes to the mechanical
and thermal stability of the assemblies, while self-assembly provides the bulk hydrogels
with crystal structures which diffract light, resulting in colors. Several applications of
crystal hydrogels are presented in this chapter, including a gel sensor whose color can be
tuned by either temperature or an electric field, a gel “opal” that displays a striking
iridescence and is wet and elastic, and a gel display whose iridescent pattern can be made
either visible or invisible by simply switching temperature. This work may lead to
technological applications, ranging from sensors and displays to home decoration.
72
REFERENCES
(1) Peppas, N. A. Hydrogels in Medicine and Pharmacy, (CRC Press, Boca
Raton, FL, 1987).
(2) Peppas, N. A.; Langer, R. Science 1994, 263, 1715.
(3) Tanaka, T. Phys. Rev. Lett. 1978, 40, 820.
(4) Tanaka, T.; Nishio, I.; Sun, S. T.; Ueno-Nishio, S. Science 1982, 218, 467.
(5) Siegel, R. A.; Firestone, B. A. Macromolecules 1988, 21, 3254.
(6) Osada, Y.; Okuzaki, H.; Hori, H. Nature 1992, 355, 242.
(7) Chen, G.; Hoffman, A. S. Nature 1995, 373, 49.
(8) Beebe, D. J.; Moore, J. S.; Bauer, J. M.; Yu, Q.; Liu, R. H.; Devadoss, C.;
Jo, B. H. Nature 2000, 404, 588.
(9) Yoshida, R.; Takahashi, T.; Ichijo, H. Adv. Mater. 1997, 9, 175.
(10) Y. Osada, and J. P. Gong, Adv. Mater. 1998, 10, 827.
(11) Snowden, M. J.; Murray, M. J.; Chowdry, B. Z. Chem. Ind. 1996, 531.
(12) Hu, Z.; Zhang, X.; Li, Y. Science 1995, 269, 525.
(13) Oya, T.; Enoki, T.; Grosberg, A. Y.; Masamune, S.; Sakiyama, T.;
Takeoka, Y.; Tanaka, K.; Wang, G.; Lilmaz, Y.; Feld, M. S.; Dasari,
R.;Tanaka, T. Science 1999, 286, 1543.
(14) Gong, J. P.; Okuzaki, H.; Osada, Y.; Macromol. Chem. Phys. 1994, 195,
1871.

73
(15) Weissman, J. M.; Sunkara, H. B.; Tse, A. S.; S. A. Asher, Science 1996, 274, 959;
Holtz, H.; Asher, S. A.; Nature 1997, 389, 829.
(16) Xia, Y.; Gates, B.; Yin, Y.; Lu, Y. Adv. Mater. 2000, 12, 693; Xia, Y.
Adv. Mater. 2001, 13, 369.
(17) Pelton, R. H.; Chibante, P. Colloids and Surfaces 1986, 20, 247.
(18) 3.78 g NIPA monomer, 0.099 g AA monomer, 66 mg methylene-bis-
acrylamide as crosslinker, 0.106 g sodium dodecyl sulphate as
surfactant, and 240 mL deionized water were mixed in a reactor.
Acrylic acid (AA) (4% molar ratio) or 2-hydroxyethyl acrylate (HEAc)
(9.5% molar ratio) as functional groups were added to the pregel
solutions, respectively. The solution was heated to 70 oC under
nitrogen for 40 min. 0.166 g of potassium persulfate dissolved in 21
mL of deionized water was added to start the reaction. The reaction
was carried out at 70 oC for 4.5 h.
(19) Hirotsu, S.; Hirokawa, Y.; Tanaka, T.; J. Chem. Phys. 1987, 87, 1392.
(20) Harsh, D. C.; Gehrke, S. H. J. Controlled Release 1991, 17, 175.
(21) Clark, N. A.; A. J. Hurd, A. J.; Ackerson, B. J. Nature 1979, 281, 57.
(22) Pusey, P. N.; van Megen, B. Nature 1986, 320, 340.
(23) Senff, H.; Richtering, W. J. Chem. Phys. 1999, 111, 1705.
(24) It is noted that the systems used for the turbidity study were neutral
NIPA gel nanoparticle dispersions. The concentration ranges for
74
occurrence of various phases were slightly different from those of ionic
NIPA gel nanoparticles that were used for the formation of nanopaticle
networks in Schemes 1 and 2. However, the optical properties for both
systems should be the same.
(25) Jethmalani, J. M.; Sunkara, H. B.; Ford, W. T.; Willoughby, S. L.;
Ackerson, B. J. Langmuir 1997, 13, 2633 and references cited therein.
(26) Jethmalani, J. M.; Ford, W. T.; Beaucage, G. Langmuir, 1997, 13,
3338.
(27) Hellweg, T.; Dewhurst, C. D.; Bruckner, E.; Kratz, K.; Eimer, W. Colloid Polym
Sci. 2000, 278, 972.
(28) Schild, H. G. Prog. Polym. Sci. 1992, 17, 163.
(29) Hirotsu, S. Japn. J. Appl. Phys. 1985, 24, 396.
(30) Sanders, J. V. Nature 1964, 204, 1151.
(31) Krieger, I. M.; O’Neill, F. M. J. Amer. Chem. Soc. 1968, 90, 3115.
(32) Hu, Z.; Lu, X.; Gao, J. Wang, C. Advanced Materials 2000, 12, 1173.

75
CHAPTER 6
PHASE TRANSITION BEHAVIOR OF HYDROXYPROPYL CELLULOSE UNDER
INTERPOLYMER COMPLEXATION WITH POLY(ACRYLIC ACID)
6.1 INTRODUCTION
Interpolymer complexes are physically interacted polymer chains in solution and have
been extensively investigated.1-4 The formation of polymer complexes between a proton-
accepting polymer such as poly(ethylene oxide) (PEO) and a proton-donating polymer
such as poly(acrylic acid) (PAA) via H-bonding in aqueous media has attracted a
continuing interest as a model of biological systems.5-9 The complexation of different
polymers in solution is a commonly used procedure for tailoring polymer properties to
specific needs without chemical modification of these macromolecules. Most studies
have been performed on the polymer complex systems, mainly focusing on the factors
that affect complexation, including stoichiometric ratio of two complementary polymers,
pH, ionic strength, solvent, concentration, and structure of the component polymers. 10-12
However, only a few studies13-14 have been reported so far on the effect of
complexation on the low critical solution temperature (LCST) of a nonionic polymer, that
is the minimum point at which phase separation will invariably occur in a polymer
solution. Hence, for a model study, we have chosen the hydroxypropyl cellulose (HPC)
as a proton-accepting polymer and poly(acrylic acid) (PAA) as a proton-donating

76
polymer to study how the complexation (Figure 1) between these two polymers affect
the LCST of the HPC polymer under various conditions.
The HPC exhibits a lower critical solution temperature (LCST) at 41 0C and
remarkable hydration-dehydration changes in aqueous solution in response to relatively
small changes in temperate around the LCST.15 Below the LCST, the HPC chains
hydrate to form an expanded structure; above the LCST, the HPC chains dehydrate to
form a shrunken structure. This property is due to the reversible formation and cleavage
of the hydrogen bonds between the HPC and surrounding water molecules with changing
temperature. The swelling behavior of HPC bulk gels, microgels, and polymer chains
have been previously reported.15-17 The advantage of HPC over many other synthetic
thermally responsive macromolecules is that the HPC is one of the cellulose ethers
approved by the United States Food and Drug Administration for the use in food, drug
and cosmetics,18-20 whereas many synthetic macromolecules are produced from
carcinogenic and teratogenic monomers.
It is well known that incorporating hydrophobic comonomers leads to a lower LCST,21
and incorporating hydrophilic comonomers leads to a higher LCST.22 The changes in
LCST caused by incorporating comonomers are due to changes in the overall hydrophilic
properties of the polymer. This effect has been investigated for another important
thermally responsive polymer N-isopropylacrylamide (NIPA).21, 22
Here we will show that based on complexation between the HPC and the PAA, the
LCST of the HPC can be drastically changed. Our literature survey shows that studies of
the structure and properties of interpolymer complexes between poly(acrylic acid) and
77
nonionic cellulose ethers have been reported.23-31 Specifically, Budtova23-26 and coworkers
investigated the formation and properties of the interpolymer complexation between PAA
and cellulose ethers including hydroxyethylcellulose (HEC) and methylcellulose (MC).
Their experimental results showed that the mixtures of the cellulose ethers and non-
ionized PAA in aqueous solution formed interpolymer complexes due to hydrogen
bonding. However, to our knowledge, systematic studies of the phase transition
behavior of the HPC/PAA complex with change of pH have not been reported. In this
chapter, the results of phase transition behavior of HPC/PAA complex in water will be
given, studied by turbidity and dynamic laser light scattering measurements as functions
of polymer concentration, temperature, pH value, and macromolecular weight.
The complexation between the HPC and the PAA also leads to a new method for the
formation of surfactant-free PAA nanoparticles directly in aqueous media at room
temperature. Such microgels have very narrow size distributions as characterized by light
scattering techniques and can reversibly swell and shrink in response to external stimuli
such as pH. These microgels may be used as building blocks for the formation of
nanoparticle networks32 or carriers for controlled drug delivery.
6.2 EXPERIMENTAL
Materials. Dry hydroxypropyl cellulose (HPC) powder (average Mw = 1.0×10⁶, and average Mw = 1.0×10⁵), and poly(acrylic acid) (PAA) solution (25% wt., average Mw = 2.4 x 10⁵; 25% wt., average Mw = 9.0�104 ; 25% ) was purchased from Aldrich Chemical Co. Deionized and distilled water was used throughout.

78
Sample Preparation. HPC powder was dissolved in dionized water by gentle stirring
for three to four days at a concentration of 1 wt %. Also, the 25 wt % solution of PAA
was diluted to 2.5 wt %. These two solutions were then mixed to produce the desired
concentrations studied in this paper. For different pH solutions, phosphate buffered saline
and 10 mM acrylic acid buffers were employed.
Turbidity Measurement. The increased insoluable polymer concentration can absorb
light and reduce the transmission of visible light. This reduction can be measured and is
called the sample’s turbidity. Turbidity can be thought of as a sample’s cloudiness.
The turbidity, a, will be defined as the reduction in light intensity per unit penetration
length in the sample: a = -(1/I)(∂I/∂x), where I is the light intensity in the sample. In the
calculation, we can set L to be the path length or the thickness of the sample, It to be the
intensity of the transmitted light, I0 to be the intensity of the incident light, and set aL
equal to constant, and then say that
It / I0 = e-a L
Therefore, the turbidity can be found from the percent transmittance or a = - (1/L)
ln(It/I0).33
In our experiment, we chose the wavelength of the incident light to be 555 nm. The
absorbance was monitored using a spectrophotometer (Milton Roy Ltd. Spectronic 301)
and the temperature of the sample was controlled by a circulation water bath (Fisher
Scientific, Model 9110), accurate to 0.05o C. The temperature of the sample was actually
measured using a digital multimeter and a thermocouple configuration standardized at 0o

79
C with ice. The sample was allowed thirty minutes or longer to reach equilibrium after
each temperature adjustment.
6.3 RESULTS AND DISCUSSION
Effect of polymer concentrations and molecular weight on the LCST of HPC-PAA
complex Hydroxypropyl cellulose in water has the LCST at 410C,15 while poly(acrylic
acid) is a hydrophilic macromolecule and readily dissolve in water. When the HPC and
the PAA are mixed, the interpolymer complex is formed at pH<pKa ( pKa =4.7 for
acrylic acid34) due to hydrogen bonding between the HPC and the PAA as shown in
Figure 6.1. That is, the PAA polymers act as a proton donor interacting with a proton
acceptor (HPC) to form interpolymer complexes.
O
H H H
H
H
H
HO
CH2
O
H HH
H
H
OH H
OOCH2CHCH3
OH
CH2
C CC CC C
CO O
CO O
CO O
OCH2CHCH3
OH
OCH2CHCH3
OH
OCH2CHCH3
OH
OCH2CHCH3
OH
Figure 6.1 . Schematic hydrogen bonding between HPC and PAA31
80
Figure 6.2a shows the turbidity of the HPC-PAA complex in aqueous solution as a
function of temperature at different HPC concentrations (average Mw = 1 x 10⁶) at
pH=3.2. The LCST of the HPC shifted to a lower temperature upon increasing HPC
concentration from 0.15 to 0.60 wt% while the PAA is at 1.0 wt %, compared to that of
pure HPC solution. The decrease of the phase transition temperature is contributed to the
formation of inter-macromolecular chain complexes caused by hydrogen bonding
between the –COOH group of PAA and –OH group of HPC. The formation of hydrogen
bonds between the –COOH and –OH groups limits the accessibility of water to the HPC
chains, leading to an increase in the hydrophobicity of the HPC linear macromolecules.
This means that the solvating microenvironment for the complex system becomes less
polar. As a result, the dipole moment of the propylene oxide moieties of HPC linear
macromolecules may be reduced to such an extent that the phase transition occurs at
much lower temperature.35 Furthermore, for different HPC concentrations, there is a
slightly slower LCST in 0.6 wt % than in other two samples. This could be due to
stronger hydrophobic interaction in higher HPC concentration.
To study the effect of molecular weight on the LCST of the HPC-PAA complex, the
turbidity as a function of temperature was measured for lower HPC molecular weight
Mw=1.0x10⁵ at pH=3.2. Figure 6.2b showed that the LCSTs of the HPC with lower
molecular weight are higher than those of the HPC with higher molecular weight at the

81
10 15 20 25 30 35 40 450.0
0.5
1.0
1.5
2.0
2.5 0.60% HPC 0.30% HPC 0.15% HPC 1.0% HPC,no PAA
a (c
m-1)
T (0C)
Figure 6.2a. The turbidity of the HPC/PAA for different HPC concentrations of
Mw=1.0×10⁶ at PAA concentration CPAA=1.0wt% at pH=3.2.
same polymer concentrations. This phenomena could be due to weaker intermolecular
hydrogen bonding interaction for lower molecular weight HPC. The HPC chains of
higher molecular weight are more easily removed from the aqueous environment and
have the lower phase transition temperature. Two complexes with lower HPC
concentrations in Figure 6.2b almost showed the same onset of the phase transition. The
different HPC concentrations seem only to widen the temperature-response range of the
complex and to change the magnitude of turbidity.

82
10 15 20 25 30 35 40 450.0
0.5
1.0
1.5
2.0
2.5 0.60% HPC0.30% HPC0.15% HPC1.0% HPC,no PAA
a (c
m-1)
T ( 0C)
Figure 6.2b. The turbidity of the HPC/PAA for different HPC concentrations of
Mw=1.0×10⁵ at 1.0wt% PAA concentration at pH=3.2.
Previous work has shown that the macromolecular weight of the interacting
polymer plays a very important role in forming the complexes.4 Specifically,
Morawetz36-37et al studied the effect of molecular weight of proton-accepting polymers
on the complexation of PAA with polyvinylpyrrolidone (PVP) or poly(ethylene oxide)
(PEO) using fluorescence spectroscopy. They found that the interaction of inter-
macromolecular hydrogen bonding became stronger with the increase of the molecular

83
weights of the proton-accepting polymers. The same mechanism may cause the decrease
of the LCST of HPC-PAA complex upon increasing the HPC molecular weight.
As a further study, we measured the turbidity of 1.3 wt% complexes with two
different PAA molecular weights for 1 wt% PAA and 0.3wt% HPC (Mw = 1.0×10⁶ ) at
pH=3.2. It was found that the molecular weight of the totally hydrophilic polymer PAA
also affects the LCST of the complexes. The higher the PAA molecular weight, the lower
the LCST, as expected.
10 15 20 250.0
0.5
1.0
1.5
2.0
2.5
2.4x10⁵ PAA 9.0x10⁴ PAA
a (c
m-1)
T (0C)
Figure 6.3. The turbidity of the HPC/PAA for two different PAA molecular weights at
0.3wt%HPC and 1.0wt%PAA.

84
5 10 15 20 25 30 35 40 45
0.0
0.5
1.0
1.5
2.0
2.5 pH=3.2 pH=3.3 pH=3.4 pH=3.7 pH=4.0 pH=4.3 pH=4.7 pH=5.1 pH=6.0
a (c
m-1)
T ( 0C)
Figure 6.4a. The turbidity of the HPC/PAA for different pHs at 0.6wt% HPC and
1.0wt% PAA.
pH effect on the LCST of the HPC-PAA complex. Figure 6.4a shows the phase
transition behavior of the complexes at various pH values and Figure 6.4b summarizes
the LCST as a function of pH values. The data of the LCST vs pH in Figure 6.4b may be
divided into two region: (I) below pH=4.0 and (II) above pH = 4.0. In the first region
(pH<4.0), poly(acrylic acid) is a weak acid and is in the molecular state at pH< pKa
(=4.7). The LCST of the complex shifts to lower temperature upon the decrease of pH.
This is caused by stronger hydrogen bonding as the pH value decreases. At pH=3.2, the
LCST of the complex is 16 0C, in comparison with 410C for the pure HPC solution. In
the second region (pH>4.0), it is found that the LCST decreases with the increase of the

85
pH value. When the pH = 4.0, the phase transition behavior of the HPC-PAA complex is
close to that of 1 wt. % HPC solution without PAA. This is attributed to the disrupted
hydrogen bonding between HPC and PAA. As the pH increases further, the LCST
decreases again. This could be caused by the salt effect of the totally ionized poly(acrylic
acid).
3 4 5 6 710
15
20
25
30
35
40
45
T (0 C
)
pH
Figure 6.4b. The LCST of the HPC/PAA for different pHs at 0.6wt% HPC and
1.0%wt PAA.
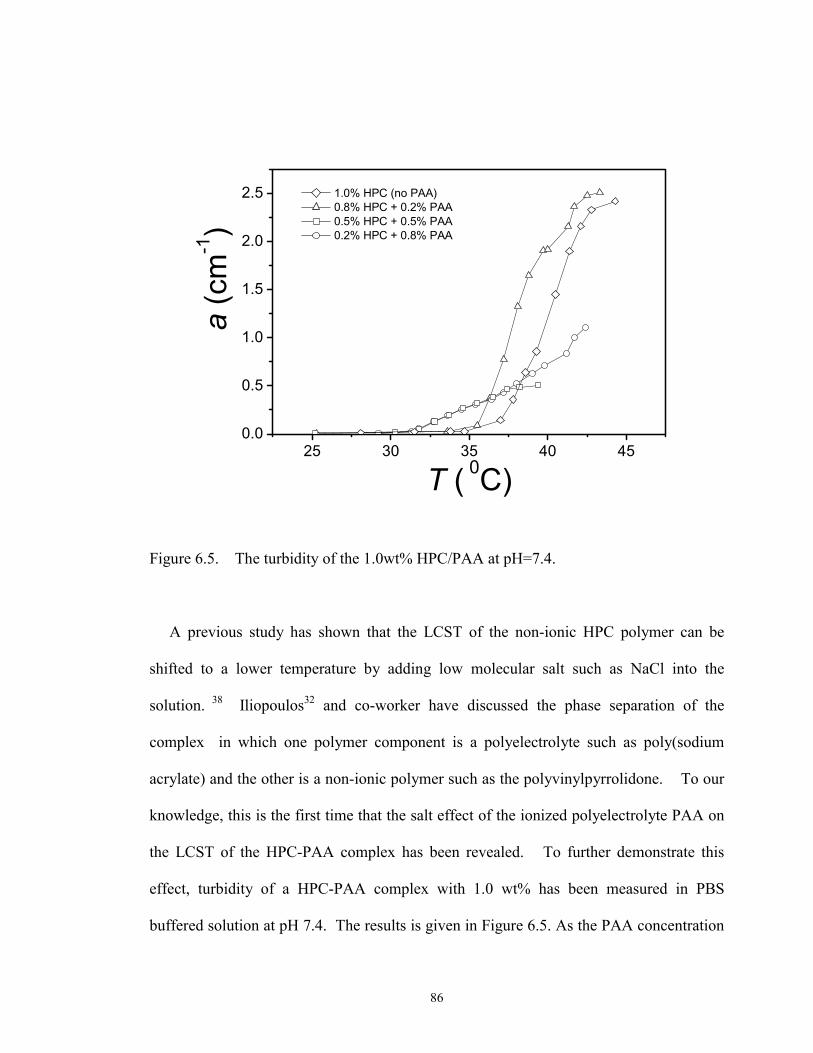
86
25 30 35 40 450.0
0.5
1.0
1.5
2.0
2.5 1.0% HPC (no PAA) 0.8% HPC + 0.2% PAA 0.5% HPC + 0.5% PAA 0.2% HPC + 0.8% PAA
a (c
m-1)
T ( 0C)
Figure 6.5. The turbidity of the 1.0wt% HPC/PAA at pH=7.4.
A previous study has shown that the LCST of the non-ionic HPC polymer can be
shifted to a lower temperature by adding low molecular salt such as NaCl into the
solution. 38 Iliopoulos32 and co-worker have discussed the phase separation of the
complex in which one polymer component is a polyelectrolyte such as poly(sodium
acrylate) and the other is a non-ionic polymer such as the polyvinylpyrrolidone. To our
knowledge, this is the first time that the salt effect of the ionized polyelectrolyte PAA on
the LCST of the HPC-PAA complex has been revealed. To further demonstrate this
effect, turbidity of a HPC-PAA complex with 1.0 wt% has been measured in PBS
buffered solution at pH 7.4. The results is given in Figure 6.5. As the PAA concentration

87
increases, the LCST of the complex decreases. The magnitude of the change of the
turbidity for higher PAA concentration (0.5 wt % and 0.8 wt %) is much smaller than that
of 0.2% PAA concentration. Furthermore, it was found that the HPC/PAA at 0.5wt% and
0.8 wt% was unstable above the LCST and slowly precipitated. We attributed the
shifting LCST of the HPC-PAA complex at pH=7.4 to the salt effect of the ionized
polyelectrolyte PAA.
100 10000
2
4
6
8
10
f(Rh)
Rh (nm)
23.00C 25.00C 27.00C 28.50C
Figure 6. 6a. Hydrodynamic radius distributions (f(Rh)) of self-assembly HPC/PAA
nanoparticles (C=1.6×10⁻⁵g/ml) at pH=3.2.

88
20 22 24 26 28 30250
300
350
400
450<R
h> (n
m)
T (0C)
Figure 6.6b. Average hydrodynamic radius < Rh > of self-assembly HPC/PAA
nanoparticles at pH=3.2.
Complexation in very dilute HPC/PAA Solution The phase transition behavior of the
HPC/PAA complex discussed above was studied in a relatively high polymer
concentration around 1 wt %. Here we report results of the HPC-PAA in very dilute
polymer solution. As revealed by dynamic light scattering in Figure 6.6a, the HPC-PAA
at polymer concentration of 1.6×10⁻⁵ g/ml can still form a complex at room temperature
at pH=3.2. It is noted that the complex has a narrowly distributed hydrodynamic radius.
This narrow distribution showes that the interpolymer hydrogen bonding of the dilute

89
HPC/PAA solutions at pH=3.2 can cause the decrease of the LCST, so they can
aggregate into nanospheres at room temperature. In contrast, the HPC in dilute aqueous
solution without PAA as a complexation agent would form nanospheres above 41 0C.15 In
addition, the hydrodynamic radius given in Figure 6.6b of the HPC-PAA complex in
dilute polymer solution at pH=3.2 decreases as the environmental temperature increases
within the range of temperatures studied.
Surfactant-free synthesis of PAA microgels based on interpolymer complexation.
Previously, the PAA microgels and their derivatives were synthesized using inverse
microemulsion polymerization 39, 40 with large amounts of organic solvent and
surfactants. In practice, complete removal of the solvent and surfactants from the
resultant polymeric particles is difficult, if not impossible. Here, a new method of
preparing PAA microgels is proposed and demonstrated. The central idea is based on the
HPC-PAA complexation in water through hydrogen bonding. At the beginning of
polymerization, the PAA chains form a complex with the HPC chains at low pH. Then
the PAA can aggregate around the complexes to form microgels.
To demonstrate this idea, we have prepared PAA microgels by mixing 2.0 g of
99wt% acrylic acid (AA), 10g of 1% HPC, and N, N’-methyleneacrylamide as a
crosslinker in 68 g distilled and deionized water. The solution was stirred at 26 0C under
nitrogen for 50 minutes. Then, 50 mg of ammonium persulfate and 50 mg of TEMED
dissolved in 10 g of deionized water, respectively, were added into the solution to
initialize polymerization. The reaction was carried out at 26 0C for 80 minutes.
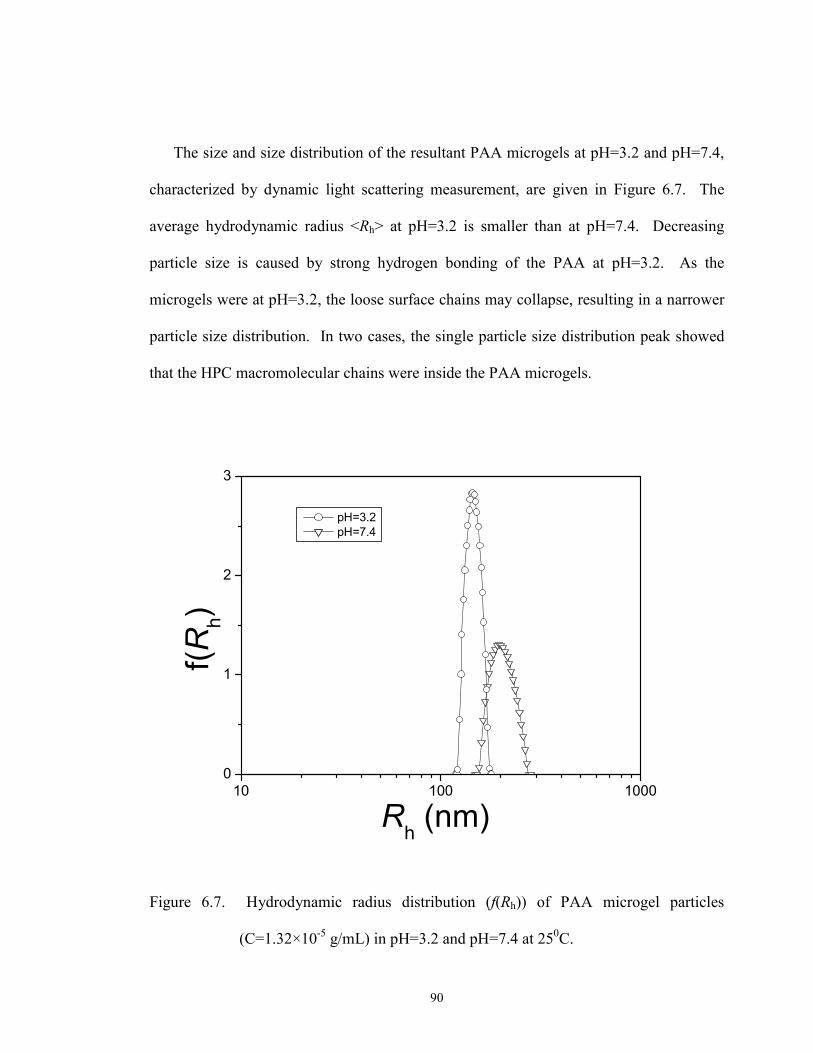
90
The size and size distribution of the resultant PAA microgels at pH=3.2 and pH=7.4,
characterized by dynamic light scattering measurement, are given in Figure 6.7. The
average hydrodynamic radius <Rh> at pH=3.2 is smaller than at pH=7.4. Decreasing
particle size is caused by strong hydrogen bonding of the PAA at pH=3.2. As the
microgels were at pH=3.2, the loose surface chains may collapse, resulting in a narrower
particle size distribution. In two cases, the single particle size distribution peak showed
that the HPC macromolecular chains were inside the PAA microgels.
10 100 10000
1
2
3
f(Rh)
Rh (nm)
pH=3.2 pH=7.4
Figure 6.7. Hydrodynamic radius distribution (f(Rh)) of PAA microgel particles
(C=1.32×10⁻⁵ g/mL) in pH=3.2 and pH=7.4 at 250C.

91
6.4 CONCLUSION
The phase transition behavior of the hydroxypropyl cellulose (HPC) and poly(acrylic
acid) complex system in water has been investigated. The LCST of the complex shifted
to much lower temperature than that of the HPC without the PAA as a complaxation
agent at pH=3.2. The decrease of the phase transition temperature is attributed to the
strong hydrogen bonding between the HPC and PAA. The LCST of the complexes
decreased with the increase of the molecular weight of either HPC or PAA. As the pH
value increases from 4.0 to 7.4, the LCST of the HPC-PAA complex decreases. This may
be due to the salt effect of the polyelectrolyte on the non-ionic polymer. The dilute
HPC/PAA aqueous solution at pH=3.2 can form interpolymer complexation near room
temperature, and the associated nanoparticle sizes decreased with increasing temperature.
The complexation between HPC and PAA leads to a new method for the formation of
surfactant-free nanoparticles at room temperature. Formation of PAA gel nanoparticles
in the presence of a small amount of HPC was monitored by LLS and proven by seeing
the size difference of the collapsed and swollen gel nanoparticles at pH higher and lower
than pKa .

92
REFERENCES (1) Bekturov, E. A.; Bimendina, L.A. Adv. Polym. Sci. 1981, 41, 99.
(2) Tshuchi, E; Abe, K. Adv. Polym. Sci. 1982, 45, 1.
(3) Wang, Y.; Morawetz, H. Macromolecules 1989, 22, 164.
(4) Jiang, M.; Li, M.; Xiang, M.; Zhou, H. Adv. Polym. Sci. 1998, 146, 121.
(5) Okano,T. Adv. Polym. Sci. 1993, 110, 179.
(6) Koussathana, M.; Lianos, P; Staikos, G. Macromolocules 1997, 30, 7798.
(7) Huang, X.D.; Goh, S. H. Macromolecules 2000, 33, 8894.
(8) Lele, B.S.; Hoffman, A. S. J. J. Controlled Release 2000, 69, 237.
(9) Dan,Y.; Chen, S. Y.; Zhang, Y. F.; Xiang, F. R. J. Polym. Sci. Part B-Polym.
Phys. 2000, 38, 1069.
(10) Kaczmarek, H.; Szalla, A.; Kaminska, A. Polymer 2001, 42, 6057.
(11) Iliopoulos, I.; Audebert, R. Macromolecules 1991, 24, 2566.
(12) Prevysh, V. A.; Wang, B. C.; Spontak R. S. Coll. Polym. Sci. 1996, 274, 532.
(13) Aoki, T.; Kawashima, M.; Katono, H.; Sanui, K.; Ogata, N.; Okano, T.; Sakurai,
Y. Macromolecules 1994, 27, 947.
(14) Karayanni, K.; Staikos, G. Eur. Polym. J. 2000, 36, 2645.
(15) Gao, J.; Haidar, G.; Lu, X. H.; Hu, Z. B. Macromolecules 2001, 34, 2242.
(16) Harsh, D.C.; Gehrke, S.H. J. Controlled Release 1991, 17, 175.
(17) Lu, X. H.; Hu, Z. B.; Gao, J. Macromolecules 2000, 33, 8698.
(18) Pather; S. I.; Robinson, J. R.; Eichman, J.D.; Khankari, R. K.; Hontz, J.;
Gupte, S.V. US 6391335, 2002.

93
(19) Barkalow, D. G.; Richey, L. C.; Zuehlke, J. W. US 6303159, 2001.
(20) Slepian, M. J.; Massia, S. P. US 6290729, 2001.
(21) Zhou, S.; Chu, B. J. Phys. Chem. B 1998, 102, 1364.
(22) Xue, W.; Hamley, I. Polymer 2002, 43, 3069.
(23) Feil, H.; Bae, Y. H.; Jan, F.; Kim, S. W. Macromolecules, 1993, 26, 2496.
(24) Nikolaeva, O.; Budtova, T.; Alexeev, V.; Frenkel, S. J. Polym. Sci.: Part B:
Polymer Physics 2000, 38, 1323.
(25) Nikolaeva, O. V.; Budtova, T. V.; Kalyuzhnaya, L. M.; Bel'nikevich, N. G.;
Vlasova, E. N.; Frenkel, S. Y. Polymer Science, Ser. A 1999, 41, 771.
(26) Budtova, T. V.; Suleimenov, I. E.; Frenkel, S. Y. J. Polym. Sci.: Part A: Polymer
Chemistry 1994, 32, 281.
(27) Doseva, V; Senkov, S.; Baranovsky, Y. V. Polymer 1997, 38, 1339.
(28) Joshi, A.; Ding, S.; Himmelstein, K. J. US 5252318, 1993.
(29) Staikos, G.; Bokias, G.; Macromol. Chem. 1991, 192, 2649.
(30) Subotic, D. V.; Ferouson, J.; Warren, B. C. H. Eur. Polym. J. 1991, 27, 61.
(31) Budtova, T.; Navard, P. Macromolecules 1996, 29, 3931.
(32) Hu, Z. B.; Lu, X. H.; Gao, J.; Wang, C. Advanced Materials 2000, 12, 1173.
(33) Li, Y.; Wang,G.; Hu, Z. Macromolecules 1995, 28, 4194.
(34) Yu, X.; Tanaka, A.; Tanaka, K.; Tanaka, T. J. Chem. Phys. 1992, 97, 780.
(35) Karlstrom, G.; Carlsson, A.; Lindman, B. J. Phys. Chem. 1990, 94, 5005.
(36) Chen, H.; Morawetz, H. Macromolecules 1985, 18, 1829.
(37) Chen, H.; Morawetz, H. Eur. Polymer 1983, 19, 923.

94
(38) Drummond, C. J.; Albers, S.; Furlong, D. N. Coll. Surf. 1992, 62, 75.
(39) Kriwet, B.; Walter, E.; Kissel, T. J. Controlled Release 1998, 56, 149.
(40) Bouillot, P.; Vincent, B. Colloid Polym. Sci. 2000, 278, 74.

95
CHAPTER 7
CONCLUSION
This dissertation investigates the synthesis and properties of novel polymer hydrogel
nanoparticles and nanostructured hydrogels. The hydrogel nanoparticles include FDA-
approved HPC microgels,1, 2 hydrophilic PVA nanoparticles, 3 monodisperse NIPA-
co-HEAC nanoparticles, 4 surfactant-free hydrophilic PAA microgels. 5 Based on these
nanoparticles, several nanostructed hydrogels3, 4, 6 ,7 were designed. The main
conclusions of this dissertation are described as follows:
(1) HPC microgels have been synthesized for the first time by chemically
crosslinking hydroxypropyl cellulose (HPC) linear macromolecules. 1 The controllable
synthesis parameters – surfactant concentration, HPC concentration and reaction
temperature – were varied to determine the effects on the size and size distribution of
the microgels as monitored using laser light scattering techniques. It was found that the
microgels can form only above the CMC of the DTAB surfactant at the LCST. As the
HPC concentration increases from 0.1 wt% to 0.3 wt%, size distribution becomes
significantly broader. Furthermore, the reaction temperature plays an important role for
the size distribution: upon the increase of the temperature above the LCST, the particle
size increases quickly. The formation of microgels may be explained by the balance
between hydrophobic interactions between HPC polymer chains and inter-micelle
electrostatic repulsion. The swelling and phase transition properties of the resultant
96
HPC microgels are analyzed using both static and dynamic light scattering techniques
as a function of temperature at various crosslinker concentrations. It is found that the
increase in the crosslinker density reduces the shrinkage extent and increases the
transition temperature. The dilute HPC microgel particles with concentration of
8.94×10⁻⁶ g/ml form a stable colloidal dispersion at room temperature and at 44oC
(>Tc), probably due to steric effects. In the aqueous solution of physiological salt
concentration, the phase transition of the HPC microgels occurs at about 39°C, which
corresponds to fever temperature of the human body. Combining the temperature-
responsive volume change, bio-compatibility of the HPC, and uniform and small size,
the HPC microgels could be particularly useful in controlled drug delivery applications.
(2) A new class of nanostructured polymer gel has been synthesized by crosslinking
gel nanoparticles through covalent bonds between functional groups on the surfaces of
neighboring particles in solutions. 3, 6 Thus, these gels have two levels of structural
hierarchy: the primary network is closslinked polymer chains in each nanoparticle,
while the secondary network is crosslinked nanoparticles as a whole. With such a
unique structure, they have new properties that conventional gels do not have, including
high surface area, controlled heterogeneity in the nanoscale, and uniform and easily
tunable mesh sizes. Architectures of nanostructured gels could be easily tailored by
selecting different gel nanoparticles and crosslinking agents. Several applications of gel
nanoparticle networks are presented in this paper, including a nanoparticle network
with a fast shrinking rate, a light scattering-colored nanoparticle network, and a co-
nanoparticle network as a potential multi-functional drug delivery carrier.

97
(3) Hydrogel opals have been synthesized by covalently bonding self-assembled
hydrogel nanoparticles. 4, 7 The covalent bonding contributes to the mechanical and
thermal stability of the assemblies, while self-assembly provides the bulk hydrogels
with crystal structures which diffract light, resulting in colors. Several applications of
crystal hydrogels are presented in this thesis, including a gel sensor whose color can be
tuned by either temperature or an electric field, a gel “opal” that displays a striking
iridescence and is wet and elastic, and a gel display whose iridescent pattern can be
made either visible or invisible by simply switching temperature. This work may lead
to technological applications, ranging from sensors and displays to home decoration.
(4) The phase transition behavior of the hydroxypropyl cellulose (HPC) and
poly(acrylic acid) complex system in water has been investigated. 5 The LCST of the
complex shifted to much lower temperature than that of the HPC without the PAA as a
complaxation agent at pH=3.2. The decrease of the phase transition temperature is
attributed to the strong hydrogen bonding between the HPC and PAA. The LCST of
the complexes decreased with the increase of the molecular weight of either HPC or
PAA. As the pH value increases from 4.0 to 7.4, the LCST of the HPC-PAA complex
decreases. This may be due to the salt effect of the polyelectrolyte on the non-ionic
polymer. The dilute HPC/PAA aqueous solution at pH=3.2 can form interpolymer
complexation around room temperature, and the associated nanoparticle sizes decreased
with increasing temperature. The complexation between HPC and PAA leads to a new
method for the formation of surfactant-free nanospheres at room temperature.
Formation of PAA gel microspheres in the presence of a small amount of HPC was

98
monitored by LLS and proven by seeing the size difference of the collapsed and
swollen gel microspheres at pH higher and lower than pKa .
99
REFERENCES
(1) Lu, X. H.; Hu, Z. B.; Gao, J. Macromolecules 2000, 33, 8698.
(2) Gao, J.; Haidar, G.; Lu, X. H.; Hu, Z. B. Macromolecules 2001, 34, 2242.
(3) Hu, Z.; Lu, X.; Gao, J. Wang, C. Advanced Materials 2000, 12, 1173.
(4) Hu, Z.; Lu, X.; Gao, J. Advanced Materials 2001, 13, 1783.
(5) Lu, X.; Hu, Z.; Schwartz, J. submitted to Macromolecules.
(6) Hu, Z.; Lu, X.; Gao, J. “ Synthesis and uses of polymer gel nanoparticle
network”, U. S. Patent, Disclosure filed (August 2001).
(7) Hu, Z.; Lu, X.; Gao, J. “ Synthesis and composition of crystal hydrogels”
U. S. Patent, Disclosure filed ( November 2001).

100
BIBLIOGRAPHY
(1) Ahlnas, T.; Karlstrom, G.; Lindman, B. J. Phys. Chem. 1987, 91, 4030.
(2) Allcock, H. R.; Lampe, F. W. Contemporary Polymer Chemistry, 2nd edition;
Prentice-Hall, Ins.: New Jersey, 1990.
(3) Anbergen, U.; Oppermann, W. Polymer 1990, 31, 1854.
(4) Antionietti, M.; Pakula, T.; Bremser, W. Macromolecules 1995, 28, 4227.
(5) Aoki, T.; Kawashima, M.; Katono, H.; Sanui, K.; Ogata, N.; Okano, T.; Sakurai Y.
Macromolecules 1994, 27, 947.
(6) Barkalow, D. G.; Richey, L. C.; Zuehlke, J. W. US 6303159, 2001.
(7) Beebe, D. J.; Moore, J. S.; Bauer, J. M.; Yu, Q.; Liu, R. H.; Devadoss, C.;
Jo, B. H. Nature 2000, 404, 588.
(8) Bekturov, E. A.; Bimendina, L.A. Adv. Polym. Sci. 1981, 41, 99.
(9) Berne, B. J.; Pecora, R. Dynamic Light Scattering; John Wiley & Sons, Inc: New
York 1976.
(10) Bouillot, P.: Vincent, B. Colloid Polym. Sci. 2000, 278, 74
(11) Bradna, P.; Quadrat, Q.; Snuparck, J. Colloid Polym. Sci. 1995, 273, 324.
(12) Brown, W. Dynamic Light Scattering; Oxford University Press: Oxford, 1993.
(13) Budtova, T.; Navard, P. Macromolecules 1996, 29, 3931.
(14) Budtova, T. V.; Suleimenov, I. E.; Frenkel, S. Y. J. Polym. Sci.: Part A: Polymer
Chemistry 1994, 32, 281.
(15) Chen, G.; Hoffman, A. S. Nature 1995, 373, 49.
101
(16) Chen, H.; Morawetz, H. Macromolecules 1985, 18, 1829.
(17) Chen, H.; Morawetz, H. Eur. Polymer 1983, 19, 923.
(18) Chu, B. Laser Light Scattering, 2nd ed.; Academic Press: New York, 1991.
(19) Clark, N. A.; Hurd, J.; Ackerson, B. J. Nature 1979, 281, 57.
(20) Dan,Y.; Chen, S. Y.; Zhang, Y. F.; Xiang, F. R. J. Polym. Sci. Part B-Polym.
Phys. 2000, 38, 1069
(21) Doseva, V; Senkov, S.; Baranovsky, Y. V. Polymer 1997, 38, 1339.
(22) Drummond, C. J.; Albers, S.; Furlong, D. N. Colloids Surf. 1992, 62, 75.
(23) Feil, H.; Bae, Y. H.; Jan, F.; Kim, S. W. Macromolecules, 1993, 26, 2496.
(24) Frank, M.; Burchard, W. Makromol. Chem. Rapid Commun. 1991, 12, 64.
(25) Gao, J.; Haidar, G.; Lu, X. H.; Hu, Z. B. Macromolecules 2001, 34, 2242.
(26) Gong, J. P.; Okuzaki, H.; Osada, Y.; Macromol. Chem. Phys. 1994, 195, 1871.
(27) Harsh, D.C.; Gehrke, S. H. J. Controlled Release 1991, 17, 175.
(28) Hellweg, T.; Dewhurst, C. D.; Bruckner, E.; Kratz, K.; Eimer, W. Colloid Polym
Sci. 2000, 278, 972.
(29) Hirotsu, S. Japn. J. Appl. Phys. 1985, 24, 396.
(30) Hirotsu, S.; Hirokawa, Y.; Tanaka, T. J. Chem. Phys. 1987, 87, 1392.
(31) Holtz, J. H.; Asher, S. A. Nature 1997, 389, 829.
(32) Hormnirun, P.; Sirivat, A.; Jamieson, A. M. Polymer 2000, 41, 2127.
(33) Hu, Z.; Chen, Y.; Wang, C.; Zheng, Y.; Li, Y. Nature 1998, 393, 149.
(34) Hu, Z.; Lu, X.; Gao, J.; Wang, C. Advanced Materials 2000, 12, 1173.
(35) Hu, Z.; Lu, X.; Gao, J. Advanced Materials 2001, 13, 1783.

102
(36) Hu, Z.; Lu, X.; Gao, J. “ Synthesis and uses of polymer gel nanoparticle
network”, U. S. Patent, Disclosure filed (August 2001)
(37) Hu, Z.; Lu, X.; Gao, J. “ Synthesis and composition of crystal hydrogels”
U. S. Patent, Disclosure filed ( November 2001)
(38) Hu, Z.; Zhang, X.; Li, Y. Science 1995, 269, 525.
(39) Iliopoulos, I.; Audebert, R. Macromolecules 1991, 24, 2566.
(40) Inomata, H.; Goto, S.; Otake, K.; Saito, S. Langmuir 1992, 8, 687.
(41) Jethmalani, J. M.; Ford, W. T.; Beaucage, G. Langmuir, 1997, 13, 3338.
(42) Jethmalani, J. M.; Sunkara, H. B.; Ford, W. T.; Willoughby, S. L.;
Ackerson, B. J. Langmuir 1997, 13, 2633.
(43) Jiang, M.; Li, M.; Xiang, M.; Zhou, H. Adv. Polym. Sci. 1998, 146, 121.
(44) Joshi, A.; Ding, S.; Himmelstein, K. J. US5252318, 1993.
(45) Kabra, B. G.; Gehrke, S. H.; Spontak, R. J. Macromolecules 1998, 31, 2166.
(46) Kaczmarek, H.; Szalla, A.; Kaminska, A. Polymer 2001, 42, 6057.
(47) Kamenetzky, E. A.; Magliocco, L. G.; Panzer, H. P. Science 1994, 263, 207.
(48) Karlstrom, G. J. Phys. Chem. 1985, 89, 4962.
(49) Karlstrom, G.; Carlsson, A.; Lindman, B. J. Phys.Chem. 1990, 94, 5005.
(50) Kiser, P. F.; Wilson, G.; Needham, D.; Nature 1998, 394, 459.
(51) Koussathana, M.; Lianos, P; Staikos, G. Macromolocules 1997, 30, 7798.
(52) Krieger, I. M.; O’Neill, F. M. J. Amer. Chem. Soc. 1968, 90, 3115.
(53) Kriwet, B.; Walter, E.; Kissel, T. J. Controlled Release 1998, 56, 149.

103
(54) Lashkevich, O. V.; Dyagileva, A. B.; Chernoberezhskii, Y. M. Colloid J. 1997, 59,
467.
(55) Lele, B.S.; Hoffman, A. S. J. J. Controlled Release 2000, 69, 237.
(56) Li, Y.; Tanaka, T. J. Chem. Phys. 1990, 40, 820; J. Chem. Phys. 1990, 92, 1365.
(57) Li, Y.; Wang, G.; Hu, Z. Macromolecules 1995, 28, 4194.
(58) Lu, X.; Hu, Z.; Gao, J. Macromolecules 2000, 33, 8698.
(59) Lu, X.; Hu, Z.; Schwartz, J. submitted to Macromolecules
(60) Murry, M. J.; Snowden, M. J. Adv. Colloid Interf. Sci. 1995, 54, 73.
(61) Neyret, S.; Vincent, B. Polymer 1997, 38, 6129.
(62) Nikolaeva, O.; Budtova, T.; Alexeev, V.; Frenkel, S. J. Polym. Sci.: Part B:
Polymer Physics 2000, 38, 1323.
(63) Okano,T. Adv. Polym. Sci. 1993, 110, 179.
(64) Osada, Y.; Gong, J. P. Adv. Mater. 1998, 10, 827.
(65) Oya, T.; Enoki, T.; Grosberg, A. Y.; Masamune, S.; Sakiyama, T.;
Takeoka, Y.; Tanaka, K.; Wang, G.; Lilmaz, Y.; Feld, M. S.; Dasari,
R.;Tanaka, T. Science 1999, 286, 1543.
(66) Pather; S. I.; Robinson, J. R.; Eichman, J.D.; Khankari, R. K.; Hontz, J.;
Gupte, S.V. US 6391335, 2002.
(67) Pelton, R. Adv. Colloid Interf. Sci. 2000, 85, 1.
(68) Pelton, R.H.; Chibanate, P. Colloids Surf. 1986, 120, 247.
(69) Peppas, N. A. Hydrogels in Medicine and Pharmacy, CRC Press: FL, 1987.
(70) Peppas, N. A.; Langer, R. Science 1994, 263, 1715.

104
(71) Prevysh, V. A.; Wang, B. C.; Spontak R. S. Coll. Polym. Sci. 1996, 274, 532.
(72) Pusey, P. N.; van Megen, B. Nature 1986, 320, 340.
(73) Sahoo, S. K.; De, T. K.; Ghosh, P. K.; Maitra, A. J. Coll. Interf. Sci. 1998, 206,
361.
(74) Sanders, J. V. Nature 1964, 204, 1151.
(75) Sasa, N.; Yamaoks, T. Adv. Mater. 1994, 6, 417.
(76) Saunders, B. R.; Vincent, B. Adv. Colloid Interf. Sci. 1999, 80, 1.
(77) Schild, H. G. Prog. Polym. Sci. 1992, 17, 163.
(78) Senff, H.; Richtering, W. J. Chem. Phys. 1999, 111, 1705.
(79) Siegel, R. A.; Firestone, B. A. Macromolecules 1988, 21, 3254.
(80) Slepian, M. J.; Massia, S. P. US 6290729, 2001.
(81) Staikos, G.; Bokias, G.; Macromol. Chem. 1991, 192, 2649.
(82) Subotic, D. V.; Ferouson, J.; Warren, B. C. H. Eur. Polym. J. 1991, 27, 61.
(83) Tanaka, T. Phys. Rev. Lett. 1978, 40, 820.
(84) Tanaka, T. Experimental Methods in Polymer Science; Academic Press, 2000.
(85) Tanaka, T.; Nishio, I.; Sun, S. T.; Ueno-Nishio, S. Science 1982, 218, 467.
(86) Tshuchi, E; Abe, K. Adv. Polym. Sci. 1982, 45, 1
(87) Wang, Y.; Morawetz, H. Macromolecules 1989, 22, 164.
(88) Weissman, J. M.; Sunkara, H. B.; Tse, A. S.; S. A. Asher, Science
1996, 274, 959.
(89) Winnik, F.M.; Tamai, N.; Yonezawa, J.; Nishimura, Y.; Yamazaki, I. J. Phys.
Chem. 1992, 96, 1967.
105
(90) Wu, C. Polymer 1998, 39, 4609.
(91) Wu, C.; Chan, K. K.; Xia, K. Q. Macromolecules 1995, 28, 1032.
(92) Xia, Y.; Gates, B.; Yin, Y.; Lu, Y. Adv. Mater. 2000, 12, 693.
(93) Xia, Y. Adv. Mater. 2001, 13, 369.
(94) Xue, W.; Hamley, I. Polymer 2002, 43, 3069.
(95) Yoshida, R.; Takahashi, T.; Ichijo, H. Adv. Mater. 1997, 9, 175.
(96) Yoshida, R.; Uchida, K.; Kaneko, Y.; Sakal, K.; Kikuchi, A.; Sakurai, Y.; Okano,
T. Nature 1995, 374, 240.
(97) Zhang, G.; Wu, C. J. Am. Chem. Soc. 2001, 123, 1376.
(98) Zhou, S; Chu, B. J. Phys. Chem. 1998, 102, 1364.