pollution incidents · 2 main facts in 2015, there were 499 serious pollution incidents: 19% fewer...
TRANSCRIPT
www.gov.uk/environment-agency
Pollution incidents 2015 evidence summary September 2016
This report summarises Environment Agency statistics on serious pollution incidents in England for the calendar year 2015. It provides information on their impact on the environment and the sectors responsible.
We classify pollution incidents according to their impact on the environment and people, from category 1 (the most serious) to category 4 (little or no impact) and the level of response needed. We investigate reported pollution incidents on a risk basis to limit their impact and, where appropriate, we take action against those responsible for the pollution.
Serious pollution incidents can harm people and the environment as well as damage businesses and affect recreational activities such as angling. A serious incident can have a significant financial impact on a business in clean-up and enforcement costs, and claims for damages from third parties. Pollution incidents can damage the reputation of businesses and can affect their ability to secure contracts or subsidies.
The Environment Agency spends about £12 million a year in time and materials responding to pollution incidents to reduce harm. Our officers investigate the causes of serious pollution incidents to help determine the sectors (types of businesses) or activities we should focus our efforts on, and identify areas for businesses to improve. We also monitor pollution incidents through sector performance reports. These are used to engage with industry, disseminate lessons learnt, share best practice, and target improvement actions.
This summary is about the most serious pollution incidents, categories 1 and 2. It makes a distinction between sites or activities we regulate under the Environmental Permitting Regulations 2010 (EPR), referred to in the summary as permitted sites or activities, and those that we don’t. The activities of some of the industries and businesses that we don’t permit under EPR will be regulated under other legislation. For example, activities may be regulated under the Water Resources Act or monitored under the Water Framework Directive.
The data in this summary was extracted on 1 April 2016. The underlying database is live and data retrieved in any future extract may be different.

2
www.gov.uk/environment-agency
Main facts
In 2015, there were 499 serious pollution incidents:
19% fewer than in 2014
42% fewer than in 2005
56% fewer than in 2000
325 (65%) affected the water environment, compared to 360 (59%) in 2014
97 (19%) affected air, compared to 199 (32%) in 2014
The source of most (57%) serious pollution incidents are sites or activities that we do not regulate under the Environmental Permitting Regulations.
Since 2014, the number of serious pollution incidents:
caused by activities with permits decreased by 32%
caused by non-permitted activities increased by 22%
where we could not identify the source decreased by 65%
In 2015, the top 5 industry sectors causing pollution incidents were:
farming (whole sector); 87
water companies; 59
biowaste treatment activities with permits; 32
non-hazardous waste treatment activities with permits; 29
waste treatment (metals recycling) activities with permits; 12
Between 2014 and 2015, serious incidents caused by the landfill sector decreased by 71%.
The biowaste treatment sector caused the largest number of pollution incidents per 100 permits.

3
www.gov.uk/environment-agency
Increased investment and improved management by businesses, as well as our regulatory work and pollution incident reduction initiatives, has helped reduce the numbers of serious incidents that occur each year.
In 2015 there were 499 serious pollution incidents; 42% fewer than in 2005, and 56% fewer than in 2000.
Since 2014, there has been a:
19% decrease in the total number of pollution incidents (614 incidents in 2014)
32% decrease in incidents caused by activities with permits (249 incidents in 2014 and 170 in 2015)
22% increase in the number of incidents caused by non-permitted activities (232 incidents in 2014 and 283 in 2015)
65% decrease in incidents attributed to unidentified sites or activities (133 incidents in 2014 and 46 in 2015)
Within the period 2010 to 2015, serious incidents caused by activities with permits reached a high of 323 incidents in 2013. This was partly due to changes in the way we recorded incidents. Since then, targeted work by the Environment Agency has reduced the numbers of serious incidents even with these changes in effect.
Over the last few years, the number of pollution incidents caused by non-permitted activities has been increasing. Part of the increase between 2014 and 2015 may be due to improvements in the way we attribute sources of pollution incidents in our data that previously would have been described as ‘unidentified’.
For the 2015 data, we used more of the data fields than in previous years. This helped us determine whether we could apply some level of description about a source or whether it was truly unidentifiable. For example, in some cases we can say that a source was definitely a non-permitted source, even if we don’t know much more than that, rather than it was unidentified, which might be either permitted or non-permitted. As a result, we’ve attributed more incidents to natural causes and illegal activities; part of the ‘non-permitted’ group. This has decreased the number of incidents in ‘unidentified’ sources, and may be one of the reasons for the considerable changes in these categories.

4
www.gov.uk/environment-agency
The impact of pollution incidents
We record whether pollution incidents affect air, land or water. A single incident may affect one or more of these environmental media.
In 2015, 65% of all serious pollution incidents affected the water environment, 19% affected air and 21% affected land. This summary focusses mainly on incidents that affect water and air; the water environment is consistently affected by the highest numbers of serious pollution incidents, and there has been substantial public concern about incidents affecting air in recent years.
Incidents affecting water
In 2015, 325 serious pollution incidents affected the water environment:
the total number decreased by 10% compared to 2014 (360 incidents)
65% of all serious pollution incidents affected water - in 2014 and 2013, this was 59% and 53% respectively
activities with permits caused 26%, non-permitted activities caused 61% and in 13% of incidents affecting water we were unable to identify the source
The sectors responsible for the largest numbers of incidents affecting water were:
farming; 81 incidents, mostly caused by non-permitted activities
the water industry; 62 incidents, mostly caused by permitted activities
Note: In this report the term ‘water companies’ is used to refer to the 9 water and sewerage companies operating mainly in England. Their incidents are all classed as being caused by activities with permits. Where we refer to ‘water industry’ we include incidents attributed to water-related activities that are not the responsibility of a water company and are non-permitted activities. For example, an incident related to a private septic tank.

5
www.gov.uk/environment-agency
The biggest cause of incidents affecting water were containment and control failures (169 of 325 incidents, 52%). This continues the trend of previous years. It includes incidents caused by abnormal process operations, pipe failures, spillages, plant failures, control system or measure failures, sewer failures or overflows and storage tank failures. Containment and control failures on farms were the single largest cause of incidents affecting water (54 incidents) followed by those associated with the water industry (46 incidents).
Unauthorised activities at non-permitted sites caused 35 serious incidents. These activities could include:
unauthorised discharge or disposal, including where pipework is wrongly connected and discharges to a surface water drain or a river instead of a foul water drain or sewer (often referred to as a ‘misconnection’)
illegally dumping rubbish or polluting materials, for example animal slurries
vandalism
‘Authorised’ activities causing pollution incidents could include incidents inadvertently caused during operation of normal site activities, consented in-river works (such as flood defence works) and emergency discharges.
There were also 34 serious incidents in 2015 attributed to natural causes - dry weather, algal activity, extreme weather conditions or other natural processes.

6
www.gov.uk/environment-agency
Incidents affecting air
In 2015, 97 serious incidents affected air:
the total number decreased by 51% compared to 2014 (199 incidents)
19% of all serious pollution incidents affected air - in 2014 and 2013, this was 32% and 33% respectively
activities with permits caused 71% and non-permitted activities caused 29%
87% of the serious incidents affecting air caused by activities with permits involved the amenity pollutants odour, smoke, dust or noise
there were 65% fewer odour-related incidents than in 2014 and 28% fewer noise-related incidents
Not all air pollution incidents are amenity-related, even if they involve, for example, fires and smoke. Amenity incidents have a significant impact on people in the vicinity.
The sectors responsible for causing the largest numbers of incidents affecting air were:
non-hazardous waste treatment; 28 incidents, mostly caused by permitted activities
biowaste treatment; 20 incidents, all caused by permitted activities
The most common cause of incidents affecting air were containment and control failures (31 of 97, 32%), followed by authorised activities (21 incidents, 22%), and fires (20 incidents, 21%). Illegal waste activities caused 11 incidents, 4 of which were fire-related.

7
www.gov.uk/environment-agency
Factors contributing to pollution incidents at waste sites include poor management, design or maintenance. In particular, amounts of waste being treated on a site in excess of the site capacity, or involving poor storage arrangements, can cause problems.
‘Waste management activities’ collectively includes waste treatment (all sub sectors), landfill, biowaste (treatment and use) and the incineration with energy recovery sectors. In 2015, waste management activities accounted for 59 of the 60 amenity-related incidents caused by activities with permits. Of those, 33 involved odour.
We have been focussing regulatory efforts on amenity-related issues, such as odour and noise. We have identified problematic sites to help resolve these issues. There were substantial reductions in odour and noise complaints in 2014 and 2015, as well as a downward trend in the incidents attributed to each of the amenity pollutants since 2013.
In May 2013, we changed our approach to classifying ongoing amenity incidents. This made it easier to substantiate incidents, particularly odour incidents, and to deal with ongoing amenity incidents involving multiple reports as a single incident with a higher severity level. This raised the impact level of some incidents to category 2, when they would have previously been reported as a number of category 3 events and led to a significant rise in the number of category 1 or 2 odour incidents recorded in 2013. Numbers of incidents in 2014 and 2015 have decreased despite this change in approach.
Incidents affecting land
In 2015, 107 serious pollution incidents affected land:
the total number of serious incidents affecting land increased by 19 (22%) compared to 2014 (88 incidents)
21% of all serious pollution incidents affected land - in 2014 and 2013, this was 14% and 19% respectively
activities with permits caused 22%, non-permitted activities caused 74% and in 4% of incidents affecting land, we were unable to identify the source

8
www.gov.uk/environment-agency
Of the 107 incidents:
29% were caused by illegal activities
19% were caused by waste treatment (non-hazardous and metals recycling) activities
15% were caused by non-industrial activities including domestic and residential, natural causes, public administration, the service sector and transport
8% were caused by biowaste activities
Just over half (51%) of the incidents were a result of unauthorised activities, 21% were caused by containment and control failures and 11% (12 incidents) were fires.
Sources of serious pollution incidents
Non-permitted activities
Non-permitted activities caused 283 serious pollution incidents in 2015. This was 57% of all serious pollution incidents, compared to 38% in 2014 and 45% in 2005.
There was a 22% increase in serious pollution incidents caused by non-permitted activities between 2014 and 2015 (232 in 2014). Over the longer term, serious pollution incidents caused by non-permitted activities have decreased by 28% since 2005.
In 2015:
non-permitted farming activities were the biggest single source of incidents; 85 incidents (similar to 2014; 87 incidents)
the number of incidents caused by non-permitted waste management facilities increased by 9% compared with 2014 (22 incidents in 2014 and 24 in 2015)

9
www.gov.uk/environment-agency
other non-permitted industry caused 9% fewer incidents in 2015, in part due to a 13% decrease in the number of incidents from manufacturing industries (24 incidents in 2014 and 21 in 2015)
In 2015 ‘other’ non-permitted sources caused 135 incidents, an increase of 69% compared with 2014. ‘Other’ non-permitted sources are illegal waste activities, exempt waste activities, natural sources, transport, domestic and residential, public administration and the service sector. Within this group, the most common incidents were attributed to:
natural causes (39 incidents)
illegal waste activities, for example large-scale fly-tipping, illegal waste transfer stations, illegal landfilling or construction involving wastes or fires (39 incidents)
incidents caused by the service sector (24 incidents)
The most common causes of incidents from non-permitted activities in 2015 were:
containment and control failures, such as abnormal process operations, pipe failures, spillages, plant failures, control system/measure failures, sewer failures or overflow and storage tank failures (40% of incidents)
unauthorised activities, for example, unauthorised discharge or disposal, fly-tipping, illegal waste site activity and vandalism (31% of incidents)
Permitted activities
Activities with permits caused 170 serious pollution incidents in 2015. This was 34% of all serious pollution incidents in 2015, compared with 41% in 2014. Serious pollution incidents caused by activities with permits decreased by 32% between 2014 and 2015 (249 incidents in 2014 and 170 in 2015).
The sectors causing the most incidents were water companies (59 incidents), biowaste treatment (32 incidents), and non-hazardous waste treatment (29 incidents). However, each of these sectors caused fewer serious incidents in 2015 than in 2014. Waste management activities collectively caused 94 incidents, 55% of the total caused by activities with permits.
The biggest change occurred within the landfill sector, which caused 10 incidents in 2015 compared with 34 in 2014; a 71% decrease. This takes the landfill sector out of the ‘top 5’ sectors responsible for causing the highest numbers of pollution incidents.
The reduction in pollution incidents caused by the landfill sector are partly a result of in-depth investigations into the causes of the incidents. This showed that most were attributable to inadequate landfill gas and/or leachate control. We used the findings to develop pollution incident reduction plans, including detailed technical reviews of gas management systems. And we focused on sites where gas management was falling below the standards set out in industry best practice guidance. We have also reviewed permits in the sector to introduce more robust conditions for the management of landfill gas and leachate.

10
www.gov.uk/environment-agency
The decrease in the number of incidents caused by the non-hazardous waste treatment sector was almost as many as in the landfill sector (22 fewer incidents caused by non-hazardous waste treatment in 2015, a decrease of 43% compared to the 2014 total).
Within the group of sectors comprising ‘other permitted industry’, the other large decreases in serious pollution incidents were in:
intensive farming (2 incidents in 2015 compared with 10 in 2014)
food and drink (3 incidents in 2015 compared with 13 in 2014)
metals (1 incident in 2015 compared with 4 in 2014)
The sectors that reduced their serious incidents to zero in 2015 were chemicals (from 4 incidents in 2014) and hazardous waste treatment (from 6 incidents in 2014).
The sectors causing no serious incidents in the 3 years 2013 to 2015 were onshore oil and gas, textiles and non-ferrous metals. Those that caused just one incident in those 3 years were refineries and fuels, paper and pulp, and cement and minerals.
The single biggest cause of incidents at sites with permits was containment and control failures (95 of 170 incidents, 56%).

11
www.gov.uk/environment-agency
The number of pollution incidents caused by a particular sector can be affected by the number of sites in that sector. The number of incidents caused per 100 permits takes account of this and the changing size of the permitted sector.
The number of incidents caused per 100 permits has almost halved since 2014.
The number of incidents per 100 permits for individual sectors, averaged over 3 years (2013 to 2015, inclusive), indicates the sectors that proportionately cause the most incidents compared with their overall size.
In this assessment, the number of permits held by a sector is used to give an approximation of its size. A 3-year average is used because in any single year a sector with a small number of facilities, just one of which causes a pollution incident, will appear disproportionately. Sectors that are not shown have fewer numbers of incidents, or fewer per 100 permits, than those shown.
Unidentified sources
Unidentified sources caused 46 serious pollution incidents in 2015. This is 9% of all serious pollution incidents, compared to 22% in 2014 and 45% in 2005.
There was a 65% decrease in serious pollution incidents caused by unidentified sources between 2014 and 2015 (133 in 2014). This is partly due to improvements in the way we attribute incidents.1
1 See the text on page 3 in this document for further information.
12
www.gov.uk/environment-agency
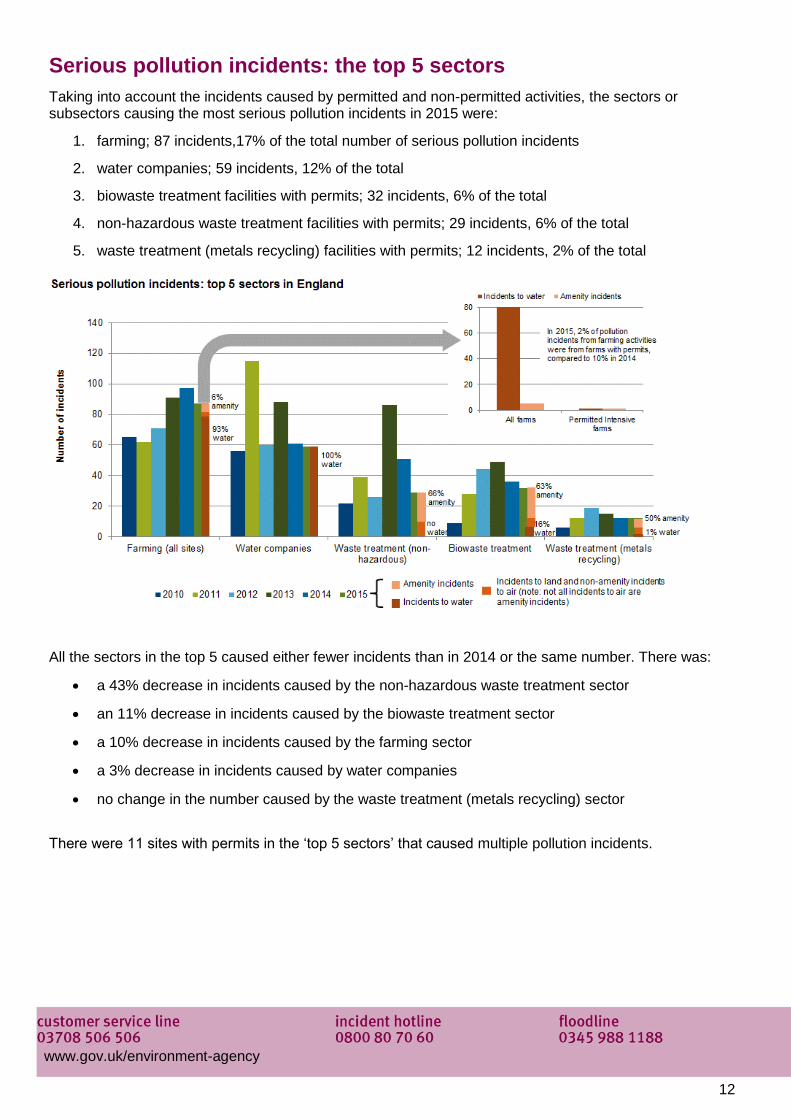
Serious pollution incidents: the top 5 sectors
Taking into account the incidents caused by permitted and non-permitted activities, the sectors or subsectors causing the most serious pollution incidents in 2015 were:
1. farming; 87 incidents,17% of the total number of serious pollution incidents
2. water companies; 59 incidents, 12% of the total
3. biowaste treatment facilities with permits; 32 incidents, 6% of the total
4. non-hazardous waste treatment facilities with permits; 29 incidents, 6% of the total
5. waste treatment (metals recycling) facilities with permits; 12 incidents, 2% of the total
All the sectors in the top 5 caused either fewer incidents than in 2014 or the same number. There was:
a 43% decrease in incidents caused by the non-hazardous waste treatment sector
an 11% decrease in incidents caused by the biowaste treatment sector
a 10% decrease in incidents caused by the farming sector
a 3% decrease in incidents caused by water companies
no change in the number caused by the waste treatment (metals recycling) sector
There were 11 sites with permits in the ‘top 5 sectors’ that caused multiple pollution incidents.

13
www.gov.uk/environment-agency
Sector 1: Farming
The whole farming sector caused a total of 87 serious incidents in 2015; 85 (98%) caused by non-permitted farming activities, and 2 caused by activities with EPR permits (intensive pig and poultry farms). Within the sector, most incidents were caused by dairy activities followed by arable.
Between 2014 and 2015, incidents caused by the whole farming sector decreased by 10% (from 97 incidents to 87). This was mainly due to a reduction in incidents caused by permitted intensive farming activities; from 10 incidents in 2014 to 2 in 2015.
The majority (93%) of farming-related pollution incidents in 2015 affected the water environment. The most common reason for these incidents were containment and control failures, and were the cause of:
71% of the incidents attributed to dairy farming activities
69% of the incidents attributed to arable farming activities
Slurry and silage handling or storage was implicated in nearly half the dairy incidents in 2015, and may indicate safe management of these materials is a problem.
We target our activities towards highlighting risks, addressing issues before they become incidents and working to influence the sector through initiatives such as catchment sensitive farming.2
Only intensive pig and poultry farms are regulated under EPR, and they comprise less than 1% of farm businesses overall. The remainder of farm businesses, by far the majority, are subject to other legislation such as the Water Resources Act, Silage, Slurry and Agricultural Fuel Oil regulations, and the Water Framework Directive. Since 2005, farmers who receive subsidy payments must comply with a number of specific legal and husbandry requirements, known as cross-compliance, in order to receive their payments in full. As the competent enforcement authority, we check for compliance during farm visits and report farms that are non-compliant to the Rural Payments Agency.
Sector 2: Water companies
In 2015, water company activities were responsible for 59 (35%) of the total serious pollution incidents caused by activities with permits. All 59 affected water and 3 of the 59 were also recorded as having an impact on land.
The water companies’ record of pollution incidents is variable, but it caused fewer than half the incidents in 2015 than it did in 2005 (135 incidents).
The majority of serious pollution incidents caused by water companies in 2015 were on the sewer network (42 of 59, 71%). The network includes foul sewers, rising mains, combined sewer overflows, storm tanks
2 See the Defra report ‘Agriculture in the United Kingdom 2015’ (www.gov.uk/government/statistics/agriculture-in-the-united-kingdom-2015).

14
www.gov.uk/environment-agency
and pumping stations. Most of these incidents were due to containment and control failures (34 of 42 incidents, 81%).
The biggest changes in the distribution of incidents caused by water companies in 2015 compared with 2014 were:
an increase in the number of incidents caused by water and surface water related premises (1 incident in 2014 and 8 in 2015)
a 44% decrease in the number of incidents caused by sewage treatment works (16 incidents in 2014 and 9 in 2015) - serious pollution incidents at sewage treatment works also decreased substantially between 2013 (27 incidents) and 2014 (16 incidents)
Following the increase in serious incidents in 2013, we requested each company to produce an action plan to understand and reverse the increase. There was no common root-cause identified, with causes varying between companies. Key factors included inadequate monitoring and management, shortcomings in risk assessments, operational practice and staff culture.
Companies' action plans include projects to assess the risk each asset poses to the environment, enabling prioritisation of maintenance and upgrades. Some companies are training their staff and facilitating more predictive and proactive approaches to identifying potential incidents early and achieving solutions. This includes transparent reporting and mitigation of potential problems to ensure action is taken before an incident occurs. It also includes empowering staff to find solutions and making sure any lessons learnt are implemented right across the company. We continue to work with companies to ensure they have sufficiently ambitious, effective plans in place and achieve timely results.
Sectors 3 to 5: biowaste treatment, non-hazardous waste treatment and waste treatment (metals recycling)
The biowaste treatment, non-hazardous waste treatment and waste treatment (metals recycling) sectors together account for 73 of 170 incidents from permitted activities (43%). Of these 73 incidents; 53 affected air (73%), 17 affected land (23%), and 45 were air-amenity related incidents. Of the amenity incidents, 22 (49%) were odour-related, mainly caused by the biowaste treatment sector, and 13 (29%) were noise-related; 6 caused by non-hazardous waste treatment, 4 by waste treatment (metals recycling), and 3 by biowaste treatment.

15
www.gov.uk/environment-agency
Serious pollution incidents caused by permitted biowaste treatment activities are the lowest recorded since 2011, despite a 73% increase in the number of permits over the same period. The sector still causes the largest number of pollution incidents per 100 permits.
The total number of permits in this sector is still rising, reflecting continuing growth. The largest increases in the number of permits held for biowaste treatment activities between 2014 and 2015 were for anaerobic digestion and aerobic mechanical and biological treatment (MBT); 71% and 32% respectively.
Pollution incidents caused by anaerobic digestion activities increased by 50% over this period. MBT, an emerging form of waste treatment in the sector, caused just under a third of all the biowaste treatment incidents in 2015.
In contrast, the number of pollution incidents caused by composting activities decreased by 74% between 2014 and 2015. The number of permits held for composting activities increased by 8% during this period.
Measures being taken in the biowaste sector to reduce incidents include:
targeted audits to identify root-cause failings
working with the industry towards improved standards of operation and best practice
training staff to recognise issues quickly and developing tools to support compliance and incident assessment
The number of permits in the waste treatment (metals recycling) and non-hazardous waste treatment sectors both decreased slightly in 2015; by 1.9% and 2.4% respectively.

16
www.gov.uk/environment-agency
In the waste treatment (metals recycling) sector, 2 sites caused 7 incidents in 2015, along with an increase in noise-related impacts. But the number of explosions caused by the sector has decreased as most sites have now fitted pre-shredders and are being re-permitted under the Industrial Emissions Directive.
Tackling pollution incidents Sector approach
We work to build a proactive preventative approach with each sector. For example:
sector specific permit conditions which make key technical requirements mandatory
a sector account management approach for the worst performing businesses; this is usually for larger businesses rather than small or medium enterprises, but we have account managers for each of the 9 water companies3, not just poor performers
an annual compliance audit programme (focussed on one aspect in the sector each year)
detailed sector specific technical guidance
engaging with operators on reviewing incidents, learning lessons and sharing best practice
working with trade associations nationally to highlight pollution incident issues and mitigating actions for the sites or activities they represent but that we may not regulate
pollution prevention or incident reduction campaigns; these vary from specific campaigns for certain types of site or geographical location, to national press releases
Working with others
Alongside our work with sectors, we also work with other organisations to help prevent and mitigate incidents when they happen. We provide £200,000 of essential pollution incident response equipment, such as drain blockers and oil and chemical absorbent pads, to the Fire and Rescue Service every year so they can protect the environment as part of their incident response. We have also worked with Highways England to influence the design of pollution control devices on roads to help reduce the effect run-off and spills caused by road-related incidents can have on nearby watercourses. We work in partnership with rivers trusts, wildlife trusts, community wardens, local campaigns and projects such as the Oil Care Campaign4, Yellow Fish5 and Connectright6 to help prevent water pollution incidents.
These initiatives help to protect drinking water supplies, wildlife, bathing waters, fisheries and the wider amenity value of our rivers. Through our partnerships with others including Network Rail, the Oil Care Campaign, the Energy Networks Association, the British Safety Industry Federation and BASIS7 we endeavour to help businesses grow without damaging our environment.
3 See our ‘Water and sewerage companies’ performance: 2015 summary’ (www.gov.uk/government/publications/water-and-sewerage-companies-in-england-environmental-performance-report) 4 The Oil Care Campaign (OCC) works to provide businesses and home owners with information to store oil safely and dispose of used oil legally (www.oilcare.org.uk) 5 See ‘Avoiding pollution: Yellow Fish’ (www.gov.uk/government/publications/avoiding-pollution-yellow-fish-scheme). 6 Connectright is a partnership of organisations that are working to reduce water pollution and flood risk caused by wrongly connected drains or misconnections (www.connectright.org.uk) 7 BASIS are independent assessors of legal and good practice compliance for pesticide sale or supply. (www.basis-reg.co.uk).

17
www.gov.uk/environment-agency
Targeting poor performers
Opra is a risk-screening tool that we use in our work to regulate operators. It includes looking at the hazards associated with an activity and how well they are being managed. By knowing the environmental risk, we can then target our resources on the higher risk sites.
The majority (72%) of serious pollution incidents caused by activities with permits in 2015 were at sites with an Opra compliance band of D, E or F (poorer performance).
If an operator has a poor compliance record or for example convictions, we may revoke their permit. We are also applying more stringent checks when issuing permits to prevent poorly qualified individuals becoming permitted operators. The proportion of serious pollution incidents caused by activities at sites with an Opra compliance band of D, E or F has steadily reduced in the last 3 years (2013, 2014 and 2015).
Sites of high public interest
We designate certain facilities as sites of high public interest (SHPI) to ensure adequate focus is given to address the concerns of local communities. We focus regulatory action on sectors and individual sites causing multiple pollution incidents or where we see persistent non-compliance.
Excluding water companies because they are not rated under Opra, in 2014 there were 20 serious pollution incidents caused by 10 individual sites designated as SHPI. In 2015 there were 3 serious pollution incidents caused by 2 individual sites designated as SHPI. However, changes in the selection criteria used to designate SHPI may have contributed to the decrease in the number of SHPI in 2015 compared to 2014. Both sites were in the ‘top 5 sectors’ (1 in the biowaste treatment sector and 1 in the non-hazardous waste treatment sector) and were in Opra compliance bands E (the non-hazardous waste treatment site) and F (the biowaste treatment site).
Illegal sites
Where pollution incidents help to identify illegal activities on a site we can target those sites as part of our waste crime work. We have a target to stop illegal activity at 45% of newly discovered illegal waste sites within 90 days. During the financial year April 2015 to March 2016, nationally we exceeded this target and stopped illegal activity at more than 50% of new sites within 90 days.8
Enforcement activity
To cause or allow pollution is against the law under, for example, the Environmental Protection Act 1990, Water Resources Act 1991 and Environmental Permitting Regulations 2010. We will prosecute serious or persistent offenders, but there are other enforcement actions we may take if a pollution incident does happen.
8 See our ‘Regulating the waste industry: 2015 evidence summary’ (www.gov.uk/government/publications/regulating-the-waste-industry-2015-evidence-summary)

18
www.gov.uk/environment-agency
These include:
cautions; intended to deter offenders, and suitable for cases where, although we could prosecute, there are other factors that we take into account
enforcement notices; used to bring sites we permit back into compliance and put right any damage caused to the environment
civil sanctions; most commonly enforcement undertakings, seeking to change offenders’ behaviour by paying to clean up the damage caused and improve the environment, rather than paying fines
Prosecution includes seeking orders under the Proceeds of Crime Act 2002 (PoCA), which allows for the confiscation and payment to the State of benefits identified as proceeds of crime. The Environment Agency applies for confiscation orders post-conviction and has had considerable success in recovering unlawful profits from illegal operators and cases where lower costs due to poor practice undercut legitimate business. In this way £1.4 million was confiscated from 25 defendants in 2014, and almost £0.9 million from 7 defendants in 2015.
One offender running a waste transfer facility on farmland illegally depositing, sorting and storing mixed household and industrial waste was ordered to pay £350,000. And a company operating a regulated waste facility for the deposit and disposal of waste without being authorised was ordered to repay almost £250,000.
Guidelines on the sentencing of environmental offences were issued to criminal courts in 2014 by the Sentencing Council. For the first time, a tariff has been provided to indicate the right level of penalties dependent upon the seriousness of the offence and the turnover and profit of the organisation involved. This has led to a significant increase in the size of fines imposed on larger organisations. In 2015, the top 3 fines imposed on larger companies were £750,000, almost £500,000 and £480,000, all for water pollution incidents.
LIT 10487