policy options for environmental pollution ontrol...
TRANSCRIPT

POLICY OPTIONS FOR ENVIRONMENTAL POLLUTION CONTROL
INCLUDING A CASE STUDY: ROAD TRANSPORT ALTERNATIVES
Prepared by Kellyn RothSustainable Energy ESD166J
May 1, 2001

TABLE OF CONTENTS
1. Introduction..................................................................................................................... 12.Command and Control regulation ........................................................................................ 2
2.1 Technology-based Standards .................................................................................... 22.2 Performance-based Standards ................................................................................... 32.3 Command and Control Summary ............................................................................. 3
3. Economic-incentive-based (Market-based) Policy Instruments ..................................... 43.1 Pollution Charge Systems ......................................................................................... 5
3.1.1 Fiscal Instruments/Taxes ................................................................................... 53.1.2 Financial Instruments/Subsidies ........................................................................ 73.1.3 Bonds and Deposit-refund Systems ................................................................... 8
3.2 Market Creation/Marketable Allowances/Tradable Permits .................................... 83.3 Market Barrier Reductions........................................................................................ 93.4 Education Programs/Public Disclosure................................................................... 103.5 Property Rights ....................................................................................................... 113.6 Liability Rules......................................................................................................... 113.7 Government Subsidy Reductions............................................................................ 11
4. Non-Regulated Programs ................................................................................................. 124.1 Voluntary Regulation.............................................................................................. 134.2 Informal Regulation ................................................................................................ 13
5. Analysis of Policy Instruments.......................................................................................... 13ROAD TRANSPORT....................................................................................................... 156. History – CAFE ............................................................................................................ 15
6.1 Price Effect Versus CAFE ...................................................................................... 166.2 Vehicle Choice Effects ........................................................................................... 186.3 Vehicle Scrappage Rates......................................................................................... 216.4 Competition/Economic Loss................................................................................... 226.5 Rebound Effect ....................................................................................................... 236.6 Imperfect Information............................................................................................. 236.7 Oligopoly ................................................................................................................ 24
7. Future Trends – CAFE.................................................................................................. 248. Alternative Policy Options............................................................................................ 25
8.2 Other Taxes............................................................................................................. 268.2.1 Fuel Tax ........................................................................................................... 268.2.2 Other Tax Forms .............................................................................................. 27
8.3 Other Instruments.................................................................................................... 289. Conclusions – Road Transport...................................................................................... 29Works Cited ...................................................................................................................... 32Appendix........................................................................................................................... 35
Policy Options for Environmental Pollution Control, Roth Page 1
1. INTRODUCTION
It can be assumed that some level of government intervention to meet environmental and welfareneeds of society is desirable. The question is, then, to determine what level of intervention andwhat method of implementation. Level can be used to represent level of standards – the level ofacceptable risk, or the level of government intervention – local, state or federal. This paper willnot attempt to describe or analyze the former obligation of regulators – the establishment of anacceptable level of risk (which would differ if determined based on science or economics) andwill only indirectly address the latter – the benefit of local, state or federal policies. Assumingthese levels can be and have been determined and that it is not zero, regulators also have to usethe appropriate and effective mechanism to impose, monitor and enforce this regulation.
During the past 25 years, the United States has primarily enacted environmental regulations thatare classified as command and control – a certain level of emissions or type of control technologyis specified. Several studies have shown that these regulations may be reaching a point ofdiminishing returns. Improvements in health and environmental risk reduction are possible onlythrough large increases in control costs.
Any method that cannot be classified as zero-risk or technology-based is a balancing approach.Benefits and risk reduction as well as costs must be considered in evaluating the correct level ofcontrol and regulation. Moving to these types of policies places regulators in a difficult positionand requires difficult decisions to be made. Simply justifying this balance – between health and afirm’s economic success – is difficult. However, it must be considered that forcing companies tospent excessive amounts of funding and resources for pollution control may cost citizens morethan health. The financial returns of these companies, and the costs they spend on pollutioncontrol are eventually passed on to consumers. Reduced income of consumers translated to lessspending on goods and services they value. At some level of control, protection of health poses acost to society of forgone health, education, shelter or other valued things.
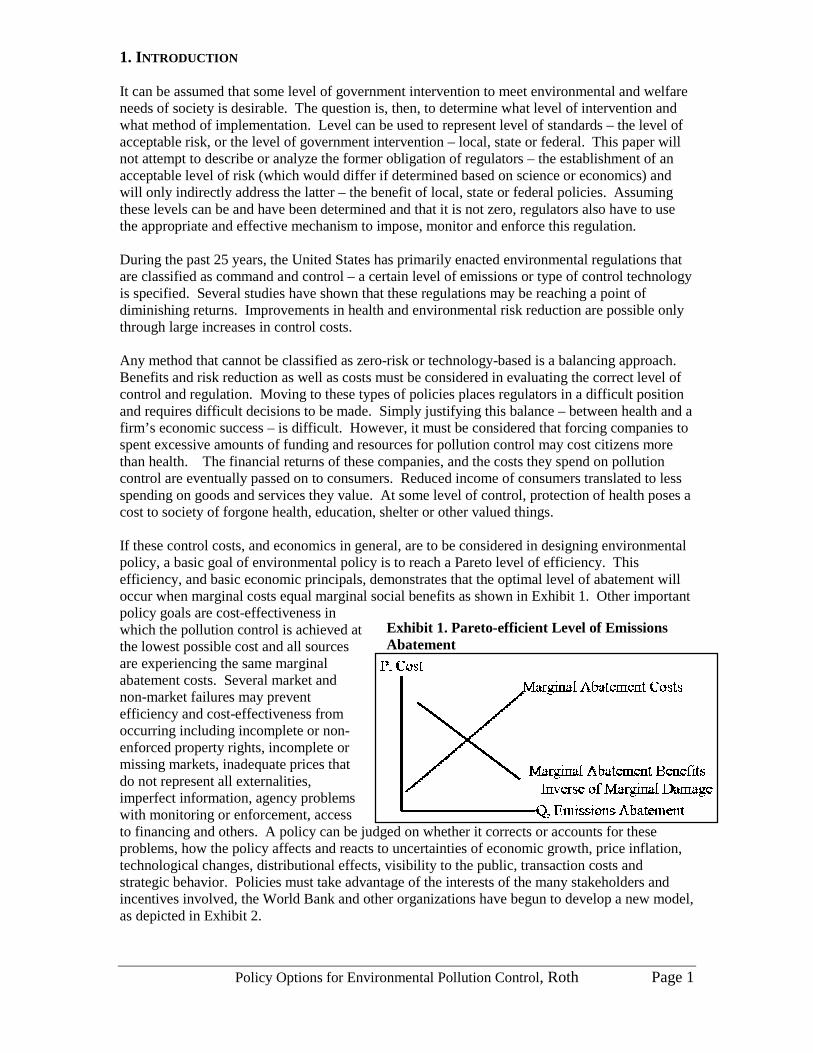
If these control costs, and economics in general, are to be considered in designing environmentalpolicy, a basic goal of environmental policy is to reach a Pareto level of efficiency. Thisefficiency, and basic economic principals, demonstrates that the optimal level of abatement willoccur when marginal costs equal marginal social benefits as shown in Exhibit 1. Other importantpolicy goals are cost-effectiveness inwhich the pollution control is achieved atthe lowest possible cost and all sourcesare experiencing the same marginalabatement costs. Several market andnon-market failures may preventefficiency and cost-effectiveness fromoccurring including incomplete or non-enforced property rights, incomplete ormissing markets, inadequate prices thatdo not represent all externalities,imperfect information, agency problemswith monitoring or enforcement, accessto financing and others. A policy can be judged on whether it corrects or accounts for theseproblems, how the policy affects and reacts to uncertainties of economic growth, price inflation,technological changes, distributional effects, visibility to the public, transaction costs andstrategic behavior. Policies must take advantage of the interests of the many stakeholders andincentives involved, the World Bank and other organizations have begun to develop a new model,as depicted in Exhibit 2.
Exhibit 1. Pareto-efficient Level of EmissionsAbatement

Policy Options for Environmental Pollution Control, Roth Page 2
Exhibit 2. The New Pollution Management Model
Using these principals, governments can select from many instruments which differ in severalways including the degree of control retained by the government, the distribution of costs forpolicy implementation, whether the policy controls the price or quantity of the product, whichportion of the market is controlled by the policy and the time frame of the policy intervention.These policies can be generally classified as command-and-control, economic-incentive basedand voluntary. A discussion of these policies follows and theoretical conclusions on optimalsituations for employment can be made. For each instrument type, subtypes are defined anddescribed, advantages and disadvantages are mentioned and examples provided. The second halfof this paper is devoted to an analysis of instrument application to the issues surrounding roadtransport, primarily fuel efficiency.
2.COMMAND AND CONTROL REGULATION
Command and control (CAC) policies require firms to implement certain technologies andpractices or reach certain levels of emission through either technology-based or performance-based standards. Technology-based standards specify either a certain technology (equipment ormethod) that companies must use or specify that companies must employ the best availablecontrol technology (BACT). Performance-based standards set either a quantity of emissions thatmust be abated or a maximum level of emissions that can be released.
2.1 Technology-based StandardsTechnology based standards allow pollution that is remaining after sources have installed “bestavailable” or other state-of-the-art technology or implemented specified control practices.
The government retains the highest level of control when technology-based standards are used.There are no trade offs between cost savings for less strict pollution control methods permitted.Once a technology standard is selected site inspection can make certain that the technology hasbeen put in place. This eliminates the need for and cost of emissions or ambient concentrationmonitoring, which is useful in situations when these costs are high. Small firms may prefer thesestandards because they may not have the resources for research and innovation of their own.Additionally, if a firm can invent and patent better control equipment, they have a ready market.
One of the drawbacks in this approach is that there is no undeniably “best” technology; emissionscan always be reduced further if more expensive choices are made. Also, firms are unable toselect the technology that would be the most cost efficient for their operation. It is indirectlyassumed that the chosen control is worth the cost, regardless of the situation. Diverse geographymay make a control necessary to reduce risk in a densely populated area but have minimal effect

Policy Options for Environmental Pollution Control, Roth Page 3
on the risk in a remote, unpopulated area. Once an agency has selected a control method, there islittle ability to evolve the standards as technology develops. It is unlikely that polluters willimplement one costly technology and be asked to replace it the following year if technology hasimproved. Since companies realize that they will be regulated at the most stringent levelstechnically possible, there is also little incentive for the development of better control technology,through research and development.
Congress chose technology-based standards for regulation of several hazardous air pollutants inthe 1990 Clean Air Act Amendments and pollution discharges in the 1972 Clean Water Act.These regulations set air and water quality goals that all parts of the country must meet and alsolimit degradation in the already clean areas.
2.2 Performance-based StandardsUnder a performance-based standard, companies are given the discretion to select the form ofabatement control most suited for their operation. Whatever control measure is adopted,companies must meet either uniform emissions standards or uniform ambient standards. At acompany level, this could result in cost-effective selection.
Performance-based standard implementation requires significant resources to undertakemonitoring activities. Regulators must monitor emissions or ambient concentrations and correlatethese levels to a specific source. Even though costs can be minimized at the firm level, most costheterogeneity is across, not within, firms.
For example, the National Appliance Energy Conservation Act of 1987 (NAECA) mandated thatminimum energy efficiency standards be met by room air conditioners and gas water heaters afterJanuary 1, 1990 and central air conditioners after January 1, 1992 or 1993. Corporate averagefuel economy (CAFE) standards, implemented through the 1975 Energy Policy ConservationACT (EPCA) established fuel economy standards for vehicle car fleets. This policy will bediscussed in more detail in the second half of this paper.
2.3 Command and Control SummaryThe regulator retains a larger degree of power in command and control types of standards. CACmethods appeal to agencies because of their ease of implementation; after a standard has beendetermined, all firms are required to adhere to that level. Firms are given similar shares of thepollution-control burden through uniform standards, regardless of the relative control costs tothem.
But while CAC standards may effectively limit aggregate emissions of pollutants, they typicallyexact high costs in the process by forcing some firms to resort to unduly expensive means ofcontrolling pollution. Holding all of the firms to the same target can be expensive. The cost ofcontrolling emissions may vary greatly among firms and even among sources within the samefirm, the appropriate technology in one situation may not be cost appropriate or effective inanother. Those who set CAC standards do not consider marginal compliance costs and providelittle incentive for technological improvement once compliance has been achieved. Whencomparing environmental policy instruments and their effect on technology change, it isimportant to ask what effects do the instruments have on the rate and direction of relevanttechnological change and whether the instruments encourage efficient rates and directions oftechnological change. Jaffe and Stavins (1995) found that CAC approaches have no discernableeffects on technology diffusion.
Because companies have little freedom, the correct abatement level is difficult to determine. Ahigh level of information collection about firms’ performance is required for EPA to make thisdetermination, but firms have clear incentives to withhold such information. If regulators expect

Policy Options for Environmental Pollution Control, Roth Page 4
abatement to be difficult and/or costly, standards may be set at less stringent levels. CACapproaches will have little effect if they are set below standards of practice.
EPA has also allowed for “grandfathering” of pollution rights; creating barriers to entry for newfirms. For many situations where CAC standards have been used, the required level of pollutionabatement has been set at a far more stringent level for new sources than existing ones. There isevidence that such differential environmental regulations have lengthened the time before plantswere retired. This system can actually worsen pollution by indirectly encouraging firms to keepolder, dirtier plants in operation (Jaffe, et. al., 2000) and preventing new entrants.
CAC may be preferred in those cases where the consequences of non-compliance are especiallyserious because the quantity of abatement is required by the policy1.
Although the majority of regulation can be classified as CAC types, and these methods can oftenlead to the desired level of pollution abatement, they are not efficient (unless by coincidence)because costs are not minimized. There are economic and environmental benefits in grantingcompanies and communities greater flexibility in determining how to meet the standards ofenvironmental and human health risk reduction. Jonathon Howes, Secretary of the NorthCarolina Department of Environment, Health, and Natural Resource reported to the Commissionon the work of the National Academy of Public Administration that many businesses have foundit in their best interest to meet or exceed environmental standards, particularly if they can usetheir own strategies to achieve the pollution reduction targets that are established (Risk World,1996 risk report).
3. ECONOMIC-INCENTIVE-BASED (MARKET-BASED) POLICY INSTRUMENTS
Rather than equalizing pollution levels among firms, market-based instruments equalize theincremental amount that firms spend to reduce pollution (their marginal abatement cost). Market-based standards enable the government to encourage behavior and, thus, emission levels throughmarket signals rather than through explicit directives regarding pollution control levels ormethods. These incentives can be in the form of rewards or penalties and are provided to thosefirms according to their actions to reduce pollution. Companies can then select their appropriatelevel of abatement and control method. Market based methods assume that all companies will actin their economic best interest and will make decisions to control emission based on theirindividual (facility or company) marginal abatement curves. Economic-incentive based policieshave the flexibility to allow industries to react to pollution control in a variety of ways includingprocess change, technology development and product modification. Hypothetically, this willresult in cost-effectiveness, efficiency and dynamic incentives for technology innovation anddiffusion. They attempt to eliminate some or all of the market failures and environmentalexternalities that many command and control policies do not consider, including the onesmentioned in the introduction. Market-based instruments attempt to reach environmental goalsnot only in the most cost-effective (minimum costs) way.
It is on the basis of prices and charges that society makes its decisions. Market prices andcharges are often the most direct way to identify and quantify the many variables involved inmaking a decision. CAC mechanisms can only approximate this information function and do soat a much greater cost. Actions that directly impact a firm’s profits are likely to initiate rapidresponses.
Several articles by Jaffe and Stavins (1994, 1995, 1999) address the hypothesis that technologicalchange occurs in three stages: invention, innovation and diffusion. Markets, government policy,
1 As shown later, however, permit systems also set the quantity of emissions as well as allow for cost-effective decisions.
Policy Options for Environmental Pollution Control, Roth Page 5
consumer opinion, competition, etc can influence each stage. Invention can be defined as the actof creating a new technological possibility, innovation is the commercial introduction of the newtechnical idea (not previously available or at a cost that is lower then previously feasible) anddiffusion is the gradual adoption by firms or individuals of commercially available products.Further, innovation can be thought of as the combination of three kinds of energy efficiencyshifts: overall technical change, directional technical change and model substitution. Becausetechnology diffusion theoretically lowers the aggregate marginal abatement cost it results in achange in the efficient level of control.
The relative importance of dynamic effects of alternative policy instruments on technologicalchange, and therefore long-term compliance costs, is greater in the case of those environmentalproblems that are of great magnitude (in terms or anticipated abatement costs) and/or very longtime horizon. Hence, it is being given increased attention by scholars and policy makers toaddress the problem of global climate change.
These types of practices have been used by the Federal government only within the last 15 years.Fourteen members of the Organization for Economic Co-operation and Development (OECD)use between one and 21 economic instruments for environmental protection. Forms of market-based programs include pollution charge systems (taxes, subsidies, deposit-refund systems),tradable permits, barrier reductions (market creation, liability rules and information/educationalprograms) and government subsidy reductions.
3.1 Pollution Charge SystemsPollution charge systems can be many kinds but their main defining feature is their reliance onmarkets and the price mechanism to internalize environmental externalities, thereby attempting tomake polluters pay the full social costs of their activities. Pollution charges are best appliedwhere property rights are not evident. Fiscal instruments (taxes) and financial instruments(subsidies) are the most widely used economic instruments (Hawkins, 2000).
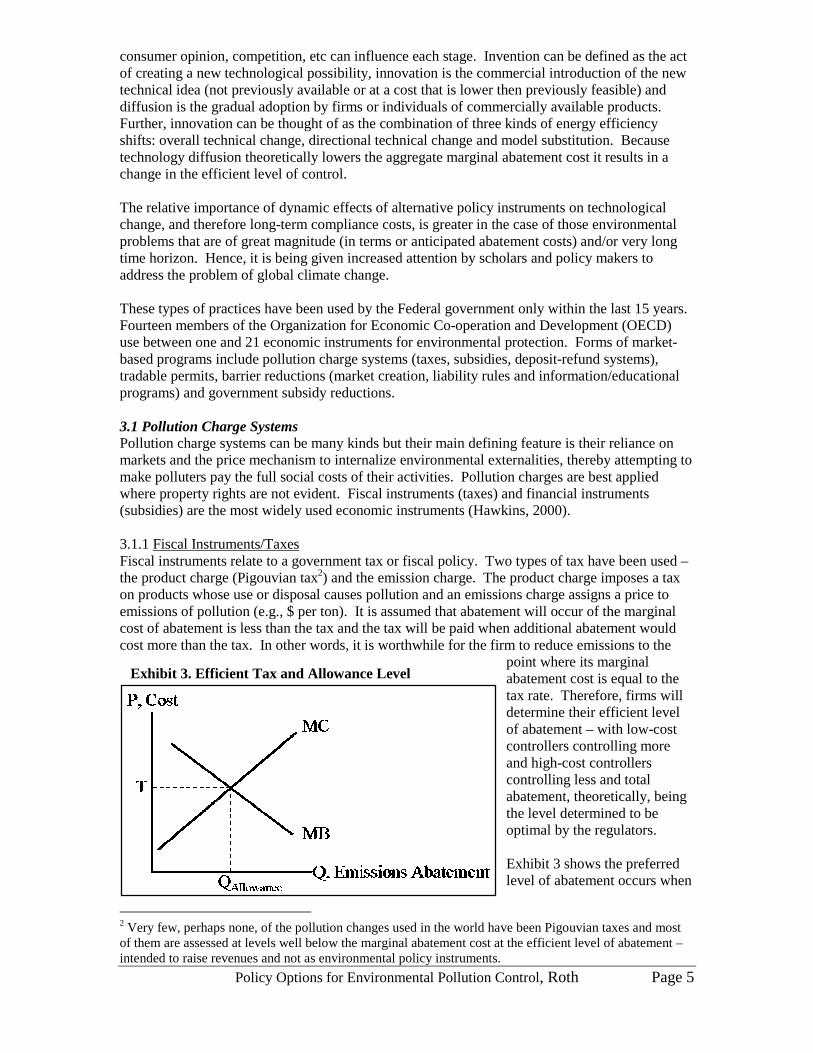
3.1.1 Fiscal Instruments/TaxesFiscal instruments relate to a government tax or fiscal policy. Two types of tax have been used –the product charge (Pigouvian tax2) and the emission charge. The product charge imposes a taxon products whose use or disposal causes pollution and an emissions charge assigns a price toemissions of pollution (e.g., $ per ton). It is assumed that abatement will occur of the marginalcost of abatement is less than the tax and the tax will be paid when additional abatement wouldcost more than the tax. In other words, it is worthwhile for the firm to reduce emissions to the
point where its marginalabatement cost is equal to thetax rate. Therefore, firms willdetermine their efficient levelof abatement – with low-costcontrollers controlling moreand high-cost controllerscontrolling less and totalabatement, theoretically, beingthe level determined to beoptimal by the regulators.
Exhibit 3 shows the preferredlevel of abatement occurs when
2 Very few, perhaps none, of the pollution changes used in the world have been Pigouvian taxes and mostof them are assessed at levels well below the marginal abatement cost at the efficient level of abatement –intended to raise revenues and not as environmental policy instruments.
Exhibit 3. Efficient Tax and Allowance Level

Policy Options for Environmental Pollution Control, Roth Page 6
marginal costs (polluter aggregate) of abatement equals marginal benefits (to society) ofabatement. Regulators use this relationship to set tax and allowance (which will be discussedlater) levels. This graph can be used to show the dead weight loss (DWL) to society that willoccur if either the tax or allowance level is not set correctly, either because of imperfectinformation of costs or benefits (expected “E” information is different than realized “R”). Exhibit4 shows the result of MB uncertainty; Exhibit 5 shows the result of MC uncertainty and Exhibit 6shows the result if both MB and MC are uncertain. The policy efficiency and preferredinstrument is dependent on these uncertainties as well as the relative slopes of the MB and MCcurves.
Taxes raise revenue for government agencies.This may allow them to lower taxes elsewhere, orreturn the revenue to the taxed industry throughresearch funding, etc. Because firms want toproduce less pollution and pay less tax, there is anincentive for technology innovation. However,for both command and control standards andtaxes it has been estimated that increases in thestandard or level of the tax had ambiguous effectson the level of R&D encouraged, because a directeffect of increasing costs increases the incentivesto invest in R&D in order to develop cost-savingpollution abatement methods but an indirect effectof reducing product output reduces the incentiveto engage in R&D (Jaffe, October 2000).
Firms also enjoy the ability to select the mostappropriate method of abatement. Potentialmarket entrants have knowledge of costs beforeentering the market and the CAC deterrence is notan issue. However, as new firms enter themarket, the demand to pollute may shift and thetax level will be inefficient. Setting tax levels isoften an iterative process. As in performance-based standards, there is the difficulty ofdetermining the correct level of control, in orderto calculate the correct tax amount. With taxes(and other market based instruments) regulatorsnot only have to estimate the appropriate level ofemissions, they must have knowledge ofparticipant marginal abatement cost curves todetermine which tax level crosses the aggregateparticipant cost curve at that level of emission.
Each participant will have a different marginal cost curve; if the accurate level is not foundaggregate abatement may not be efficient and industry emissions in total may be more or less thanthe efficient level. This can be demonstrated using Exhibit 3, shown above.
Several economists have hypothesized (the induced innovation hypothesis) that when energyprices rise, the characteristic “energy efficiency” of items on the capital goods menu shouldimprove faster than it otherwise would. In the context of several household appliances, Jaffe andStavins (1999) estimated that the post-1973 energy price increases account for one-quarter to one-half of the observed improvements in the mean energy efficiency of models offered for sale overthe last two decades and that government energy efficiency standards had a significant impact on
Exhibit 4. Marginal Benefit Uncertainty
Exhibit 5. Marginal Cost Uncertainty
Exhibit 6. Marginal Benefit andMarginal Cost Uncertainty

Policy Options for Environmental Pollution Control, Roth Page 7
the average energy efficiency of the product menu. This information could serve as a powerfultool to develop insights into incentives for technology innovation and diffusion.
Effective monitoring and enforcement remains a strong-precondition on the application of chargesystems. Failure to do so can lessen their comparative efficiency in relation to CAC.
In the US, as part of global climate change policies, a carbon tax has been proposed to encouragegenerating companies to switch to lower-carbon fuels, with the possibility of offsets in othertaxes. Five European countries have introduced carbon taxes (Crawford, 1995). Another energyuse related tax is the policy of a system benefits charge (SBC) in which a non-bypassable wirescharge is paid by all end-use consumers of electricity on a per-kWh-consumption basis.Revenues from the tax could then be used to “buy down” the costs of renewable resources tocompetitive levels, fund R&D for emerging technologies, and/or provide incentives for thedelivery of energy efficiency.
Pollution taxes are widely used in OECD countries and are a key instrument in most transitioneconomies. Developing countries, such as Latin America and East Asia, have also introducedsuch policies. Charges are typically applied for the protection of resources from waste emissionsand discharges. Taxes on the landfilling of waste and the differential tax on leaded and unleadedfuel are other examples (Crawford, 1995). In Malaysia, effluent charges have been in operationfor 20 years to protect water quality from effluents arising from the palm oil and rubber industries(Hawkins, 2000).
Several pollution tax examples are also available relating to road transport, many as “congestion”taxes. In Singapore, charging drivers for using roads in the city center during peak hours resultedin a 73 percent reduction in traffic in the restricted zone and CO levels. At least 10 cities in theUK are set up to implement similar programs for town centers. Road transport tax reforms toinclude environmental considerations are also being considered in OECD countries. In contrastto historical emissions taxes, some of the recent policy interest has concerned restructuring theexisting tax system to discourage products or activities that cause environmental damage.
3.1.2 Financial Instruments/SubsidiesFinancial instruments primarily involve the use of subsidies, and less often investments, toaccelerate the development of environmentally benign technologies. Subsidies, in the form ofgrants, tax credits, direct payments or low interest loans, essentially pay individuals, companiesor industries not to pollute. The two main forms of subsidies are abatement equipment subsidies(Pogouvian subsidies) and per unit subsidies on pollution reduction (Coasian subsidies).
Politics and strong interest groups often favor and influence the decision to use subsidies. Whensubsidies are given based on pollution reduction, incentives for technology development arecreated. Alternately, subsidies based on abatement equipment purchase could discourageinnovation because they subsidize a specified technology. Subsidies may also reward pastpollution, by rewarding improvements over historical levels and negating the “polluter pays”principle. When subsidies attract new entrants to the market, emission levels could increaseabove non-subsidized levels. Subsidies are a cost to government agencies; taxes must be raised inother areas to make up for this loss.
Standard financial analysis would suggest that taxes and subsidies have equivalent results.However, Jaffe and Stavins (1995) found that the response to energy taxes would be positive andsignificant but that equivalent percentage technology cost subsidies would be about three times aseffective as taxes in encouraging technology diffusion. Similarly, a study by Hasset and Metcalf(1995) suggested that tax credits for adoption would be up to eight times more effective than“equivalent” energy taxes. Both studies analyzed cases of residential energy conservation.Energy efficient adoption subsidies, unlike energy prices, do not provide incentives to reduce

Policy Options for Environmental Pollution Control, Roth Page 8
utilization. Additionally, subsidies and tax credits require large public expenditures per unit ofeffect, since consumers who would have purchased the product even in the absence of the subsidyor tax credit still receive it.
3.1.3 Bonds and Deposit-refund SystemsBonds and deposit-refund systems are both based on the principal of paying up front for theexternality imposed and being able to recoup the cost, combining characteristics of taxes andsubsidies. A consumer places a deposit (tax) during purchase on potential damage and returns theitem (or its packaging) for a refund (subsidy) if the damage did not occur.
The refund encourages an abatement activity that requires no government monitoring but theimpacts of such a program may not be able to be monitored or quantified. Often, theadministrative costs to the consumer and recyler of the program may outweigh the benefits. Ahigh level of commitment is required from the consumer to store the waste and then return it for arefund.
Deposit-refund policies are best suited for waste that is difficult to monitor, is harmful to theenvironment and can be recycled. Lead batteries are an example of a material used in a deposit-refund program. Another simple program has been “bottle bills” to control litter from beveragecontainers and to reduce the amount of solid waste entering landfills. Performance bonds areincreasingly used in mineral extraction, forestry and waste management as a form of insuranceagainst long-term environmental damage.
3.2 Market Creation/Marketable Allowances/Tradable PermitsGovernments have the power to facilitate the evolution of new national or international marketswhich are defined by the total permissible pollution or discharge allowed within the market. Thesystem establishes a maximum quantity of allowances for pollutant emissions in the market andallows trading of those allowances while allocating the control burden at a minimum cost. Thus,an artificial currency in the form of credits or allowances/permits is created. It relies oneconomic motivations to encourage environmental protection and cost-effectiveness. It isassumed that individuals and firms with low abatement costs will sell allowances to thoseindividuals and firms with high abatement costs. When modeled simply, marketable allowancesact as pollution charges. However, several differences surface once implemented in real lifesituations:
• Allowances fix the level of control while charges fix the costs of pollution control.• Allowances freeze the level of pollution control while charges increase it as technological
change makes abatement less costly• Allowances allow for the transfer of resources within the private sector while charges move
resources from the private to the public sector• Charge systems make costs to the consumer/polluter more visible• Allowances automatically adjust for inflation while most charges do not.• Allowance systems may be more susceptible to strategic behavior than charges.• Allowances are more affected by transaction costs• If benefit or cost uncertainty exists, the relative efficiency of allowances or charges is
dependent upon the relative slopes of the industry aggregate marginal benefit and marginalcost functions (Portney, 2000)
Marketable allowance programs may differ in the way allowances are initially distributed,identification of participants, adjustment of the allowance amount, time period and renewabilityof the permit, geographic boundaries of trading and others. All of these factors influence theparticipation and effectiveness of the program.

Policy Options for Environmental Pollution Control, Roth Page 9
Some programs have awarded allowances on the basis of past emissions. If emissions allowancesare grandfathered, the worst emitters are rewarded (as in some subsidy cases). Another option isto auction allowances, which would generate revenue during the auction period. It may bedifficult to identify all of the firms in the market and whether there will be brokers andspeculators – which would create a new interest group. If there are a few powerful firms in themarket, they may have the capability to purchase allowances and not sell them to competitors,despite the poor economics. Marketable allowances perform best in a large market, so that a trueprice signal may develop. Changing the allowance after the initial allocation may pose politicaldifficulties. There has been problems establishing an allowance as an entitlement or a propertyright – if allowances are a property right, it is difficult for the government to remove or decreasethis right.
If the allowance amount changes yearly there may not be an incentive to undertake long-termabatement actions. By reducing emissions below their allowance level, a firm can bankallowances for further use, which may encourage a higher initial decrease in emissions. Iftechnological advances occur the banked allowances may never be used. Geographic boundariesof the program should be established around areas that share similar marginal abatement benefits.If a large number of high emitters are located within one area, “hot spots” may form.Additionally, for some pollutants such as toxic air pollutants, where sources create localized risks,marketable allowances may not be effective. Monitoring of emissions must also occur, and thiscould be done through either ambient readings or source based emissions measurements.
If marginal damages (and therefore benefits) are not constant, the optimal policy is determined bythe interaction of marginal damages and marginal abatement costs for both taxes and permits. Inthe face of uncertainty, the marginal cost and benefits curves affect which instrument is preferred(as shown above in Exhibits 3-6).
An example of the use of a marketable allowance is the use of tradable sulfur dioxide emissionsallowances to reduce acid rain. This program was mandated under the 1990 Clean Air ActAmendments (CAAA) and requires electric utilities to reduce emissions of sulfur dioxide toallowable levels and permits them to sell the portion of their allowance that is unused, if theyreduce emissions below this level. The regulatory program has established a sulfur dioxide capbelow historical emission levels. The current cost of a ton of SO2 emission allowance has fallenbelow projected costs, possibly as a result of technological development and a lowering ofmarginal abatement costs (1998 Risk World Risk Report). Similar programs are now beingconsidered to reduce regional nitrogen oxide emissions.
The Kyoto Protocol has components that would enable carbon allowance trading from onecountry to another. Negotiation over the protocol has resulted in the expected problem ofdetermining the correct allowance cap and allocating these allowances among participants.Additionally, there is the question of whether government/countries will trade internationally or iflegal entities have the freedom to trade. If any legal entity (firms) can trade, the national policiesimplemented to reach country reduction targets must be the same for all Kyoto participants, sothat the same unit is traded internationally. The Russian Federation and Ukraine negotiatedtargets far above the level their emissions would reach by 2010 even with no reduction efforts. Ifother countries then purchased these excess allowances, their target levels would be significantlyrelaxed also. The Clean Development Mechanism (CDM) of the protocol, functioning similarlyto carbon trading, allows industrialized countries to earn credit for carbon reduction activities indeveloping countries that did not sign the protocol, which have no emissions limits.
3.3 Market Barrier ReductionsSeveral reasons exist naturally in markets that may discourage this exchange. Information ontechnological improvements and other topics could be considered a public good, one that, oncecreated, can be used by many people at minimal additional cost. This creates the problem of free

Policy Options for Environmental Pollution Control, Roth Page 10
riders; such public goods will tend to be underprovided by ordinary market activity.Additionally, if adopting a new technology provides information to others, the act of adoptioncreates a positive externality by providing information to others for which the adopter is notcompensated. Finally, those with information may not be the ones who could adopt the newtechnology. If energy producers or retailers know of energy saving practices, adoption will notoccur because it is only the energy bill-paying consumer who would adopt these measures to savemoney. By simply removing existing implicit or barriers to market activity, substantialenvironmental protection gains can be realized.
3.4 Education Programs/Public DisclosureThe goal of public disclosure programs is regular collection of information about firms’environmental performance. Public disclosure has the potential to affect the demand for a firms’goods and stock, affect firms’ ability to hire and retain employees, influence investors decisions,convince private citizens to initiate tort law actions against polluters, build support for newpollution control legislation, motivate private suits to force firms to undertake abatement and giverise to judicial actions in countries like Colombia, Ecuador and Chile where the constitutionguarantees citizens the right to a healthy environment (Afsah, 2000, Foulon, 1999).
Education programs are not strictly classified as economic-incentive polices but do provide otherpollution prevention incentives and therefore improve the functioning of markets. Theseprograms depend on the beneficial effects of informing public and private entities of the dangersof environmental damage as well as providing information on the produced goods and services.Public disclosure is used as a risk-management tool.
Education programs are a relatively inexpensive way to raise public awareness, but it is difficultto measure the effectiveness of such programs. The burden of proof of safety is moved fromgovernment agencies to the manufacturers. Evidence suggests that a firm’s environmentalreputation matters – a suppliers or consumers perception of a firm’s environmental performancewill affect costs or revenues.
Popularity of public disclosure programs are, in a large part, due to evidence that pioneeringapproaches such as the United States’ Toxic Release Inventory (TRI) have had a significantimpact on pollution abatement. Public disclosure programs also impose a minimal burden onregulators. It does not necessarily require an effective enforcement capability or even a well-defined set of regulations. The cost of the administrative activities that are required – datacollection and dissemination – appear to be falling due to new information technologies. Publicdisclosure programs, therefore, hold promise for developing countries where environmentalregulatory institutions are chronically short of funding, expertise and local support. It can also beused in industrialized countries to support conventional regulatory instruments for types ofpollution that are not yet strictly controlled.
Persuasion and incentives have been successful, but there are always some polluters who resist,and for these there must be a credible threat of real punishment – through fines and occasional jailterms.
These types of programs have been used extensively about lead poisoning in children and homes.EPA also requires labeling of several products including some pesticides. This practice may alsocome into play during restructuring of the electric and gas utility industries. Markets will becreated where buyers have access to an expanded set of choices for all forms of energy andenergy services, including those promoted at “cleaner-than-standard.”
Market pressure due to public recognition of firm performance has resulted in a wide variety toCodes of Practice and other voluntary guidelines or industrial associations, and NGOs or othergroups are becoming more active in promoting the implementation of such commitments. The

Policy Options for Environmental Pollution Control, Roth Page 11
World Bank Group, for example, is supporting several initiatives to join industries, localregulators and community groups to discuss local priorities and to improve those industries’environmental performance. One example of the groups work is Indonesia’s PROPER program,which rates and publicly discloses factories’ environmental performance (Afsah et. al., 2000).These government-certified performance ratings enable environment agencies to reduceexpensive legal enforcement procedures by bringing community and market pressure to bear onpolluters. In the United States, Right-to-know laws such as the Toxic Release Inventory (TRI)and California Proposition 65 require the disclosure of information about chemical releases to theenvironment and labeling of chemicals in production, respectively.
Another example of a public disclosure program is Indonesia’s Program for Pollution Control,Evaluation and Rating (PROPER), established in 1995 by the Environmental Impact andManagement Agency (BAPEDAL). Although the country has had a CAC regulatory system inplace since the early 1980s, enforcement has been low and compliance limited. PROPER is arating system of individual plants using plant-level data, self-reported survey data and inspectiondata. Once the program was begun, monthly emission reports were submitted by participatingplants and compared with past reports. If there are discrepancies and inspection of the plant isconducted. A survey of participating firms show that PROPER spurs abatement by improvingfactory managers’ information about their own plants’ pollution and abatement opportunities –essentially an environmental audit effect. This force operates in conjunction with external forcessuch as capital markets, the threat of future regulation, discretionary enforcement of existing lawsand product markets. Together, ratings have improved for over a third of the plants (Afsah et. al.,2000).
3.5 Property RightsIf property rights are not clearly defined, consumers may use the resource more than optimal.Property rights are most commonly used in developing countries and to slow the rate of naturalresource depletion. Privately held land is converted to communal ownership, allowingcommunities to share in the economic costs and benefits of maintaining the asset. In Papua NewGuinea, more than 90 percent of the land remains communal and only 13 percent of the forestlandhas been converted to other uses.
3.6 Liability RulesLiability systems involve the assignment of whole or part liability of the requirement to coverliability through insurance. Pollution insurance can be seen as one type of economic instrumentthat provides direct financial incentives away from polluting processes. Liability rules encouragefirms to consider the potential environmental damages of their decisions. The EuropeanCommission is considering the adoption of a European Union wide system of strict liability forenvironmental damage.
3.7 Government Subsidy ReductionsGovernment subsidies are the mirror image of taxes and are intended to provide incentives toaddress environmental problems. However, in practice, many subsidies promote economicallyinefficient and environmentally unsound practices. Energy priced at average, rather thanmarginal costs, or energy subsidies will cause energy prices to differ from the marginal socialcost. An example is the below-cost sale of timber by the U.S. Forest Service. The Forest Servicesells timber from public lands at a commercial price, but this price may be below the cost thefederal government pays to harvest the timber cost which includes subsidies to private lumbercompanies for road building, production costs and other public goods such as wilderness,recreation and others. The promotion of agricultural production through subsidies for inputs,such as pesticides and water use, can contribute to environmental damage. Altering thesenegative policies can have as substantial an effect on the environment as subsidies for theprovision of pollution abatement.

Policy Options for Environmental Pollution Control, Roth Page 12
An overview of the different types of market-based instruments and examples of theirapplicability are shown in Exhibit 7. Not all of the examples are described in the text of thispaper.
Exhibit 7. Economic Instruments for Environmental Protection and Natural ResourcesManagement
Charge Systems/Financial Instruments Market CreationTradable Emission PermitsTradable Catch QuotasTradable Development QuotasTradable Water SharesTradable Resources SharesTradable Land PermitsTradable Offsets/CreditsBonds and Deposit Refund Systems
Road TollsAccess FeesPollution ChargesUser ChargesBetterment ChargesImpact FeesAdministrative ChargesEco Funds/Environmental FundsSoft LoansGrantsLocation/Relocation IncentivesSubsidized InterestHard Currency at below Equilibrium Exchange RateRevolving FundsSectoral Funds
Environmental Accident BondsEnvironmental Performance BondsLand Reclamation BondsWaste Delivery BondsDeposit Refund SystemDeposit Refund Shares
Fiscal Instruments Liability SystemsPollution Taxes (on Emissions or Effluents)Product TaxesInput TaxesExport TaxesImport TariffsTax DifferentiationRoyalties and Resource TaxesLand Use TaxesInvestment Tax CreditsAccelerated Depreciation Subsidies
Legal LiabilityNon Compliance ChargesJoint and Several LiabilitiesNatural Resource LiabilityLiability InsuranceEnforcement Incentives
Public Disclosure Property RightsEnvironmental Performance ReportsEmissions InventoriesEnergy Efficiency Labeling
Ownership RightsUser Rights
Government Subsidy ReductionsSubsidized Resource SalesSource: Adapted from Hawkins, 2000 which cited UNEP and Impax, Ltd.
4. NON-REGULATED PROGRAMS
Much like education programs and public disclosure, non-regulated/voluntary programs rely onthe public’s attitudes to encourage industry to reduce or eliminate their use or release of toxicants,alter their production process in an environmentally favorable way or produce environmentallyfriendly products. Voluntary regulation (certification and labeling protocols) and informalregulation are useful tools and have been labeled the “third wave” of environmental regulation,following command and control and market-based approaches. Successful programs must (1)detect environmental concerns and risks; (2) assure reliable information; (3) disseminate theinformation to those at risk from the pollution; and (4) allow public- and private-sector agents toact on the information to create pressures for pollution control. Reliable and easily comparedinformation on the environmental impacts of energy service options permits buyers to minimizeinformation collection costs and uncertainties in making purchasing decisions. This informationalso increases the supply and demand for environmental protection and energy-efficiency.Analysts have shown that capital markets react significantly to the release of information; upwardwhen the information reveals a superior performance and downward when a poor performance is
Policy Options for Environmental Pollution Control, Roth Page 13
revealed (Foulon, 1999). Other analysts have shown that voluntary public disclosure improvesthe environmental performance of polluters.
4.1 Voluntary RegulationVoluntary regulations serve, among other purposes, to address one of the non-market failuresmentioned earlier – agency problems. They allow a firm to participate in a regulated programvoluntarily, for public recognition, access to technology transfer and education among theindustry or other reasons. For example, most energy-saving investments in industry operationsare small and senior staff may rationally choose to restrict funds for such small projects thatcannot be perfectly monitored. Programs such as the Green Lights program attempt to addressthis type of problem by providing information on savings opportunities at the level of the firmwhere decisions are made. Small projects become larger as they impact firms’ revenues as wellas costs.
One of the most prominent voluntary programs in the United States is EPA’s Energy StarProgram, which recently expanded to the European Union. The program is a voluntary energy-efficiency labeling program of a full range of office equipment, lighting and home appliances.The Energy Star label helps consumers identify products that save them money and help protectthe environment by saving energy. Manufacturers and retailers sign voluntary agreementsallowing them to place the Energy Star label on products that meet or exceed energy-efficiencyguidelines established by the EPA and DOE. The label can also be used in product packaging,promotions and advertising for qualified productions. More than 1,200 manufactures have signedthe Energy Star agreement. EPA estimates that in 2000, eight million metric tons of carbon weresaved from using Energy Star labeled office equipment in the United Sates.
EPA’s Green Lights program is also intended to encourage greater private industry use of energy-saving technologies. The Green Lights program is a voluntary effort by which the EPAencourages and helps businesses and other organizations upgrade their lighting systems to thosethat are more energy-efficient in order to save money and reduce the emissions from powerproduction.
Another EPA program is Natural Gas Star, a voluntary program for natural gas producers andtransmission and distribution operators. Members sign a memorandum of understanding andagree to use best management practices to reduce methane emissions during operation. EPAcollects and distributes through documents and workshops information on these practices andtechnology improvements.
4.2 Informal RegulationInformal regulation is common in developing countries where state regulators are weak andpressures to abate are generated by private-sector agents. It enables public or interest groups topressure and provide incentives to firms. Findings in Indonesia and Mexico imply thatshareholders, employees and international certification programs can motivate firms to cutemissions. General observations apply to each of these non-regulated instruments. Wheninformation costs are low, the threat of regulation is high. Therefore, government actions likepublic disclosure may spur abatement. In other words, firms may actually be encouraged to over-comply, in an attempt to preempt or weaken future regulation, affect the monitoring andenforcement of existing regulation and to attract “green” consumers. Programs such as the onesdescribed above encourage exchange of technologically superior designs and practices and mayinfluence diffusion of ideas. Both EPA programs publicly recognize member accomplishments.
5. ANALYSIS OF POLICY INSTRUMENTS
It does seem that there is a move away from uniform command-and-control regulations. Thetheoretical advantage of economic instruments over these types of standards is a greater
Policy Options for Environmental Pollution Control, Roth Page 14
flexibility and cost-effectiveness. The key to environmental policy is to ensure that the value ofthe resulting output (control, risk reduction) is greater than that which must be sacrificed(expenditures). Poorly designed programs, however, may not yield measurable economic andenvironmental benefits. Not only will poor design sabotage the benefits of the program, it willdecrease confidence in the theory. The full potential of market-based instruments can only beachieved in the overall context of sound macroeconomic policies.
The challenge facing policy makers is to design policies to enable market forces (whether throughmarket based instruments of through standards that harness consumer market demand) to operatein the environmental sphere. Regulators must consider several criteria when determining the bestPollution control policy instrument to use. From the information presented above, severalconclusions can be made:
• Degree of Mixing –CAC instruments are preferred for non-uniformly mixed pollutants where“hot spots” may be a concern and it is important to regulate specific polluters. Market basedinstruments are preferred for uniformly mixed pollutants because the responsible parties donot have to be found and reductions will still occur.
• Cost-effectiveness – Cost-effectiveness is more likely to occur through use of market basedinstruments. These types of instruments allocate abatements costs over participants – theyallow for heterogeneous control costs.
• Flexibility – There is more flexibility in setting market-based policies.• Program Costs – Enforcement and monitoring costs are higher for market-based instruments.• Dynamic Incentives – There are more long-term incentives for technological change when
using market based instruments• Revenue Raising – There is a possibility for revenue raising, and the opportunity to recycle
this revenue when using taxes or auctioning allowances.• Distribution – Taxes may cause distribution problems by giving money to the
government/public sector but allowances allow all money to remain within those that areincurring the abatement costs – the private sector.
• Uncertainty – Marginal Cost uncertainty will result in taxes preferred over allowances if theMC curve is steeper than the MB curve and allowances preferred over taxes if the MB curveis steeper than the MC curve.
• Political Feasibility – Taxes may be politically infeasible in the US because of their visibility.• Economic Growth – If there is economic growth, taxes allow the emissions level to rise but
allowances fix the emissions level. CAC instruments fix the level of emissions regardless ofuncertainty.
• Technological Change – If there is technological control improvement (the MC of controlfalls), taxes cause emissions levels to fall and allowances fix the emissions level.
• Inflation – If there is price inflation, taxes allow the emissions level to rise but allowances fixthe emissions level.
• Strategic Behavior – There is a potential problem of strategic behavior if allowances are used.• Barriers to Entry – Allowances may present barriers to entry.• Equity – Allowances are better at addressing equity issues through initial allocation.
Using these conclusions, however, no hierarchy of efficient and cost-effective policies can bemade; the optimal policy instrument will be very case-specific.
Policy Options for Environmental Pollution Control, Roth Page 15
ROAD TRANSPORT
Many of the instruments introduced above could be applied within the energy sector – several ofthe examples applied to electric utilities, demand side management of energy prices and roadtransport. Road transport, primarily fuel efficiency, will be more closely analyzed in theremainder of this paper to show how and if these instruments apply. The purpose of this analysisis not to perform extensive empirical analysis on the topic, most of which would be a duplicationof work already completed, but to synthesize and analyze the available findings and conjecturethe effectiveness of current and proposed regulation of fuel economy.
Several issues, relating to automobiles, must be considered when establishing policy including:safety, emissions of air pollutants and greenhouse gases, social costs associated with road use(congestion, accidents, road and environmental damage), interactions between road transport,other modes of transport and spatial development as well as consumer attributes such as price,aesthetics, ride-ability, size and performance (Crawford and Smith, 1995). Many of these arelinked to market failures associated with transportation, each of which contributes to theinefficiency of any proposed standard.
6. HISTORY – CAFE
Beginning in the mid-1960s, increased public debate led to policies that resulted in greater safety,lower emissions and greater fuel economy in cars. The federal government began to assume alarger oversight role in 1966 through safety legislation and regulation. Emissions regulationfollowed in 1968 and, after the fuel economy of new U.S. passenger cars hit it lowest point inrecent history in 1974 and OPEC exercised its new found market power by tripling world oilprices, in 1975 the Energy Policy Conservation Act (EPCA) established Federal Automotive FuelEconomy standards (AFES), or corporate average fuel economy (CAFE), standards. The originalgoal of the CAFE regulations was to reduce fuel consumption in a period of high oil prices.
1974 models average about 14 miles per gallon (MPG) and CAFE standards required new carsachieve 18 MPG in 1978 and 27.5 MPG by 19853. The CAFE number, calculated as thesalesweighted harmonic mean MPG of a manufacturer’s product, measures compliance with thestandards. The targets must be met for domestic and imported (by domestic manufacturers) fleetsindividually or a fine, $5 per car sold per 0.1 MPG of shortfall, must be paid. By exceedingstandards in some years manufacturers can offset shortfalls in other years without penalty. Lightduty truck MPG has also increased dramatically since 1975, but in recent years (since 1995) hasbeen below CAFE standards of 20.7 MPG. The difference in stringency of passenger car andlight truck standards is attributable to the fact that passenger car targets were set within the lawitself while light truck standards were determined by separate Department of Transportationrulemaking. If passenger vehicle fuel economy had not changed through standards orautonomous technological change, the 1,512 billion highway miles traveled by automobiles in1998 would have required 53 billion more gallons of fuel and cost motorists an additional $64billion (NHSTA). However, fuel prices have fallen nearly 50 percent since 1982 (DOE/EIA),putting automakers in a position of balancing laws mandating fuel economy and consumer desiresfor larger, more powerful vehicles. In 1999 there were approximately 131 million private andcommercial automobiles and 73 million light duty trucks registered in the US, equating toapproximately 1.13 vehicles for each licensed driver. The average US vehicle travels about 600
3 Standards were relaxed for model years 1986-1989 in response to manufacturer petitions (Bamberger,2000).

Policy Options for Environmental Pollution Control, Roth Page 16
miles per year. These vehicles also use about 80 percent of the petroleum in the US (NHSTA,1999).
Exhibit 8. Vehicle Registrations, Fuel Consumption, and Vehicle-Highway Miles of Travel
0
50,000,000
100,000,000
150,000,000
200,000,000
250,000,000
300,000,000
1960
1965
1970
1975
1980
1985
1990
1991
1992
1993
1994
1995
1996
1997
0
0.1
0.2
0.3
0.4
0.5
0.6
0.7
0.8
0.9
Gal
lon
s P
er V
ehic
le
Highway VehicleMiles Traveled(100,000)
Private andCommercial Autosand TrucksRegistered
GasolineConsumption(thous gallons)
Gallons PerVehicle
Source: NHSTA, Highway Statistic Series, U.S. Census
There are several arguments for and against the effectiveness of CAFE standards. The primaryconcern regarding CAFE standards is that (1) price effects, not CAFE standards caused fueleconomy improvements. Secondary arguments involve concerns that they (2) force consumers tobuy smaller less desirable, unsafe cars (as manufacturers lower vehicle weight to reach fueleconomy standards) or less regulated models such as light trucks; (3) slow scrappage rates(because of increased new vehicle costs); (4) make domestic auto manufactures less competitive(as foreign manufacturers do not have to meet US standards); and (5) cause several effects thatincreas driving (rebound effect) and that these concerns have negated the potential benefits ofincreased MPG standards. Some analysts, in fact, claim that much of the fuel economy gainssince 1975 have been due to consumer desire or to changes in fuel prices rather than regulation(Dowlatabadi, 1996).
Market failures that affect the demand for fuel economy include external damages to theenvironment, a cartelized petroleum market and a ‘sluggish’ market for fuel economy (productionwill be satisfactory rather than optimal). Reasons presented have included (6) imperfectinformation and satisficing behavior on the part of consumers combined with risk aversion and(7) oligopolistic producer behavior. Each of the numbered items are discussed in more detailbelow.
6.1 Price Effect Versus CAFEOne of the largest points of contention concerning the effectiveness of CAFE standards arewhether it was the standards or fuel prices that were responsible for fuel economy related changesin MPG since 1975. Theoretically, regulations work largely through energy-inefficient modelsbeing dropped, since that is the intended effect. Energy price changes, however, induce bothcommercialization of new models and elimination of old models (Jaffe et. al., 2000). The samephenomenon is observed using hedonic price models. A recent OECD/World Bank study onenvironmental implications of energy subsidies in Russia shows that air emissions are reducedmore by increasing energy prices to unsubsidized levels than by increasing the level of pollution

Policy Options for Environmental Pollution Control, Roth Page 17
fees in the current system or by introducing a CO2 tax. Within the US, Atkinson and Halvorsen(1984) found that the fuel efficiency of the new car fleet responds more than proportionally to theexpected fuel prices. Wilcox (1984) used a similar model to construct a quality-related measureof automobile fuel economy over the period 1952-1980 (essentially before CAFE standards wereconstraining) and found that it was positively related to oil prices. Ohta and Griliches (1986)found that gasoline price changes over the period 1970-1981 could alone explain much of theobserved change in related automobile characteristics. Again, most of these studies used databefore CAFE implementation.
Most studies covering the entire period since CAFE implementation conclude that the regulationswere primarily responsible for changes during this period, but that sharp increases in oil prices(such as 1979 and 1982) played a role during certain periods. In one of the more in-depthanalyses relating to this debate, Goldberg (1995, 1998) combined a demand-side model ofdiscrete vehicle choice and vehicle utilization (miles driven on each new car purchased) with asupply-side model of oligopoly and product differentiation and location of production (to analyzethe trade policy aspect) to estimate the effects of CAFE standards on the fuel economy of the newcar fleet. She found that automobile operating costs have a significant effect, although a gasolinetax of a magnitude that could match the effect of CAFE on fuel economy would have to be verylarge. The elasticity of mileage demand with respect to the “price” per miles is small. Vehiclepurchases, however, respond to both car prices and fuel cost. Doubling of the gasoline priceswould be necessary to achieve fuel consumption reductions equivalent to the ones currentlyachieved through CAFE. An increase of this magnitude may or may not be possible. Overall, theanalysis showed that there was not significant evidence of utilization effects (for relatively smallchanges in fuel costs) while the substitution effects towards used cars were small. Therefore,policies oriented towards shifting the composition of the new car fleet towards more fuel-efficientvehicles seem promising. Additionally, producers face most of the incidence of CAFE.Consumers should not face large increases in car prices; while the prices of large cars increase asa result of CAFE, the prices of small cars decrease. CAFE seems to function as a set of internaltaxes (on fuel inefficiency) and subsidies (on fuel efficient vehicles) within each firm. Thissuggests that CAFE may not fare badly from a welfare point of view.
Goldberg’s model does not necessarily imply that fuel efficiency standards are superior to anincrease in gasoline taxes; the composition of the car sales depends on the gasoline prices and thefuel efficiency of the new car fleet. The model does show that consumers respond to both priceand operation cost of new vehicles but that an increase in vehicle prices will have a substantiallylarger effect on vehicle choice than a proportional increase in fuel costs. However, if theseabsolute costs are discounted over an average vehicle-holding period, vehicle price and fuel costselasticities are very similar in magnitude, making changes in operating costs and vehicle costsequally effective as incentives. Operating costs can be effected by changes in the fuel efficiencyof new vehicles (MPG) or by variations in the price per gallon of gas.
Green (1996) performed a statistical test to determine the importance of CAFE constraint, usingindividual manufacturer CAFE data compiled by the National Highway Traffic SafetyAdministration (NHTSA) for the period 1978-1989 and fuel price data from the Department ofEnergy’s Energy Information Administration. The analysis sought (1) to quantify the importanceof EPCA regulations relative to gasoline prices in manufacturer decision-making about new carfuel economy and (2) to derive an estimate of the responsiveness of new car fuel economy togasoline price in the absence of a fuel economy. The general trend of automobile MPG duringthis period suggests a strong relationship to the fuel economy standards. This study was limitedbecause it only included the fifteen manufacturers of passenger cars with full data sets for thetwelve-year period and excluded low-volume high-performance luxury cars (such as Jaguar,
Policy Options for Environmental Pollution Control, Roth Page 18
Rolls-Royce). The analysis concluded that the standards were at least twice as important asmarket trends in fuel prices, and may have completely replaced fuel price trends as a basis forlong-range planning about MPG. This would be the result if the standards had been an actualprediction of manufacturer behavior and not a stimulus, but since the CAFE standards arepredetermined and penalties are in place this is unlikely. It also showed that importers (carmanufacturers unconstrained by the standards) responded to prices two to four years old anddomestic manufacturers (those constrained by the standards) responded to current year prices.Overall, the data are not inconsistent with the hypothesis that constrained manufacturers basedtheir MPG product planning solely on the mandated fuel economy standards.
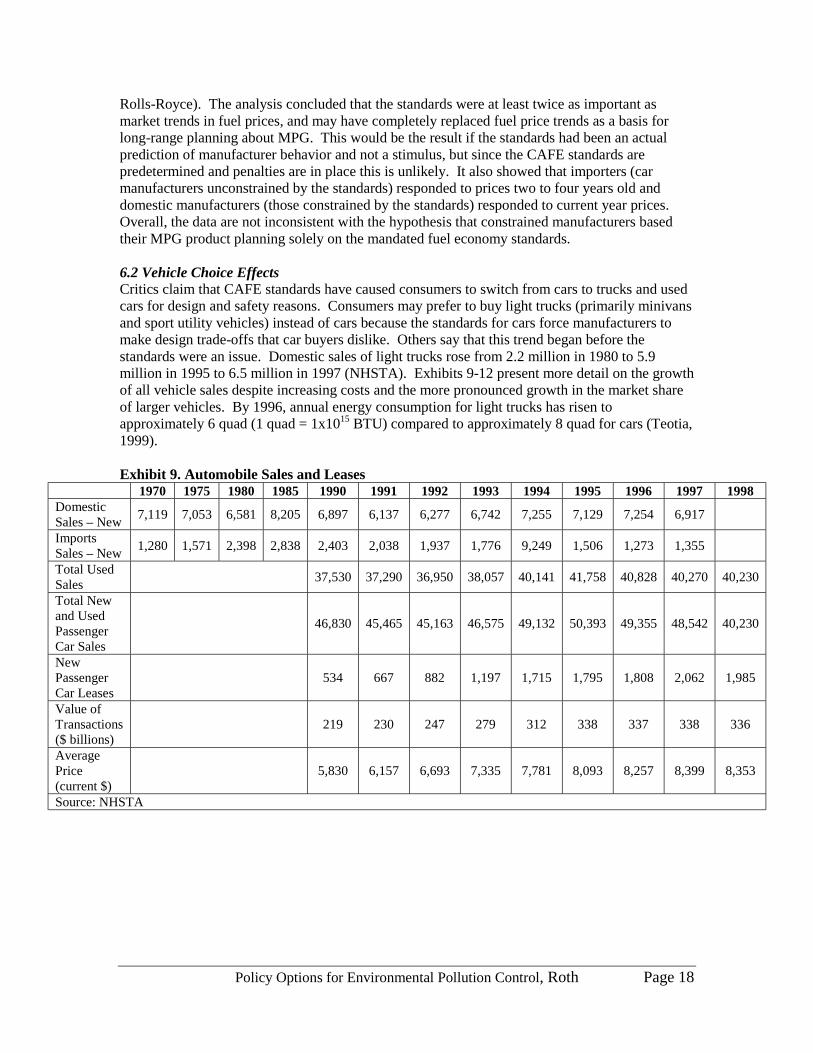
6.2 Vehicle Choice EffectsCritics claim that CAFE standards have caused consumers to switch from cars to trucks and usedcars for design and safety reasons. Consumers may prefer to buy light trucks (primarily minivansand sport utility vehicles) instead of cars because the standards for cars force manufacturers tomake design trade-offs that car buyers dislike. Others say that this trend began before thestandards were an issue. Domestic sales of light trucks rose from 2.2 million in 1980 to 5.9million in 1995 to 6.5 million in 1997 (NHSTA). Exhibits 9-12 present more detail on the growthof all vehicle sales despite increasing costs and the more pronounced growth in the market shareof larger vehicles. By 1996, annual energy consumption for light trucks has risen toapproximately 6 quad (1 quad = 1x10¹⁵ BTU) compared to approximately 8 quad for cars (Teotia,1999).
Exhibit 9. Automobile Sales and Leases1970 1975 1980 1985 1990 1991 1992 1993 1994 1995 1996 1997 1998
DomesticSales – New
7,119 7,053 6,581 8,205 6,897 6,137 6,277 6,742 7,255 7,129 7,254 6,917
ImportsSales – New
1,280 1,571 2,398 2,838 2,403 2,038 1,937 1,776 9,249 1,506 1,273 1,355
Total UsedSales
37,530 37,290 36,950 38,057 40,141 41,758 40,828 40,270 40,230
Total Newand UsedPassengerCar Sales
46,830 45,465 45,163 46,575 49,132 50,393 49,355 48,542 40,230
NewPassengerCar Leases
534 667 882 1,197 1,715 1,795 1,808 2,062 1,985
Value ofTransactions($ billions)
219 230 247 279 312 338 337 338 336
AveragePrice(current $)
5,830 6,157 6,693 7,335 7,781 8,093 8,257 8,399 8,353
Source: NHSTA

Policy Options for Environmental Pollution Control, Roth Page 19
Exhbit 10. Automobile Market Share
0
2000
4000
6000
8000
10000
12000
1980 1985 1990 1991 1992 1993 1994 1995 1996 1997
Sal
es, t
ho
usa
nd
s
Two-seater
Large
Midsize
Compact
Subcompact
Minicompact
Source: NHSTA, Highway Statistic Series
Exhibit 11. Light Truck Market Share
0
1000
2000
3000
4000
5000
6000
7000
1980 1985 1990 1991 1992 1993 1994 1995 1996 1997
Sal
es, t
ho
usa
nd
s
Large vans
Small vans
Large pickups
Small pickups
Large utility
Small utility
Source: NHSTA, Highway Statistic Series

Policy Options for Environmental Pollution Control, Roth Page 20
Exhibit 12. Sales and Registration of Vehicles
2,000
3,000
4,000
5,000
6,000
7,000
8,000
9,000
10,000
11,000
12,000
1980 1982 1984 1986 1988 1990 1992 1994 1996 1998
Sal
es, t
ho
usa
nd
s
0
20,000
40,000
60,000
80,000
100,000
120,000
140,000
Reg
istr
atio
ns,
th
ou
san
ds
Car Sales Light Truck Sales Cars Registered Light Trucks Registered
Note: Light trucks registered was calculated to be 90% of trucks registered for 1995-1998, same percentage was assumed for years earlier; Source: NHSTA, Highway Statistics Serices
If the relative price of large cars increased, consumers with a strong preference for these cars mayalso switch to less fuel-efficient, used vehicles rather than to small cars. As Exhibit 6 displayed,there seems to be little to no growth in percentage share of used car sales – increasing from 80percent to 83 percent in the 1990s. Goldberg’s (1998) model results imply that the substitutioneffects between new and used cars are relatively small. Her model also shows little substitutionof “outside” goods (non-vehicle) for cars. The sum of her model results imply that price changesresulting from the CAFE regulation will have no effect on the sum of the new and used car sells,they will cause small shifts in the allocation between new and used car sales and will havesubstantial compositional effects within the fleet of new cars (compositional effects are describedin rebound effect, below).
Claims that cars have become less desirable with fuel economy improvements and designchanges are also linked with safety issues and social welfare. Decreasing vehicle weight is acommonly applied method to increase vehicle fuel economy. Although even a recent, extensivestudy by the National Highway Traffic Safety Administration (NHTSA, 1997) was not able tosuccessfully determine the correlation between size and weight to estimate their separate effectson safety, it is reasonable to conclude that reducing vehicle mass to improve fuel economy willrequire some trade-offs with safety. The average weight of domestically manufactured cars was4,380 lb in 1975, 3,711 lb in 1979, and 3,310 lb in 1983. By 1988 cars had become 25 percentlighter but maintained their interior size and carrying capacity. Horsepower to weight ratiosincreased despite decreases in engine size. Trucks followed the same pattern, reducing from4,227 in 1975 to 3,977 in 1983. However, since 1983 the weights of both cars and trucks haveincreased (Greene, 1996, 1998). As the demand for light trucks and vans increases,manufacturers are able to meet demands by utilizing more efficient technologies to make thesevehicles heavier and with improved acceleration. This years light vehicles have about the samefuel economy as those built 20 years ago. However, if the new light vehicle fleet had the sameaverage weight and performance as it did 20 years ago, it would have achieved 25% higher fueleconomy (EPA, 2000).
Another safety issue is to distinguish between private and public safety benefits of vehicle mass.Purchasing a larger, heavier vehicle increases the safety of its occupants but increases the risk of

Policy Options for Environmental Pollution Control, Roth Page 21
other motorists, cyclists or pedestrians who may collide with this vehicle. A study by NHSTA(1997) analyzed the injury crash rate with 100-pound reductions of passenger cars, light trucksand vans and both. As expected, an increased differential between weights of the vehicles in thecrash increased injury to the passengers in the lighter vehicle. Something else to consider is apoint made in the NRC (1992) study that the issue is not just the average weight change, but alsothe change in the distribution of weight that matters.
6.3 Vehicle Scrappage RatesAnother possible result of the standards is that, as consumers feel new cars become inferior, therelative value of old cars increases and they will consequently be kept longer by motorists, i.e.,the scrappage rate will decrease. This could show up as an increase in the age and expectedlifetime of vehicles and may eventually lead to an older and therefore less efficient vehicle fleet.Whether for this reason or another, data cited by Greene (1998) does show that this has occurred;the average age of a passenger car has increased from 5.6 years in 1970 to 6.6 years in 1980 to8.5 years in 1995. Expected lifetime, as well, has increased from 10.7 years in 1970 to 12.1 yearsin 1980 to 13.7 years in 1990. However, Exhibit 13 below shows that the median age of thecurrent fleet is currently only 8.3 years for automobiles and 7.6 years for light trucks (NHSTA).
Exhibit 13. Median Vehicle Age
4.0
4.5
5.0
5.5
6.0
6.5
7.0
7.5
8.0
8.5
9.0
1970 1975 1980 1985 1990 1991 1992 1993 1994 1995 1996 1997 1998
Med
ian
Veh
icle
Ag
e, y
ears
Automobiles
Trucks
Source: NHSTA, Highway Statistics Series
A better measure may be the fleet average fuel economy, which in 1978 was 27.5 and in 1995was 28 for automobiles but only 20.2 for light trucks4. Exhibit 14 and 15 show the fuel economychanges in the automobile and truck fleet, respectively. As shown, fuel economies haveincreased in the majority of automobile classes but have decreased in the most popular light truckclasses. Whether CAFE was the cause of this change is debated. These measures are alsoinfluenced by improved technologies that make vehicles more durable and able to last longer, aconsumer preference for light trucks and a steady rise of new car prices.
4 The appendix provides a more detailed data series of the CAFE standards and registered fleet fueleconomies.

Policy Options for Environmental Pollution Control, Roth Page 22
Exhibit 14. Automobile Fuel Economy
0
5
10
15
20
25
30
35
Min
icom
pact
Subco
mpa
ct
Compa
ct
Mids
ize
Larg
e
Two-se
ater
Auto
Fleet
Fu
el
Ec
on
om
y,
mp
g
1980 1990
1994 1997
Source: NHSTA, Highway Statistics Series
Exhibit 15. Light Truck Fuel Economy
0
5
10
15
20
25
30
Smal
l pick
ups
Larg
e pi
ckup
s
Smal
l van
s
Larg
e va
ns
Smal
l utili
ty
Larg
e ut
ility
Ligh
t Tru
ck F
leet
Fu
el E
con
om
y, m
pg
1980 1990
1994 1997
Source: NHSTA, Highway Statistics Series
6.4 Competition/Economic LossA possible trade effect of the CAFE standard is that there is a disincentive for domestic producersto move the production of small cars abroad because fuel efficient imports cannot be used tooffset less efficient domestically produced cars. While this serves to protect domestic jobs,Japanese producers with fuel efficient fleets are not effectively constrained by the standard andcan therefore compete more successfully in the market for large and luxury cars that hastraditionally been dominated by domestic manufacturers. Constraints felt by domesticmanufacturers to comply with CAFE standards may have allowed foreign manufacturers toprosper as domestic ones suffer. Some manufacturers, particularly Japanese, consistently exceedeven the 1985 standards of 27.5 MPG. Fuel efficiency standards in the US make domesticproduction costs higher than abroad (possibly due to different labor costs), evidence that therewas no consideration of manufacturer marginal costs when setting standards. In order toimplement fuel economy improvements, auto manufacturer managers must undertake major

Policy Options for Environmental Pollution Control, Roth Page 23
changes in vehicle design, usually of the entire fleet. This will cause the manager to incur coststhat could be passed on to the consumer, making their product less competitive. Domestically,standards may help reduce the risk of this move by forcing all manufacturers to comply, reducingthe competition within the automotive industry and between the industry and other products.However, requiring a technology standard does not account for all cost heterogeneity anddifferential impacts between manufacturers.
From 1979-1982 domestic manufacturers lost market share, possible as a result of thisoccurrence. But, the trend for imported car penetration is evident back through the 1950s(Greene, 1998) and after 1986 domestically manufactured cars made the greatest gains againstimports even though fuel prices were falling. Profit rates for the Big Three US manufacturers(Ford, General Motors, Chrysler) since 1978, however, have fallen. A more likely cause of thisdecline is the increased competition from foreign manufacturers and a loss of market share(imports consistently have a stronger hold in smaller car markets).
Another potential economic loss due to CAFE is possible because standards could distort thepricing of large and small vehicles, causing manufacturers to subsidize smaller, more efficientvehicles and raise prices on larger cars. Most studies assume that manufacturers adjust prices toinduce a sales mix change that will cause their sales-weighted MPG to achieve the standard.However, Greene and Fan, 1995) estimated that only ½ MPG of the increase in new light-dutyvehicle fuel economy since 1975 could be attributed to sales mix shifts. The rest, they stated, wasdue to changes in technology and design.
6.5 Rebound EffectCritics of CAFE claim that increasing fuel economy without imposing the appropriate tax willreduce the cost per mile of vehicle use and stimulate increased travel. The large numbers ofvehicles and miles driven, resulting in increasing air pollutant and greenhouse gas emissions,could overshadow efficiency improvements. The importance of this “rebound effect” is whetherits size is significant when compared with the benefits of the increased fuel economy. Therebound effect is dependent upon the elasticity of vehicle miles traveled (VMT) with respect tothe fuel cost per vehicle mile. The conclusion of Greene (1998) is that the elasticity of VMT withrespect to fuel cost is small – negating only approximately 10-20 percent of the fuel consumptionreductions and greenhouse gas emissions due to fuel efficiency changes. Goldberg (1998) echoesthis conclusion by estimating that the shift of composition of the new fleet towards more fuelefficient vehicles are unlikely to be completely neutralized by an increase in the utilization of thefuel efficient vehicles, so that policies with compositional effects (change on fleet characteristics,not size) appear to be promising.
6.6 Imperfect InformationImperfect information is a factor during the purchase of a new car. Consumers rarely take thetime and effort to optimize on each on every feature. Additionally, significant variation exists inthe fuel economy information presented to consumers. Economy numbers are already adjustedfor the average discrepancy between EPA tests and actual on-road experience, but this will varyby driving style and environmental conditions. Also, city and highway driving values are shownin the new car fleet – the highway number is 30-50 percent higher than the city number (Greene,1998). The motorist must determine their driving patter and compute the representative overalleconomy in order to value it. Future fuel prices, future annual driving rates and appropriatediscount rates would also have to be considered by the consumer to compute the net present valueof the fuel economy improvement. Finally, the car label does not present the consumer withinformation on how the fuel improvement has affected the price of the car. Consumers cannot

Policy Options for Environmental Pollution Control, Roth Page 24
optimize their fuel economy decisions because they lack the necessary information and it is notcost-effective to obtain it.
Quoted in articles supporting and degrading CAFE standards, data from the National ResearchCouncil’s 1992 study of automotive fuel economy show that estimates of potential for fueleconomy improvement based on industry data indicate less than a $100 variation in net presentvalue over an approximately 5 MPG range above current MPG levels. Calculations based onDOE data indicate a similar result for a 10-MPG range above present levels (Greene, 1998). Inother words, a change in fuel economy would be valued around ±$100 to the average consumer.The net value of higher fuel economy is assumed to be relatively flat over a fairly wide range offuel economy increases. This seems to show that the incentive to the customer is not large and, asa result, fuel economy may not directly affect consumer valuation of a vehicle.
6.7 OligopolyThe automotive manufacturing market can be classified as an oligopoly. The largestmanufacturers can observe competitor actions and chose to lead, follow or remain where they are.Even the Big Three violated CAFE standards this year due to the huge market share of vehicles inviolation and rather than strive to comply, the industry will pay fines instead. The increase inluxury car price that manufacturers include to cover CAFE fines is not shown. For a 2000Mercedes-Benz, this amount was about $688, for a new BMW - $900 and for a Porsche - $1,470.To be effective, fines must always be above the level of costs for polluters to control (Jackson).
7. FUTURE TRENDS – CAFEFuel economy continues to be a major area of road transport public and policy interest for threekey reasons:
• Environmental – Fuel economy is directly related to CO2, CO, particulate, NOx, and VOCemissions. Carbon dioxide is the most prevalent pollutant associated with global warming.The Kyoto agreement would require the U.S to achieve a 7% reduction in 1990 levels of CO2
emissions. Automobiles and light trucks each contribute approximately 20% of all U.S.carbon dioxide emissions (EPA, 2000). These pollutants contribute to health risks as well.
• Political – Automobiles consume approximately 45% of all U.S. oil consumption and lightvehicles consume about 40% (EPA, 2000). The oil price increase of 1999 and 2000 hasrenewed attention to oil dependence.
• Economic – Fuel economy is directly related to the cost of manufacturing a vehicle, fueling avehicle and is associated with many social costs.
Increasing the CAFE standards has been discussed in Congress since the early 1990s but thecontroversy over raising the standards has prevented any action. In 1994, the NHSTA issued anotice of proposed rulemaking to explore raising the CAFE standard for light-duty trucks but Forthe last 5 year, the Department of Transportation (DOT) Authorizations, the omnibus FY1999spending bill and the FY2000 DOE appropriations have included a general provision prohibitingthe use of authorized funds to carry out any rulemaking that would alter the CAFE standards.However, in June 2000 the Senate agreed to a motion that authorizes DOT, pursuant to a study bythe National Academy of Science (NAS), to recommend “appropriate” CAFE standards, subjectto approval by a Joint Resolution of Congress (Bamberger, 2000).
Fuel economy researchers have supported the notion of increasing CAFE to 50 MPG, believingthat the increase will result in additional emissions reductions. These proponents also believe thatthe efficiency improvement will be able to be done inexpensively and quickly. Public opinion

Policy Options for Environmental Pollution Control, Roth Page 25
polls quoted by Greene (1998) show approval ratings in the vicinity of 75 percent for maintainingor raising the CAFE standards. A December 1995 poll conducted for the Sustainable EnergyBudget Coalition showed that 94 percent of respondents favored “improving vehicle fuelefficiency” as a means of addressing the problem of US oil dependency. However, some feel thatchoosing to regulate only fuel economy will be a simple policy option but will overlookalternative policies that, while more difficult and contentious, would actually achieve the desiredgoals of meeting higher CAFE standards while maintaining or increasing economic, social andenvironmental objectives.
A broad analysis of increasing CAFE standards is shown in Exhibit 16. As shown, a 50 percentefficiency gain beyond current standards would have less fuel savings than the original standard.It is important to determine whether this fuel savings would be the desired and most cost-effective outcome.
Exhibit 16. Gasoline Saved (gallons) from On-road Fuel Economy IncreasesGasoline Used At…(on road fuel economy in MPG)Miles
DrivenSurvival
Rate 13.75 27.5 33 38 40 60 100New Car 13,500 0.966 982 491 409 355 338 225 135Year 1 12,500 0.989 909 455 379 329 313 208 125Year 2 12,000 0.979 873 436 364 316 300 200 120Year 3 11,500 0.964 836 418 348 303 288 192 115Year 4 10,500 0.941 764 382 318 276 263 175 105Year 5 9,750 0.910 709 355 295 257 244 163 98Year 6 8,500 0.866 618 309 258 224 213 142 85Year 7 7,830 0.809-0.080 569 285 237 206 196 131 78Year 8-20 180,040 13,094 6,547 5,456 4,738 4,501 3,001 1,800Gasoline saved (gallons for car surviving 20 years) 6,547 1,091 718 237 1,500 1,200PDV fuel cost (US$) for average car 6,138 3,069 2,558 2,221 2,110 1,407 844PDV incremental fuel saved (US$) for average car 3,069 512 337 111 703 563Source: Dowlatabadi, 1996 and updated
8. ALTERNATIVE POLICY OPTIONS
Road transport provides considerable opportunities for enhancing the environmental orientationof the tax system. Road transportation is already heavily taxed through vehicle purchase,registration, etc. By restructuring these existing taxes there is the opportunity for introducingenvironmental incentives. Complicating the issue is the wide range of social costs involved, thecomplex interactions between road transport, other transport modes and issues of spatialdevelopment. The costs of road use should arguably include social costs (externalities)associated with vehicle use including environmental costs (global and local air pollution), noiseand aesthetic losses, congestion costs and accident costs and the consumption of public roadinfrastructure as well as interactions between road transport, other modes of transport and issuesof land use and special development. It is impossible to recover all of these social costs. Some ofthe environmental costs differ in how closely they are related to the characteristics of the vehicleas well as individual transport decisions such as location and time of day of vehicle use.
Taxes would have to reflect the combined and interacting effect of different externalities andsimultaneously induce appropriate choices regarding the use of competing transport modes,location decisions and spatial development. To react to and influence all of these factors, anoptimal policy mix may be a combination of several instruments. Most likely, direct andcomplete capture of these costs would be impossible, making any taxation policy one that is
Policy Options for Environmental Pollution Control, Roth Page 26
“second best.” Therefore, several tax applications as well as a few other policy options that havebeen applied and suggested for road transport will be mentioned.
8.1 Gas-guzzler tax (luxury tax)To discourage the production and purchase of fuel inefficient vehicles, the Energy Tax Act of1978 established a Gas Guzzler Tax on the sale of new model year vehicles whose fuel economyfails to meet certain statutory levels. Beginning in 1980, any passenger car sold with a fueleconomy of less than 15 MPG was subject to the tax. The MPG limit was increased each of thenext 6 years until any car getting less than 22.5 MPG was defined as a guzzler5. Light-dutytrucks, which include pickups, minivans, full-size vans and SUVs, were exempted on the theorythat many were used in businesses or on farms. At the time, these vehicles made up about aquarter of new-vehicle sales. Now, however, light-duty trucks are almost half of all new sales,and are frequently used more for commuting and other daily chores. The graduated tax rates alsoincreased over time from a range of $200-$550 (depending on the fuel economy) in 1980 to$1,000-$7,700 in 1998. The Internal Revenue Service collected $48 million in gas-guzzler taxeson passenger cars in 1998 mainly on luxury sedans and high-end sports cars (Greene, 1998). Theamount of any applicable Gas Guzzler Tax paid by the manufacturer will be disclosed on theautomobile's fuel economy label.
There is an ongoing debate regarding extension of the Gas Guzzler Tax to light-duty trucks.Gloria Bergquist, spokeswoman for the Alliance of Auto Manufacturers, which represents 13major U.S. and foreign auto companies, said extending the gas-guzzler tax to light-duty truckswould raise costs for consumers while not hastening the availability of more fuel-efficient, lesspolluting vehicles. A recent study by the Washington-based nonprofit group Friends of the Earthconcluded that if these vehicles were held to the same 22.5-MPG standard, the industry as awhole would have paid the federal government $10.2 billion in additional gas-guzzler taxes in1999 - and $43.1 billion over the past five years. However, this statement ignores the fact that ifthese vehicles were included in the tax, manufacturers would most likely have improved fuelefficiency to avoid at least a portion of these fines. Other environmentalists have said theloophole acts as a subsidy for larger vehicles that burn more gas and cause more pollution. Littlequantitative study has been done to determine the effect of this policy, but it can be assumed thatthe tax had some effect on depressing the market for the largest, least efficient passenger cars.
8.2 Other TaxesSeveral other road transport taxes could be applied to aspects other than fuel economy andvehicle purchase including fuel content or fuel or vehicle use. The most appropriate means ofcontrol would be a tax the actual use of the vehicle because it is this use that results inenvironmental damage and resource consumption, but to do this directly would be difficult; thenext best option would be to tax fuel use, and assume this price will influence vehicle use. It isoften believe that efforts that reduce driving, such as an increase in gasoline tax, are preferablebecause they target fuel consumption in a direct and transparent way. The effectiveness of eithera vehicle or vehicle use tax depends on the efficiency of the market for automotive fuel economy.
8.2.1 Fuel TaxElasticities relevant to assess the impact of motor fuel taxation include the “own-price”relationship between the price of fuel and fuel consumption and the “cross-price” relationshipbetween public and private transport. Several European studies have determined the own-price
5 The tax does not apply to the actual on-the-road MPG, which may be more or less than the EPA publishedvalue. The combined fuel economy MPG value (55 % city, 45 % highway) and a slight adjustment toaccount for differences in test procedures made since the base year is used to determine tax liability.

Policy Options for Environmental Pollution Control, Roth Page 27
elasticity to be between –0.2 and –0.4 (Crawford, 1995). Additionally, studies have shown(Greene, 1998) that when gasoline prices rise car buyers opt for smaller cars. The relationshipbetween fuel price and car size choice suggests that fuel taxes would have an impact on theweight distribution of vehicles and, therefore, on public safety. Fuel economy standards do notinfluence consumer choice in this way. There is no definitive information on cross-priceelasticities.
Goldberg’s study, beyond evaluating CAFE effects as discussed earlier, also evaluated twoalternative policy proposals: abolishing the current CAFE program and replacing the current fuelefficiency standards with higher gasoline taxes. The simulation was performed for 1989. Whenthe standards were abolished, US fuel consumption increased 19 million gallons. There was a 1.2MPG drop in the domestic car fuel efficiency due to the absence of CAFE and that small, fuelefficiency cars would now be imported and excluded from this calculation. This creates theillusion of CAFE fuel savings when only a part of this reduction is due to compositional changesand most is due to domestic/import mix. Small car prices rose slightly while others dropped.Small car market share dropped slightly while large car increased. Domestic shares of small carsdecreased significantly while large car domestic shares increased. If gasoline taxes were toreplace the fuel efficiency standards, the tax would affect both new and used cars and there wouldbe no reason to expect any substitution towards less efficient used cars when taxes are raised.The model shows that an 80 cent per gallon (nearly double the 1989 price) increase would benecessary to be equivalent to get the same fuel savings as CAFE standards.
Distributional effects must also be considered with this and all policy instruments. If a taxationinstrument is used at the high levels suggested might be necessary to induce change these effectscould be significant. However, the pattern of distributional incidence would vary betweencountry, region, etc. depending on the pattern of vehicle ownership and use. High taxes onpetroleum may, in the short run, be unacceptable for their impact on certain groups, such as ruraldwellers for whom no alternatives to gasoline consumption may be available. A much greatershare of post-tax income may also be taken from lower income households than from higher-income households (Crawford, 1995).
8.2.2 Other Tax FormsSeveral different types of road transport taxes (and reform of existing taxes) have been used inwestern Europe. Sales taxes on new cars may reduce the rate at which the existing vehicle stockis replaced, but some countries have seen environmental benefits in an acceleration of thereplacement of older vehicles with new, less polluting vehicles. For example, Greece offersincentives to scrap old vehicles. Several countries have introduced tax incentives for “clean”cars. Germany and the Netherlands have tax incentives to accelerate the take-up of catalyticconverters, ahead of EU requirements. Others have lower rates of tax exemptions for electricand/or gas-powered vehicles. Others have begun to differential initial or annual vehicle taxes onprivate cars by engine size or other factors affecting fuel use. Current debate in the UK centersaround subsidies offered for company cars; there is concern whether these subsidies inducehigher rates of vehicle ownership, greater mileage driven or the purchase of larger vehicles in theabsence of the subsidy. Another concern is commuting tax breaks offered in some Europeancountries, including Germany and the Netherlands, that this may encourage excessive commutingdistances or commuting using private cars rather than public transport. Several Europeancountries level specific excise taxes on motor fuel in the form of a fixed amount per volume(rather than a percentage of the price). A Value Added Tax (VAT) is also applied above this tax.For EU member states, this is at least 15 percent. The combined effect of these taxes is the motorfuels are taxes more substantially than other goods and other uses of energy. Recently a taxdifferential has been introduced in several EU countries between leaded and unleaded petroleum

Policy Options for Environmental Pollution Control, Roth Page 28
and between petroleum and diesel to encourage switching. Tax incentives for alternative fuelsare also in use, and should be great enough to make up for the higher capital costs of suchvehicles for those consumers who would not purchase otherwise. Other taxes applied in somecountries include a carbon tax, taxes to fund public works on infrastructure and R&D, increasedtaxes on parking in urban areas and others. Road-use charges and tolls are widely applied inWestern Europe, as are explicit congestion charges in city centers (Crawford, 1995). Accordingto the Bureau of Transportation Statistics (NTS, 1999), wasted fuel due to congestion rose 149percent from 1982 to 1996 when it reached 6,725 gallons.
Only if the taxes closely proxy underlying environmental costs will the incentive provided by thetaxation lead to efficient changes in the use of polluting vehicles. Effective taxes would reducevehicle ownership and vehicle use, increase fuel efficiency, and induce individual substitutionfrom private motoring to public transport. Any revenue-raising tax should be levied over andabove any level of taxes imposed for purposes of correcting externalities (Crawford, 1995).
8.3 Other InstrumentsWith a volume average fuel economy (VAFE) system, the fuel economy standards could be madea function of the interior volume of vehicles on the market. Motor vehicles of differing volumewould be given different fuel economy standards. This would avoid many of the problemsdiscussed above for CAFE standards.
A percent improvement standard would not specify a particular fuel consumption standard forvehicles, but would require all manufacturers to improve the average fuel economy performanceof their vehicle fleets by a designated percentage over a period of years.
Feebates are a combination of fee and rebate. They would most likely be used for new carpurchases – consumers would pay an extra fee if the vehicle were an inefficient user of fuel, oralternatively get a rebate if it were energy-efficient. The neutral point would be set so that feesand rebates balanced, so it became neither an inflationary measure nor a disguised tax.
In mid-April, 2000, the vehicle manufacturer industry indicated its support for a house bill, theAdvance Technology Motor Vehicle Fuel Economy Act of 2000, which would provide tax credits(essentially a subsidy) for hybrid vehicles with rechargeable energy storage systems. Thelegislation would also require a study by the National Academy of Sciences (NAS) of “voluntary,mandatory, and other means and measures…for purposes of conserving energy” in thetransportation sector (Bamberger, 2000).
Information programs and methods that rely on public opinion to affect markets may also relateto transportation. Recently, Ford Motor Co. and General Motors have announced that they willbe voluntarily increasing the fuel efficiency of their SUVs by 25% by the 2005 model year. If allmanufacturers were to make this reduction, the average new light vehicle fleet fuel economywould increase to 30 mpg (EPA, 2000). Another public disclosure-type policy would be energy-consumption labeling, which is already done on new vehicle stickers.
The Clean Car Campaign is a national campaign coordinated by state, regional and nationalenvironmental organizations that promotes the development and sale of advanced technologyvehicles that meet the “Clean Car Standard” is a performance-based standard that claims to beachievable using the best practices currently used by the global auto industry. It includesimprovement of 1.5 times the fleet average fuel efficiency (by class), tailpipe emissions meetingCalifornia’s Super Ultra Low Emission Vehicle (SULEV) standard, and clean manufacturingprocesses. The Clean Car Standard essentially forces use of the best available technology, which

Policy Options for Environmental Pollution Control, Roth Page 29
will not be cost-effective for all manufacturers. However, clean manufacturing is a move towardslife-cycle sustainable development. The campaign also works to support public policies thatcould motivate automakers to invest in vehicle designs and production processes that reduceadverse environmental impacts of their industry and its products. It could also encourage thepurchase of cleaner vehicles by consumers and fleet buyers who choose to sign the “Clean CarPledge.”
9. CONCLUSIONS – ROAD TRANSPORT
From the information and data presented, several road transport trends are evident including:
• During the past 10 years, fuel economy for automobiles is increasing at a slower pace thanbefore and light truck fleet fuel economy is decreasing, especially in the SUV class.
• Light truck sales have increased dramatically during the past 20 years and now represent over40% of the private and commercial market.
• Fuel economy is being traded by consumers for weight and power in light vehicle fleet.• Non-energy costs such as safety, congestion and road maintenance should be considered by
manufacturers and regulators.• There is a low price elasticity of demand for fuel economy.• The elasticity of VMT in response to fuel cost is small.• Market failures in the road transport market may make market based instruments less
effective.
The combination of the road transport market failures discussed previously (imperfectinformation, risk aversion, cartel pricing, oligopololistic competition) may make it very likelythat fuel economy standards will be more effective than a motor fuel tax. Several of the definingcharacteristics of the automotive market make application of a tax policy difficult and notoptimally effective. Additionally, gasoline taxes are likely to have an unfavorable public andpolitical response and equity issues; studies have shown that they would have to be greatlyincreased in order to reduce vehicle use and fuel consumption significantly. However, a motorfuel or vehicle use tax is essential if policies are to be economically efficient. CAFE hascharacteristics of both an internal tax (on fuel inefficiency) and subsidy (on fuel efficientvehicles) within each firm, suggesting that CAFE may provide satisfactory welfare overall.Therefore, it is believed that taxes will be most effective if used in conjunction with fuel economystandards. Because these standards are already in place, the next question is whether taxes shouldbe used in conjunction with fuel economy standards at current or raised levels. Fuel economystandards can be increased, but the technology must be available to achieve increased MPG atcosts that are not greater than the direct fuel savings to consumers plus the value of fuelefficiency. If CAFE standards are increased, care must be taken to ensure that cost-effective,marketable technologies are available to meet the standards. If these technologies are alreadyavailable there is less need for concern for heterogeneous control costs.
Greene (1998) stated that there is no reason why a well-chosen technology standard, incombination with a tax on the activity (vehicle travel), could not achieve precisely the same resultas an optimal externality tax imposed directly on the externality itself. However, this may limitincentives for technological development, as discussed earlier. Taxing only the vehicle travelcould fail to produce the appropriate changes in technology and would be very difficult tomonitor and enforce. If emissions, the precise cause of external damage, is to be taxed, there isthe problem of accurately measuring each vehicle’s emissions and collecting the tax and

Policy Options for Environmental Pollution Control, Roth Page 30
emissions vary importantly according to how a vehicle is operated and maintained, and damagesvary according to weather conditions, location, and many other factors.
Based on these observations and arguments, several policy options are recommended:
• Include light-duty trucks in the same fuel economy standards as automobiles;• Replace CAFE standards with VAFE standards or adjust CAFE fines to be binding;• Support development of environmentally friendly transportation technologies;• Increase gasoline taxes at the pump so that new and used cars are affected;• Implement transport management policies to reduce urban congestion; and• Improve new vehicle labeling to represent actual fuel economy and increase in price due to
improve economy or fuel economy fines. Fuel economy labeling should be shown separatelyfrom the large amount of information currently shown on new vehicle stickers.
A combination of some of the instruments discussed above is likely to have the best result.Another point, which has not been mentioned often in the literature, is the necessity to performlife-cycle analyses of automobile manufacture, fuel and road transport. Many of the calculationsprovided neglect the emissions of greenhouse gases associated with materials selected during themanufacture of vehicles. This is especially important as manufacturers switch to lightweightsubstitutes. It may be possible that other environmental pollution is more important to addressthan the types improve fuel economy affects. As discussed previously, when an activity such asvehicle travel produces an external cost, even perfectly competitive markets will fail to naturallyallocate resources in a way that maximizes social welfare. However, technology change invehicle production has altered the relation between the level of activity and the amount ofenvironmental damage caused by it. Advanced pollution control technology, such as front wheeldrive, three-way catalytic converters, multi-point fuel injection, and electronically controlledcombustion has led to estimates by DOT that the average vehicle on the road In 1994 emittedone-half to one-fourth (depending on the pollutant) as much pollution as the average vehicle inuse in 1970 (Greene, 1998). Therefore, if emissions control continues to improve, fuel efficiencyimprovements may reduce fuel consumption but do little for pollutant emissions.
Studies have shown that actions to increase enforcement have decreased pollution and non-compliance, which, in turn, increases self-reporting. This supports the notion of combiningregulation with public disclosure and voluntary programs. Public disclosure introduces manymore stakeholders and many more forms of incentives. Fuel economy labels on new cars is notenough; consumers should become aware of vehicle emissions, manufacturer processes andenvironmental consequences. Manufacturers of transportation equipment already fall under thereporting requirements of the Toxic Release Inventory (TRI) and other non-industry specificreporting requirements, but this information should be more available and visibly linked tovehicle purchases. Increased public disclosure of vehicle manufacturer fuel economies, CAFEfines, Gas Guzzler taxes and other environmental compliance indicators may affect consumerchoices and fleet emissions. The regulators role may move from designing, monitoring andenforcing rules and standards to gaining leverage through non-traditional programs that harnessthe power of communities and markets.
Consumers and analysts must realize that trade-offs are constantly being made by individuals,manufacturers and governments between safety and cost, other vehicle attributes, convenience,etc. Consumers perform the same trade-offs as they consider risk versus money and fueleconomy, which saves money. Sustainable development, in this and many contexts, cannot beinterpreted to imply that all components of human welfare are to be sacrificed in the interests of

Policy Options for Environmental Pollution Control, Roth Page 31
preserving the environment exactly in the form it happens to be in today. It does, however, havethe goal of maximizing society’s welfare.
If the market for fuel economy operated efficiently and if external costs and other market failuresassociated with petroleum fuel use by vehicles were minor then fuel economy standards wouldcause market distortions that would cost manufacturers profits and force inferior vehicles onconsumers. However, the above discussion has shown, this market does not operated efficientlyand if the market failures associated with motor vehicle consumption of petroleum are significant,then regulation could produce a result that is preferred by consumers, profitable by manufacturersand beneficial to society.

Policy Options for Environmental Pollution Control, Roth Page 32
WORKS CITED
Afsah, Shakep, Blackman, Allen and Demayanti Ratunanda, How Do Public Disclosure PollutionControls Work? Evidence from Indonesia, Discussion Paper 00-44, Resources for theFuture, October 2000.
Bamburger, Robert, Automobile and Light Truck Fuel Economy: is CAFE Up to Standards?, TheNational Council for Science and the Environment, September 22, 2000.
Bigano, A., Proost, S. and J. Van Rompuy, Alternative Environmental Regulation Schemes forthe Belgian Power Generation Sector, Environmental and Resource Economics 16(2000) 121-160.
“Controlling pollution – A new approach,” World Bank Policy and Research Bulletin, 7(4)October-December 1996.
Crawford, I. and S. Smith, Fiscal instruments for air pollution abatement on road transport,Journal of Transport Economics and Policy 24(1) 1995, 33-51.
Dowlatabadi, Hadi, Lave, Lester B. and Armistead G. Russel, A free lunch at higher CAFE?,Energy Policy 24(3) 1996, 253-264.
“The Effect of Decreases in Vehicle Weight on Injury Crash Rates,” National Highway TrafficSafety Administration, January 1997
“Energy Star Program Expands to Europe,” Energy Star Fact Sheet, U.S. Department of Energy.
Espey, Simone, Renewables portfolio standard: a means for trade with electricity fromrenewable energy source?, Energy Policy 29 (2001) 557-566.
Foulon, Jerome, Lanoie, Paul and Benoit Laplante, Incentives for Pollution Control: Regulationand(?) or(?) Information, World Bank, October 1999.
Goldberg, Pinelopi Koujianou, The Effects of the Corporate Average Fuel Efficiency Standards inthe US, Journal of Industrial Economics, 46(1) 1-33.
Greene, David L., CAFE or Price?: An Analysis of the Federal Fuel Economy Regulations andGasoline Price on New Car MPG, 1978-1989, The Energy Journal 11(3) 37-57.
Greene, David L., Why CAFE worked, Energy Policy 26(8) 1998, 595-613.
Harrington, BW and MK Macauley, Competition and car longevity, Manuscript, Resources forthe Future, Washington, D.C.
Hawkins, R., The Use of Economic Instruments and Green Taxes to Complement anEnvironmental Regulatory Regime, Water, Air, and Soil Pollution, 123 (2000) 379-394.
Highway Statistics Series, National Highway Traffic Safety Administration, Summary to 1995,1996, 1997, 1998 and 1999.
Jackson, Les, The hidden cost of CAFE, Automotive News

Policy Options for Environmental Pollution Control, Roth Page 33
Jaffe, Adam B. and Robert N. Stavins, Dynamic Incentives of Environmental Regulations: TheEffects of Alternative Policy Instruments on Technology Diffusion, Journal ofEnvironmental Economics and Management 29, S-43-S-63 (1995).
Jaffe, Adam B. and Robert N. Stavins, Energy-efficiency Investments and Public Policy, TheEnergy Journal 15(2) 1994 43-62.
Jaffe, Adam B., Newell, Richard G. and Robert N. Stavins, Energy-efficient Technologies andClimate Change Policies: Issues and Evidence, Climate Issue Brief No. 19, Resources forthe Future, December 1999.
Jaffe, Adam B. and Robert N. Stavins, The Energy Efficiency Gap: What Does it Mean?, EnergyPolicy 22 (10), October 1994: 804-810.
Jaffe, Adam and Robert Stavins, The Energy Paradox and the Diffusion of ConservationTechnology, Resource and Energy Economics 16:2 May 1994.
Lazzari, Salvatore, Global Climate Change: The Energy Tax Incentives in the President’sFY2000 Budget, Congressional Research Service Report for Congress, February 1999.
“Light-Duty Automotive Technology and Fuel Economy Trends 1975 Through 2000,” U.S. EPAOffice of Air and Radiation, EPA420-R00-008, December 2000.
Nash, Jennifer and John Ehrenfeld, Codes of Environmental Management and Practice:Assessing Their Potential as a Tool for Change, Annual Review of Energy and theEnvironment 1997 22:487-535.
Newell, Richard G., Jaffe, Adam B. and Robert N. Stavins, The Induced Innovation Hypothesisand Energy-Saving Technological Change, The Quarterly Journal of Economics, August1999, 941-975.
Portney, Paul R. and Robert N. Stavins, Public Policies for Environmental Protection, SecondEdition, Resources for the Future, 2000.
Smil, Vaclav, Energy in the Twentieth Century: Resources, Conversions, Costs, Uses, andConsequences, Annual Review of Energy and the Environment 2000 25:21-51.
Teotia, Arvind et. al, CAFE compliance by light trucks: economic impacts of clean diesel engine,Energy Policy 27 (1999) 889-900.
Tietenberg, Tom, Environmental and Natural Resource Economics, Fifth Edition, AddisonWesley Longman, Inc., 2000.
Tietenberg, Tom, Tradable Permits and the Control of Air Pollution in the United States, 10th
anniversary jubilee edition of the Zeitschrift Furangewandte Umweltforschung.
Tsutsumi, Rie, The nature of voluntary agreements in Japan – functions of Environmental andPollution Control Agreements, Journal of Cleaner Production 9 (2001) 145-153.

Policy Options for Environmental Pollution Control, Roth Page 34
Zofio, Jose L. and Angel M. Prieto, Environmental efficiency and regulatory standards: the caseof CO2 emissions from OECD industries, Resource and Energy Economics 23 (2001) 63-83.
Internet Sites
www.cleancarcampaign.org/standard.htmlThe Clean Car Campaign/Green Vehicle Standard
www.nrel.gov/documents/profiles.htmlProfiles in Renewable Energy: Case Studies of Successful Utility-Sector Projects
www.riskworld.com/Nreports/1996/risk_rpt/html/nr6aa017.htmChapter 5.4 Alternatives to Command-and-Control Regulation
www.spea.indiana.edu/Richardsv625home/LeadPoisoning/PolicyIssues.thmThe Economics of Lead Poisoning – Policy Options for Solving Environmental Problems.
www.tellus.org/energy/newsletters/enpers61.htmlThe Kyoto Protocol: A First Step Toward Climate Protection, The Newsletter of the EnergyGroup at Tellus Institute 6(1) February 1998.
www.worldbank.org/nipr/newappr.htmWorld Bank site: Incentives & Behavior
www.worldbank.org/nipr/envmat/index.htmWorld Bank site: Persuasion & Incentives/New Ways to Achieve a Cleaner World
www.fueleconomy.govU.S. DOE and U.S. EPA site for the fuel economy guide and information on vehicle comparisons,gas mileage tips, advanced technologies, etc.

Policy Options for Environmental Pollution Control, Roth Page 35
APPENDIX
Fuel Economy Standards for Passenger Cars and Light Trucks: Model Years 1978-1999Light TrucksModel
YearPassenger
Cars Two-Wheel Drive Four-Wheel Drive Combined1978 18.0 -- -- --1979 19.0 17.2 15.8 --1980 20.0 16.0 14.0 --1981 25.0 16.7 15.0 --1982 24.0 18.0 16.0 17.51983 26.0 19.5 17.5 19.01984 27.0 20.3 18.5 20.01985 27.5 19.7 18.9 19.51986 26.0 20.5 19.5 20.01987 26.0 21.5 19.5 20.51988 26.0 21.0 19.5 20.51989 26.5 21.5 19.0 20.01990 27.5 20.5 19.0 20.21991 27.5 20.7 19.1 20.21992 27.5 -- -- 20.21993 27.5 -- -- 20.41994 27.5 -- -- 20.51995 27.5 -- -- 20.61996 27.5 -- -- 20.71997 27.5 -- -- 20.71998 27.5 -- -- 20.71999 27.5 -- -- 20.72000 27.5 -- -- 20.7Source: Bamberger, 2000; all caveats are not provided
Sales-weighted fuel economies of automobiles and light trucks, mpg1980 1985 1990 1991 1992 1993 1994 1995 1996 1997
Auto Fleet 23.2 27.0 27.6 27.7 27.7 27.8 27.8 28.0 28.3 28.3Minicompact 29.4 32.7 26.4 29.3 30.6 29.9 27.8 27.0 27.2 26.3Subcompact 27.3 30.1 31.3 31.6 31.8 31.9 31.3 31.7 32.1 32.6Compact 22.3 29.6 28.9 28.8 28.7 29.3 29.8 30.2 30.4 30.0Midsize 21.3 24.9 25.9 25.9 25.8 25.7 25.6 25.9 26.4 26.3Large 19.3 22.3 23.5 23.3 23.7 24.0 24.2 24.1 24.2 24.5Two-seater 21.0 27.6 28.0 27.3 25.9 24.8 23.9 24.7 25.4 26.3Light Truck Fleet 18.1 20.4 20.5 20.6 20.4 20.5 20.4 20.2 20.4 20.1Small pickups 25.5 26.8 25.2 25.7 25.0 24.9 25.3 25.6 25.6 24.6Large pickups 17.0 19.0 18.9 18.8 18.9 19.6 20.1 19.4 18.9 19.4Small vans 19.6 23.9 23.1 22.6 22.5 22.9 22.1 22.8 22.8 22.9Large vans 16.3 16.4 16.9 17.4 16.9 17.3 17.4 17.1 17.2 17.8Small utility 16.9 22.1 21.9 21.1 20.9 21.3 20.7 20.8 21.1 19.6Large utility 14.6 16.6 16.1 16.4 16.9 17.5 17.8 17.4 18.2 18.2Source: NHSTA, Highway Statistics Series