air pollution control policy options for metro manila
TRANSCRIPT

Air Pollution Control Policy Options for Metro Manila
Alan Krupnick, Richard Morgenstern, Carolyn Fischer, Kevin Rolfe, Jose Logarta, and Bing Rufo
December 2003 • Discussion Paper 03-30
Resources for the Future 1616 P Street, NW Washington, D.C. 20036 Telephone: 202–328–5000 Fax: 202–939–3460 Internet: http://www.rff.org
© 2003 Resources for the Future. All rights reserved. No portion of this paper may be reproduced without permission of the authors.
Discussion papers are research materials circulated by their authors for purposes of information and discussion. They have not necessarily undergone formal peer review or editorial treatment.
Air Pollution Control Policy Options for Metro Manila
Alan Krupnick, Richard Morgenstern, Carolyn Fischer, Kevin Rolfe, Jose Logarta, and Bing Rufo
Abstract The Asian Development Bank has sponsored research on market-based instruments for managing
pollution in Metro Manila, Philippines, where air quality is seriously degraded. This report offers three policy options for reducing particulate emissions and their precursors. For stationary sources, we recommend an emissions fee that creates efficient financial incentives to reduce emissions while raising revenues for monitoring and enforcement activities. For mobile sources, we propose a pilot diesel retrofit program using a low-cost technology that is effective at existing 2,000 ppm sulfur content. Second, we recommmend a charge on the sulfur content of diesel fuel to encourage meeting and surpassing the 500 ppm standard to allow for more advanced particulate trap technologies. Although better data are needed—both for designing controls and for evaluating their efficacy—much can be learned just by implementing these programs, so we make recommendations for starting points.
Key Words: air pollution, emissions tax, Philippines, particulates
JEL Classification Numbers: Q25, Q01

Contents
1. Introduction......................................................................................................................... 1
2. Emissions Inventory............................................................................................................ 6
3. Stationary Sources .............................................................................................................. 9
3.1 Background................................................................................................................. 10
3.2 Rationale for Emissions Fee ....................................................................................... 10
3.3 Stationary Emissions Control Technologies............................................................... 11
3.4 Existing Legal and Institutional Foundations ............................................................. 13
3.5 Emissions Fee for Stationary Sources......................................................................... 16
3.6 Summary ..................................................................................................................... 30
4. Mobile Sources .................................................................................................................. 30
4.1 Background................................................................................................................. 31
4.2 Emissions Inventory.................................................................................................... 32
4.3 Retrofitting Diesel Exhausts with Particulate Traps................................................... 32
4.4 Sulfur in Diesel ........................................................................................................... 36
4.5 Sulfur Charge Design................................................................................................. 41
4.6 Summary ..................................................................................................................... 44
5. Key Unresolved Issues ...................................................................................................... 45
5.1 Data ............................................................................................................................. 45
5.2 Capacity Building ....................................................................................................... 46
5.3 Implementation and Assessment................................................................................. 46
References.............................................................................................................................. 48
Appendix................................................................................................................................ 50

Air Pollution Control Policy Options for Metro Manila
Alan Krupnick, Richard Morgenstern, Carolyn Fischer, Kevin Rolfe, Jose Logarta, and Bing Rufo
1. Introduction
Although air quality monitoring in the Philippines has been sporadic and lacks good quality assurance, there is no doubt that the air quality of Metro Manila is seriously degraded. Most obvious is the presence of atmospheric particles that reduce visibility on most days, but there is also evidence of very high concentrations of fine (invisible) particles, and occasional excessive levels of some gases associated with motor vehicle emissions.
The Asian Development Bank has supported various initiatives to address Manila’s serious air quality problems, with studies of vehicular emissions control planning and air quality improvement. Those preparatory projects led to loans and a technical assistance grant that together make up the Metro Manila Air Quality Improvement Sector Development Program. The program commenced in 1999 and was projected to run until 2002.
The primary goal of this program is to research the application of market-based instruments, such as emissions fees, for managing both stationary and mobile sources of pollution in Metro Manila. There is general acceptance of the use of marked-based instruments in the Philippines as an adjunct to command-and-control measures, and this acceptance is long-standing. Such instruments featured prominently in the first drafts of the Clean Air Bill in the early 1990s, and they are part of the Philippine Clean Air Act of 1999 and its subsequent regulatory documents. Emissions fees in particular have political support in the government, since they can both improve incentives regarding pollution and raise revenue for the relevant agencies for monitoring and enforcement. Furthermore, the Philippines already has experience with emissions fees.
The Philippines is a developing country competing with its neighbors for needed investments. Although environmental regulations may create some disincentive for investment, emissions fees offer less costly ways of achieving air quality improvements. Moreover, the Philippine people are already laboring under pollution-caused health conditions that lower productivity; by improving the health of its labor force, the Philippines may gain a competitive
1
Resources for the Future Krupnick, Morgenstern, Fishcer, Rolfe, Logarta, Rufo
edge. Even though many countries in Asia are adopting more stringent environmental policies, Manila may stand to gain more, if only because it has some of the worst air pollution in Asia.
The Philippine Clean Air Act of 1999 establishes National Ambient Air Quality Guidelines for Criteria Pollutants. It is clear that the Metro Manila area is in “nonattainment” status for particulate concentrations. This status has implications for the introduction of emissions charges to stationary sources, because the implementing rules and regulations of the act require that in nonattainment areas, a 50% surcharge be applied to the emissions fees.
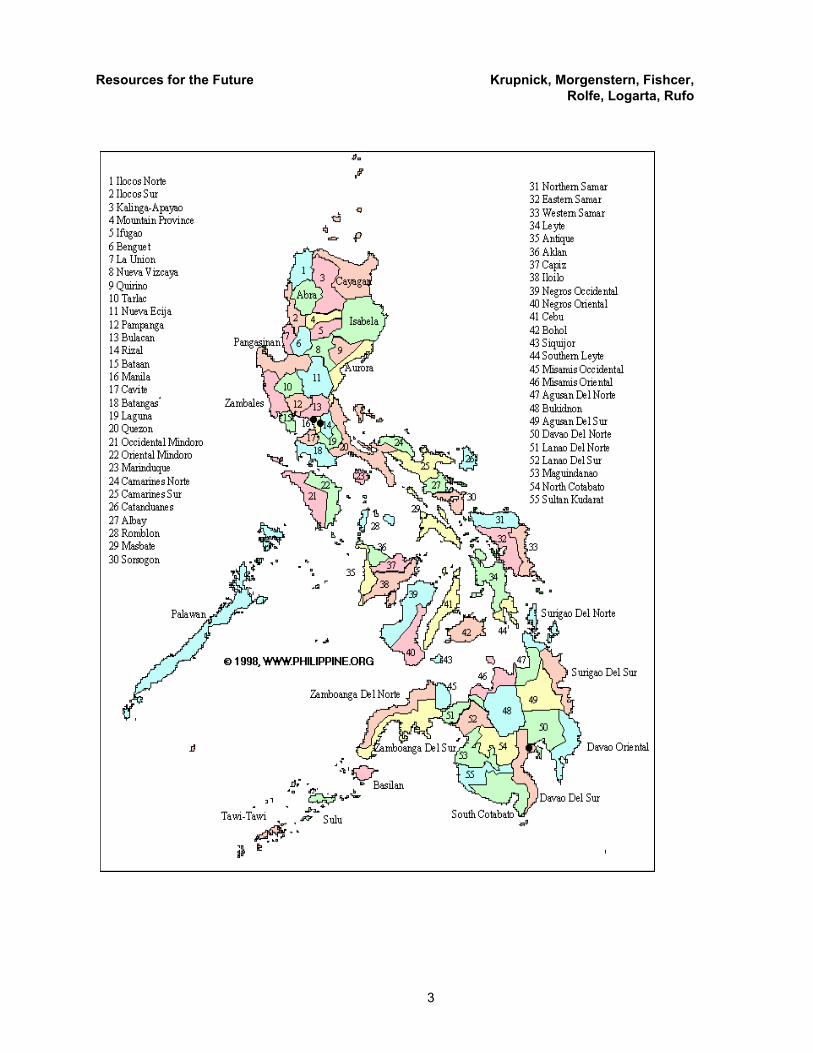
The air quality problems in the Philippines arise principally from domestic sources. Given its geography and meteorology and the absence of emissions from neighbors to the west, the country does not suffer from the continental problems of long-range transport of particles, ozone, or acid deposition. Because of its more southerly location, the Philippines is less affected by emissions of yellow sand (loess) that blow across much of East Asia, especially Korea and Japan. Similarly, the Philippines is less affected than other Southeast Asia countries by smoke from forest fires in Indonesia, although the most extreme events of 1997 did have some impact in the southern provinces. Our geographic focus is the Metro Manila airshed, which stretches from Pampanga and Bulacan in the north to Batangas in the south, and from Bataan and Cavite in west to Rizal, Laguna and part of Quezon in the east.
2
Resources for the Future Krupnick, Morgenstern, Fishcer, Rolfe, Logarta, Rufo
3

Resources for the Future Krupnick, Morgenstern, Fishcer, Rolfe, Logarta, Rufo
The air pollutant most studied in Metro Manila has been particulate matter in its various forms. An extensive record of monitoring data for total suspended particulates (TSP) is available. Mostly unmonitored are particles of diameter in specific ranges—particulate matter 10 microns or less (PM10), and PM2.5. The species of particles that make up these various measures is also largely unmeasured. However, some useful data from one residential monitoring site for PM2.5 have recently become available and are presented below.
Data on fine particulates and their species composition are critical for designing effective pollution control strategies. From many of the best analyses of the epidemiological literature around the world (Pope et al. 2002, 1995; Schwartz and Dockery 1992), it is evident that fine particulate concentrations are the primary issue of concern for air quality effects on health, with emphasis on the fine particulate species of sulfates, whether acidic (e.g., sulfuric acid) or basic (e.g., ammonia sulfate). In contrast, nitrate species of fine particulates have not been demonstrated to have health effects. Diesel particles have been linked to carcinogenic effects and, being 1 micron or less in diameter, may be particularly damaging to the lung.
Our reading of the monitoring data (see the Appendix) and the epidemiological literature suggests that the major air quality problem in Metro Manila is particulates. NOx emissions, as they relate to PM concentrations, are probably not very important pollutants in the Philippines, but SO2 emissions, as they relate to PM concentrations, are important. Diesel particulates and fine particulates in general are probably the most important to control. Ozone is not to be ignored in developing a comprehensive air quality strategy, but any violations of ozone standards are likely less serious. Therefore, our strategies focus on reducing particulate emissions and their precursor emissions.
Following Ruzicka et al. (2002), we have been guided in our choices by several criteria: (1) effectiveness, (2) administrative cost, (3) impact on the industry, and (4) impact on income distribution (considered qualitatively rather than quantitatively). We supplement this list to include cost-effectiveness and consistency with the nature of the air quality problem in Metro Manila. In choosing our policy recommendations, we have been troubled by informational uncertainties, particularly regarding the emissions inventory and air quality data, but also regarding compliance costs and firm-level impacts. As a result, many of our recommendations come in the form of policy options.
Given the gaps in crucial information for stationary sources, we developed a methodology for designing an appropriate emissions fee program instead of prescribing exact values for the elements. The ultimate decisions about the appropriate rate would be political and,
4
Resources for the Future Krupnick, Morgenstern, Fishcer, Rolfe, Logarta, Rufo
ideally, informed by better data. In the meantime, though, much can be learned about the costs and benefits of pollution reduction just by implementing the program, so to this end we make recommendations for starting points.
The importance of mobile sources in air quality problems in Metro Manila leads us to offer two recommendations that we believe are feasible and appropriate for the Philippines. One is a restructuring of the diesel fuel tax to create incentives for reducing sulfur. The other is a pilot program for retrofitting particulate traps on diesel vehicles; though not a market-based incentive program in itself, incentives could certainly be used to facilitate a broader implementation. The idea for a pilot program was motivated by practicality and a need to ascertain the cost-effectiveness of such a solution.
Given the very limited information on PM constituents, the policy options for both stationary sources and mobile sources are bifurcated: one part can be implemented unconditionally, and the other would depend on the outcome of further collection and analysis of particulate concentration data. Based on data from a single monitoring site, PM in Metro Manila appears to have a relatively low fraction of sulfates and a relatively high fraction of carbon. These findings are surprising and need further clarification. If supported by more data, they indicate a stronger focus on reducing particulate emissions and less attention to sulfates. For example, in the case of diesel retrofit technology, it might then be advisable to lower the sulfur content in fuel enough to enable the more effective catalyst technologies to work, rather than reduce sulfur in fuels for its own sake.
This Resources for the Future discussion paper integrates the work of our local consultants (Bing Rufo and Jose Logarta) and international consultant Kevin Rolfe, who together with local consultant Charlon Gonzales developed the emissions inventory. We include sections from the Rolfe report in this report.
In Section 2 we review what is known about emissions in Metro Manila. Section 3 describes stationary sources of emissions and presents recommendations for market-based instruments to reduce them; Section 4 concerns mobile sources. Section 5 considers the unresolved issues that complicate efforts to improve air quality in Metro Manila. The Appendix provides additional background information on air quality, stationary and mobile source control options, and the administrative costs and enforcement issues for air pollution control.
5

Resources for the Future Krupnick, Morgenstern, Fishcer, Rolfe, Logarta, Rufo
2. Emissions Inventory
Rolfe (2002) analyzed combustion-related emissions from stationary and vehicular sources in the Metro Manila airshed. For PM10, Rolfe finds that total industrial emissions are about equal to vehicular emissions (37,000 and 39,000 tons, respectively). The major types of stationary sources of PM are thermal power stations, cement works, and refineries. Other industrial sources, numbering about 750, contribute the remaining four-fifths of total stationary source emissions. This distribution, with emissions coming from many plants producing many types of products, complicates the development of control strategies. Table 2.1 summarizes the results for stationary sources.
Table 2.1. Estimated Emissions from Stationary Sources in Metro Manila, 2000
(in thousands of metric tons)
Sources Plants PM10 NOx SOx
Thermal power stations 21 3.1 75 54
Cement works 10 1.1 4.9 0.50
Oil refineries 3 1.4 2.3 14
Other industrial sources ± 750 31 34 89
TOTALS ± 800 37 120 160
Source: Rolfe (2002).
There are several reasons to believe that stationary source emissions are significantly greater than those estimates, however. First, the self-monitoring reports upon which the inventory was based were voluntarily submitted and may not cover a substantial portion of the fuel-burning plants.1 Second, the fuel inputs detailed in the reports represent only a fraction of
1 Based on the year 2001 accomplishment report of DENR, under the Pollution Control Act for air management (Presidential Decree 984), DENR inspected or surveyed 2,401 projects in the regions of the Metro Manila airshed (1,203 in NCR, 705 in III, and 493 in IV-A) and issued 1,743 permits (567 in NCR, 719 in III, and 457 in IV-A). However, some of these may be backlogged inspections, and the actual airshed is somewhat smaller than the total area of those three regions. According to conversations with DENR/EMB/AQM, requests for self-monitoring reports were sent to about 4,000 companies nationwide, of which about 1,000 to 1,800 would be in the Metro Manila airshed, where the response rate was roughly 70%. LLDA, which kept emissions and fuel data until last year, listed 2,000 sources in NCR alone.
6

Resources for the Future Krupnick, Morgenstern, Fishcer, Rolfe, Logarta, Rufo
fuel consumption in Metro Manila, as estimated by the Department of Energy (DOE).2 Third, process emissions were not explicitly accounted for.
The emissions inventory for the stationary sources was built on available fuel consumption data provided by 800 firms using three types of fuel: coal, bunker, and diesel oils. This method seems to limit the data to combustion sources. The omission of process emissions is particularly important for the cement industry because previous studies (notably ENRAP) indicate that PM10 process emissions from this sector are on the same order of magnitude as the combustion-related emissions from all stationary sources. Rice and other grain-milling establishments have significant process emissions as well.
Table 2.2 compares the combustion emissions factors and process emissions for cement plants used by Rolfe with the applicable cement manufacturing process emissions factors.
Table 2.2. Comparison of Emissions Factors
Major Sources of PM Emissions Rolfe PM Emissions Factor
Applicable EPA Emissions Factor (kg/Mg of Clinker Produced)
Combustion Coal = 130 lb/ton (uncontrolled) Diesel = 0.31 lb/MMBTU (uncontrolled) Bunker = 0.1 lb/MMBTU (uncontrolled)
Same
Kiln None 0.5 kg/Mg (ESP controlled) Clinker cooler None 0.048 kg/Mg (ESP controlled) Preheater/precalciner kiln None 0.13 kg/Mg (ESP controlled) Others (raw and finishing mills, limestone handling)
None 0.01 kg/Mg (bag filter controlled)
It is estimated that each ton clinker produced will require 0.184 ton of bituminous coal to combust. This will generate 10.87 kg of PM without postcombustion control, or about 0.55 kg PM using an electrostatic precipitator. Total controlled emissions of the cement noncombustion process (from kiln, clinker cooler, preheater/precalciner kiln, and others as enumerated in the table) are estimated at 0.688 kg per ton of clinker, or about 125% of combustion sources.
2 For example, from the SMR-based inventory, 1.9 million tons of coal was reported, but the estimate based on DOE data was 2.8 million tons.
7
Resources for the Future Krupnick, Morgenstern, Fishcer, Rolfe, Logarta, Rufo
Despite the concerns about underestimation, it is also possible that the Rolfe data may overestimate emissions in certain situations. First, postcombustion controls may not have been fully accounted for. No information on the postcombustion control of industrial stationary sources was included in the inventory report, so we cannot determine how cement manufacturers and refineries, most of which are already equipped with postcombustion controls, measured their emissions. Second, in some cases TSP rather than PM10 emissions factors seem to have been used.3 These emissions factor differences may imply an overestimate of PM10 emissions from sources using coal as fuel by a factor of 430%.
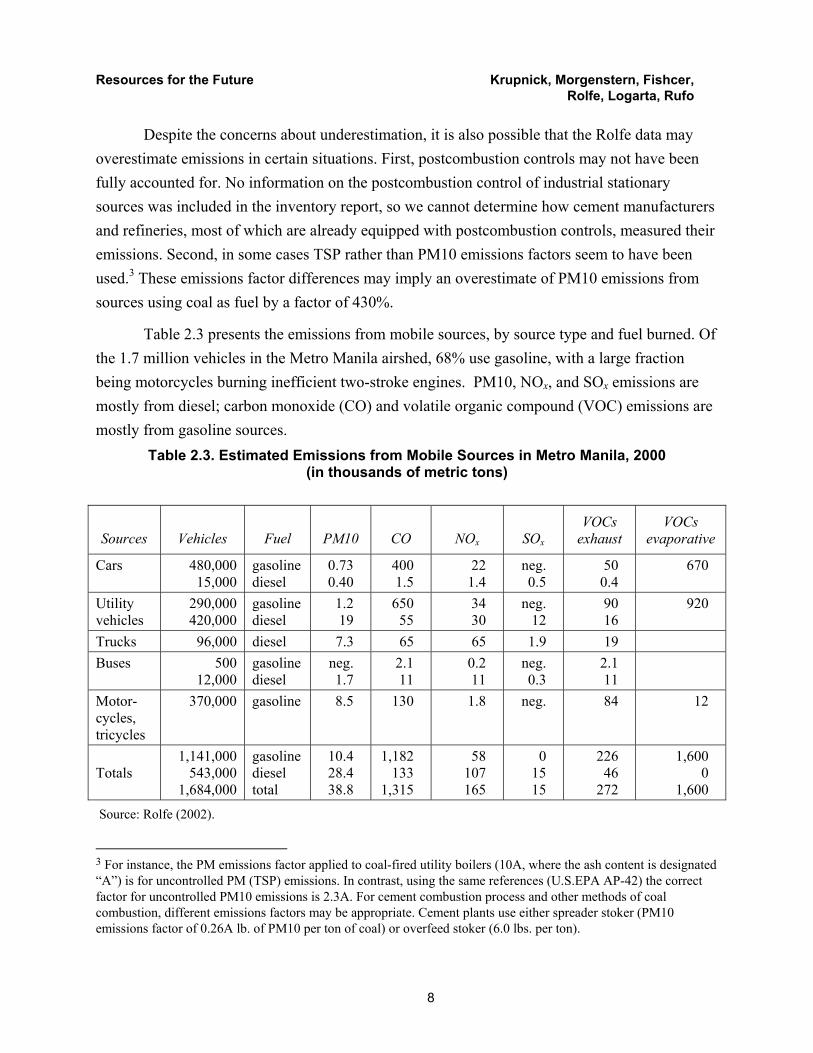
Table 2.3 presents the emissions from mobile sources, by source type and fuel burned. Of the 1.7 million vehicles in the Metro Manila airshed, 68% use gasoline, with a large fraction being motorcycles burning inefficient two-stroke engines. PM10, NOx, and SOx emissions are mostly from diesel; carbon monoxide (CO) and volatile organic compound (VOC) emissions are mostly from gasoline sources.
Table 2.3. Estimated Emissions from Mobile Sources in Metro Manila, 2000 (in thousands of metric tons)
Sources Vehicles Fuel PM10 CO NOx SOx VOCs
exhaust VOCs
evaporative
Cars
480,000 15,000
gasoline diesel
0.73 0.40
400 1.5
22 1.4
neg. 0.5
50 0.4
670
Utility vehicles
290,000 420,000
gasoline diesel
1.2 19
650 55
34 30
neg. 12
90 16
920
Trucks 96,000 diesel 7.3 65 65 1.9 19 Buses 500
12,000 gasoline diesel
neg. 1.7
2.1 11
0.2 11
neg. 0.3
2.1 11
Motor-cycles, tricycles
370,000 gasoline
8.5 130 1.8 neg. 84 12
Totals
1,141,000 543,000
1,684,000
gasoline diesel total
10.4 28.4 38.8
1,182 133
1,315
58 107 165
0 15 15
226 46
272
1,600 0
1,600
Source: Rolfe (2002).
3 For instance, the PM emissions factor applied to coal-fired utility boilers (10A, where the ash content is designated “A”) is for uncontrolled PM (TSP) emissions. In contrast, using the same references (U.S.EPA AP-42) the correct factor for uncontrolled PM10 emissions is 2.3A. For cement combustion process and other methods of coal combustion, different emissions factors may be appropriate. Cement plants use either spreader stoker (PM10 emissions factor of 0.26A lb. of PM10 per ton of coal) or overfeed stoker (6.0 lbs. per ton).
8

Resources for the Future Krupnick, Morgenstern, Fishcer, Rolfe, Logarta, Rufo
No estimates for household and other area sources are included in the inventory. Another inventory (ENRAP 2) estimates that such sources account for 72% of total PM emissions in the National Capital Region and in Regions III and IV, including households burning fuelwood and charcoal (76% of the 72%), road travel (14%), and building and road construction (2%). These estimates may be too high because rainfall was not considered. URBAIR found smaller numbers for PM10 emissions from refuse burning (14%) and more comparable numbers for resuspension from roads (15%) and construction (6%). The contribution of household and area sources to total PM emissions is undoubtedly large and warrants serious discussion in any emissions inventory.
A summary of the different estimates is given in Table 2.4.
Table 2.4. Comparison of Emissions Inventories by Source (in Thousands of Metric Tons per Year)
Source Rolfe (Metro Manila, 2000) ENRAP 2 (NCR, III, IV, 1992)
Stationary 37 85 Mobile 39 27 Household, area Not estimated 260 Total 76 372
In Rolfe’s judgment, the area source contribution to PM10 in the Metro Manila airshed is about 40%. This would raise the estimate of total emissions in his inventory to 127 million tons or higher.
3. Stationary Sources
Several recent analyses of air pollution in Manila (Ruzicka et al. 2002; URBAIR; ENRAP) develop a menu of economic incentives and command-and-control approaches that could be applied to stationary sources to lower their emissions. Based on these studies and our own analyses, our team proposes a stationary source control policy that sets a particulate emissions fee that also applies to SO2. In the future the fee program could even extend to NOx, depending on judgments about the relative contribution of nitrates to particulate concentrations. If new information suggests that the relative contribution of sulfates to particulate concentrations is quite small, the emphasis on SO2 could be removed.
9
Resources for the Future Krupnick, Morgenstern, Fishcer, Rolfe, Logarta, Rufo
3.1 Background
The introduction to this report identified PM as the main pollution problem in Manila, with ambient ozone being a lesser problem. This is consistent with epidemiological studies, which find that ton for ton for the contributing emitted substances (direct and precursor emissions alike), PM is far more injurious to health than ozone. It is also consistent with monitored readings, which pick up few violations of ozone guidelines and standards. The decision to downplay the ozone issue implies a lesser interest in reducing emissions of NOx as a precursor to ozone, though NOx emissions are still potentially important as a precursor to PM2.5. Likewise, reducing SO2 emissions may not be important for its own sake but may be important for reducing PM2.5.
3.2 Rationale for Emissions Fee
An emissions fee can serve two purposes: creating financial incentives to reduce pollution and generating revenue. The incentive effect occurs because the fee makes emissions costly to the firm, and thus like other inputs to production, if the firm can use less in its production process, it saves money. The maximum incentive effect is achieved when the fee levied on incremental emissions reflects the costs of those emissions to society. The costs can be either measured in terms of the increased damages to the health of the population, or valued by the costs to the economy of further reducing emissions upon reaching a target level, depending
on the policy goal. An emissions fee allows firms maximum flexibility to choose the control option that best suits their situation. Even if a firm chooses to make no reductions in the near term and pay the fees on all its emissions, the mere existence of the fee can be a factor in future decisions to expand or modify its facilities.
The incentive effect depends on the marginal fee (the cost to firms of an additional ton of emissions); achievement of a revenue goal, in contrast, depends on the average fee (the average cost of all emissions). Achieving both goals simultaneously would involve an additional component, such as a standard exemption or fixed fee, which can be adjusted so that total revenue needs are met with the appropriate marginal fee.
Revenue needs include, but are not limited to, administrative costs of stationary source permitting, monitoring, and enforcement. In the Philippines, emissions fees are intended to be a major revenue source for the Air Quality Management Fund (AQMF), which has a broad mandate for restoration, research, outreach, and technical assistance, as well as for regulatory activities. AQMF has multiple sources of revenue. In designing the fee, we focus first on the
10

Resources for the Future Krupnick, Morgenstern, Fishcer, Rolfe, Logarta, Rufo
direct effects—the marginal incentives and the administrative burdens—and then on the revenue and cost impacts. In principle, efficiency reasons should determine the tax rate, and equity and revenue concerns should determine the exemptions.
An emissions fee can be designed like a tradable emissions permit system. The tax rate is analogous to the price that would emerge in a tradable permit system. Just as that price would be uniform if firms could trade permits across industries, reflecting the efficient allocation of pollution abatement, equal tax rates across industries are necessary for efficiency. The exemption is analogous to a grandfathered permit allocation and can be differentiated across industries according the burden on industry. The necessary monitoring and reporting requirements are no different than under a permit system. Although the potential for graft is always a concern when revenues are involved, the power of allocation and monitoring emissions permits could just as easily lead to problems, given the value of permits. Thus, the differences with a tradable emissions permit system in these aspects are not significant. More important are differences in how the systems respond when costs of pollution abatement are uncertain. Emissions fees tend to provide greater cost certainty to firms than tradable permits, for which the price is uncertain.
The target of the fee is also important. Levying the charge on emissions as directly as possible gives firms the most incentive to explore all opportunities for reducing emissions, including changing production techniques, switching to cleaner fuels, and using postcombustion treatments. Although charges on polluting products or fuels are often preferred because they can be simpler to implement when postcombustion options are limited, they give incentives only to reduce use of the product or to switch fuels.
3.3 Stationary Emissions Control Technologies
The main options for reducing emissions involve either changing fuels or adding control technologies at the stack level. The control technology and costs described below address both ends of the combustion process—fuel quality and postcombustion controls. The most effective controls use both interventions.
For example, shifting to clean coal can reduce PM emissions by 30–60% and SO2 emissions by 10–40% at an average cost of $122 per ton PM. For coal-burning plants, switching to low-sulfur coal (from 3–2% by weight), for example, can reduce sulfur dioxide emissions by 40%, and switching to fuel oil can reduce SO2 emissions by as much as 80%. These fuel-switching options and their costs are presented in Table A.3 in the Appendix.
11

Resources for the Future Krupnick, Morgenstern, Fishcer, Rolfe, Logarta, Rufo
A wide range of postcombustion controls are available to minimize PM and SOx emissions. End-of-pipe control technologies can achieve a 99.9% removal of PM10; however, the large fixed costs associated with these technologies can increase overall capital costs by P2,000–5,000 (roughly $40-100) per kW generation capacity. Philippine power plants can effectively control sulfur dioxide emissions (as much as 95%) through the use of flue-gas desulfurization with an additional capital cost to the plant of P505–924 million and annual operating and maintenance costs of P85.7–168 million. For PM emissions, though, such controls on average cost $31 per ton PM with a removal efficiency of at least 90%. Table A.4 in the Appendix presents postcombustion emissions control technologies and costs for coal-fired power plants.
The foregoing discussion is applicable primarily to coal-fired power plants, although many of the technologies apply to combustion with other fuels. Hartman et al. (1993) generated abatement cost estimates using data from the U.S. Census Bureau in attempt to apply U.S.-based estimates to developing countries without modifications. That study estimated the abatement cost in 37 industry subsectors. Estimated average costs per ton to control PM emissions for the principal sources of emissions in the Metro Manila airshed are as follows:
• Cement manufacturing, $20
• Coal, $30.82
• Petroleum refineries, $347
However, the extent to which end-of-stack technologies can produce new emissions reductions depends on the level of compliance with existing regulations. Currently, the cement manufacturing and power generating sectors are equipped with most of the postcombustion controls. All coal power plants and refineries are equipped with electrostatic precipitators with a reported removal efficiency of at least 95%. Meanwhile, emissions from coal handling and processing are controlled by wet suppression. Most cement plants are equipped with electrostatic precipitators to control kiln emissions and bag filters that handle process emissions. However, we lack information about whether these technologies are used consistently.
End-of-pipe controls are less likely to be cost-effective for smaller industrial boilers to install; these firms would more likely resort to purchasing higher-quality fuel with lower sulfur and ash contents. Process adjustments to improve fuel efficiency are another available response.
After cost-effective postcombustion controls are employed, additional stationary source reductions will likely have to come from improved fuel quality. We are currently seeking reliable information for the Philippines on the cost of removing sulfur from bunker and diesel oil.
12
Resources for the Future Krupnick, Morgenstern, Fishcer, Rolfe, Logarta, Rufo
According to URBAIR, the cost per ton of PM10 removed (not including secondary effects from lower SOx) is US$2,000–20,000.
3.4 Existing Legal and Institutional Foundations
3.4.1 Precedents for Emissions Fees
The Laguna Lake Development Authority (LLDA) implemented an environmental user fee system to reduce the biochemical oxygen demand (BOD) of industrial effluents flowing into Laguna de Bay, the second-largest freshwater lake in Southeast Asia. Administratively under the Department of Environment and Natural Resources (DENR), LLDA is a government-controlled corporation that has the authority (unavailable to DENR directly) to collect fees, retain them, and invest in the management of the lake waters.
The principal objectives of the LLDA pollution charge are to provide an economic incentive for dischargers to comply with allowable pollutant levels and also to raise revenues for water quality management. The total annual fee paid by a facility equals a fixed charge (based on a range of the daily wastewater flow rate) plus, for each pollutant, a variable fee times the annual load. Firms pay 5 pesos per kg of BOD loading if they are within the compliance level, and 30 pesos per kg beyond that level. Emissions are determined using limited sampling and presumptive factors, leaving the firms with the burden of proving that actual loads are lower with continuous monitoring.
The program was phased in, starting with the top dischargers in the major BOD-contributing industries: food, pulp and paper, pig farms and slaughterhouses, textiles, and beverage manufacturers. The fees are to be extended to all dischargers, including households and small commercial establishments, and to other pollutants apart from BOD. The program has been well received and has been credited with helping reduce annual BOD inflows to the lake by almost 75% from 1993 to 2000, although the extent to which the reduction can be attributed to the fee has not been evaluated formally.
3.4.2 Legal Basis for Emissions Fees
The Clean Air Act of 1999 (Republic Act No. 8749) explicitly provides for economic incentives as part of environmental policy. The Declaration of Principles recognizes that
13
Resources for the Future Krupnick, Morgenstern, Fishcer, Rolfe, Logarta, Rufo
“polluters must pay,”4 and the Declaration of Policies encourages the use of market-based instruments.5 Specifically, an emissions fee system is mandated for industrial dischargers as part of the regular permitting system.6 The implementing rules and regulations remain broad enough on this point to leave room for interpretation.
The law does not clearly specify the extent to which DENR may differentiate emissions fees according to jurisdiction. Rule XII says that sources in nonattainment areas “will be assessed a 50% surcharge (i.e., 150% of base) on the annual emission fees for the pollutant(s) for which the area is designated non-attainment.”7 Broad interpretations could allow that base fee itself to vary with spatial impacts, but administrative constraints make such differentiation unlikely. The Integrated Air Quality Improvement Framework, DENR Administrative Order No. 2000-82, seems to support the broad reading:
In order to induce continuing reductions in air emissions, stationary sources of such emissions will be required to pay fees for the mass of pollutants that they emit to the atmosphere. The fees will be determined based on the type of pollutant, the mass emission rate at the source, and the type of airshed (attainment or non-attainment) into which the emissions occur. Higher fees will be charged for emissions located within a non-attainment area. A schedule of fees for mass emissions for various pollutants may also be developed on an airshed-specific basis.8
The language of the rules and regulations is also ambiguous about how closely emissions fees must be tied to revenue needs.
Air emission fees will initially be determined based on the amount of revenue necessary for the successful implementation of the Act…The air emission fees shall then be apportioned to stationary and mobile sources based on estimated annual mass emissions.”9
A reasonable reading can allow for emissions fees at levels high enough to provide economic incentives for pollution reduction, and we operate under this assumption.
4 Ch. 1, Art. 1, Sect. 2. 5 Ch. 1, Art. 1, Sect. 3c. 6 Ch. 1, Art. 1, Sect. 13. 7 Sect. 5. 8 2.4.7. 9 Rule XVI, Sect. 5.
14
Resources for the Future Krupnick, Morgenstern, Fishcer, Rolfe, Logarta, Rufo
3.4.3 Government Agencies
The principal environmental enforcement agency in the Philippines is the Department of Environment and Natural Resources. DENR has six staff bureaus whose main functions are to design policies, set standards, and serve as advisory units. The Environmental Management Bureau (EMB) has authority over stationary emissions sources.10 The staff bureaus have sectoral representatives in all 14 regional offices across the archipelago performing regulatory functions, such as permitting, review of environmental impact statements, compliance monitoring, and inspection.
Prospective stationary sources of air emissions must secure permission to construct. The construction authorization regulates the type and capacity of the pollution source and the control equipment to be installed. In addition, environmentally critical projects must submit an environmental impact statement and secure an environmental compliance certificate. The certificate may impose conditions on the operation of a plant to mitigate its environmental impact. A permit to operate must be renewed every year; the current application fee is P1,200 per source. The permit-issuing process offers an opportunity to institute a pollution-reporting requirement and assess emissions fees.
Issuance of orders to compel compliance with Presidential Decree 984 (Pollution Control Act for Air Management) and adjudication of pollution cases are the functions of the Pollution Adjudication Board, a quasi-judicial body chaired by the DENR secretary. The board’s orders are executed by the regional offices, jurisdictional local government units, and local police. Under each regional office are numerous provincial and community environment and natural resources offices, which also handle public complaint-driven surveillance, facility inspection, reviews of initial environmental examinations, authorities to construct and permits to operate.11
The Clean Air Act authorizes DENR and the Department of Transportation and Communications (DOTC) to “design, impose and collect regular emissions fees” for industrial sources. Fees collected are to be deposited in a special account established by the national treasury and administered by DENR. The act further identifies the Environmental Management
10 The other bureaus are forest management, land management, mines and geosciences, ecosystems research and development, and protected areas and wildlife. 11DENR Administrative Order No. 38 series 1990 decentralized review of authorities to construct and permits to operate to community environment and natural resources offices, but in reality these do not accept permit applications because of the lack of technical staff.
15
Resources for the Future Krupnick, Morgenstern, Fishcer, Rolfe, Logarta, Rufo
Bureau as the administrator of the Air Quality Management Fund. This fund is to be used for environmental restoration and environmental management of DENR, other agencies, and management of local airsheds.
3.4.4 Challenges
With the legal authority in place, the practical barriers to implementing the emissions fee system will be administrative in nature. DENR must be able to perform the crucial functions of compiling the specific data needed to calculate the fee; validating data provided by firms; billing, collecting, and enforcing penalties for failure to pay the fee; and providing dispute resolution for conflicts arising from fee computation methods and data inputs. Furthermore, internal accounting procedures will need to be established to earmark revenues for environmental management, program administration, restoration, and rehabilitation.
The other challenges are informational and political. Considerable uncertainty remains over the precise extent and distribution of stationary source and other emissions in Metro Manila. One of the biggest uncertainties about the emissions fee’s efficacy is the degree to which sulfur and SO2 reductions are needed to improve air quality. Sparse SO2 and fine particulate speciation data indicate that sulfur and SO2 are not major problems, but the sulfur data are old and the SO2 data come from only one monitor. In addition, these data make Manila an outlier compared with other cities in Asia, where sulfur and SO2 are serious concerns. Better data are critical to designing the fee and evaluating the program.
Perhaps the first challenge to putting the program in place is building support among stakeholders. The choice of fee level, participation rules, and exemptions will have important impacts on the competing interests of government for revenues, of firms for their costs, and of the public interest for the efficiency and efficacy of the program.
3.5 Emissions Fee for Stationary Sources
The subsections below detail a framework for the emissions fee, in light of the challenges noted above.
3.5.1 Revenue Goals and Use of the Air Quality Management Fund
The Clean Air Act established AQMF “to finance containment, removal, and clean-up operations of the Government in air pollution cases, guarantee restoration of ecosystems and rehabilitate areas affected by the acts of violators of this Act, to support research, enforcement and monitoring activities and capabilities of the relevant agencies, as well as to provide technical
16

Resources for the Future Krupnick, Morgenstern, Fishcer, Rolfe, Logarta, Rufo
assistance to the relevant agencies.” The exact functions and revenue targets of AQMF have yet to be determined. However, reading these functions narrowly excludes using the fund to finance or otherwise subsidize private abatement efforts. Therefore, to the extent that such incentives are desired, they must be incorporated into the design of the emissions fee program itself—through exemptions or investment credits, for example.
It is also unclear what portion of AQMF is to be funded by the emissions fee. Other sources include revenue from “fines imposed and damages awarded to the Republic of the Philippines by the Pollution Adjudication Board (PAB), proceeds of licenses and permits issued y the Department under this Act, emission fees and from donations, endowments and grants in the forms of contributions.” Since the revenue goals of the fee program are ambiguous, we present a range of possible revenue goals.
At a minimum, one could require the fee program to cover its own costs. The first priority of AQMF is indeed to build institutional capacity within DENR so that it can perform its environmental management, monitoring, and enforcement duties. According to Ruzicka et al. (2002), the planned budget for the Environmental Quality Division and Environmental Management Bureau combined requires P362.6 million. Our estimates of staff and equipment requirements for the Air Quality Management Division in the three regions of the airshed, detailed in Tables A.6 and A.7 of the Appendix, are operating costs of P52.2 million in capital equipment and P2.6 million in annual personnel expenses. Additional costs of implementing the stationary source emissions fee and monitoring program, including training and supplies, are estimated to be P14.2 million in operating expenses and P50.5 in capital equipment. If the capital outlays are amortized over five years, the total annualized cost comes to almost P40 million. However, these estimates are conservative.
3.5.2 Emissions Fee Calculation
In the basic design, total emissions fees assessed for any plant would equal
10 2otal Fee Payment PM SO NOP S N x Xτ τ τΤ = + + + ,
where the τ s represent the fee rates for each pollutant, and X represents a fixed component, which may be positive (a fixed fee, like the current charge for permit processing) or negative (a standard credit or exemption). The fixed component, if needed, represents an adjustment mechanism to achieve the targeted revenue goals. The fee rates will depend on the relative contribution of the different emissions to PM10 concentrations, as well as the corresponding costs in terms of abatement opportunities or health damages.
17
Resources for the Future Krupnick, Morgenstern, Fishcer, Rolfe, Logarta, Rufo
If the target is particulate matter, as we assume, one would first set the basic rate for PM10, Pτ , according to the best evidence regarding the marginal damages from pollution or the
marginal costs of achieving an air quality target. For example,
P P PMD TRτ = ⋅
where
PMD = marginal damages from increases in PM10 concentrations, and
PTR = the rate at which a ton of PM10 emissions increases ambient PM10 concentrations.
Transformation rate estimate. To estimate the direct transformation rate PTR , we took
two very different strategies. First, using Rolfe’s estimates of average PM10 concentrations (75 µg/m3), we calculated a ratio to total emissions (76,000 tons, plus process emissions and construction, refuse burning, and other area sources, which could double that figure or quadruple it to 300,000 tons—closer to the levels of the ENRAP study), leading to a range of 0.00025 to 0.0005.Second, we calculated this ratio from a model for El Paso-Juarez, another developing country city with similar problems (but admittedly different meteorology). Emissions are for low stacks (10 meters at most) and within a 50-by-50-km area. Annual average concentrations of PM10 are 0.063 µg/m3 per gm/sec of emissions, or 0.00187 µg/m3 per ton. The Metro Manila airshed is roughly 20 times larger than the area for which the concentrations impact was calculated, which should significantly dilute the impact. Still, these two strategies yield estimates that are fairly close, and we will use 0.0005Pη = for the purposes of this example.
Marginal damage estimate. Two approaches can be used to set the PMD rate. The first is
to set it equal to the estimated value of the marginal health damages from increases in particulate concentrations. This method attempts to balance the costs and benefits of emissions abatement. Marginal damages are derived from a dose-response function that measures the increase in mortality from an increase in PM10 concentrations and a value of statistical life (VSL). To do this, we use functions in the Tracking and Analysis Framework (TAF), an integrated assessment model developed for the U.S. National Acid Precipitation Assessment Program that tracks and assesses the economic and environmental effects of changes in emissions from power plants burning fossil fuels in North America. TAF uses a marginal damage value of $55 per µg/m3 PM10 for each person over 30.
That value is applicable only in the United States; adjustments need to be made for the Philippines. In the United States, the baseline death rate is 800/100,000, but for the younger population of the Philippines, it is 520/100,000, and the mortality calculations need to reflect this
18

Resources for the Future Krupnick, Morgenstern, Fishcer, Rolfe, Logarta, Rufo
difference. Income differentials are also large: recent income data for 1998 show that urban Filipinos’ per capita income was $782, compared with $26,893 in the United States. If a 1% increase in income leads to a 1% increase in the willingness to pay for reductions in health risks, the willingness to pay for the Philippines is 3% of the U.S. figure. The per-person adjusted number then needs to be multiplied by the population at risk; in the 2000 census, the population living in the defined airshed was approximately 23 million, only a third of whom were over 30.12
Population over 30P54 per person
520 P50 23,000,000$55 0.03 P411,125,000800 $ 3PMD = × × × × =
1424314444244443
From this we can calculate an emissions fee for PM, which is roughly equivalent to $2,000 per ton:
10411,125,000 0.00025 P103,000 / ton PMPτ = × =
An alternative method is the marginal cost approach, which calculates the fee that would minimize the costs of achieving a desired target of average ambient concentrations. This approach would set the rate equal to a reasonable estimate of the marginal cost of abatement necessary to achieve the level of mass-based emissions that achieves the environmental goal.
After cost-effective postcombustion controls are employed, additional stationary source reductions will likely have to come from improved fuel quality. We are currently seeking reliable information for the Philippines on the cost of removing sulfur from bunker and diesel oil. According to URBAIR, the cost per ton of PM10 removed (not including secondary effects from lower SOx) is US$2,000–20,000.
An implementable fee. Thus, both marginal damages and marginal costs seem to lie in the same range—$2,000 or more. Given the uncertainty surrounding these numbers for the Philippines case, however, we hesitate to recommend a marginal fee that fully reflects these cost estimates. Furthermore, we realize that a fee this high is not likely to be tenable, given concerns for economic development and the need for stakeholder acceptance of the program. Although efficiency should be a goal, it is more important to begin implementing the program. Once it has started, one will be able to observe how firms react to the fee and how the environment is
12 This represents the sum for the National Capital Region, the provinces of Bataan, Bulacan, and Pampanga in Region III, the provinces of Batangas, Cavite, Laguna, Rizal, and Quezon for Region IV-A, rounding down to reflect that part of Quezon is not in the official airshed. Philippines National Statistics office.
19
Resources for the Future Krupnick, Morgenstern, Fishcer, Rolfe, Logarta, Rufo
affected by the corresponding changes in emissions. After the responses over time are understood and better monitoring, health, and cost data have been gathered, the fee can be adjusted to better reflect the policy targets.
Similar issues have arisen in developed countries; a recent response in the United States was a guarantee that new emissions regulations not exceed costs of $10,000 per ton reduced. Adjusting for differences in per capita income (although the abatement cost differences are not likely to be so large), this threshold would translate into $300 per ton of PM10 in the Philippines. For a starting point, then, we will use P15,000.
3.5.3 Incorporating Other Pollutants
Diesel particulates and fine particulates in general are probably the most important to control. For the other pollutants, we have developed contingencies, pending better information about their true effects in the Metro Manila area.
i. Speciation studies reveal that sulfates or nitrates contribute significantly to ambient concentrations of fine particles. The fee rates for SO2 and NOx should reflect their contribution to
PM10 concentrations through secondary transformation. Let PSTR and
PNTR be the rate at which a
ton of SO2 and NOx emissions, respectively, increases ambient PM10 concentrations. Thus, the fee rates for SO2 and NOx would be
P
S P SP
N P N
MD TR
MD TR
τ
τ
= ⋅
= ⋅
ii. SO2 is a health problem in its own right. Although SO2 standards are being met in Metro Manila, it is possible that no safe threshold exists, and health damages always increase with SO2 concentrations. The fee should reflect these damages directly. Since few studies control for fine particulates, the damage estimates are likely to reflect the secondary transformation effects as well. In this case, S
S S SMD TRτ = ⋅
iii. Direct PM10 emissions are the only problem of significance. If the non-PM10 emissions cannot be verified with monitoring, it may not be practical to include them in the tax base, as firms would not have recourse if the estimates using emissions factors were too high. In
that case, one should simplify and focus solely on PM10 emissions, and 0S Nτ τ= = .
20

Resources for the Future Krupnick, Morgenstern, Fishcer, Rolfe, Logarta, Rufo
Sulfur oxides. Since speciation studies reveal that sulfates can contribute significantly to ambient concentrations of fine particles, the fee rates for SO2 should reflect its contribution to PM10 concentrations through secondary transformation. Data from the single speciation study at one monitor in Manila indicate that sulfates represent 6 µg/m3 of PM2.5 concentrations of 40 to 45 µg/m3, all of which are included in PM10. Given the estimates from the emissions inventory on SOx (160,000 tons), that implies an average contribution to sulfate (and thereby PM10) concentrations equal to 0.0000375, which is equivalent to 15% of the direct contribution of a ton of PM10 emissions (0.00025):
6 0.0000375 0.15160,000
PS PTR TR= = =
Thus, with these assumptions, the fee on SOx would be 15% of the fee on PM10.
If industrial combustion and process emissions of PM10 are 80,000 tons annually, and SOx emissions are 160,000 tons, that translates into roughly 100,000 tons of PM10 equivalent under the fee structure.
However, the degree of focus on SOx should be revisited as better information becomes available. Since the speciation estimate is based on a single analysis, we recommend further studies on this issue. The contribution of sulfur oxides to ambient PM10 concentrations could even be on the same order as, if not more than, direct PM emissions. This reflects the relatively rapid transportation rate of SO2 to PM (as sulfate) and the large fraction of PM10 emissions that settles out quickly (the coarser fraction). In fact, a model of air pollution in the United States finds a SOx transformation rate of 0.002—orders of magnitude greater than the simple average we calculate.13
Nitrogen oxides. NOx, on the other hand, has a relatively slow transformation rate into PM10 (as nitrates). Furthermore, the effects of nitrates on health are not consistently demonstrated. NO2 has been shown to be a weak oxidant, much weaker than ozone, which is associated with health effects that are less frequent and serious than those of particulates. The conversion of NOx to ozone in the presence of VOCs and sunlight is usually the concern. Thus,
for now, we will set 0Nτ = .
13 From runs we have done for the eastern coast of the United States (a state offshore, like New Jersey) using TAF, reducing SO2 emissions by 1,000 tons per day over a multiday episode reduces PM2.5 by about 2µg/m3 over that episode, on average. All the sulfates are PM10, so this holds for that as well.
21

Resources for the Future Krupnick, Morgenstern, Fishcer, Rolfe, Logarta, Rufo
However, all these estimates can be improved with air quality modeling studies specific to the Metro Manila airshed. Modeling of air pollution indicates that transformation rate for nitrates (and thereby fine particulates) in the eastern United States is 0.0002, or on the same order as our simple average calculation for the direct transformation rate of PM10.14
3.5.4 Selection Criteria for Participants
Participation criteria determine which permitted industrial sources are assessed emissions fees. Taking into consideration the nontrivial administrative burdens, both for small firms and for the Environmental Management Bureau, the question is whether there are simple delineations to make the most of the program incentives while limiting its compliance costs.
In 2001, under the Pollution Control Act for air management, DENR inspected or surveyed 2,401 projects and issued 1,743 permits. The inventory by Rolfe (2002) includes emissions survey responses from about 800 firms. The discrepancies can be explained by a combination of inspection backlogs, an incomplete response rate (roughly 70%), differences in the area covered, and the holding of multiple permits by some firms. EMB personnel estimate there are about 1,000 to 1,800 permitted companies in the airshed.
Although ability to pay might be an issue, we have no data regarding firm size or income (e.g., gross revenues, payroll). Given the importance of “other” industries for emissions, industrial category is not likely to be a good basis for participation. An emissions threshold, however, can provide reasonable guidance.
Based on the Rolfe emissions inventory, we find that a threshold of 10 tons of PM10 equivalent15 captures 97% of the emissions yet involves only about 15% of the firms. We therefore recommend that such a cutoff be used. Assuming a universe of 1,000 to 1,800 permitted companies in the airshed, 150 to 270 companies would be covered by the program, at least initially. This distribution reveals important opportunities for EMB to target compliance and make the most of its enforcement resources.
The design of the participation requirement has revenue implications. Firms below the threshold could be exempt from full reporting and fee payments, thereby reducing the cost burden but creating a financial incentive to stay below the cutoff. Or they could be assessed a
14 From the same runs as the previous footnote. 15 PM10 + 0.15*SOx.
22

Resources for the Future Krupnick, Morgenstern, Fishcer, Rolfe, Logarta, Rufo
reasonable presumptive charge but be allowed to show that their emissions fee payments would be lower if they undertook full reporting.
One could also target sources based on geography. Although conditions do seem to vary considerably within the airshed, we do not at this point propose differentiating the fee or participation rules geographically: the additional administrative complexity is too burdensome. However, geographic variation could be used to prioritize and target enforcement efforts. Furthermore, the fee is not the only emissions policy, and other regulations are available to cope with hot spots.
3.5.5 Adding a Fixed Component to the Fee
Although the fees should consistently reflect the marginal impact of emissions,16 the fixed component X can be used to make adjustments for cost, distributional, or revenue purposes. If revenue needs for EMB are not met with the marginal fee alone, a positive fixed fee, like the standard permitting fee, can boost revenues. A negative fixed fee, on the other hand, can reduce compliance costs or the liabilities of the firms (but at a corresponding revenue loss). To retain the incentive effects, the fee would have to be made refundable for emissions below the exemption level.
The fixed fee can be made to vary according to firm characteristics as well, without compromising the incentive effect of the marginal rate. Differentiation of the fee can allow for different abilities to pay of small versus larger stationary sources. Another option is to make the fixed fee conditional on certain behavior by, for example, offering rebates for installing pollution control equipment or continuous monitoring systems. This structure would help firms defray fixed capital costs and would be an alternative to funding such projects through AQMF.
The fee rate indicated, even though a fraction of the range of marginal benefits and abatement costs, would impose a large burden if imposed on all emissions, representing a big transfer from stationary source firms to AQMF. Industrial combustion and process emissions are roughly 100,000 tons of PM10 equivalent, under the fee structure. If the P15,000 fee were levied on all those emissions, up to P1,500 million could be collected in revenues (less to the extent that emissions are actually reduced). This is likely to be significantly more than the revenue target for AQMF.
16 This differs from the LLDA model, which had different tiers of marginal rates.
23

Resources for the Future Krupnick, Morgenstern, Fishcer, Rolfe, Logarta, Rufo
Rather than weakening the fee, we propose to exempt some emissions from the fee base. A standard exemption helps mitigate the cost impact while retaining the strong marginal incentive to reduce emissions, particularly if emissions reduced below the exemption are credited. Given the large variation among the sources, we recommend allocating a firm-specific (or possibly industry-specific) exemption based on a share of historical emissions. If historical emissions data are unavailable or unreliable, average industry data may have to be used to calculate the fixed exemption.
Summarizing from the previous calculations, the emissions fee payment for the participating firm would be
10 2otal Fee Payment P15,000 (PM 0.15SO Exemption)Τ = + −
To illustrate what share of overall emissions would have to be exempted to align revenues with different goals, Table 3.1 presents some sample calculations. It details different emissions fees and revenue goals for AQMF, assuming hypothetical examples of percentage reductions in emissions (from 100,000 ton equivalents) that would be achieved in each case. Higher fees can either raise revenues or, by eroding the emissions base through reductions, lower them; therefore, the total percentage of emissions to be exempted may rise or fall with the fee.
Table 3.1. Standard Exemption Rates for Sample Fee Scheme
Revenue Goal
(Millions of Pesos)
Emissions Fee
(Pesos per Ton)
Reductions
(Percentage of Base Emissions)
Exemption
(Percentage of Base Emissions)
40 5,000 5% 87% 15,000 10% 87% 25,000 15% 83% 300,000 30% 70%
400 5,000 5% 15% 15,000 10% 63% 25,000 15% 69% 300,000 30% 69%
1,000 5,000 5% N.A. 15,000 10% 23% 25,000 15% 45% 300,000 30% 67%
24

Resources for the Future Krupnick, Morgenstern, Fishcer, Rolfe, Logarta, Rufo
3.5.6 Incentive-Based Credits
The emissions fee itself should form the major incentive to reduce emissions. However, particularly if the fee cannot be set high enough to reflect marginal damages or reach the air quality target, other incentives for environmentally beneficial behavior can be embedded in the program. (Alternatively, if AQMF is permitted to fund private as well as public activities, grants can be offered on a competitive or targeted basis.) For example, credits against fee obligations can offset some portion of the costs of pollution control equipment, continuous monitoring devices, or other such investments.
Of course, any subsidies would be costly in terms of forgone revenue and the level of exemptions would have to be adjusted accordingly. Moreover, additional enforcement would be required to verify not only emissions but also qualified investments.
3.5.7 Monitoring and Enforcement
An emissions fee is by definition levied on mass emissions. This poses a significant challenge, since with the current concentration-based emissions standards enforced by DENR, information on mass emissions of firms is not consistently available. When properly maintained, continuous emissions monitoring systems (CEMS) are the most accurate means of calculating emissions; however, they are also the most costly. Section 5 of the Clean Air Act requires the installation and operation of CEMS for new and modified sources that have the potential to emit more than 100 tons per year of any pollutant. Currently, only major power plants (Pabilao, Mauban, and First Gas) are equipped with CEMS. The pollution control officers at two power plants estimate the capital and annual operating costs of CEMS at P2.5 million and P1.0 million. These CEMS are capable of monitoring SOx, NOx, and PM emissions. For medium and small sources, it may not be practicable to install CEMS. Thus, most emissions will have to be estimated using emissions factor methodology.17
The data in the accompanying emissions inventory were acquired through voluntary compliance with a memo from the Air Quality Management Division of the Environmental
17 The legal basis for the fee assessment is provided in Section 13 of the Clean Air Act: “ to include, but is not limited to, the volume and toxicity of any emitted pollutant.” There is no prohibition on the use of presumptive emissions factors to estimate emissions.
25

Resources for the Future Krupnick, Morgenstern, Fishcer, Rolfe, Logarta, Rufo
Management Bureau. Some seminars were held to explain the emissions estimation methodology. The response rate was about 70%.
Though that represents a good start, a credible emissions fee system requires that the data reporting requirements be explicit and standardized.18 On an “emissions tax return” form, firms could calculate their net emissions and fee liability and also the source of the data used. Quarterly self-monitoring reports submitted by pollution control officers contain basic information, including data on materials use (including fuel) and production outputs. When coupled with applicable emissions factors, these reports can serve as a basis for calculating facility-specific emissions fees. As described below, we recommend that additional information be requested for easy cross-checking purposes.
For those firms not installing CEMS, new procedures should be established to ensure that the most accurate and credible information is available to DENR. Specifically, we recommend that a special emissions tracking system be developed and implemented to collect, verify, and maintain data about firms’ fuel purchases, production, and mass emissions of PM, SO2, and NOx. (For a sample reporting form, see Box A.1 in the Appendix.)
Throughout each month, firms would use the emissions tracking system to enter information about changes in fuel inventories (e.g., beginning fuel inventory, fuel sales, fuel purchases, and fuel consumption), characteristics of fuel (e.g., sulfur content), production levels (e.g., quantity of electricity produced), and measured emissions at each boiler. At the end of each month, the firm would export all the data to a file and submit it to DENR. (The agency would manually enter the data for enterprises that do not have access to computers.) In addition, during inspections, the DENR Monitoring Bureau (or its representative) can enter monitoring data, including emissions concentration and emissions flow, into the system.
When the emissions data and other supporting information are entered into the emissions tracking system, the software will automatically look for missing information or inconsistencies with previous reports (e.g., if the firm emitted 4 tons of SO2 per unit of production in one month and only 1 ton per unit of production the next). DENR can use this tracking system to create various reports:
• firms with missing data, inconsistent data, or no reported emissions;
18 The U.S. EPA has developed Procedures for Preparing Emission Factor Documents (http://www.epa.gov/ttn/chief/efdocs/procedur.pdf). These procedures may be overly complex for the Philippines case, so EMB should assess opportunities for streamlining its guidelines, especially for smaller sources.
26
Resources for the Future Krupnick, Morgenstern, Fishcer, Rolfe, Logarta, Rufo
• all data reported by a firm or an industrial sector for a specific month or other time period; and
• total emissions data for all firms or industrial sectors for a specific month or other time period.
Thus an emissions tracking system will allow DENR to compare the same firms over time, compare similar firms, and analyze emissions and output trends. (See Box 1 in the Appendix.)
Overall, the development and effective operation of such a system can help improve the quality of information available to DENR and ensure a more credible system for implementing and collecting emissions fees in the Metro Manila airshed. As with any tax enforcement system, random and targeted audits are needed to encourage compliance and enable regulators to learn about firms’ compliance costs, techniques, and evasive actions.19
3.5.8 Burden of Proof
Firms should bear the burden of proving their emissions are lower than estimated (the Laguna Lake Development Authority had the same requirement). Conservative estimation procedures would give firms an incentive to switch to CEMS. In some cases, such as for large emitters, this would be a valuable improvement in data quality. However, the option is costly, requires sophisticated and consistent maintenance, does not monitor nonstack emissions, and may not monitor all pollutants (e.g., only SOx and PM may be covered).
3.5.9 Penalties and Dispute Resolution
Penalties and audit rates should be set high enough to encourage compliance. A streamlined process for hearing and resolving disputes needs to be designed. As with monitoring, enforcement capacity needs to be built up within EMB. Both of these components are critical for the policy to have a significant and consistent incentive effect.
Previous assessment of EMB’s enforcement capability revealed that fines by themselves were rarely used to leverage compliance.20 Further, this assessment revealed that even when
19 EMB can take advantage of preexisting regulatory relationships to ease compliance and enforcement burdens. Income tax returns will have indicators of production and fuel expenses. Some firms may also be subject to LLDA emissions charges and those reporting requirements. 20 Industrial Environmental Management Project, United States Agency for International Development, July 1992-April 1997.
27
Resources for the Future Krupnick, Morgenstern, Fishcer, Rolfe, Logarta, Rufo
assessed, fines were rarely collected. Reasons include the absence of guidelines on setting fines to account for the seriousness of the violation or the violator’s ability to pay, and the lack of institutional incentives for collection (revenues from fines and penalties do not revert to EMB). However, discussions with two regional EMB offices indicated that this trend may be changing, at least in the environmental impact assessment program. The creation of the Environmental Revolving Fund under this program allowed EMB to retain revenues from administrative fines. Assessment and collection of administrative fines and penalties have more than doubled since 2001.
A review of 33 pollution adjudication cases revealed that it takes EMB an average of 8 months to serve a cease-and-desist order from the date a violation is detected, and 15 months for firms to comply from the date compliance activities are initiated. In one exceptional case, more than 150 months elapsed before EMB issued its cease-and-desist order. Of the 33 cases reviewed, only 7 cases were considered resolved. For an emissions fee system to function effectively, significant reforms must be undertaken in the administrative mechanisms for enforcing penalties and resolving disputes. The types of delays observed in the present system would seriously diminish the effectiveness of the emissions fee system of the type we propose.
3.5.10 Collection
EMB’s experience in billing and collection is limited to fines, permits, and processing fees. Although the Environmental Quality Division usually does billing, collection is the responsibility of its Administrative Support Division. EMB has technical specialists who understand industrial operations, composition of emissions, and applicable control technologies, as well as a central laboratory capable of testing emission samples. However, the EMB staff is small (20 technical staff overall in the Metro Manila airshed) and has no specific experience collecting emissions fees of the type proposed. The Department of Finance could help coordinate collection (though all revenues would still be allocated to AQMF) and also lend important expertise for auditing emissions fee returns (though this function needs to be augmented with technical expertise for verifying the emissions quantification).
3.5.11 Timing and Phasing In
A phasein period, between announcement of the fee program and its full implementation, can be used to promote understanding within the business community and allow firms to take actions that will reduce their emissions and consequently their fees. For example, the emissions reporting component could take effect in the first year, so that firms could learn how to comply
28

Resources for the Future Krupnick, Morgenstern, Fishcer, Rolfe, Logarta, Rufo
with the program and observe how it will affect their costs. During this time they could start to reduce those costs through abatement. The following year, the fee payments would be required.
Over time, as the actual impact of the program on emissions is revealed, the fee can be adjusted to reach ambient concentration targets. Better information about the levels, composition, and consequences of emissions can also lead to adjustments in the fee structure, such as the ratio for including SO2. The standard exemption could also be phased down over time as transitional costs pass and emissions fall.
Later, the stationary source program could be expanded. One option would be to lower the participation threshold, as compliance costs fall with learning and revenue needs rise with the shrinking emissions base. Another option is to expand to other airsheds in the nation. The fee system described here is intended for Metro Manila; when setting the fee for another region, policymakers should take local conditions into account. Emissions reporting would remain uniform, but the basic PM10 fee rate could vary according to differences in abatement costs and air quality or to compensate for transport issues. It could also be adjusted over time, as more information is gathered about air quality impacts and emissions control costs. Although the 50% surcharge for nonattainment areas creates a certain differentiation, it is crude, and we have not incorporated the surcharge into our estimates for Metro Manila (which is likely to be in nonattainment status).
3.5.12 Coordinating with Other Policies
The Clean Air Act provides not only for emissions fees but also for emissions averaging (within contiguous sources of a single owner) and emissions trading (between sources). If the fees are set with sufficient incentive effect, these other policy options would be largely redundant.
Chapter II, Section 10 of the Clean Air Act differentiates management techniques between attainment areas, where the concentrations of specific pollutants are below threshold standards, and nonattainment areas. The precise process of determination has yet to be established, but the distinction between attainment and nonattainment areas is an improvement over the previous regulation, which was simply based on an urban or rural distinction. Nonattainment areas are to be managed according to the “bubble” concept. That is, no additional emissions may be introduced into an airshed without corresponding reductions from existing sources within that airshed.
Provisions in the implementing rules and regulations make this simple management approach daunting. For example:
29

Resources for the Future Krupnick, Morgenstern, Fishcer, Rolfe, Logarta, Rufo
• The National Emission Standards for Source-Specific Air Pollutants (NESSAP) and the National Ambient Air Quality Standards (NAAQS) use emissions concentrations, not quantities, as the principal metrics for compliance.
• The requirement that industrial sources comply with both NESSAP and NAAQS is impracticable, since the control over a firm’s emissions ends at the smokestack. Firms should be responsible for compliance with NESSAP only, and government should be responsible for NAAQS by controlling the amount, location, and time of release of pollutants.
• Emissions averaging, as designed in the implementing rules and regulations, allows a firm with multiple sources in proximity to exceed emission standards at some sources provided the average is in compliance. This flexibility mechanism is concentration based, not mass based.
• Emissions trading involves mass-based emissions, but it is allowed only under the strict condition that sources be new or modified, in compliance with NESSAP and NAAQ, and located in an attainment area. With a well-functioning emissions fee in place, this mechanism would be redundant.
3.6 Summary
We have presented a design methodology for implementing an emissions fee program for stationary sources. The intent of the program should be to offer efficient financial incentives to reduce particulate emissions and precursors, as well as to raise revenues for important air pollution monitoring and enforcement activities. Many uncertainties about the ideal parameters remain, and improved monitoring and information collection is necessary (see Section 5). However, much can be learned by implementing the program. Therefore, we recommend beginning immediately with a straightforward fee program targeted initially at the most important emitters, recognizing that the fee may not reflect full marginal costs. To the extent possible, distributional concerns should be addressed through standard credits, investment credits, or other ways that allow marginal fees to provide stronger incentive effects.
4. Mobile Sources
Several recent analyses of mobile source pollution in Manila (Ruzicka et al. 2002; URBAIR; ENRAP) develop a menu of market-based and command-and-control approaches that could be applied to mobile sources. Based on these studies and our own analyses, our team
30

Resources for the Future Krupnick, Morgenstern, Fishcer, Rolfe, Logarta, Rufo
proposes a mobile source control action plan, which includes several high-priority initial actions for mitigating mobile source emissions. We recommend first that a pilot diesel retrofit program for utility vehicles (including jeepneys) begin immediately. A very promising low-cost technology that is effective at 2,000 ppm sulfur content is specifically recommended for the pilot program. Our second recommendation is for a charge on the sulfur content of diesel fuel to encourage meeting the 500 ppm standard and to push refineries to sulfur content levels compatible with more advanced particulate trap technologies.
4.1 Background
The introduction to this report identified PM as the main pollution problem in Manila, with ambient ozone being a lesser problem. This finding is consistent with the epidemiological findings, which indicate that PM is a far more serious health risk than ozone, ton for ton for the contributing emitted substances (direct and precursor emissions alike). This finding is also consistent with monitored readings, which indicate few violations of ozone guidelines or standards, although the monitoring is not considered completely reliable.21 The decision to downplay the ozone issue implies a lesser interest in reducing VOC emissions (from gasoline vehicles primarily), CO emissions (from all mobile sources), and NOx emissions (from both diesel and gasoline vehicles).
Assigning a low priority to NOx control in our plan is a critical element for a diesel emissions control strategy because it permits a way out of the “diesel dilemma.” Simply stated, the physics of diesel engines creates a trade-off between reducing PM emissions and reducing NOx emissions. To get both requires very complex and expensive abatement technology, as well as very low sulfur fuel—conditions that are simply not yet practicable in the Philippines.
By recommending a diesel retrofit program and sulfur charge, we are not suggesting that the many other options for reducing mobile source emissions be ignored. With air pollution problems as serious as those faced in Manila, many points of attack are needed. Nevertheless, limited administrative resources demand prioritization. For instance, we recommend putting off consideration of alternative-fueled vehicles to take the place of diesel vehicles. They are expensive and not cost-effective. Moreover, a policy to promote them would take a long time to pay off because it would apply primarily to new vehicles, although a retrofit program, such as
21 Ateneo is the sole site that monitors ozone, and the readings have been erratic.
31

Resources for the Future Krupnick, Morgenstern, Fishcer, Rolfe, Logarta, Rufo
that operating in Seoul and India, might be effective, at least on a small scale. We believe the Philippines should wait for less expensive technologies.
Similarly, we do not recommend bolstering the gasoline vehicle inspection and maintenance program at this time. Improving enforcement of this program will take a huge administrative commitment, and the pollutants emitted may not be contributing much to Manila’s most serious pollution problems. We also recommend putting off consideration of changing vehicle registration fees to make them more environmentally responsive. This is a good idea, but these fees have just recently been reformed, and our reading of the political realities suggests that there are better approaches for now. Additional instruments are certainly available to reduce PM emissions; for some examples and their cost effectiveness, see Table A.5.
4.2 Emissions Inventory
The emissions inventory developed by Rolfe (2002) indicates that 39,000 tons of PM10 are emitted by mobile sources. Of mobile source PM10 emissions, 49% comes from diesel utility vehicles, 22% from motorcycles and tricycles using gasoline-oil mixtures in two-stroke engines, and 23% from diesel buses and trucks (table under Rolfe 2002, Section 3.3). Of the 1.7 million vehicles in Metro Manila, diesel vehicles make up 543,000 (about one-third), with another third being gasoline autos, and the rest gasoline utility vehicles and gasoline-oil motorcycles. Consequently, a focus on direct diesel emissions (as opposed to gasoline emissions), particularly from nonbus sources, seems necessary and appropriate.
4.3 Retrofitting Diesel Exhausts with Particulate Traps
Given the relatively slow capital turnover of diesel vehicles in Metro Manila, our recommendation is to focus on the existing fleet and to initiate a pilot program for testing the performance of two types of particulate traps. This program would lead to the development of a more comprehensive program for retrofitting diesel vehicles with either simple, inexpensive particle traps or more advanced traps with higher removal efficiency. Based on the emissions inventory, diesel utility vehicles, which include jeepneys, make up 25% of the fleet but are responsible for half the diesel emissions; diesel buses and trucks make up 6% of the fleet and, because of their higher emissions per km (2 g/km vs. 0.9 g/km), are responsible for 23% of the diesel emissions. Motorcycles and tricycles make up 22% of the fleet and contribute 22% of the mobile PM10 emissions. Controlling this last source of emissions would require very different mechanisms because bikes don’t burn diesel fuel; thus we assign this source a lower priority. Diesel autos and miscellaneous vehicles make up the rest of the PM10 mobile source emissions,
32

Resources for the Future Krupnick, Morgenstern, Fishcer, Rolfe, Logarta, Rufo
which we ignore in this program because the vehicles, while numerous, have relatively low pollution per kilometer and because designing policies for these vehicles would be difficult and their implementation expensive.
4.3.1 Technologies
There are many options for reducing vehicle emissions, including engine design, combustion conditions, and the use of after-combustion controls; Table A.5 in the Appendix details some of them and their costs. We focus on the options for diesel vehicles and have researched retrofit technologies for their cost-effectiveness, considering various types of oxidation catalysts and particulate traps.
We are particularly interested in the traps used in Hong Kong’s diesel emissions control program (Figure 4.1). This part of the Hong Kong program targets light-duty diesel vehicles, a category that in Manila would include buses, jeepneys, and other utility vehicles. Over 80% of the light-duty diesel fleet (24,000 vehicles) has been retrofitted. Initial installation costs are about $160; replacement traps cost $30 each and last about one year. The trap is fitted over the end of the tailpipe (and thereby is easy to spot) and requires daily to weekly cleaning in soapy water at a cost of under HK1 ($0.12) per cleaning. The traps were found in the lab to reduce particulates by 20% and opacity by around 30%, although a recent publication suggests that the traps on pre-Euro diesels could cut particulate emissions by 30%.22 Fuel economy loss and increases in back pressure were minimal. Most importantly, the traps work by mechanical means; hence they can be used with high-sulfur diesel fuel.
22 However, we are waiting for more concrete estimates from the company.
33

Resources for the Future Krupnick, Morgenstern, Fishcer, Rolfe, Logarta, Rufo
Figure 4.1. Schematic of “ECO-TRAP,” from ECO-TEK, Hong Kong
4.3.2 Cost-Effectiveness
Even a very inexpensive program may not be cost-effective, or a very expensive program may be highly cost-effective compared with the options. We find that with the most favorable assumptions in Hong Kong, cost-effectiveness is $16,500 per ton of PM. Applied in the Philippines, cost-effectiveness would improve—assuming 30% removal is achievable, and initial costs and maintenance costs are halved—to $3,600 per ton. This estimate seems quite optimistic, however. Using a 15% removal rate would double the cost in the Philippines, to $7,200 per ton. And cost-effectiveness would be less impressive for utility vehicles than for buses because of the lower baselines and the observed lower effectiveness.
How do those cost-effectiveness estimates compare with other measures for diesel particulate control or other particulate controls? If sulfur levels were far lower, then oxidation catalysts (which need very infrequent maintenance) could be used to remove particulates. For the oxidation catalysts, we estimate cost-effectiveness of $3,500 to $7,000 per ton, but with different assumptions, estimates would be higher. For instance, we assumed a 10-year lifetime for the catalyst. Expanding this could improve cost-effectiveness significantly.
We identified a variety of other cost-effectiveness estimates in URBAIR, presented in Table A.5 in the Appendix, although the exact calculations and assumptions are not available. These estimates include $40 per ton for the smoke belching program, about $1,400 per ton for an
34

Resources for the Future Krupnick, Morgenstern, Fishcer, Rolfe, Logarta, Rufo
inspection and maintenance program applied to light-duty diesels, and $11,000 per ton for switching jeepney engines to gasoline. There are non-vehicle-related options as well, with cost-effectiveness of $5,000 to $8,400 per ton for reducing the sulfur content of fuel from 700 to 200 ppm, $2,000 to $4,000 per ton for reducing the sulfur content of fuel oil, and $20,000 per ton for reducing sulfur from fuel oil used at power plants. In this context, a trap program looks reasonable.
4.3.3 Drawbacks
There are several potential drawbacks to the particulate traps, however. If the routine (and frequent) maintenance schedule is not followed, the traps can ignite; though not dangerous to the vehicle, the fire can destroy the filter. The designers appear to have reworked the traps to significantly reduce this problem. In addition, there is a small mileage penalty at high loads (around 1%) due to the increased back pressure from the trap. With fuel efficiency of 0.15 liters per kilometer (URBAIR) and diesel costs of P12.7 per liter, the penalty would add at most $19 a year to fuel costs.
On the positive side, in a detailed survey of participants in the pilot program in Hong Kong, 82% supported the suggestion that all vehicles of their type be fitted with this trap and agreed that effects on performance of the vehicle were minimal. Most did not mind cleaning the filter, even every day, but they did suggest that cleaning tubs at filling stations be made available for this purpose.
4.3.4 Implementation
We recommend that the particulate trap technology be tested in 50 to 100 vehicles using commercially available diesel fuel. We also recommend that the oxidation catalyst technology—which is more expensive but needs minimal maintenance and obtains higher removal efficiencies—be tested in another pilot program for vehicles using fuel with a sulfur content of 150 ppm or less. This program would enlist vehicles in fleets or in neighborhoods with access to the specially refined fuel.
With information from both experiments, an informed choice could be made on how to proceed with a retrofit program. If the pilot programs show that the particle trap is not cost-effective, then oxidation catalyst technology needs to be evaluated. However, for this technology to be effective, the sulfur content of diesel fuel would need to be reduced below 150 ppm. Sulfur content higher than this leads to sulfate emissions that more than offset decreases in emissions of other particulates. This trade-off is unacceptable, given that sulfate particulates are known to
35

Resources for the Future Krupnick, Morgenstern, Fishcer, Rolfe, Logarta, Rufo
endanger human health (Pope et al. 1995, 2002). Thus, a change in the diesel particulate mix toward higher-sulfate levels, holding total particulate emissions constant, could well worsen health effects.
There are several approaches to implementing a comprehensive program. As in Hong Kong, it can be fully subsidized by the government as an independent program. This approach is costly to administer, would not necessarily target the dirtiest vehicles, and is open to corruption. Other, less costly options include modifying taxes and vehicle-franchise registration fees to subsidize the capital costs. Owners of jeepneys, buses, and commercial vehicles who have purchased and installed the traps or catalysts could deduct these costs from their taxes or vehicle fees.
Of course, the key to success is keeping the trap filters clean. The pilot program should therefore work with jeepney cooperatives to ensure proper compliance. For a comprehensive program, we recommend an enforcement approach that adds to the existing smoke belching program a random inspection component for diesel vehicles, with visual inspection to see whether the trap is properly installed and the filter clean. This would be easy to do at filling stations. Owners of vehicles without traps would incur relatively large fines, and those with saturated traps would be fined as well.
4.3.5 Summary
The pilot utility vehicle diesel retrofit program is a reasonably cost-effective way to develop a more comprehensive and cost-effective retrofit program, will have very low administrative costs, will not affect any industrial sectors, and has no significant income distribution implications.
4.4 Sulfur in Diesel
A charge aimed at reducing the sulfur content of automotive diesel has several advantages. Given industry pressure to relax targets for meeting new lower standards, the sulfur charge would offer financial, if not mandatory, incentives to meet them. The tax could also encourage overcompliance with the standard, which is a necessary step toward making diesel catalysts effective. Furthermore, to the extent that compliance with the diesel standard is achieved by switching to low-sulfur crude, the sulfur content of other fuels (including kerosene and bunker fuel) would be improved as well.
36

Resources for the Future Krupnick, Morgenstern, Fishcer, Rolfe, Logarta, Rufo
4.4.1 Sulfur and Catalysts
Reducing sulfur is a precondition for the most effective and cost-effective technology for reducing diesel PM emissions—the use of particle traps and oxidation catalysts. Sulfur levels below 150 ppm are needed for the most efficient particle traps to work. Even sulfur content at the Philippines 2004 standard of 500 ppm is far too high for these retrofit technologies to reduce diesel emissions significantly, and it could actually lead to an increase in particulate emissions. Therefore, we recommend setting the sulfur tax high enough to encourage first rapid compliance with the 2004 standard and then further reductions—to below 150 ppm.
The surprising finding about particle creation may be seen in Figure 4.2, which shows the results of testing two particle trap technologies at different sulfur content levels. The Engine-Out columns catalogue uncontrolled emissions; CDPF and CR-DPF are the trap technologies. At 350 ppm S, sulfate emissions, which arise from the oxidation of sulfur, are about 20% of total uncontrolled emissions (0.08g/bhp per hour) but rise many times over when particle traps are installed. At 150 ppm S, no change in total emissions is seen, although the sulfate fraction now vastly dominates.
Figure 4.2
4.4.2 Sulfur and PM10
Any reduction in sulfur in diesel fuel will lower PM concentrations. Figure 4.2 shows that there is a slight benefit of lower-sulfur fuel on total emissions in the uncontrolled state (the left
37
Resources for the Future Krupnick, Morgenstern, Fishcer, Rolfe, Logarta, Rufo
bar in each group of three). But this figure shows fuel sulfur levels only up to 350 ppm. If we start at current levels (in excess of 2,000 ppm), the gain would be much larger. An auto/oil study23 shows that reducing sulfur content from 2,000 to 500 ppm reduces PM emissions from light-duty diesels by 2.4% and from heavy-duty diesels by 13%. If heavy-duty diesel emissions in Manila are 23% of total mobile PM emissions and light-duty diesel emissions are 50%, this would imply a reduction in direct PM mobile source emissions of 4.2%.
PM concentrations also will be reduced through the atmospheric link between SO2 emissions and sulfate conversion. SO2 emissions convert to sulfates in the presence of ammonia in the atmosphere at fairly high rates. It is likely, although not certain, that reducing the sulfur content of diesel fuel can make a big dent in the sulfate fraction of PM concentrations.
4.4.3 Precedents for a Sulfur Tax
Experience with lead suggests this approach is feasible in the Philippines. The phaseout of lead in gasoline was accomplished quickly with the aid of tax restructuring that offered incentives to consumers to switch fuels. A tax differential equal to the production cost differential of P0.56 per liter was created: a charge of P0.28 per liter was levied on leaded gas, and an equivalent subsidy was given for unleaded gas, taken from the oil price stabilization fund (when prices were still regulated). Upon price deregulation, the excise taxes were restructured to give unleaded gasoline a 50 centavo edge at the pump. Started in 1994, the phaseout was complete in 1999. Concurrently, oil prices were deregulated and all prices fell.
4.4.4 Challenges
One challenge to implementing a sulfur tax involves income effects. On the one hand, the political climate seems conducive to rethinking the tax structure for fuels: both the Department of Energy and the Department of Finance are engaged in discussions for rationalizing fuel taxes in the very near future, primarily in fixing the discrepancy between regular and premium unleaded gasoline. However, the Department of Finance has voiced concerns about the impact of price increases on consumers, as well as revenue needs; apprehension about the upward volatility in world crude prices may make the agency less keen on fuel tax restructuring at this time. A previous study analyzed the distribution of diesel cost and health benefit increases according to
23 National Research Council. 1992. Rethinking the Ozone Problem in Urban and Regional Air Pollution. Washington, D.C.: National Academy Press.
38

Resources for the Future Krupnick, Morgenstern, Fishcer, Rolfe, Logarta, Rufo
income decile.24 As we have noted, benefits calculations require further study, but focusing on their cost results, we see that the cost increases would be progressive in absolute terms, though likely regressive in relative terms.
Table 4.1. Incremental Private Costs and Benefits per Income Decile
from Diesel Desulfurization of 0.2% to 0.05% (million pesos)
Income Decile Costs Benefits Net Benefit
1st (poorest) 13.24 43.38 30.14 2nd 18.57 47.18 28.61 3rd 23.60 49.99 26.39 4th 27.93 52.99 25.06 5th 29.59 56.54 26.95 6th 32.73 60.57 27.84 7th 41.44 65.82 24.38 8th 45.31 72.93 27.62 9th 53.88 45.58 -8.30
10th (richest) 93.35 114.59 21.24 Total 379.64 609.57 229.93
The energy department is also concerned about the impacts of new fuel standards and taxes on the viability of the local oil refiners. Figures show that compliance with the current standard of 2,000 ppm S (from 5,000 ppm before January 2001) diesel was achieved mainly through dilution with imported 500 ppm S diesel.25
Some oil companies have sought a deferment of the new standard to either 2006 or 2007, which would require an amendment to the Clean Air Act. If the government is eventually persuaded to defer the new standard on limited protectionist grounds, then imposing a tax differential (between a high-sulfur and low-sulfur grade) would be an attractive option to move policy in the same direction.
24 Inocencio, A.B., C.M. Rufo, D.J. Ramirez (1997). An assessment of policies to control air pollution from motor vehicles in Metro Manila. ENRAP III. 25 The Department of Energy also wants a reduction in the tax rate for lpg for automotive use and for regular gasoline.
39

Resources for the Future Krupnick, Morgenstern, Fishcer, Rolfe, Logarta, Rufo
4.4.5 Cost of Sulfur Removal
The Clean Air Act (Chapter III, Article 1) set the specifications of the sulfur content of automobile diesel to reduce emissions: no more than 0.20% by weight no later than November 2000, and no more than 0.05% by year 2004. The implementing rules and regulations further defined the sulfur content of diesel and required industrial diesel fuel to contain no more than 0.30% by January 1, 2001. At least one company is already overcomplying, producing automotive diesel with sulfur content closer to 0.10%.
ENRAP assessed several policies to control mobile emissions in Metro Manila based on efficiency, distributional impact, and administrative feasibility.26 One of these policies is the desulfurization of diesel. Table 4.2 presents their cost data, provided by two oil companies, for reducing sulfur content of diesel provided by the refiners. Note, however, that the cost ranges are very wide. We expect that marginal costs would rise for tighter sulfur removal requirements. But at the high end of the ranges for reducing sulfur in the first two categories, such costs appear to fall. Thus, we question these data.
Table 4.2. Refinery Cost Estimates of Diesel Desulfurization, 1996
Refinery Costs
Sulfur Reduction $/bbl P/li
From 0.5% to 0.3% (pre-Clean Air Act) 0.55–1.65 0.09–0.27 From 0.3% to 0.2% 1.07–6.54 0.17–1.03 From 0.2% to 0.05% 2.61 0.43
Our recent discussions with oil industry representatives and energy officials indicate that no refinery reconfiguration projects for compliance with the standard are in the pipeline. Without such changes, the only way the three local refineries could comply with the 500 ppm standard by 2004 is by importing all of the country’s diesel requirements. The refiners have presented a wide range of cost estimates for meeting the new standard, anywhere from P.50 to P1.50 per liter.
26 Inocencio, A.B., C.M. Rufo, D.J. Ramirez (1997). Other instruments include differential taxes on leaded and unleaded gasoline, vehicle excise taxes to control ownership, road user charges (area licenses and parking fees), anti-smoke belching program, unified vehicular volume reduction program, banning of leaded gasoline, and Metro-Rail transit
40
Resources for the Future Krupnick, Morgenstern, Fishcer, Rolfe, Logarta, Rufo
Rough calculations at the energy department show that a mere P0.30 per liter increase is an appropriate estimate.27 Our alternative calculations show that this cost could be even lower, perhaps P0.13 per liter.28
We also consulted a broader, international literature to estimate costs of reducing sulfur content through technological means, as opposed to blending current-quality Philippine diesel production with imports. Ruzicka et al. (2002) cites $3–5 per kg as “the typical range of the marginal damage estimates” for sulfur, and $1–3 per kg as “the typical estimate of the cost of desulfuring.” Taking the two lower estimates, a $1 to $3 charge per kg for diesel fuel just meeting the 0.05% standard would be $1 to $3 x 0.0005 = $0.0005 to $0.0015 = P0.25 to P0.75 per liter. Currently, diesel fuel sells for P12.77 per liter, which includes a tax of P1.63 per liter.
For comparison, the U.S. Environmental Protection Agency (Heavy-Duty Diesel Rule RIA 2001) estimates that the long-run refinery costs to remove sulfur from a base content of 500 ppm max (average of 350 ppm) to 15 ppm max (average of 7 ppm) is about $0.05 per gallon, or P0.66 per liter, although for some plants the costs could be as low as $0.02 per gallon or as high as $0.07 per gallon. In Europe, sulfur taxes averaging around $0.05 per gallon have been used to lower the sulfur content in diesel from about 500 ppm max to 50 ppm max (McConnell and Harrington 2002). An estimate for Canada (Huss 2000) for lowering on-road heavy-duty diesel and off-road heavy-duty diesel from 500 and 3,500 ppm, respectively, to 150 ppm through new investment in desulfurization is about $0.045 per gallon (or P0.59 per liter). This last estimate may be particularly useful for Manila.
4.5 Sulfur Charge Design
We propose restructuring the excise tax on diesel fuel into two parts, a base rate and a charge based on the sulfur content. In other words,
Total tax per liter = base excise tax + charge*sulfur rate
Thus, the lower the sulfur content of the fuel, the lower the taxes paid for every liter sold.
27 Based on a total investment cost of US$115 million; and exchange rate of P51/$; capital recovery in 5 years; and 16% interest rate. 28 The oil companies reported that it cost them on average P0.25 to comply with the switch from 5000 ppm to 2000 ppm. The energy department claims this was mainly through blending of the old grade with the best available grade of 500 ppm in the Asian market. From these figures, we calculate that the imported grade costs just P0.38 more than the 5,000-ppm grade. This figure is close to the lower bound of the ENRAP figures provided by the oil companies. Thus, the incremental cost of going to 500 ppm would be around 13 centavos if all diesel is imported.
41

Resources for the Future Krupnick, Morgenstern, Fishcer, Rolfe, Logarta, Rufo
In contrast with the recent lead phaseout, the actors would not be consumers choosing between different grades and prices of diesel at the pump, but rather producers, who would decide how much sulfur to remove from the diesel fuel they sell at retail. If a refinery can lower sulfur cheaply, it will pay less tax; if another finds more desulfurization too expensive, rather than raise its production costs, it can choose to pay more tax.
As with the stationary source fee, the sulfur charge should reflect the costs of sulfur and its removal. A problem common to both designs is a lack of information. One would need the marginal reduction costs of all the major players to set the tax rate that would hit the desired reduction (such that the average content equals the standard).
We also recognize concern over the price of diesel at the pump. To see the impact of the sulfur charge, we consider the factors determining the market price of diesel:
Pump price per liter = Marginal cost (given sulfur rate) + Total tax per liter
If we take the lower industry estimate of P0.5 per liter to meet the standard, without a sulfur charge, the retail price of diesel would be the current marginal cost at 2,000 ppm, plus the production cost increase to get to 500ppm, plus the current tax: P9+0.5+1.63=P13.27. The P0.5 cost to remove 1.5 grams of sulfur per liter implies an average cost of P0.333, and we choose this as the charge per gram of sulfur for our example. To hold harmless firms that meet the 500 ppm standard, one would then need to reduce the base excise tax rate by P0.333/g*0.5g = P0.167. With the sulfur content charge in place, firms granted an extension from the hard target would incur up to P0.333/g*2g − P0.167 in extra tax payments, or P0.5—the same amount as the per-liter cost of those meeting the standard. In this way, noncomplying firms would not receive a special cost advantage over those that comply.
Although prices should remain little affected by the sulfur charge and tax restructuring, revenues would be made sensitive to the sulfur content. If sulfur content remains higher than the standard, tax revenues would also be higher. If firms overcomply with the standard, tax revenues will fall.
4.5.1 Revenue-Raising Option
Making the sulfur charge additional to existing excise taxes, instead of lowering the base, would raise additional revenue and raise retail prices. One option would be to use the sulfur charge revenues to create a fund that can help subsidize purchase of the particle traps.
An additional effect of the corresponding price increase would be to reduce some of the differential between gasoline and diesel prices. The relative price change, over time, could
42

Resources for the Future Krupnick, Morgenstern, Fishcer, Rolfe, Logarta, Rufo
induce a switch to gasoline vehicles for new vehicles, or perhaps even engine replacements on old vehicles; while exacerbating VOC emissions, this would result in a large drop in PM emissions. However, if the stock of diesel vehicles improves over time, upgrading to Euro 3 and 4 standards, and sulfur content falls enough to make catalysts effective, in the long run this switch may not be so desirable, given concerns over carbon emissions.
4.5.2 Other Methods for Mitigating Cost Increases
Alternatively, one could retain the current excise tax and levy a charge on sulfur content if it exceeds some percentage (and issue a credit if it more than meets the standard), in effect creating a rate-based exemption. In theory, the price and revenue effects would be the same as in the previous example.29
If transition costs for refineries are a concern, especially for obtaining industry acceptance of the policy, the program could initially offer rebates toward installing desulfurization capacity. Alternatively, a standard exemption could be included in determining the base for the charge. A fixed exemption would mean that fees would have to be paid on total sulfur exceeding a certain fixed amount. This reduces the total tax liability for the producer while maintaining the marginal incentives (fully so, if the charge is refundable for sulfur levels below the exemption). However, building in such an exemption risks creating a transfer to producers that persists beyond the transition period.
Based on our reading of the political and distributional goals, we focus on the option of replacing a portion of the excise tax with a sulfur charge.
4.5.3 Administration
A sulfur-content tax would be best levied at the point where the refined products enter the market: sales by refineries and importers of refined products. These actors are limited in number (three refineries, and perhaps five major importers of automotive fuels), and they have preexisting regulatory burdens and relationships with enforcement agencies. This “upstream” point of compliance thus minimizes the administrative and enforcement burden. The price
29 The danger here is that unintended tax credits could be created; in the U.S. lead phasedown policy, which used tradable performance standards (another rate-based scheme), some companies blended otherwise uneconomic fuels (like ethanol) with a little leaded gasoline, just to generate tradable credits.
43

Resources for the Future Krupnick, Morgenstern, Fishcer, Rolfe, Logarta, Rufo
incentives would be similar regardless of the point of compliance. Lower-quality fuels are made more costly, creating pressure to consume and produce higher-quality fuels.
Administratively, the sulfur-content charge should not present much of an increased burden over current practice. Excise taxes are already collected on the volume of diesel sales, and sulfur contents must be certified, so the program would impose no additional reporting requirements. It would, however, increase the financial importance of fuel sampling and reporting; thus, verification and monitoring would require greater attention.
Imposing and altering the diesel tax requires legislative approval, so the charge may be harder to phase in or fine-tune. Still, adjustments could be made over time; reform could perhaps give the Department of Energy (or another agency) authority to adjust the sulfur charge on its own. Initially imposed to speed compliance to the 500 ppm standard, the charge would also help provide information regarding the costs and cost-effectiveness of further lowering sulfur in fuels.
4.6 Summary
We recommend first that a pilot diesel retrofit program for utility vehicles (including jeepneys) begin immediately along with the development of a tax credit program to pay for the technology. A very promising low-cost technology that is effective at 2,000 ppm sulfur content is specifically recommended for the pilot program.
Our second recommendation is for a revision to the existing diesel tax to encourage compliance with the 500 ppm diesel fuel sulfur-content standard, currently scheduled for 2004. This restructuring of the form of the overall excise tax represents the simplest method for addressing concerns regarding retail price effects of incentives to lower sulfur. Assuming the charge accurately reflects the cost of meeting the standard, this tax shift would hold both revenues and retail prices constant. If, as we suspect, costs are actually lower, both sulfur content and pump prices would be lower—but so would revenues. It is anticipated that the experience of implementing this revised tax will provide the basis, over time, for further revisions that can accelerate the introduction of even lower-sulfur fuels (150 ppm), which in turn are compatible with more advanced particulate trap technologies.
44

Resources for the Future Krupnick, Morgenstern, Fishcer, Rolfe, Logarta, Rufo
5. Key Unresolved Issues
The framework we have developed for the emissions fee and pilot retrofit programs would benefit from additional support in the implementation phase. More detail on the policy options requires input from local policymakers and stakeholders, and final parameters need to be better grounded in improved data on air quality and emissions. Assuming agreement to go ahead with the proposals, appropriate timelines must be developed, as well as detailed plans for the pilot study.
5.1 Data
5.1.1 Air Quality Monitoring
One of the biggest uncertainties about the efficacy of the policy options is the degree to which sulfur and SO2 reductions are needed to improve air quality. Sparse SO2 and fine particulate speciation data indicate that sulfur and SO2 are not a major problem, but this conclusion comes from old data for SO2 and only one monitor for fine PM. In addition, the apparent lack of such problems makes Manila an outlier compared with other cities in Asia. We strongly recommend that additional, more representative monitoring sites be set up to develop better speciation data. Then the data should be analyzed and integrated into the plan.
5.1.2 Emissions Inventory
Rolfe (2002) relied primarily on self-monitoring reports for industrial sources. Data from major emitters should be independently verified, particularly to incorporate process-related emissions. Aggregate and sector-level data should be compared with those from previous studies and the discrepancies reconciled. Production levels and other firm-specific data would aid in addressing important distributional questions about exemption levels.
5.1.3 Marginal Costs
Better data on costs are needed to determine cost-effectiveness. Marginal cost data are critical for setting appropriate reduction targets. For example, desulfurization costs vary with regional import supplies and local refinery equipment and capacity. Reliable, independent estimates of desulfurization costs in the Philippines are needed. For the stationary source program, better abatement cost data are also needed and will be an important focus of study as the program goes forward.
45

Resources for the Future Krupnick, Morgenstern, Fishcer, Rolfe, Logarta, Rufo
5.2 Capacity Building
5.2.1 Prerequisite Knowledge
Building support for incentive-based environmental programs among stakeholders and policymakers may require training in the fundamental principles of environmental economics. Developing literacy in these issues is the key to effective discussions of policy options. A training workshop should be held to explore the basics of market-based environmental policies and survey international experiences with them.
5.2.2 Environmental Management Bureau
In addition to knowledge about market-based programs, capacity needs to be built within EMB so that it can implement the emissions fee program. The emissions tracking system needs to be designed and deployed among the regional offices. If in-house monitoring and auditing are not yet feasible, the ability to credibly and efficiently bid out and oversee contracts to third-party monitors must be developed.
5.2.3 Compliance Education
Pollution control officers and other stakeholders will need training in the new program, for such tasks as submitting information for the emissions tracking system, calculating emissions fee liabilities, and evaluating opportunities to reduce emissions cost-effectively. A concerted training program could operate alongside the emissions fee system during its first year, which we propose as a dry run to promote learning and early compliance.
5.3 Implementation and Assessment
5.3.1 Particle Trap Retrofit Program
It will be useful to have an outside team monitor the conduct of the pilot program. Indeed, given the lack of capacity of EMB, it may be necessary to outsource the entire effort. In addition, once the pilot is complete, the data would need to be analyzed and recommendations prepared for a comprehensive retrofit program.
46
Resources for the Future Krupnick, Morgenstern, Fishcer, Rolfe, Logarta, Rufo
5.3.2 Fuel Tax and Emissions Fee Programs
Again, it will be useful to have an outside team available for advice on the exact structure of these programs as well as for analysis of their implementation and efficacy. All too often, well-designed air quality monitoring programs have fallen into disrepair and disuse after projects ended. We suggest that a continuing oversight of these efforts be maintained, with local and international consultants.
47

Resources for the Future Krupnick, Morgenstern, Fishcer, Rolfe, Logarta, Rufo
References
Air Quality of Metro Manila
Asian Development Bank. 1992. TA No. 1414-PHI: Study on vehicular emission control planning in Metro Manila, 1991–1992.
Australian Nuclear Science and Technology Organization (ANSTO). 2002. Aerosol Sampling Program Newsletter, No. 26. January.
Environmental and Natural Resource Accounting Project (ENRAP). 1996. Philippines ENRAP, Phase III. Manila.
Ruzicka, I., A.L. Indab, and C.M. Rufo Jr. 2002. Coughing up for clean air: Incentive-based approaches to controlling air pollution in Metro Manila. Manila: Asian Development Bank.
Rolfe, K. 2002. Technical inputs to the application of market-based instruments to air quality management in the Metro Manila airshed, Philippines. Manila: Asian Development Bank, May.
(URBAIR) Larssen, S., F. Gram, L. Hagen, H. Jansen, X. Olsthoorn, R. Lesaca, E. Anglo, E. Torres, R. Subida, and H. Francisco. 1997. Urban air quality management strategy in Asia: Metro Manila report. J. Shah, T. Nagpal, and C.J. Brandon, eds. Technical Paper No. 380. Washington, DC: World Bank.
Stationary Abatement Costs
Brandon, C., and R. Ramankutty. 1993. Toward an environmental strategy for Asia. World Bank Discussion Paper No. 224.
Tavoulareas, E.S., and J.P. Charpentier. 1995. Clean coal technologies for developing countries. World Bank Technical Paper No. 286, Energy Series.
Wijetilleke, L., and S. Karunartane. 1995. Air quality management: Considerations for developing countries. Washington, DC: World Bank.
Meier, P., and M. Munasinghe. 1994. Incorporating environmental concerns into power sector decision making: A case study of Sri Lanka. World Bank Environment Department Working Papers, Number 6. Washington, DC: World Bank.
48
Resources for the Future Krupnick, Morgenstern, Fishcer, Rolfe, Logarta, Rufo
Larssen, S.F., et al. 1997. Urban air quality management strategy in Asia: Metro Manila report. Washington, DC: World Bank.
Orbeta, E., C. Rufo, and A. Indab. 2000a. Benefits and costs of controlling emissions from fossil-fired power plants. Region IV, Philippines. http:/www.eepsea.org.
———. 2000b. Seeing through the smoke: Choosing the best option for pollution clean-up in the Philippines. http://wwww.eepsea.org/publications/policybr3/ACF3F9.html
Oskarsson, K. 1997. A planner’s guide for selecting clean-coal technologies for power plants. World Bank Technical Paper No. 387. Washington, DC: World Bank.
Vehicular Abatement Costs
Faiz, A., C. Weaver, and M. Walsh. 1996. Air pollution from motor vehicles. Standards and technologies for controlling emissions. The International Bank for Reconstruction and Development. Washington, DC: World Bank.
Umwelt Bundes Amt. 1995. Passenger cars 2000—requirements, technical feasibility and costs of exhaust emissions standards for the year 2000 in the European Community. Berlin.
Health Impacts
(ENRAP) Inocencio, A., C. Rufo, and D. Ramirez. 1997. An assessment of policies to control air pollution from motor vehicles in Metro Manila. Quezon City, Philippines: Environmental and Natural Resources Accounting Project-Phase 4a.
Health Effects Institute. 2002. Understanding the health effects of components of particulate matter mix—progress and next steps. http://www.healtheffects.org/.
Pope, C.A., et al. 1995. Particulate air pollution as a predictor of mortality in a prospective study of U.S. adults. American Journal of Respiratory and Critical Care Medicine 151: 669–74.
——— 2002. Lung cancer, cardiopulmonary mortality, and long-term exposure to fine particulate air pollution. Journal of the American Medical Association 287: 1132–41.
Schwartz, J., and D.W. Dockery. 1992. Particulate air pollution and daily mortality in Steubenville, OH. American Journal of Epidemiology 135: 12–19.
USEPA. 199. The Benefits and Costs of the Clean Air Act, 1990-2010. Washington, D.C.: Office of Air and Radiation/Office of Policy.
49

Resources for the Future Krupnick, Morgenstern, Fishcer, Rolfe, Logarta, Rufo
Appendix
Air Quality
Particles
A recent study supported by the Asian Development Bank analyzed the annual geometric mean concentrations of total suspended particulates (TSP) at all available sites in Metro Manila since 1987.30 The average of those results for each year is about 150 µg/m3.
Table A.1. Average Annual TSP Concentration
Year Average TSP Concentration Monitoring Sites
1987 151 µg/m3 8 1988 127 8 1989 170 9 1990 168 8 1991 167 8 1992 171 8 1993 163 6 1994 171 5 1995 244 7 1996 200 9 1997 218 10 1998 182 9 1999 175 9 2000 138 10 2001 153 10
Although there appears to be a downward trend since 1995, the concentrations are still very high by international standards. The relevant Philippine air quality guideline is 90 µg/m3, annual average. The United States’ TSP standard of 75 µg/m3 was changed in the 1980s to a PM10 annual average standard of 50 µg/m3. TSP concentrations in the United States averaged about 60 ug/m3 in the 1970s. Most of the monitoring sites were in cities.
30 Preliminary Assessment of Outdoor Air Pollution and Health in Metro Manila, University of the Philippines, Diliman, 30 October 2001.
50
Resources for the Future Krupnick, Morgenstern, Fishcer, Rolfe, Logarta, Rufo
Currently, there are no direct PM10 measurements in Metro Manila (Ruzicka et al. 2002). However, there was a limited amount of PM10 monitoring at three sites in 1991–92, under an Asian Development Bank project.31 Side-by-side comparison with TSP monitoring showed that PM10 concentrations were about 50% of the TSP concentrations. This factor, which matches well with adjustment factors typically used around the world, would imply that PM10 readings are about 75 µg/m3, annual average—higher than the Philippines air quality guideline of 60 µg/m3, annual average. (The U.S. PM10 annual average standard is 50 ug/m3.)
Until recently no PM2.5 monitoring data were available. However, during 2001 the Australian Nuclear Science and Technology Organization, in New South Wales, measured PM2.5, elemental carbon, and sulfur (where sulfate is three times sulfur).32 The site at the Philippine Nuclear Research Institute (located in a mainly residential area of Metro Manila) measured 45 µg/m3 concentration on average, with about 25% of the twice-weekly readings above 60 µg/m3 and at least a few daily average readings above 90 µg/m3. This information, along with data from Hong Kong and several other sites in China and New South Wales, is shown in Table A.2.
The Manila readings are very high, and if they are representative of the entire metro area, they would indicate an extremely serious problem. Although there is no Philippine guideline for PM2.5, this concentration can be compared with the standard recently promulgated in the United States—15 µg/m3, annual average, with a daily average standard of 50 µg/m3. A cautionary note, however: the usual adjustment factor from PM10 to PM2.5 is about 50%. A PM10 measurement of 75 µg/m3 for the region would imply a PM2.5 concentration of 38 µg/m3, rather than 45 µg/m3. Clearly, a major priority should be to set up more monitors for PM2.5.
31 TA No. 1414-PHI: Study on vehicular emission control planning in Metro Manila, 1991–1992. 32Australian Nuclear Science and Technology Organization (ANSTO), Aerosol Sampling Program Newsletter, No. 26, January 2002.
51
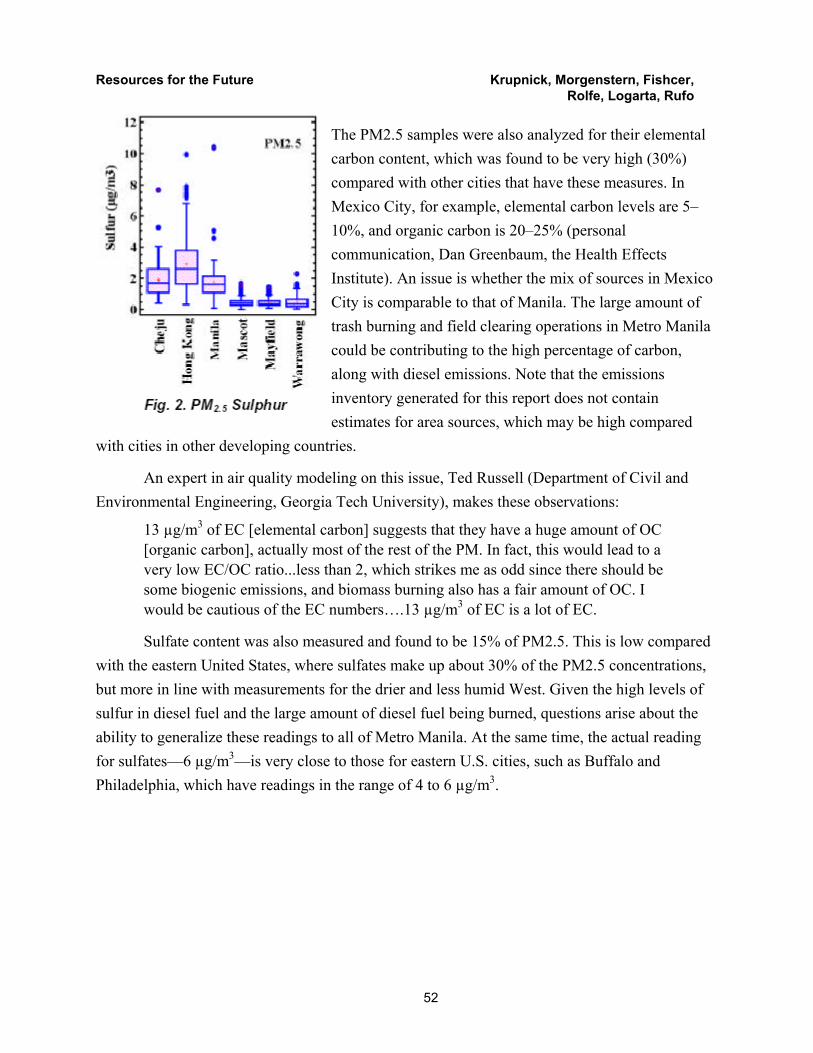
Resources for the Future Krupnick, Morgenstern, Fishcer, Rolfe, Logarta, Rufo
The PM2.5 samples were also analyzed for their elemental carbon content, which was found to be very high (30%) compared with other cities that have these measures. In Mexico City, for example, elemental carbon levels are 5–10%, and organic carbon is 20–25% (personal communication, Dan Greenbaum, the Health Effects Institute). An issue is whether the mix of sources in Mexico City is comparable to that of Manila. The large amount of trash burning and field clearing operations in Metro Manila could be contributing to the high percentage of carbon, along with diesel emissions. Note that the emissions inventory generated for this report does not contain estimates for area sources, which may be high compared
with cities in other developing countries.
An expert in air quality modeling on this issue, Ted Russell (Department of Civil and Environmental Engineering, Georgia Tech University), makes these observations:
13 µg/m3 of EC [elemental carbon] suggests that they have a huge amount of OC [organic carbon], actually most of the rest of the PM. In fact, this would lead to a very low EC/OC ratio...less than 2, which strikes me as odd since there should be some biogenic emissions, and biomass burning also has a fair amount of OC. I would be cautious of the EC numbers….13 µg/m3 of EC is a lot of EC.
Sulfate content was also measured and found to be 15% of PM2.5. This is low compared with the eastern United States, where sulfates make up about 30% of the PM2.5 concentrations, but more in line with measurements for the drier and less humid West. Given the high levels of sulfur in diesel fuel and the large amount of diesel fuel being burned, questions arise about the ability to generalize these readings to all of Metro Manila. At the same time, the actual reading for sulfates—6 µg/m3—is very close to those for eastern U.S. cities, such as Buffalo and Philadelphia, which have readings in the range of 4 to 6 µg/m3.
52

Resources for the Future Krupnick, Morgenstern, Fishcer, Rolfe, Logarta, Rufo
Table A.2. Annual Average Concentrations in Manila and Hong Kong, 2001
City PM2.5 Elemental Carbon Content of
PM2.5
Sulfate Ion
Content of PM2.5
Manila 45 µg/m3 13 µg/m3 30% 6 µg/m3 15% Hong Kong 30 µg/m3 2 µg/m3 5% 9 µg/m3 30%
Source: ANSTO Physics Aerosol Sampling Program Newsletter, Number 26, January 2002.
Sulfur Oxides
Sulfur dioxide has been measured occasionally at various sites in Metro Manila. Rolfe (2002) reports that it has never been more than a very localized air quality problem in the area. Recent monitoring (1995–2001) near the now-mothballed Sucat power station showed the expected decrease in pollutant concentrations5 as its closure progressed. This repeats what happened in the 1980s with the shutdown of the Rockwell power station in Makati and, in the early 1990s, the shutdown of the Manila power station, on an island in the Pasig River. The only remaining major point sources of sulfur dioxide within the Metro Manila airshed are the three oil refineries.
Nevertheless, the sulfur content of diesel and other fuel oil remains extremely high by world standards. For instance, the sulfur content in diesel fuel is 2,000 ppm (slated to fall to 500 ppm by 2004). The more common levels internationally are 350 ppm or lower. This sulfur is oxidized in the burning process to SO2 and to particulate sulfates, and a fraction of the SO2 emitted as a gas converts to sulfates in the air. Thus, SO2 can be a concern even if concentrations are low.
The epidemiological evidence on SO2 concentrations and health is mixed. Studies in eastern Europe consistently find that SO2 effects are more serious than particulate effects,33 but the opposite conclusion is reached in most other urban areas. Sorting out these effects is
33 See, for example, the Air Pollution and Health, European Approach (APHEA) project of the European Commission.
53

Resources for the Future Krupnick, Morgenstern, Fishcer, Rolfe, Logarta, Rufo
complicated because of the SO2 conversion to sulfates (which are particulates) and the collinearity between SO2 and particulates.
Lead
The concentration of airborne lead, once a serious environmental concern in Metro Manila, is no longer an issue. Ambient measurements show the expected decrease since 1994, in line with the phaseout of lead in gasoline. The lead content of gasoline was lowered from 0.6 to 0.15 g per liter in April 1993, and unleaded gasoline became available in Metro Manila in February 1994. Through the use of a market-based instrument—a “lead tax” that made the pump price of unleaded gasoline about 5% lower than the price of the leaded product—demand for the cleaner fuel increased rapidly. Complete phaseout of lead was achieved in Metro Manila in 1996 and throughout the whole country in January 2001.
Carbon Monoxide
Even though there are many motor vehicles in Metro Manila, and about 60% of those are gasoline fueled, very little monitoring for carbon monoxide has been carried out in the area. A few months of monitoring at two sites in 1991–92, under an Asian Development Bank project34, found eight-hour concentrations frequently in excess of the Philippine air quality guideline of 10 µg/m3. The one-hour average guideline (35 µg/m3) was not exceeded. More recent monitoring, in July–November 1999, at the Ateneo site (institutional) found similar concentrations. Ateneo is not a congested inner-city location, however, and it is highly likely, given the limited use of catalytic converters on gasoline vehicles, that carbon monoxide concentrations exceed air quality guidelines in many parts of Metro Manila. We recommend that monitoring for CO, which is quite common in cities around the world, be initiated in Metro Manila.
Nitrogen Oxides
Nitrogen dioxide has been monitored at Ateneo since September 2001. Data up to April 2002 have been analyzed, and the Philippine 24-hour average air quality guideline (150 µg/m3) has been exceeded at least once for four of those eight months. The significance of these exceedences is hard to judge, as the data come from only one site that may not be representative of the region. Also, NO2 has been shown to be a weak oxidant, much weaker than ozone, which
34 TA No. 1414-PHI: Study on vehicular emission control planning in Metro Manila, 1991–1992.
54

Resources for the Future Krupnick, Morgenstern, Fishcer, Rolfe, Logarta, Rufo
is associated with health effects that are less frequent and serious than those of particulates. The conversion of NOx to ozone in the presence of VOCs and sunlight is usually the concern.
Volatile Organic Compounds and Other Hazardous Air Pollutants
Monitoring for volatile organic compounds and other hazardous air pollutants in Metro Manila appears not to exist. The high aromatics (45%) and benzene content (4%) of gasoline, plus the limited use of catalytic converters on gasoline vehicles, suggest that benzene concentrations in the Metro Manila airshed may be quite high. Similarly, the high olefins content of petrol is likely to produce significant exhaust emissions of 1,3-butadiene. Another group of hazardous air pollutants likely to be in high concentrations are polycyclic aromatic hydrocarbons, from diesel combustion.
Ambient Ozone
Ozone is being measured at the Ateneo site. Data for September 2001–April 2002 found the Philippine one-hour average air quality guideline (140 µg/m3) exceeded at least once a month for seven of those eight months.35 Again, the significance of the data is hard to judge, since they come from one site that may not be representative of the region. Also, ozone is associated with health effects that are less frequent and serious than those of particulates. More monitoring for this pollutant is recommended.
Greenhouse Gases
The Philippine emissions of greenhouse gases are pretty much what would be expected from a country with a large transportation sector, considerable agricultural production, and limited industry. According to Rolfe (2002), energy accounts for 50% of the total greenhouse gas emissions, agriculture 33%, industry 10%, and waste 7%. Those are carbon dioxide equivalents; the breakdown for the individual gases is 55% carbon dioxide, 31% methane, and 14% nitrous oxide.
35 Unpublished monitoring reports of the Manila Observatory, Ateneo de Manila University.
55

Resources for the Future Krupnick, Morgenstern, Fishcer, Rolfe, Logarta, Rufo
Stationary Source Emissions Control Options
Table A.3. Cost of Shifting from Coal to Cleaner Fuel
Pollution Control
Efficiency
Switch from 2–3% Sulfur Coal to… PM SO2
Estimated Cost per Ton Coal
Expected Cost per Ton PM or SO2
Removed Reference
a) Low-sulfur coal 40%
Larssen et al. 1997
b) Low-grade fuel oil
- use of grade 5 70% Larssen et al. 1997
- use of grade 4 80% Larssen et al. 1997
c) Clean coal - Physical 30–60%
lower 10– 40%
$1–5 $122 (PM) $695 (SO2)
Brandon and Ramankutty 1993
* Coarse Fraction fly ash $2–3 Oskarsson et al. 1997
* Fine fraction $3–10 Oskarsson et al. 1997
- Advanced 70% lower fly ash
30–70% $6–20 $340 (PM) $1673 (SO2)
Brandon and Ramankutty 1993
$15–30 Oskarsson et al. 1997
- Sorbent injection 30–60% $170 (SO2) Brandon and Ramankutty 1993
- Coal beneficiation 5–40% additional 2% cost of generation
$800–1,200 (SO2) Brandon and Ramankutty 1993
56

Resources for the Future Krupnick, Morgenstern, Fishcer, Rolfe, Logarta, Rufo
Table A.4. Postcombustion Control Technologies and Costs
Costs Removal
Efficiency (%)
300MW Power Plant
Emissions Removal (Tons)
Abatement Cost per Ton Reduced
($) End-of-Pipe Control Technology
PM SOx
Capital Operation and Maintenance Annualized
PM SOx PM SOx
Electrostatic precipitator 95% $50–100/kW $15–40
mills/kWh $8,808,750 184,813 0 48
Mechanical collectors 90% P2–3.2M/MW P0.01/kWh $2,421,000 175,086 14
Bag filters 99.9% None $50–75/kW $18–20 mills/kWh $6,278,625 194,345 32
Atmospheric fluidized-bed combustion None 70–95% $500–1,000/kW $28,687,500 50,823 564
- with bag filter 95% 70–95% $1,400/kW $11 mills/kWh $55,925,987 184,813 50,823 303 1,100
Flue-gas desulfurization
70–95% $150–270/kW $.5–3.3 mills/kWh $18,832,498 50,823 371
- Furnace sorbent injection, duct injection, dry scrubbers
30 to 70%
- Wet scrubber/wet flue gas 80–99% $160–240/kWe Variable: $14,453,998 55,136 262
desulfurization $0.15–0.20/kWh
Fixed: $.14/kWh
- Wet scrubbers 90%
- Limestone process 95% P628–3,393M (in 1990 prices)
P110.6–654.9 M/yr $20,960,018 58,524 358
- Semidry 90% P542–3,148M (in 1990 prices)
P106–788.1 M/yr $19,510,178 55,444 352
- Seawater 95% P505–924M (in 1990 prices) P85.7–168 M/yr $19,630,758 58,524 335
- Spray dryers 70 to 90% $140–210/kW $2.1–3.2
mills/kWh $20,365,107 49,283 413
- Dry sorbent Injection 25–40% P143–183 M P36.3–53.2 $2,149,466 20,021 107
57

Resources for the Future Krupnick, Morgenstern, Fishcer, Rolfe, Logarta, Rufo
(in 1990 prices) M/yr - Sorbent injection None 30–60% $70–100/kW
30–70% $75–100/kW Fixed: $6/kW/yr Variable: $0.3/kWh
$11,626,874 30,802 377
Sources: Brandon and Ramankutty (1993), Oskarsson et al. (1997), Larssen et al. (1997), Tavoulareas and Charpentier (1995), Sinclair et al. (1998), COLENCO (1993), Energy Information Agency, in Orbeta et al (2000a).
Mobile Source Emissions Control Options
Table A.5. Selected Estimates of Cost-Effectiveness of PM Control Measures
Technology Fixed Costs Variable Costs
Total Cost: PDV
Lifetime PM Reduction
(per Year)
Cost-Effectiveness (Cost per Ton
Reduced)
Smoke belching program
$4 per year inspection per jeepney
Maintenance costs; cost-effectiveness included?
$80,000 2,000t PM10 $40
Lowering sulfur in diesel from 0.7 to 0.2 ppm
? ? $6–10 million
1,200t PM10 $5,000–8,350
Inspection and main.tenance
? ? $5.5 mil 4,000t PM10 $1,375
Jeepney switch to gasoline
$300 Save $120 in maintenance; increased costs of gasoline (7 cents/liter) = .15l/km*50,000 km * 7 cents = $525
$445/yr is assumed; 10-year life
Virtual elimination of PM = 40 kg
$11,000
Cleaner fuel oil ? ? $10–20 million
5,000t $2,000–4,000
Cleaner fuel at power plants
? ? $10 million 500t $20,000
Source: URBAIR.
58

Resources for the Future Krupnick, Morgenstern, Fishcer, Rolfe, Logarta, Rufo
Administrative Costs
Table A.6. Estimated Costs of Administering Current Programs of Air Quality Management
Personnel
Number in Region Licencing and Permiting Unit
NCR III IV Salary Grade Year Salary
Unit Head 1 1 1 22 P263,263 Permit Reviewer 1 1 1 18 218,933 Permit Writers 1/ 2 3 5 15 196,274 Administrative Assistant 2 2 2 14 176,098 Laboratory Analysis Unit Laboratory Analyst 5 5 5 18 218,933 Laboratory Technician 1 1 1 14 176,098 Store Keeper 1 1 1 11 149,955
Management Information System NCR III IV
Unit Head 1 1 1 22 263,263 Information Specialist 1 1 1 18 218,933 Encoder 2 2 2 11 149,955 Accounting Unit Account Reviewer 1 1 1 18 218,933 Bookkeeper 1 1 1 14 176,098 Encoder 1 1 1 11 149,955 Subtotal P2,576,691
Equipment and Physical Resources
Units in Region
NCR III IV Unit Cost Total Cost
Stack Sampler 2 3 5 P2,000,000 P20,000,0003-Gas Sampler 2 3 5 500,000 5,000,000 High-Volume Sampler 2 3 5 750,000 7,500,000 PM-10 Sampler 2 3 5 500,000 5,000,000 Field NOX Analyzer 2 3 5 500,000 5,000,000 Vehicle 1 2 2 800,000 4,000,000
59
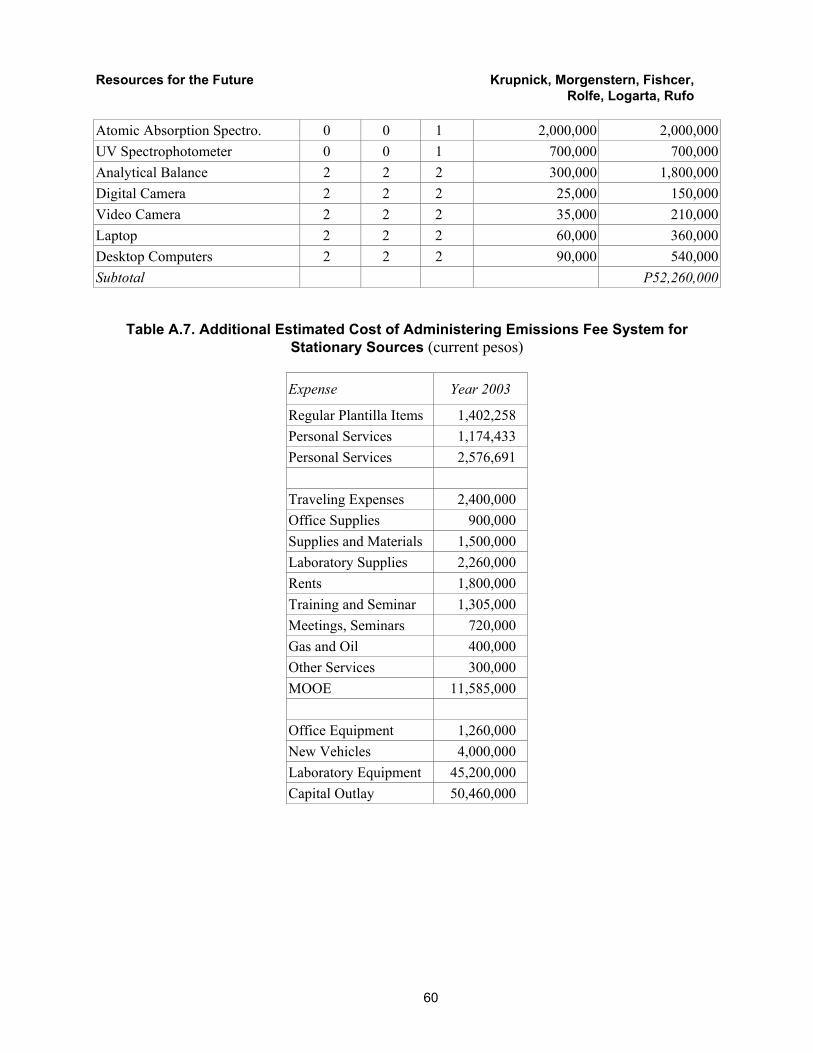
Resources for the Future Krupnick, Morgenstern, Fishcer, Rolfe, Logarta, Rufo
Atomic Absorption Spectro. 0 0 1 2,000,000 2,000,000 UV Spectrophotometer 0 0 1 700,000 700,000 Analytical Balance 2 2 2 300,000 1,800,000 Digital Camera 2 2 2 25,000 150,000 Video Camera 2 2 2 35,000 210,000 Laptop 2 2 2 60,000 360,000 Desktop Computers 2 2 2 90,000 540,000 Subtotal P52,260,000
Table A.7. Additional Estimated Cost of Administering Emissions Fee System for
Stationary Sources (current pesos)
Expense Year 2003
Regular Plantilla Items 1,402,258 Personal Services 1,174,433 Personal Services 2,576,691 Traveling Expenses 2,400,000 Office Supplies 900,000 Supplies and Materials 1,500,000 Laboratory Supplies 2,260,000 Rents 1,800,000 Training and Seminar 1,305,000 Meetings, Seminars 720,000 Gas and Oil 400,000 Other Services 300,000 MOOE 11,585,000 Office Equipment 1,260,000 New Vehicles 4,000,000 Laboratory Equipment 45,200,000 Capital Outlay 50,460,000
60
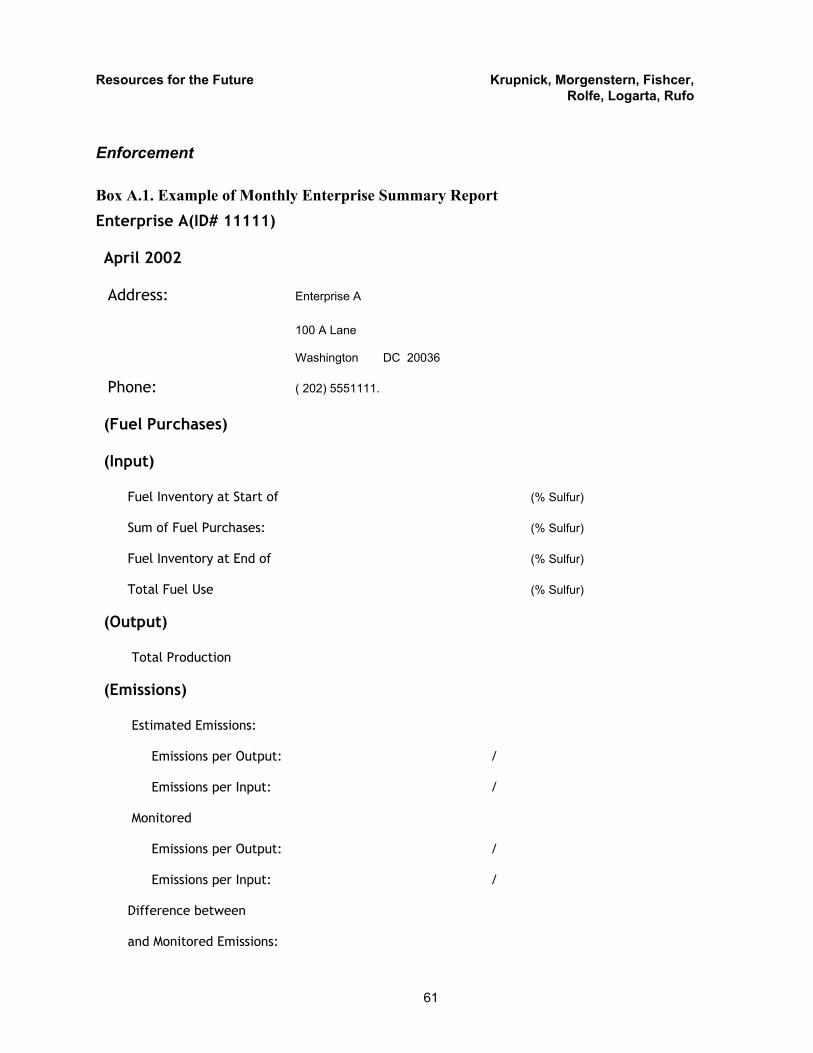
Resources for the Future Krupnick, Morgenstern, Fishcer, Rolfe, Logarta, Rufo
Enforcement
Box A.1. Example of Monthly Enterprise Summary Report Enterprise A(ID# 11111)
April 2002
Address: Enterprise A 100 A Lane
Washington DC 20036
Phone: ( 202) 5551111.
(Fuel Purchases)
(Input)
Fuel Inventory at Start of (% Sulfur) Sum of Fuel Purchases: (% Sulfur) Fuel Inventory at End of (% Sulfur) Total Fuel Use (% Sulfur)
(Output)
Total Production
(Emissions)
Estimated Emissions:
Emissions per Output: /
Emissions per Input: /
Monitored
Emissions per Output: /
Emissions per Input: /
Difference between
and Monitored Emissions:
61