polariton-polariton interaction constants m. vladimirova s. cronenberger d. scalbert a. miard, a....
TRANSCRIPT

Polariton-polariton interaction constants
M. Vladimirova S. CronenbergerD. Scalbert
A. Miard, A. LemaîtreJ. Bloch
A. V. Kavokin
K. V. Kavokin
G. MalpuechD. Solnyshkov
Groupe d’Etude des Semiconducteurs, CNRS, Montpellier, France
Physics and Astronomy School, University of Southampton, UK
Laboratoire de Photonique et de Nanostructures, CNRS, Marcoussis, France
A. F. Ioffe Institute, St-Petersburg, Russia
LASMEA, Clermont-Ferrand, France

Energy
Polariton nonlinearities
•Interaction between excitons ↔ energy shift
•Phase space filling
C XR
Energy
Transmission
UPB
LPB
R
UPB
LPB
k
Excitonic component is responsible for polariton non-linear effects
R
R
EX
C CXR
Energy renormalization vs
saturation
Energy shift Saturation
•LPB and UPB are expected to shift in the same or in the opposite direction, depending on the mechanism of the non-linearity
•Experimentally : energy shift appears well before saturation
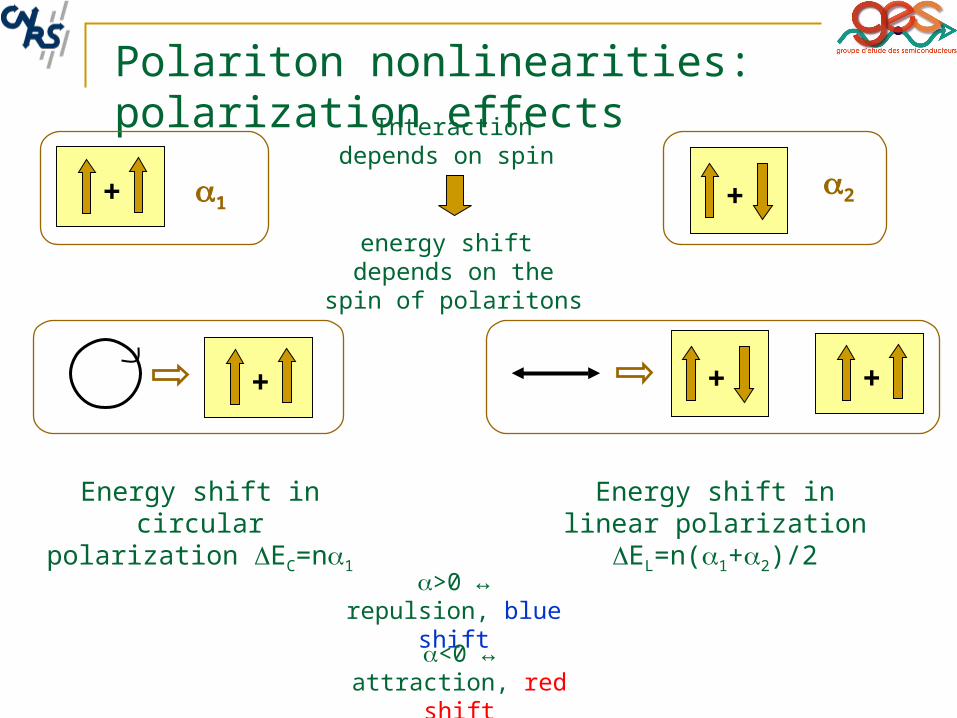
Polariton nonlinearities: polarization effects
Energy shift in linear polarization EL=n(1+2)/2
Interaction depends on spin
energy shift depends on the spin of polaritons
Energy shift in circular polarization EC=n1
>0 ↔ repulsion, blue shift
<0 ↔ attraction, red shift
+ 1 + 2
+ + +

Polariton energy shift from transmission experiments
100 fs Spectral filtering
sample
f
demolulation
10 meV25 meV
Babinet-Soleil
compensator
spectrometer+PM
1 ps
chopper
1.470 1.475 1.480Tra
nsm
issi
on
(a
rb. u
nits
)
Energy (eV)1.465 1.470 1.475 1.480T
ran
smis
sio
n (
arb
. un
its)
Energy (eV)
depolarising fiber
We look for the power dependence of transmission in linear and circular polarizations
Or EOM
T
and/or
Tc-Tl
GaAs cavity, In0.5Ga0.95As QW,
GaAs/Ga0.9Al0.1As Bragg mirrors
23 pairs/29pairs R=3.5 meV
30 m spot

“Mixed” dichroism
~0 •Corcular polarisation spectrum is blue shifte with respect to circular polarization spectrum
•UPB : smaller effect, but blue shift
•LPB: MC is more transparent in circular polarization!
•UPB: the effect is inversed
“Mixed” dichroism at very low powers : P >15 W
1.472 1.474 1.476 1.478 1.480-0.4
0.0
0.4
Energy (eV)
"Mixed" dichroism
Transmission (arb. units)
(TC-T
L)/(T
C+T
L)
circular linear 200 W

“Mixed” dichroism : explanation
Question: Why at LPB the trasmission increases with power?Answer: Because of the exciton energy shift!
When exciton energy increases LPB acquire more photonic character and thus better transmitted through the sample
The situation is inversed at UPB
Any tiny shift of the exciton energy is accompanied by the modification of transmission
This is not the saturation of absorption!
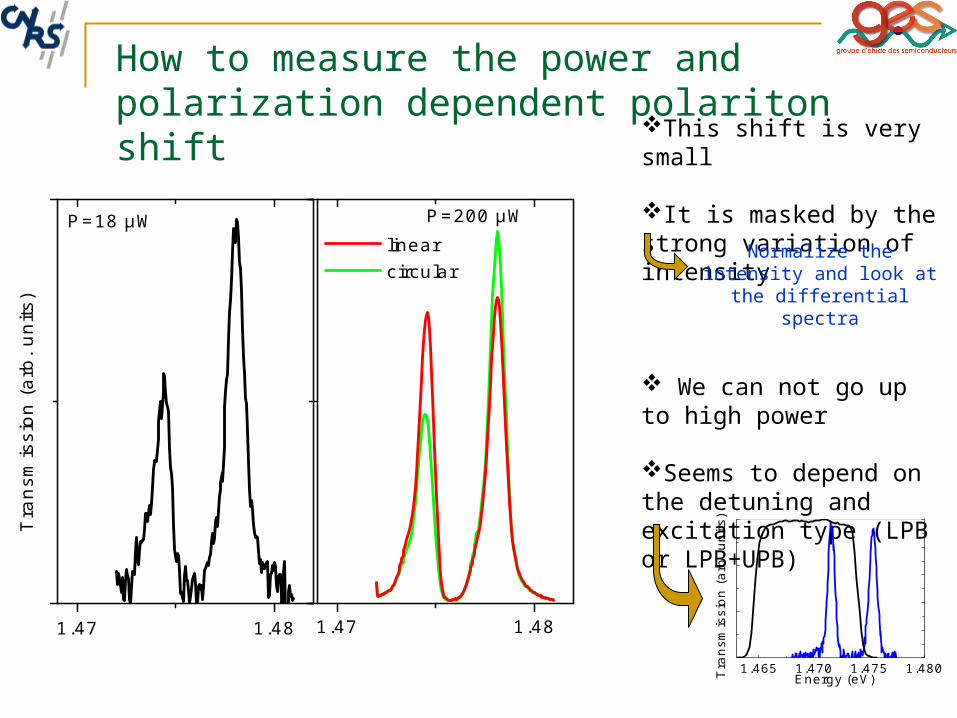
How to measure the power and polarization dependent polariton shift
1.47 1.481.47 1.48
P=200 µW
Tra
nsm
issi
on (
arb.
uni
ts)
P=18 µW
linear circular
This shift is very small
It is masked by the strong variation of intensity
We can not go up to high power
Seems to depend on the detuning and excitation type (LPB or LPB+UPB)
1.465 1.470 1.475 1.480Tra
nsm
issi
on (
arb.
uni
ts)
Energy (eV)
Normalize the intensity and look at the differential spectra
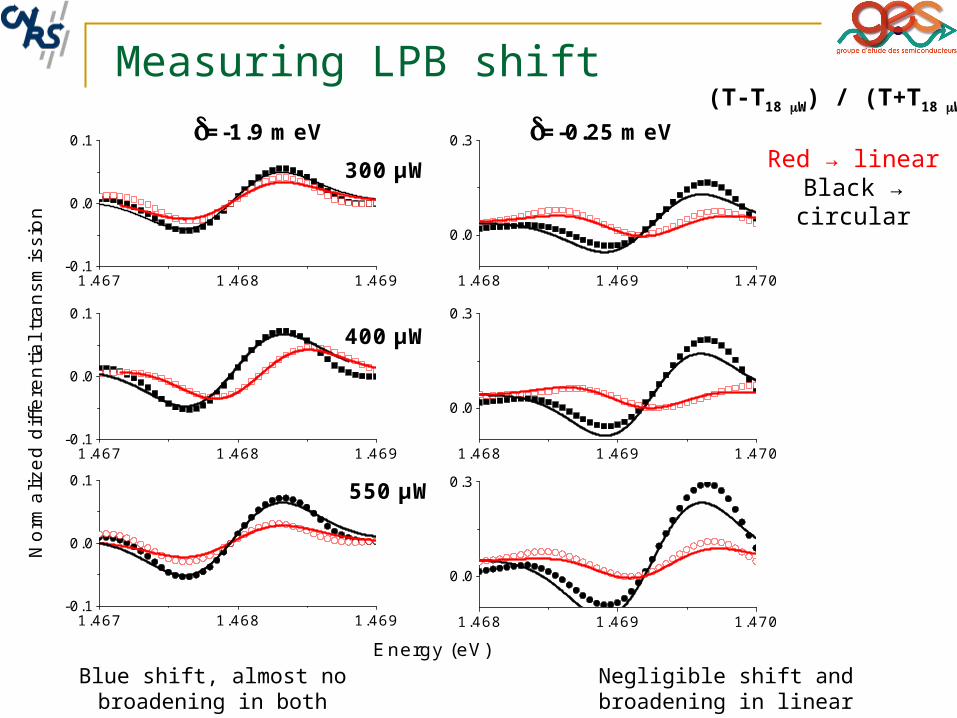
Measuring LPB shift
1.467 1.468 1.469-0.1
0.0
0.1
1.468 1.469 1.470
0.0
0.3
1.467 1.468 1.469-0.1
0.0
0.1
1.468 1.469 1.470
0.0
0.3
1.467 1.468 1.469-0.1
0.0
0.1
1.468 1.469 1.470
0.0
0.3 =-0.25 meV
300 µW
550 µW
400 µW
=-1.9 meV
Nor
mal
ized
diff
eren
tial t
rans
mis
sion
Energy (eV)Blue shift, almost no broadening in both
polarizationsNegligible shift and broadening in
linear polarization
Red → linear Black → circular
(T-T18 W) / (T+T18 W)

Ratio between interaction constants
Large dispersion=poor precision at zero and strong negative detunig
2 and 1 have different sign
|2| increases when detuning changes from negative to zero
-0.05
0.00
0.05
0.10
-3 -2 -1 0 1
-1
0
1
550 µW400 µW L L L C C C
Sh
ift (
me
V)
300 µW
P=0.3 mWP=0.4 mW P=0.55 mW
2/1
Detuning (meV)
Red → linear Black → circular
EL=n(1+2)/2
EC=n1

Tentative explanation
Different contribution to the interaction constants 1 (↑ ↑) and 2 (↑ ↓)
Spin independent contributions:
1) Mean field electrostatic energy (Repulsion)
2) Van-der-Waals (dipole-dipole) interaction (Attraction)
Spin dependent contributions:
1) Exchange interaction (Repulsion for ↑ ↑ and Attraction for ↑ ↓)
2) Bi-exciton state (Attraction) ↑ ↓
1n=UCoulomb+UVdW+Uex↑↑
2n=UCoulomb+UVdW+Uex↑↓+Ubi
-2 0
1472
1476 sp
bd
LPB 1s exciton 1s dark exciton 2p exciton bi-exciton
Ene
rgy
(meV
)
Detuning (meV)
be
EC=1n EL=(1+2)n

-2 0
1472
1476 sp
bd
LPB 1s exciton 1s dark exciton 2p exciton bi-exciton
En
erg
y (m
eV
)
Detuning (meV)
be
-0.1
0.0
En
erg
y sh
ift (
me
V)
UCoulomb
Ubi
Uex↑↓UVdW
Uex↑↑
2n = UCoulomb+UVdW + Uex↑↓ + Ubi
1n = UCoulomb+UVdW + Uex↑↑
calculated
Fit of ECmeasured
Fit of
-0.05
0.00
0.05
0.10
-3 -2 -1 0 1
-1
0
1
550 µW400 µW L L L C C C
Sh
ift (
me
V)
300 µW
P=0.3 mWP=0.4 mW P=0.55 mW
2/1
Detuning (meV)

Conclusions The question remains open,
whether only 2 polariton interaction constants are sufficient. Experiment aswers YES and theory NO.
0 200 4000.0
0.1
0.2
Shi
ft (m
eV)
Power (W)
C
L
If |2|~|1| and 2<0 this can have important
implications
-1 0 1-1
0
1
I
collapseBEC
BEC
2 (
arb.
uni
ts)
1 (arb. units)
BEC
collapse
I
II
III IV
I. A. Shelykh et al, SST (2010)