polariton assisted photoemission from a layered molecular
TRANSCRIPT
Nanoscale
PAPER
Cite this: Nanoscale, 2021, 13, 14497
Received 16th June 2021,Accepted 7th August 2021
DOI: 10.1039/d1nr03913j
rsc.li/nanoscale
Polariton assisted photoemission from a layeredmolecular material: role of vibrational states andmolecular absorption†
Adarsh B. Vasista, *‡ Kishan S. Menghrajani and William L. Barnes*
The way molecules absorb, transfer, and emit light can be modified by coupling them to optical cavities.
The extent of the modification is often defined by the cavity–molecule coupling strength, which depends
on the number of coupled molecules. We experimentally and numerically study the evolution of photo-
emission from a thin layered J-aggregated molecular material strongly coupled to a Fabry–Perot micro-
cavity as a function of the number of coupled layers. We unveil an important difference between the
strong coupling signatures obtained from reflection spectroscopy and from polariton assisted photo-
luminescence. We also study the effect of the vibrational modes supported by the molecular material on
the polariton assisted emission both for a focused laser beam and for normally incident excitation, for
two different excitation wavelengths: a laser in resonance with the lower polariton branch, and a laser not
in resonance. We found that Raman scattered photons appear to play an important role in populating the
lower polariton branch, especially when the system was excited with a laser in resonance with the lower
polariton branch. We also found that the polariton assisted photoemission depends on the extent of
modification of the molecular absorption induced by the molecule–cavity coupling.
1. Introduction
Controlling photoemission from molecular materials has wideimplications in designing display devices,1–3 sensors,4,5 andlight emitting diodes.6–8 Various mechanisms have been uti-lized to modify the photophysics of materials for example bydoping9,10 and preparation of heterojunctions.11,12 Recentlyoptical control of photoluminescence by coupling a molecularmaterial to optical cavities has gained prominence.13 Theextent of the modification of the photophysics then dependsupon the coupling strength between the cavity and thematerial.14 If the coupling strength between the molecularmaterial and the cavity is less than the losses in the system,then the coupled system is said to be in the weak couplingregime. Here, one can alter the radiative relaxation rate15 andthe directionality of emission.16,17 If the coupling strength ismore than the losses, then we enter into strong couplingregime where one drastically modifies the energy landscape ofthe molecular material–cavity system.
Strong molecule–cavity coupling has been shown to modifyvarious physical processes such as energy transfer,18 tripletstate dynamics,19 photo-oxidation,20 and lasing.21 Due tothe drastic modification of molecular energy levels, strongcoupling provides a unique way to control photoemissionfrom molecular materials. Various studies have been doneto understand photoluminescence (PL) from J-aggregatedmolecules,22–25 layered dichalcogenides,26 and Carbon nano-tubes.27 However, the relationship between molecular absorp-tion and PL in the strong coupling regime has not been exten-sively studied. Further, most studies have focused on the be-havior of PL produced by non-resonant excitation,22–24 thereare very few reports on probing PL by resonantly pumping thelower polariton branch.28,29 A comprehensive understandingof the evolution of PL as a function of excitation mechanismand the modification of molecular absorption seems to belacking in the literature. This fundamental knowledge gap haswide implications in designing polariton mediated light-emit-ting devices.
Strong light–matter coupling is often probed using reflec-tion, transmission, or scattering spectroscopy.30–32 It has beenshown that the signature of strong coupling depends in a criti-cal way on the method of probing the system,33 and indeedaberrations due to a high numerical aperture may be misrepre-sented as strong coupling signatures.34 Hence, it is very impor-tant to corroborate the PL from strongly coupled system with
†Electronic supplementary information (ESI) available. See DOI: 10.1039/D1NR03913J‡Present address: Nanophotonic Systems Laboratory, ETH Zurich.
Department of Physics and Astronomy, University of Exeter, UK.
E-mail: [email protected], [email protected]
This journal is © The Royal Society of Chemistry 2021 Nanoscale, 2021, 13, 14497–14505 | 14497
Ope
n A
cces
s A
rtic
le. P
ublis
hed
on 1
3 A
ugus
t 202
1. D
ownl
oade
d on
11/
24/2
021
12:2
0:34
PM
. T
his
artic
le is
lice
nsed
und
er a
Cre
ativ
e C
omm
ons
Attr
ibut
ion-
Non
Com
mer
cial
3.0
Unp
orte
d L
icen
ce.
View Article OnlineView Journal | View Issue
reflection/transmission signatures from the same system. Inaddition PL is a two step process-absorption followed by relax-ation. Hence PL from a coupled system will also depend onthe extent of modification induced in the absorption spectrumof the material.
With this motivation we study PL signatures from layers ofJ-aggregated 5,5′,6,6′-tetrachloro-1,1′-diethyl-3,3′-di(4-sulfo-butyl)-benzimidazolocarbocyanine (TDBC) dye molecules pre-pared using a layer-by-layer process coupled to a Fabry–Perotmicrocavity. Such layered J-aggregates have shown to possesslarge oscillator strength,35 high absorption,36 and highquantum yield37 making them an ideal system to study photo-emission. We systematically study, using a custom builtFourier microscope, the evolution of PL by increasing thenumber of layers of dye molecules and the cavity detuning. Inaddition we also study the effect of excitation wavevector andenergy on the PL emission from such a layered molecularmaterial.
We unveil an important difference between absorption ofthe hybrid microcavity–molecule system and the energy dissi-pation inside the molecular material, and we discuss theimplications for control of molecular PL. We also extend ourunderstanding of the role of the vibrational modes of themolecules in polariton assisted PL by exciting the hybridsystem with a laser in resonance with the lower polaritonbranch. The experimental results were analysed using a simplecoupled oscillator model and we performed finite elementmethod (FEM) based numerical modelling to understand thesystem better.
2. Results and discussion
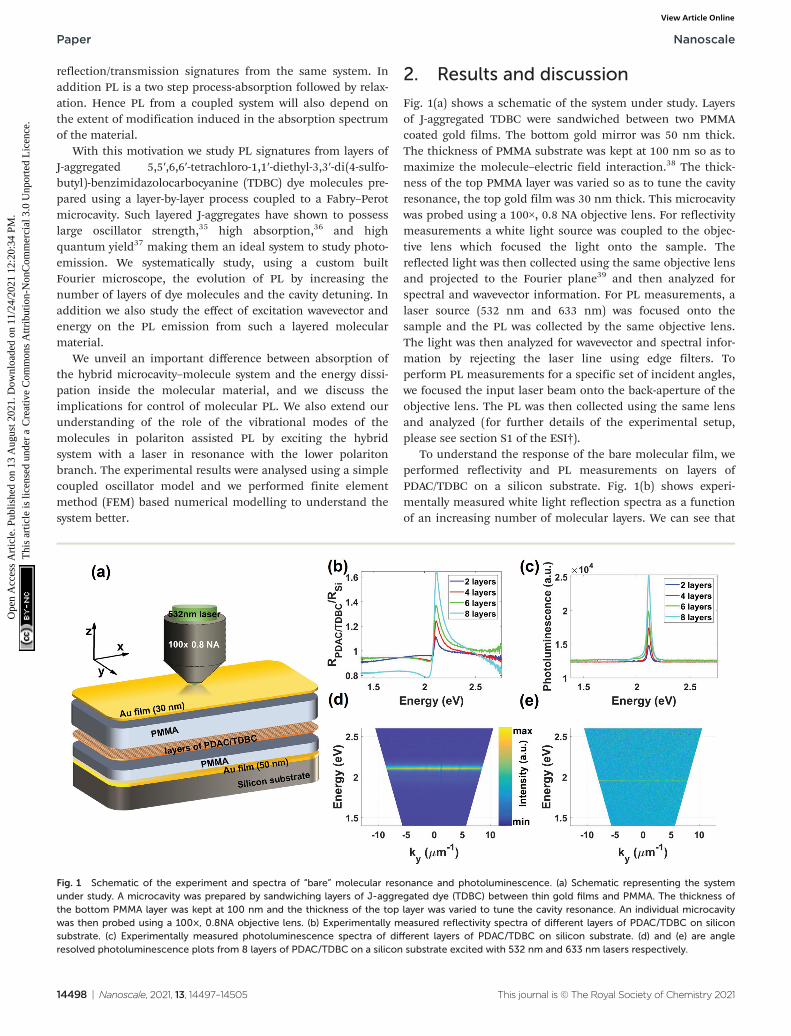
Fig. 1(a) shows a schematic of the system under study. Layersof J-aggregated TDBC were sandwiched between two PMMAcoated gold films. The bottom gold mirror was 50 nm thick.The thickness of PMMA substrate was kept at 100 nm so as tomaximize the molecule–electric field interaction.38 The thick-ness of the top PMMA layer was varied so as to tune the cavityresonance, the top gold film was 30 nm thick. This microcavitywas probed using a 100×, 0.8 NA objective lens. For reflectivitymeasurements a white light source was coupled to the objec-tive lens which focused the light onto the sample. Thereflected light was then collected using the same objective lensand projected to the Fourier plane39 and then analyzed forspectral and wavevector information. For PL measurements, alaser source (532 nm and 633 nm) was focused onto thesample and the PL was collected by the same objective lens.The light was then analyzed for wavevector and spectral infor-mation by rejecting the laser line using edge filters. Toperform PL measurements for a specific set of incident angles,we focused the input laser beam onto the back-aperture of theobjective lens. The PL was then collected using the same lensand analyzed (for further details of the experimental setup,please see section S1 of the ESI†).
To understand the response of the bare molecular film, weperformed reflectivity and PL measurements on layers ofPDAC/TDBC on a silicon substrate. Fig. 1(b) shows experi-mentally measured white light reflection spectra as a functionof an increasing number of molecular layers. We can see that
Fig. 1 Schematic of the experiment and spectra of “bare” molecular resonance and photoluminescence. (a) Schematic representing the systemunder study. A microcavity was prepared by sandwiching layers of J-aggregated dye (TDBC) between thin gold films and PMMA. The thickness ofthe bottom PMMA layer was kept at 100 nm and the thickness of the top layer was varied to tune the cavity resonance. An individual microcavitywas then probed using a 100×, 0.8NA objective lens. (b) Experimentally measured reflectivity spectra of different layers of PDAC/TDBC on siliconsubstrate. (c) Experimentally measured photoluminescence spectra of different layers of PDAC/TDBC on silicon substrate. (d) and (e) are angleresolved photoluminescence plots from 8 layers of PDAC/TDBC on a silicon substrate excited with 532 nm and 633 nm lasers respectively.
Paper Nanoscale
14498 | Nanoscale, 2021, 13, 14497–14505 This journal is © The Royal Society of Chemistry 2021
Ope
n A
cces
s A
rtic
le. P
ublis
hed
on 1
3 A
ugus
t 202
1. D
ownl
oade
d on
11/
24/2
021
12:2
0:34
PM
. T
his
artic
le is
lice
nsed
und
er a
Cre
ativ
e C
omm
ons
Attr
ibut
ion-
Non
Com
mer
cial
3.0
Unp
orte
d L
icen
ce.
View Article Online
the intensity of reflection near the molecular resonance (Emol)increases with the number of layers, as expected. Fig. 1(c)shows corresponding PL spectra collected by exciting thesystem with a 532 nm CW laser. The intensity of the PL emis-sion of the bare J-aggregated dye increases as a function of thenumber of PDAC/TDBC layers in keeping with the reflectivitydata. Fig. 1(d) and (e) show angle resolved dispersion plots ofPL collected from 8 layers of PDAC/TDBC coated on a baresilicon substrate. For 532 nm excitation (Eexc > Emol), we seeangle independent emission around 590 nm, this isJ-aggregate PDAC/TDBC PL. To study the response of thesystem at a lower energy, we excited it with 633 nm laser (Eexc <Emol) and the result is shown in Fig. 1(e). Since the energy ofexcitation now is lower than the molecular absorption of theJ-aggregated dye we see no emission from the system. Thefaint line around E = 1.96 eV is due to the scattered laser lineentering the spectrometer.
2.1. Effect of number of molecules (N) and detuning (Δ) onpolariton assisted PL
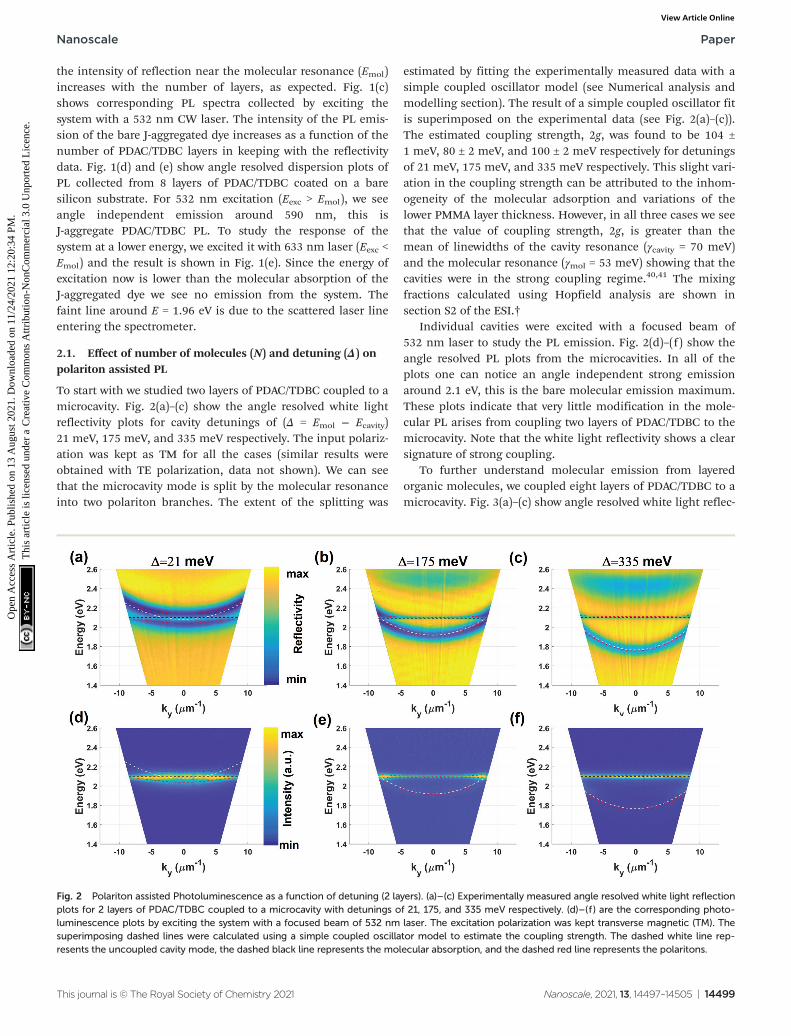
To start with we studied two layers of PDAC/TDBC coupled to amicrocavity. Fig. 2(a)–(c) show the angle resolved white lightreflectivity plots for cavity detunings of (Δ = Emol − Ecavity)21 meV, 175 meV, and 335 meV respectively. The input polariz-ation was kept as TM for all the cases (similar results wereobtained with TE polarization, data not shown). We can seethat the microcavity mode is split by the molecular resonanceinto two polariton branches. The extent of the splitting was
estimated by fitting the experimentally measured data with asimple coupled oscillator model (see Numerical analysis andmodelling section). The result of a simple coupled oscillator fitis superimposed on the experimental data (see Fig. 2(a)–(c)).The estimated coupling strength, 2g, was found to be 104 ±1 meV, 80 ± 2 meV, and 100 ± 2 meV respectively for detuningsof 21 meV, 175 meV, and 335 meV respectively. This slight vari-ation in the coupling strength can be attributed to the inhom-ogeneity of the molecular adsorption and variations of thelower PMMA layer thickness. However, in all three cases we seethat the value of coupling strength, 2g, is greater than themean of linewidths of the cavity resonance (γcavity = 70 meV)and the molecular resonance (γmol = 53 meV) showing that thecavities were in the strong coupling regime.40,41 The mixingfractions calculated using Hopfield analysis are shown insection S2 of the ESI.†
Individual cavities were excited with a focused beam of532 nm laser to study the PL emission. Fig. 2(d)–(f ) show theangle resolved PL plots from the microcavities. In all of theplots one can notice an angle independent strong emissionaround 2.1 eV, this is the bare molecular emission maximum.These plots indicate that very little modification in the mole-cular PL arises from coupling two layers of PDAC/TDBC to themicrocavity. Note that the white light reflectivity shows a clearsignature of strong coupling.
To further understand molecular emission from layeredorganic molecules, we coupled eight layers of PDAC/TDBC to amicrocavity. Fig. 3(a)–(c) show angle resolved white light reflec-
Fig. 2 Polariton assisted Photoluminescence as a function of detuning (2 layers). (a)–(c) Experimentally measured angle resolved white light reflectionplots for 2 layers of PDAC/TDBC coupled to a microcavity with detunings of 21, 175, and 335 meV respectively. (d)–(f ) are the corresponding photo-luminescence plots by exciting the system with a focused beam of 532 nm laser. The excitation polarization was kept transverse magnetic (TM). Thesuperimposing dashed lines were calculated using a simple coupled oscillator model to estimate the coupling strength. The dashed white line rep-resents the uncoupled cavity mode, the dashed black line represents the molecular absorption, and the dashed red line represents the polaritons.
Nanoscale Paper
This journal is © The Royal Society of Chemistry 2021 Nanoscale, 2021, 13, 14497–14505 | 14499
Ope
n A
cces
s A
rtic
le. P
ublis
hed
on 1
3 A
ugus
t 202
1. D
ownl
oade
d on
11/
24/2
021
12:2
0:34
PM
. T
his
artic
le is
lice
nsed
und
er a
Cre
ativ
e C
omm
ons
Attr
ibut
ion-
Non
Com
mer
cial
3.0
Unp
orte
d L
icen
ce.
View Article Online
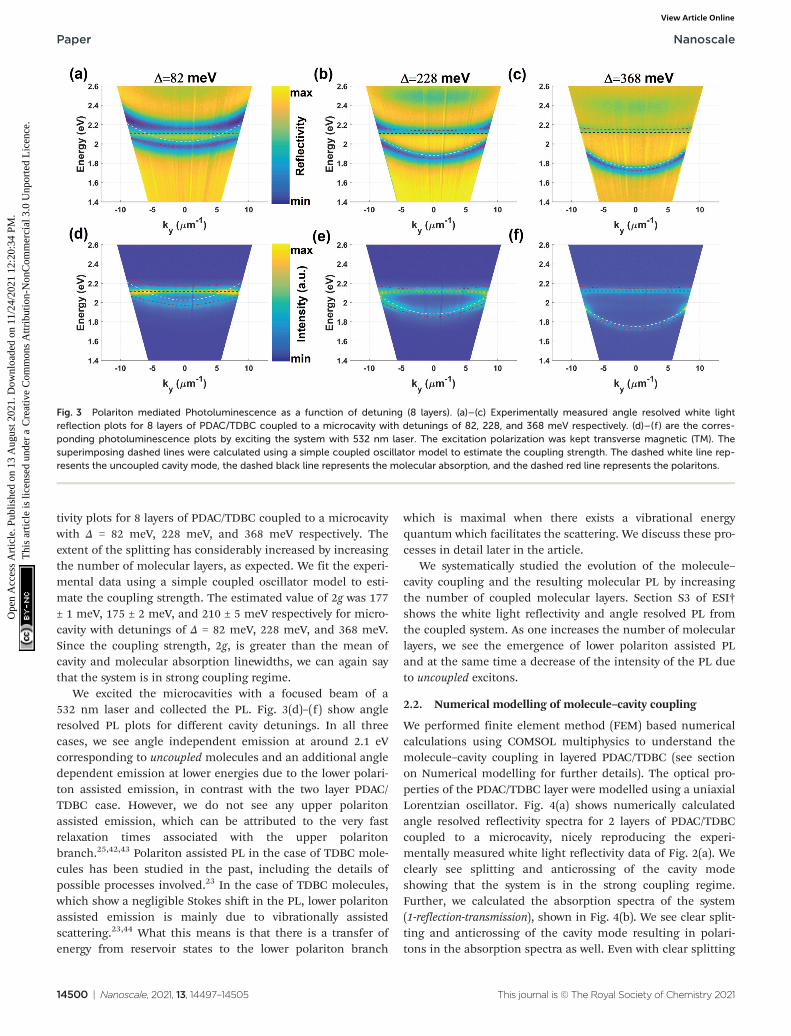
tivity plots for 8 layers of PDAC/TDBC coupled to a microcavitywith Δ = 82 meV, 228 meV, and 368 meV respectively. Theextent of the splitting has considerably increased by increasingthe number of molecular layers, as expected. We fit the experi-mental data using a simple coupled oscillator model to esti-mate the coupling strength. The estimated value of 2g was 177± 1 meV, 175 ± 2 meV, and 210 ± 5 meV respectively for micro-cavity with detunings of Δ = 82 meV, 228 meV, and 368 meV.Since the coupling strength, 2g, is greater than the mean ofcavity and molecular absorption linewidths, we can again saythat the system is in strong coupling regime.
We excited the microcavities with a focused beam of a532 nm laser and collected the PL. Fig. 3(d)–(f ) show angleresolved PL plots for different cavity detunings. In all threecases, we see angle independent emission at around 2.1 eVcorresponding to uncoupled molecules and an additional angledependent emission at lower energies due to the lower polari-ton assisted emission, in contrast with the two layer PDAC/TDBC case. However, we do not see any upper polaritonassisted emission, which can be attributed to the very fastrelaxation times associated with the upper polaritonbranch.25,42,43 Polariton assisted PL in the case of TDBC mole-cules has been studied in the past, including the details ofpossible processes involved.23 In the case of TDBC molecules,which show a negligible Stokes shift in the PL, lower polaritonassisted emission is mainly due to vibrationally assistedscattering.23,44 What this means is that there is a transfer ofenergy from reservoir states to the lower polariton branch
which is maximal when there exists a vibrational energyquantum which facilitates the scattering. We discuss these pro-cesses in detail later in the article.
We systematically studied the evolution of the molecule–cavity coupling and the resulting molecular PL by increasingthe number of coupled molecular layers. Section S3 of ESI†shows the white light reflectivity and angle resolved PL fromthe coupled system. As one increases the number of molecularlayers, we see the emergence of lower polariton assisted PLand at the same time a decrease of the intensity of the PL dueto uncoupled excitons.
2.2. Numerical modelling of molecule–cavity coupling
We performed finite element method (FEM) based numericalcalculations using COMSOL multiphysics to understand themolecule–cavity coupling in layered PDAC/TDBC (see sectionon Numerical modelling for further details). The optical pro-perties of the PDAC/TDBC layer were modelled using a uniaxialLorentzian oscillator. Fig. 4(a) shows numerically calculatedangle resolved reflectivity spectra for 2 layers of PDAC/TDBCcoupled to a microcavity, nicely reproducing the experi-mentally measured white light reflectivity data of Fig. 2(a). Weclearly see splitting and anticrossing of the cavity modeshowing that the system is in the strong coupling regime.Further, we calculated the absorption spectra of the system(1-reflection-transmission), shown in Fig. 4(b). We see clear split-ting and anticrossing of the cavity mode resulting in polari-tons in the absorption spectra as well. Even with clear splitting
Fig. 3 Polariton mediated Photoluminescence as a function of detuning (8 layers). (a)–(c) Experimentally measured angle resolved white lightreflection plots for 8 layers of PDAC/TDBC coupled to a microcavity with detunings of 82, 228, and 368 meV respectively. (d)–(f ) are the corres-ponding photoluminescence plots by exciting the system with 532 nm laser. The excitation polarization was kept transverse magnetic (TM). Thesuperimposing dashed lines were calculated using a simple coupled oscillator model to estimate the coupling strength. The dashed white line rep-resents the uncoupled cavity mode, the dashed black line represents the molecular absorption, and the dashed red line represents the polaritons.
Paper Nanoscale
14500 | Nanoscale, 2021, 13, 14497–14505 This journal is © The Royal Society of Chemistry 2021
Ope
n A
cces
s A
rtic
le. P
ublis
hed
on 1
3 A
ugus
t 202
1. D
ownl
oade
d on
11/
24/2
021
12:2
0:34
PM
. T
his
artic
le is
lice
nsed
und
er a
Cre
ativ
e C
omm
ons
Attr
ibut
ion-
Non
Com
mer
cial
3.0
Unp
orte
d L
icen
ce.
View Article Online
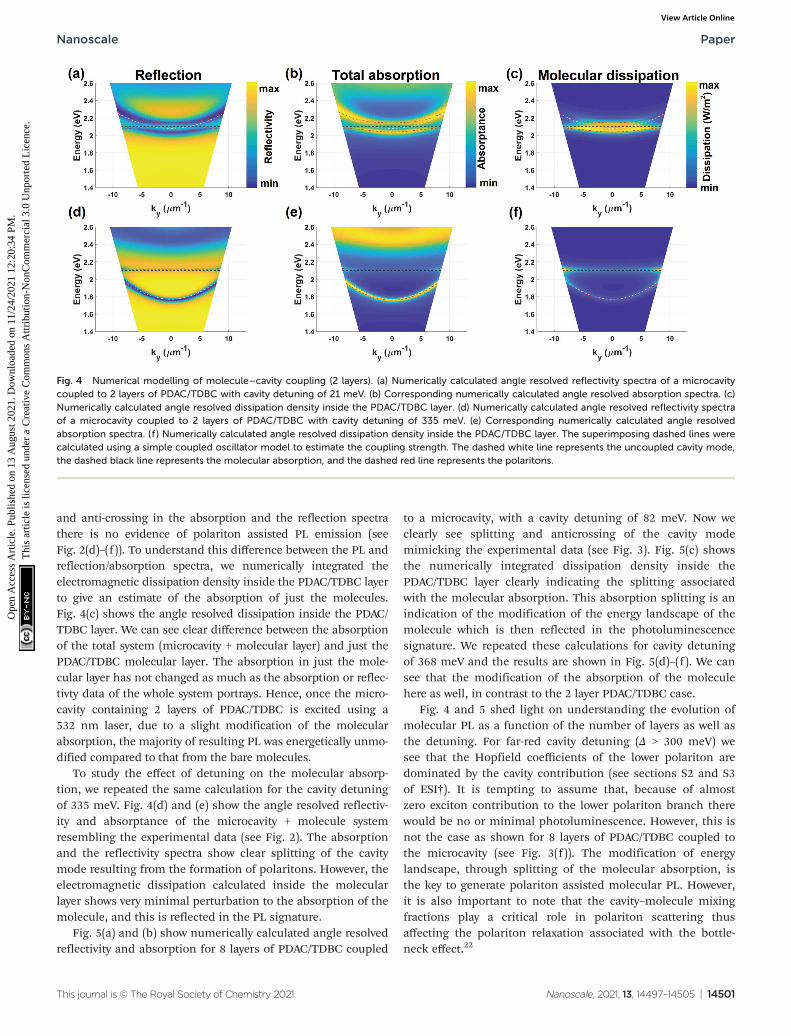
and anti-crossing in the absorption and the reflection spectrathere is no evidence of polariton assisted PL emission (seeFig. 2(d)–(f )). To understand this difference between the PL andreflection/absorption spectra, we numerically integrated theelectromagnetic dissipation density inside the PDAC/TDBC layerto give an estimate of the absorption of just the molecules.Fig. 4(c) shows the angle resolved dissipation inside the PDAC/TDBC layer. We can see clear difference between the absorptionof the total system (microcavity + molecular layer) and just thePDAC/TDBC molecular layer. The absorption in just the mole-cular layer has not changed as much as the absorption or reflec-tivty data of the whole system portrays. Hence, once the micro-cavity containing 2 layers of PDAC/TDBC is excited using a532 nm laser, due to a slight modification of the molecularabsorption, the majority of resulting PL was energetically unmo-dified compared to that from the bare molecules.
To study the effect of detuning on the molecular absorp-tion, we repeated the same calculation for the cavity detuningof 335 meV. Fig. 4(d) and (e) show the angle resolved reflectiv-ity and absorptance of the microcavity + molecule systemresembling the experimental data (see Fig. 2). The absorptionand the reflectivity spectra show clear splitting of the cavitymode resulting from the formation of polaritons. However, theelectromagnetic dissipation calculated inside the molecularlayer shows very minimal perturbation to the absorption of themolecule, and this is reflected in the PL signature.
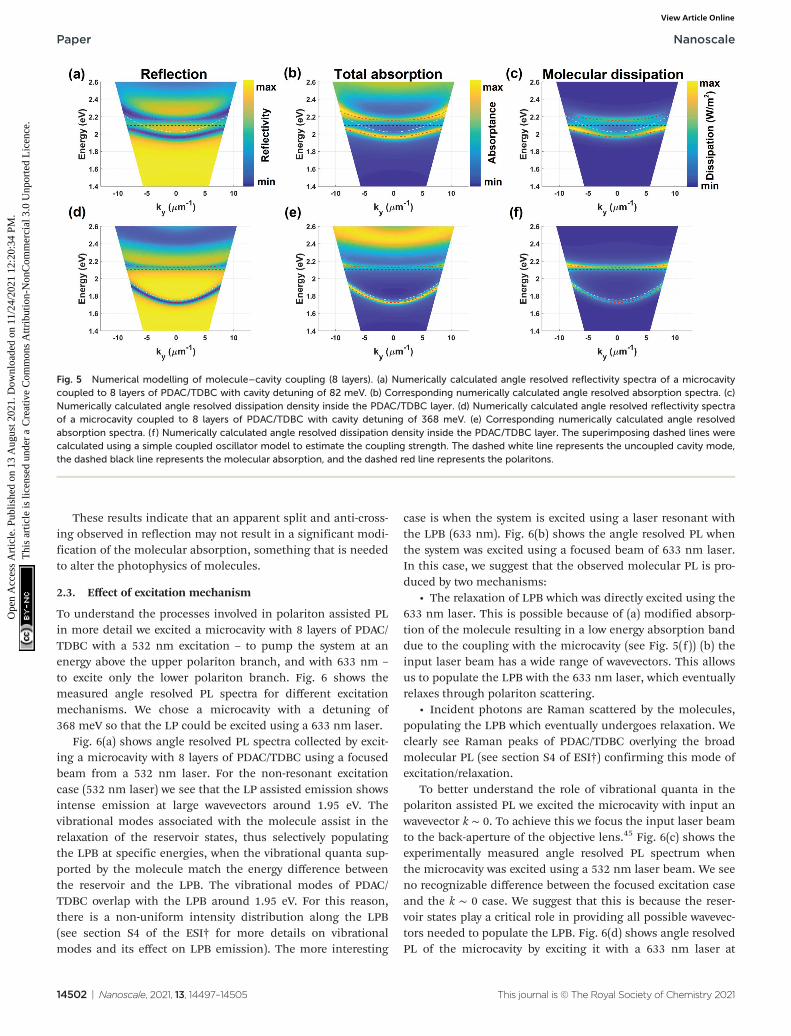
Fig. 5(a) and (b) show numerically calculated angle resolvedreflectivity and absorption for 8 layers of PDAC/TDBC coupled
to a microcavity, with a cavity detuning of 82 meV. Now weclearly see splitting and anticrossing of the cavity modemimicking the experimental data (see Fig. 3). Fig. 5(c) showsthe numerically integrated dissipation density inside thePDAC/TDBC layer clearly indicating the splitting associatedwith the molecular absorption. This absorption splitting is anindication of the modification of the energy landscape of themolecule which is then reflected in the photoluminescencesignature. We repeated these calculations for cavity detuningof 368 meV and the results are shown in Fig. 5(d)–(f ). We cansee that the modification of the absorption of the moleculehere as well, in contrast to the 2 layer PDAC/TDBC case.
Fig. 4 and 5 shed light on understanding the evolution ofmolecular PL as a function of the number of layers as well asthe detuning. For far-red cavity detuning (Δ > 300 meV) wesee that the Hopfield coefficients of the lower polariton aredominated by the cavity contribution (see sections S2 and S3of ESI†). It is tempting to assume that, because of almostzero exciton contribution to the lower polariton branch therewould be no or minimal photoluminescence. However, this isnot the case as shown for 8 layers of PDAC/TDBC coupled tothe microcavity (see Fig. 3(f )). The modification of energylandscape, through splitting of the molecular absorption, isthe key to generate polariton assisted molecular PL. However,it is also important to note that the cavity–molecule mixingfractions play a critical role in polariton scattering thusaffecting the polariton relaxation associated with the bottle-neck effect.22
Fig. 4 Numerical modelling of molecule–cavity coupling (2 layers). (a) Numerically calculated angle resolved reflectivity spectra of a microcavitycoupled to 2 layers of PDAC/TDBC with cavity detuning of 21 meV. (b) Corresponding numerically calculated angle resolved absorption spectra. (c)Numerically calculated angle resolved dissipation density inside the PDAC/TDBC layer. (d) Numerically calculated angle resolved reflectivity spectraof a microcavity coupled to 2 layers of PDAC/TDBC with cavity detuning of 335 meV. (e) Corresponding numerically calculated angle resolvedabsorption spectra. (f ) Numerically calculated angle resolved dissipation density inside the PDAC/TDBC layer. The superimposing dashed lines werecalculated using a simple coupled oscillator model to estimate the coupling strength. The dashed white line represents the uncoupled cavity mode,the dashed black line represents the molecular absorption, and the dashed red line represents the polaritons.
Nanoscale Paper
This journal is © The Royal Society of Chemistry 2021 Nanoscale, 2021, 13, 14497–14505 | 14501
Ope
n A
cces
s A
rtic
le. P
ublis
hed
on 1
3 A
ugus
t 202
1. D
ownl
oade
d on
11/
24/2
021
12:2
0:34
PM
. T
his
artic
le is
lice
nsed
und
er a
Cre
ativ
e C
omm
ons
Attr
ibut
ion-
Non
Com
mer
cial
3.0
Unp
orte
d L
icen
ce.
View Article Online
These results indicate that an apparent split and anti-cross-ing observed in reflection may not result in a significant modi-fication of the molecular absorption, something that is neededto alter the photophysics of molecules.
2.3. Effect of excitation mechanism
To understand the processes involved in polariton assisted PLin more detail we excited a microcavity with 8 layers of PDAC/TDBC with a 532 nm excitation – to pump the system at anenergy above the upper polariton branch, and with 633 nm –
to excite only the lower polariton branch. Fig. 6 shows themeasured angle resolved PL spectra for different excitationmechanisms. We chose a microcavity with a detuning of368 meV so that the LP could be excited using a 633 nm laser.
Fig. 6(a) shows angle resolved PL spectra collected by excit-ing a microcavity with 8 layers of PDAC/TDBC using a focusedbeam from a 532 nm laser. For the non-resonant excitationcase (532 nm laser) we see that the LP assisted emission showsintense emission at large wavevectors around 1.95 eV. Thevibrational modes associated with the molecule assist in therelaxation of the reservoir states, thus selectively populatingthe LPB at specific energies, when the vibrational quanta sup-ported by the molecule match the energy difference betweenthe reservoir and the LPB. The vibrational modes of PDAC/TDBC overlap with the LPB around 1.95 eV. For this reason,there is a non-uniform intensity distribution along the LPB(see section S4 of the ESI† for more details on vibrationalmodes and its effect on LPB emission). The more interesting
case is when the system is excited using a laser resonant withthe LPB (633 nm). Fig. 6(b) shows the angle resolved PL whenthe system was excited using a focused beam of 633 nm laser.In this case, we suggest that the observed molecular PL is pro-duced by two mechanisms:
• The relaxation of LPB which was directly excited using the633 nm laser. This is possible because of (a) modified absorp-tion of the molecule resulting in a low energy absorption banddue to the coupling with the microcavity (see Fig. 5(f )) (b) theinput laser beam has a wide range of wavevectors. This allowsus to populate the LPB with the 633 nm laser, which eventuallyrelaxes through polariton scattering.
• Incident photons are Raman scattered by the molecules,populating the LPB which eventually undergoes relaxation. Weclearly see Raman peaks of PDAC/TDBC overlying the broadmolecular PL (see section S4 of ESI†) confirming this mode ofexcitation/relaxation.
To better understand the role of vibrational quanta in thepolariton assisted PL we excited the microcavity with input anwavevector k ∼ 0. To achieve this we focus the input laser beamto the back-aperture of the objective lens.45 Fig. 6(c) shows theexperimentally measured angle resolved PL spectrum whenthe microcavity was excited using a 532 nm laser beam. We seeno recognizable difference between the focused excitation caseand the k ∼ 0 case. We suggest that this is because the reser-voir states play a critical role in providing all possible wavevec-tors needed to populate the LPB. Fig. 6(d) shows angle resolvedPL of the microcavity by exciting it with a 633 nm laser at
Fig. 5 Numerical modelling of molecule–cavity coupling (8 layers). (a) Numerically calculated angle resolved reflectivity spectra of a microcavitycoupled to 8 layers of PDAC/TDBC with cavity detuning of 82 meV. (b) Corresponding numerically calculated angle resolved absorption spectra. (c)Numerically calculated angle resolved dissipation density inside the PDAC/TDBC layer. (d) Numerically calculated angle resolved reflectivity spectraof a microcavity coupled to 8 layers of PDAC/TDBC with cavity detuning of 368 meV. (e) Corresponding numerically calculated angle resolvedabsorption spectra. (f ) Numerically calculated angle resolved dissipation density inside the PDAC/TDBC layer. The superimposing dashed lines werecalculated using a simple coupled oscillator model to estimate the coupling strength. The dashed white line represents the uncoupled cavity mode,the dashed black line represents the molecular absorption, and the dashed red line represents the polaritons.
Paper Nanoscale
14502 | Nanoscale, 2021, 13, 14497–14505 This journal is © The Royal Society of Chemistry 2021
Ope
n A
cces
s A
rtic
le. P
ublis
hed
on 1
3 A
ugus
t 202
1. D
ownl
oade
d on
11/
24/2
021
12:2
0:34
PM
. T
his
artic
le is
lice
nsed
und
er a
Cre
ativ
e C
omm
ons
Attr
ibut
ion-
Non
Com
mer
cial
3.0
Unp
orte
d L
icen
ce.
View Article Online
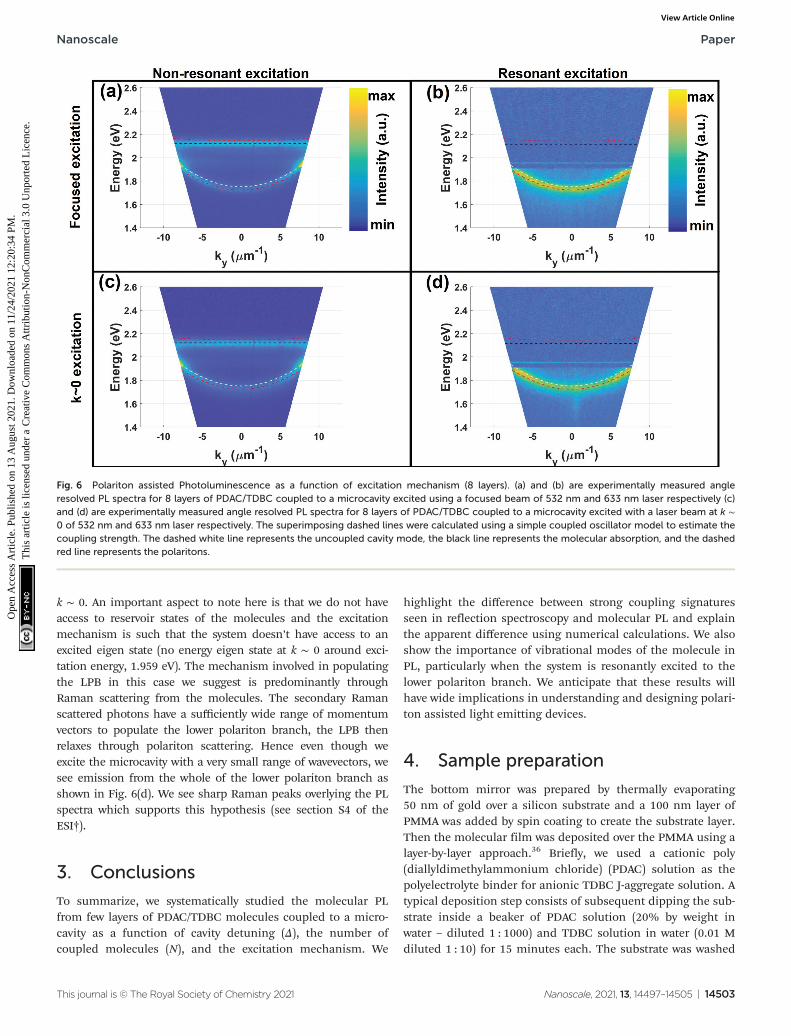
k ∼ 0. An important aspect to note here is that we do not haveaccess to reservoir states of the molecules and the excitationmechanism is such that the system doesn’t have access to anexcited eigen state (no energy eigen state at k ∼ 0 around exci-tation energy, 1.959 eV). The mechanism involved in populatingthe LPB in this case we suggest is predominantly throughRaman scattering from the molecules. The secondary Ramanscattered photons have a sufficiently wide range of momentumvectors to populate the lower polariton branch, the LPB thenrelaxes through polariton scattering. Hence even though weexcite the microcavity with a very small range of wavevectors, wesee emission from the whole of the lower polariton branch asshown in Fig. 6(d). We see sharp Raman peaks overlying the PLspectra which supports this hypothesis (see section S4 of theESI†).
3. Conclusions
To summarize, we systematically studied the molecular PLfrom few layers of PDAC/TDBC molecules coupled to a micro-cavity as a function of cavity detuning (Δ), the number ofcoupled molecules (N), and the excitation mechanism. We
highlight the difference between strong coupling signaturesseen in reflection spectroscopy and molecular PL and explainthe apparent difference using numerical calculations. We alsoshow the importance of vibrational modes of the molecule inPL, particularly when the system is resonantly excited to thelower polariton branch. We anticipate that these results willhave wide implications in understanding and designing polari-ton assisted light emitting devices.
4. Sample preparation
The bottom mirror was prepared by thermally evaporating50 nm of gold over a silicon substrate and a 100 nm layer ofPMMA was added by spin coating to create the substrate layer.Then the molecular film was deposited over the PMMA using alayer-by-layer approach.36 Briefly, we used a cationic poly(diallyldimethylammonium chloride) (PDAC) solution as thepolyelectrolyte binder for anionic TDBC J-aggregate solution. Atypical deposition step consists of subsequent dipping the sub-strate inside a beaker of PDAC solution (20% by weight inwater – diluted 1 : 1000) and TDBC solution in water (0.01 Mdiluted 1 : 10) for 15 minutes each. The substrate was washed
Fig. 6 Polariton assisted Photoluminescence as a function of excitation mechanism (8 layers). (a) and (b) are experimentally measured angleresolved PL spectra for 8 layers of PDAC/TDBC coupled to a microcavity excited using a focused beam of 532 nm and 633 nm laser respectively (c)and (d) are experimentally measured angle resolved PL spectra for 8 layers of PDAC/TDBC coupled to a microcavity excited with a laser beam at k ∼0 of 532 nm and 633 nm laser respectively. The superimposing dashed lines were calculated using a simple coupled oscillator model to estimate thecoupling strength. The dashed white line represents the uncoupled cavity mode, the black line represents the molecular absorption, and the dashedred line represents the polaritons.
Nanoscale Paper
This journal is © The Royal Society of Chemistry 2021 Nanoscale, 2021, 13, 14497–14505 | 14503
Ope
n A
cces
s A
rtic
le. P
ublis
hed
on 1
3 A
ugus
t 202
1. D
ownl
oade
d on
11/
24/2
021
12:2
0:34
PM
. T
his
artic
le is
lice
nsed
und
er a
Cre
ativ
e C
omm
ons
Attr
ibut
ion-
Non
Com
mer
cial
3.0
Unp
orte
d L
icen
ce.
View Article Online
with DI water after each immersion and same steps wererepeated to deposit multiple layers ofPDAC/TDBC. To increasethe adhesion we first coat one layer of anionic polystyrene sul-fonate (PSS) using the above mentioned process and continuewith PDAC–TDBC. Finally the TDBC layer was protected bydepositing a layer of PDAC molecules. The superstratewas then prepared by spinning a layer of PMMA (thicknesswas varied so as to yield different detunings) and finally thetop mirror was prepared by thermally evaporating 30 nmof gold.
5. Numerical analysis and modelling
The experimental data were analysed and fit using a simplecoupled oscillator model given as
Ecavity � iγcavity2
0
0 EPDAC=TDBC � iγPDAC=TDBC
2
0B@
1CA α
β
� �
¼ Epolαβ
� �ð1Þ
where Ecavity is the cavity resonance, γcavity is the cavity reso-nance linewidth, EPDAC/TDBC is the molecular absorptionmaximum, γPDAC/TDBC is the molecular absorption linewidth,and Epol gives the energies of the polaritons. The eigen vectorsof eqn (1) provides the information on mixing fraction, alsocalled Hopfield co-efficients.
Microcavities coupled to layers of PDAC/TDBC were mod-elled as a z axis oriented stack (see Fig. 1(a)) using 2D finiteelement method (FEM) based numerical simulations. Thecomplex refractive indices of gold, PMMA, and silicon weretaken from ref. 46, 47, and 48 respectively. The permittivityof the PDAC/TDBC system was taken to be uniaxial
εx 0 00 εy 00 0 1:9
0@
1A with individual terms given by
εx;yPDAC=TDBCðEÞ ¼ εInf þ fETDBC2
ETDBC2 � E2 � iEγTDBCð2Þ
where εInf is the background permittivity set to 1.9, ETDBC isthe molecular absorption maximum set to 2.10143 eV, f is thereduced oscillator strength varied to fit the experimental data,and γ is the absorption linewidth set to 53 meV. The inputplane wave was set to be TM polarized. The substrate PMMAthickness was taken to be 100 nm and the superstrate thick-ness was varied to fit the experimental data for various detun-ings. The bottom and top gold mirrors were set to have thick-nesses of 50 nm and 30 nm respectively. The thickness of anindividual PDAC/TDBC layer was taken as 2 nm.36
Data availability
Research data are available from the University of Exeter repo-sitory at https://doi.org/10.24378/exe.3483.
Author contributions
ABV conceived the idea, designed the experiments and simu-lations with the help of WLB. KSM prepared the samples. ABVbuilt the experimental setup, collected the experimental dataand performed numerical simulations. All authors contributedto analyzing the data and writing the manuscript.
Conflicts of interest
There are no conflicts of interest.
Acknowledgements
The authors thank Wai Jue Tan for his help in preparingsamples. The authors acknowledge the support of EuropeanResearch Council through the Photmat project (ERC-2016-AdG-742222: http://www.photmat.eu) and the support of TheLeverhulme Trust. ABV thanks Sunny Tiwari and DeepakKumar Sharma for fruitful discussions.
References
1 T. Tsutsui, MRS Bull., 1997, 22, 39–45.2 M. Grell and D. D. Bradley, Adv. Mater., 1999, 11, 895–905.3 H. Klauk, Chem. Soc. Rev., 2010, 39, 2643–2666.4 L. Basabe-Desmonts, D. N. Reinhoudt and M. Crego-
Calama, Chem. Soc. Rev., 2007, 36, 993–1017.5 Y. Sagara, S. Yamane, M. Mitani, C. Weder and T. Kato,
Adv. Mater., 2016, 28, 1073–1095.6 P. A. Hobson, S. Wedge, J. A. Wasey, I. Sage and
W. L. Barnes, Adv. Mater., 2002, 14, 1393–1396.7 B. J. Matterson, J. M. Lupton, A. F. Safonov, M. G. Salt,
W. L. Barnes and I. D. Samuel, Adv. Mater., 2001, 13, 123–127.
8 Y. Sun, N. C. Giebink, H. Kanno, B. Ma, M. E. Thompsonand S. R. Forrest, Nature, 2006, 440, 908–912.
9 Y. Hamada, H. Kanno, T. Tsujioka, H. Takahashi andT. Usuki, Appl. Phys. Lett., 1999, 75, 1682–1684.
10 Y. Kawamura, S. Yanagida and S. R. Forrest, J. Appl. Phys.,2002, 92, 87–93.
11 C.-H. Cheng, D. Cordovilla Leon, Z. Li, E. Litvak andP. B. Deotare, ACS Nano, 2020, 14, 10462–10470.
12 P. Burrows, Z. Shen, V. Bulovic, D. McCarty, S. Forrest,J. Cronin and M. Thompson, J. Appl. Phys., 1996, 79, 7991–8006.
13 M. Pelton, Nat. Photonics, 2015, 9, 427–435.14 J. Sun, H. Hu, D. Zheng, D. Zhang, Q. Deng, S. Zhang and
H. Xu, ACS Nano, 2018, 12, 10393–10402.15 K. J. Russell, T.-L. Liu, S. Cui and E. L. Hu, Nat. Photonics,
2012, 6, 459–462.16 A. B. Vasista, H. Jog, T. Heilpern, M. E. Sykes, S. Tiwari,
D. K. Sharma, S. K. Chaubey, G. P. Wiederrecht, S. K. Grayand G. V. P. Kumar, Nano Lett., 2018, 18, 650–655.
Paper Nanoscale
14504 | Nanoscale, 2021, 13, 14497–14505 This journal is © The Royal Society of Chemistry 2021
Ope
n A
cces
s A
rtic
le. P
ublis
hed
on 1
3 A
ugus
t 202
1. D
ownl
oade
d on
11/
24/2
021
12:2
0:34
PM
. T
his
artic
le is
lice
nsed
und
er a
Cre
ativ
e C
omm
ons
Attr
ibut
ion-
Non
Com
mer
cial
3.0
Unp
orte
d L
icen
ce.
View Article Online
17 A. B. Vasista, S. Tiwari, D. K. Sharma, S. K. Chaubey andG. V. P. Kumar, Adv. Opt. Mater., 2018, 6, 1801025.
18 D. M. Coles, N. Somaschi, P. Michetti, C. Clark,P. G. Lagoudakis, P. G. Savvidis and D. G. Lidzey, Nat.Mater., 2014, 13, 712–719.
19 D. Polak, R. Jayaprakash, T. P. Lyons, L. Á. Martínez-Martínez, A. Leventis, K. J. Fallon, H. Coulthard,D. G. Bossanyi, K. Georgiou, I. I. Anthony, J. Petty,J. Anthony, H. Bronstein, J. Yuen-Zhou, A. I. Tartakovskii,J. Clark and A. J. Musser, Chem. Sci., 2020, 11, 343–354.
20 B. Munkhbat, M. Wersäll, D. G. Baranov, T. J. Antosiewiczand T. Shegai, Sci. Adv., 2018, 4, eaas9552.
21 M. Ramezani, A. Halpin, A. I. Fernández-Domínguez,J. Feist, S. R.-K. Rodriguez, F. J. Garcia-Vidal andJ. G. Rivas, Optica, 2017, 4, 31–37.
22 D. M. Coles, R. T. Grant, D. G. Lidzey, C. Clark andP. G. Lagoudakis, Phys. Rev. B: Condens. Matter Mater. Phys.,2013, 88, 121303.
23 D. M. Coles, P. Michetti, C. Clark, W. C. Tsoi, A. M. Adawi,J.-S. Kim and D. G. Lidzey, Adv. Funct. Mater., 2011, 21,3691–3696.
24 D. G. Lidzey, D. D. C. Bradley, T. Virgili, A. Armitage,M. S. Skolnick and S. Walker, Phys. Rev. Lett., 1999, 82,3316–3319.
25 M. Wersäll, J. Cuadra, T. J. Antosiewicz, S. Balci andT. Shegai, Nano Lett., 2017, 17, 551–558.
26 J. Gu, B. Chakraborty, M. Khatoniar and V. M. Menon, Nat.Nanotechnol., 2019, 14, 1024–1028.
27 J. M. Lüttgens, F. J. Berger and J. Zaumseil, ACS Photonics,2021, 8, 182–193.
28 G. M. Akselrod, E. R. Young, M. S. Bradley and V. Bulović,Opt. Express, 2013, 21, 12122–12128.
29 J.-F. Chang, J.-F. Chang, T.-Y. Lin, C.-F. Hsu, S.-Y. Chen,S.-Y. Hong, G.-S. Ciou, C.-C. Jaing, C.-C. Lee and C.-C. Lee,Opt. Express, 2020, 28, 39781–39789.
30 K. S. Menghrajani, G. R. Nash and W. L. Barnes, ACSPhotonics, 2019, 6, 2110–2116.
31 K. S. Menghrajani, H. A. Fernandez, G. R. Nash andW. L. Barnes, Adv. Opt. Mater., 2019, 7, 1900403.
32 K. S. Menghrajani and W. L. Barnes, ACS Photonics, 2020, 7,2448–2459.
33 G. Zengin, T. Gschneidtner, R. Verre, L. Shao,T. J. Antosiewicz, K. Moth-Poulsen, M. Käll and T. Shegai,J. Phys. Chem. C, 2016, 120, 20588–20596.
34 Z. Geng, J. Theenhaus, B. K. Patra, J.-Y. Zheng, J. Busink,E. C. Garnett and S. R. K. Rodriguez, ACS Photonics, 2021,8, 1271–1276.
35 A. B. Vasista and W. L. Barnes, Nano Lett., 2020, 20, 1766–1773.
36 M. S. Bradley, J. R. Tischler and V. Bulović, Adv. Mater.,2005, 17, 1881–1886.
37 S. Wang, T. Chervy, J. George, J. A. Hutchison, C. Genetand T. W. Ebbesen, J. Phys. Chem. Lett., 2014, 5, 1433–1439.
38 G. M. Akselrod, Y. R. Tischler, E. R. Young, D. G. Noceraand V. Bulovic, Phys. Rev. B: Condens. Matter Mater. Phys.,2010, 82, 113106.
39 A. B. Vasista, D. K. Sharma and G. V. P. Kumar, DigitalEncyclopedia of Applied Physics, Wiley-VCH Verlag GmbH &Co. KGaA, Weinheim, Germany, 2019, pp. 1–14.
40 V. Savona, L. C. Andreani, P. Schwendimann andA. Quattropani, Solid State Commun., 1995, 93, 733–739.
41 G. Zengin, M. Wersäll, S. Nilsson, T. J. Antosiewicz, M. Källand T. Shegai, Phys. Rev. Lett., 2015, 114, 157401.
42 T. Schwartz, J. A. Hutchison, J. Léonard, C. Genet,S. Haacke and T. W. Ebbesen, ChemPhysChem, 2013, 14,125–131.
43 P. A. Hobson, W. L. Barnes, D. G. Lidzey, G. A. Gehring,D. M. Whittaker, M. S. Skolnick and S. Walker, Appl. Phys.Lett., 2002, 81, 3519–3521.
44 E. Hulkko, S. Pikker, V. Tiainen, R. H. Tichauer,G. Groenhof and J. J. Toppari, J. Chem. Phys., 2021, 154,154303.
45 G. Grzela, R. Paniagua-Domínguez, T. Barten, D. van Dam,J. A. Sánchez-Gil and J. G. Rivas, Nano Lett., 2014, 14, 3227–3234.
46 P. B. Johnson and R. W. Christy, Phys. Rev. B: Solid State,1972, 6, 4370–4379.
47 N. Sultanova, S. Kasarova and I. Nikolov, Acta Phys. Pol., A,2009, 116, 585.
48 M. A. Green and M. J. Keevers, Prog. Photovoltaics Res.Appl., 1995, 3, 189–192.
Nanoscale Paper
This journal is © The Royal Society of Chemistry 2021 Nanoscale, 2021, 13, 14497–14505 | 14505
Ope
n A
cces
s A
rtic
le. P
ublis
hed
on 1
3 A
ugus
t 202
1. D
ownl
oade
d on
11/
24/2
021
12:2
0:34
PM
. T
his
artic
le is
lice
nsed
und
er a
Cre
ativ
e C
omm
ons
Attr
ibut
ion-
Non
Com
mer
cial
3.0
Unp
orte
d L
icen
ce.
View Article Online