point of connection charges and losses computation … · data taken from monthly power supply...
TRANSCRIPT
Point of Connection Charges and Losses Computation
May 2015 – June 2015 (Q1)
Meeting of the Validation CommitteeDate : 17th April, 2015
Venue: NLDC Conference Room, New Delhi
Assumptions
As per CERC (Sharing of Inter-StateTransmission Charges and Losses) (ThirdAmendment) Regulations, 2015 .
Maximum/Peak generation (based on SEMdata) and Maximum/Peak load (based on CEAdata) considered.
Contents
PoC Computation for Q1 Case (May’15-June’15)
Demand & Generation Projection
New Generation

Demand Generation Projection Demand and Generation Projection
Based on Last 3 years data.
Generation Projection
Average of monthly maximum injection in the last three years.
Based on actual metered data available with RLDCs.
Increasing Trend : Last Year Average figure considered
In other cases : Average of last three years
States’ generation in case of non-submission of data by states?
New Generation: DOCO by 31st March 2015
Demand Generation Projection
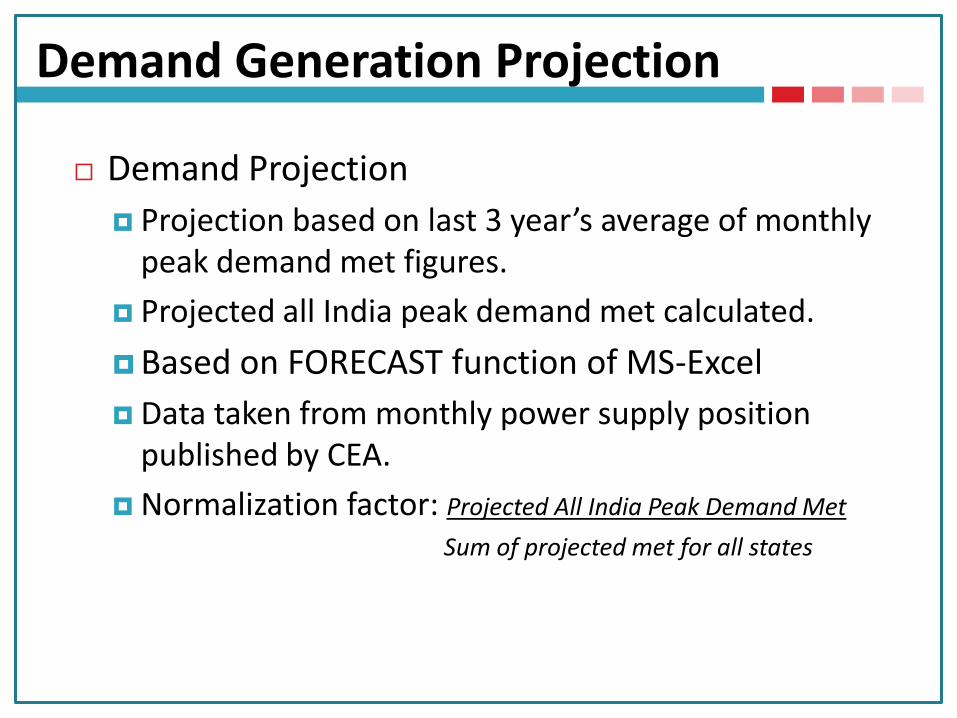
Demand Projection
Projection based on last 3 year’s average of monthly peak demand met figures.
Projected all India peak demand met calculated.
Based on FORECAST function of MS-Excel
Data taken from monthly power supply position published by CEA.
Normalization factor: Projected All India Peak Demand Met
Sum of projected met for all states
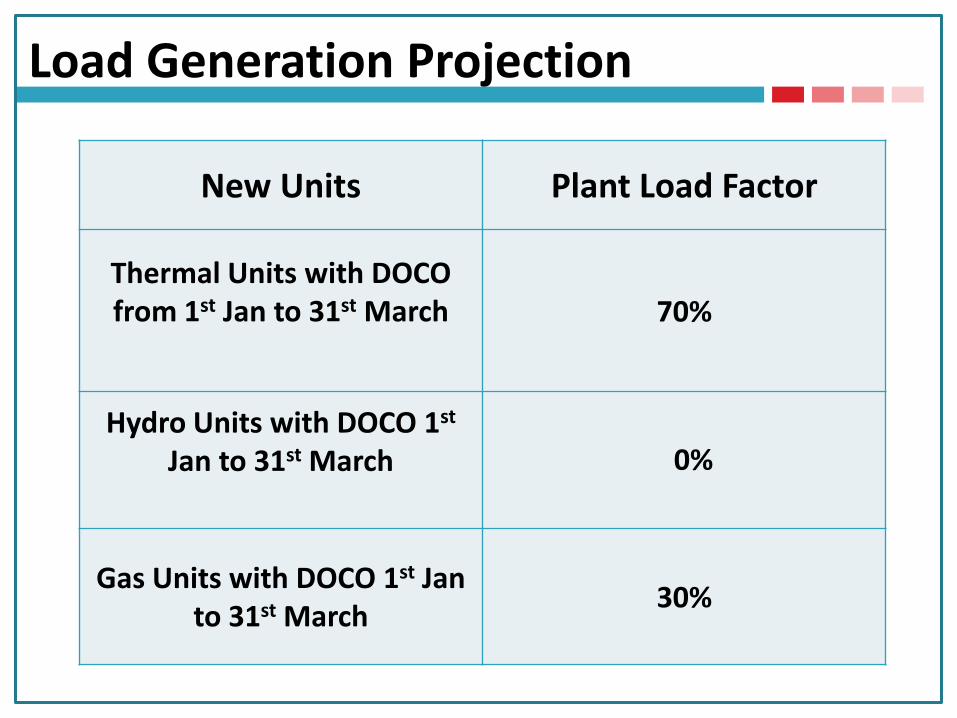
Load Generation Projection
New Units Plant Load Factor
Thermal Units with DOCO from 1st Jan to 31st March 70%
Hydro Units with DOCO 1st
Jan to 31st March 0%
Gas Units with DOCO 1st Jan to 31st March
30%
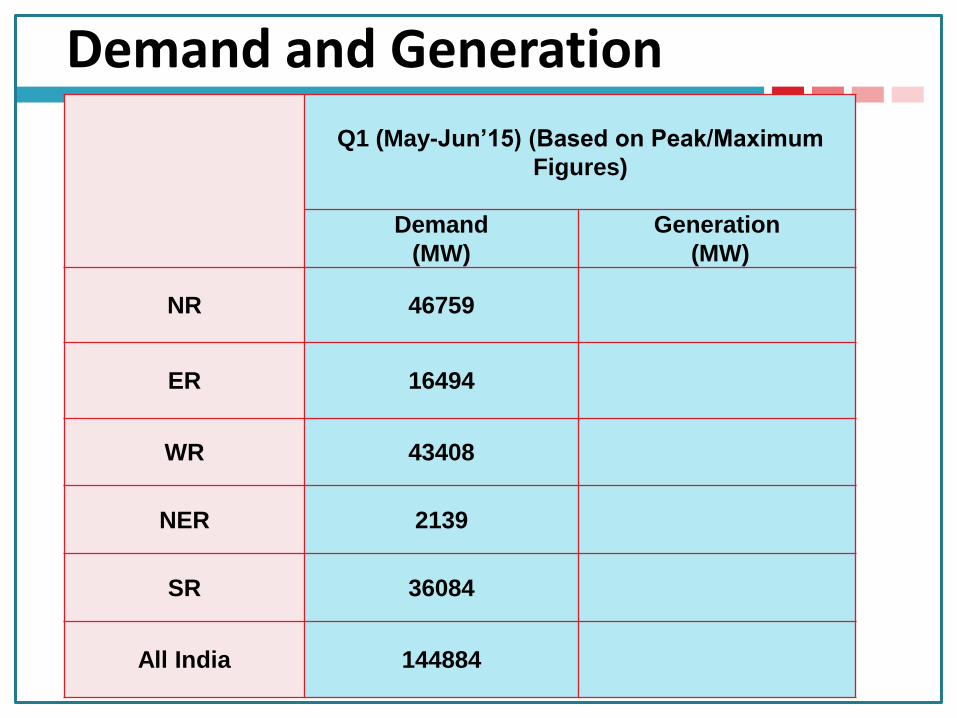
Demand and Generation
Q1 (May-Jun’15) (Based on Peak/Maximum
Figures)
Demand
(MW)
Generation
(MW)
NR 46759
ER 16494
WR 43408
NER 2139
SR 36084
All India 144884
Demand Projection
Northern Region
Eastern Region
Western Region
North-Eastern Region
Southern Region

Generation Projection (Including New Generation)
Northern Region
Eastern Region
Western Region
North-Eastern Region
Southern Region
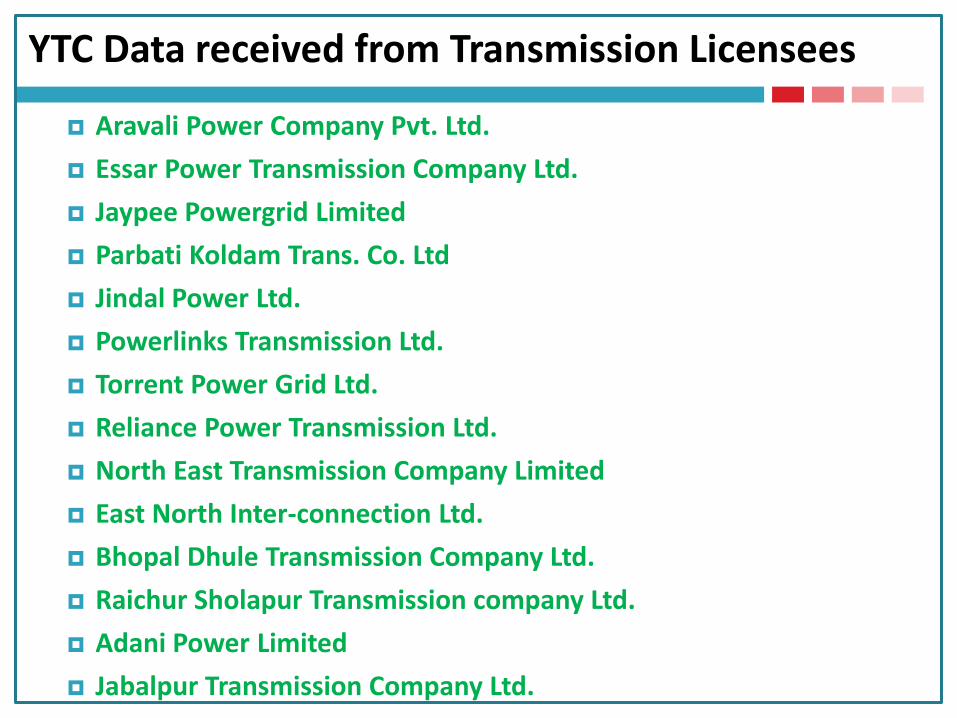
YTC Data received from Transmission Licensees
Aravali Power Company Pvt. Ltd.
Essar Power Transmission Company Ltd.
Jaypee Powergrid Limited
Parbati Koldam Trans. Co. Ltd
Jindal Power Ltd.
Powerlinks Transmission Ltd.
Torrent Power Grid Ltd.
Reliance Power Transmission Ltd.
North East Transmission Company Limited
East North Inter-connection Ltd.
Bhopal Dhule Transmission Company Ltd.
Raichur Sholapur Transmission company Ltd.
Adani Power Limited
Jabalpur Transmission Company Ltd.
YTC Data not received from
Power Grid Corporation of India Limited.
Points for Discussion
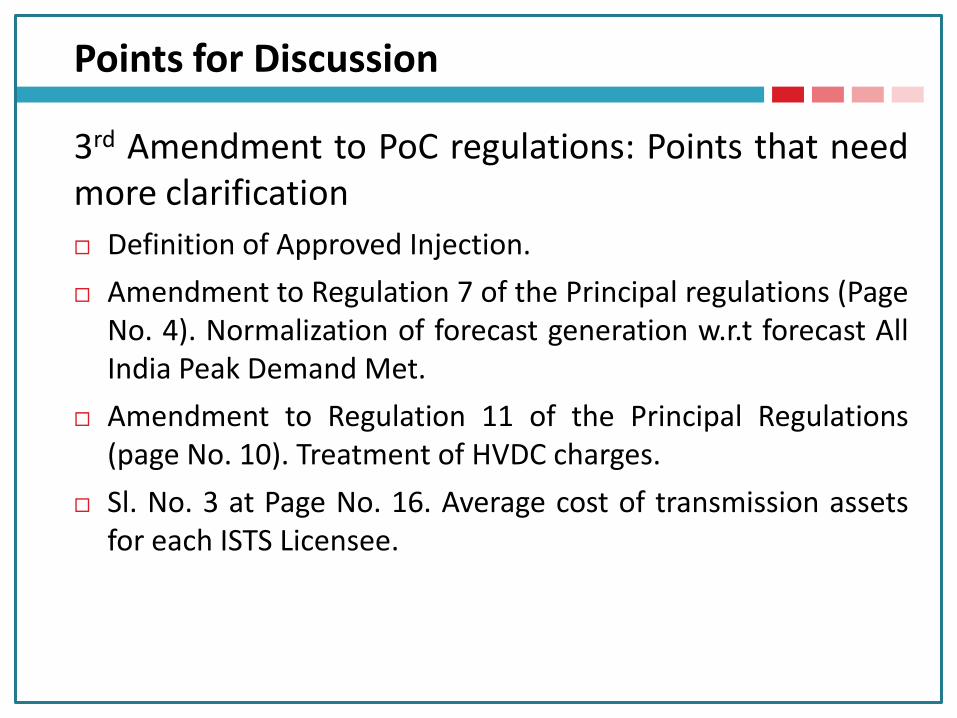
3rd Amendment to PoC regulations: Points that needmore clarification
Definition of Approved Injection.
Amendment to Regulation 7 of the Principal regulations (PageNo. 4). Normalization of forecast generation w.r.t forecast AllIndia Peak Demand Met.
Amendment to Regulation 11 of the Principal Regulations(page No. 10). Treatment of HVDC charges.
Sl. No. 3 at Page No. 16. Average cost of transmission assetsfor each ISTS Licensee.
Points for Discussion
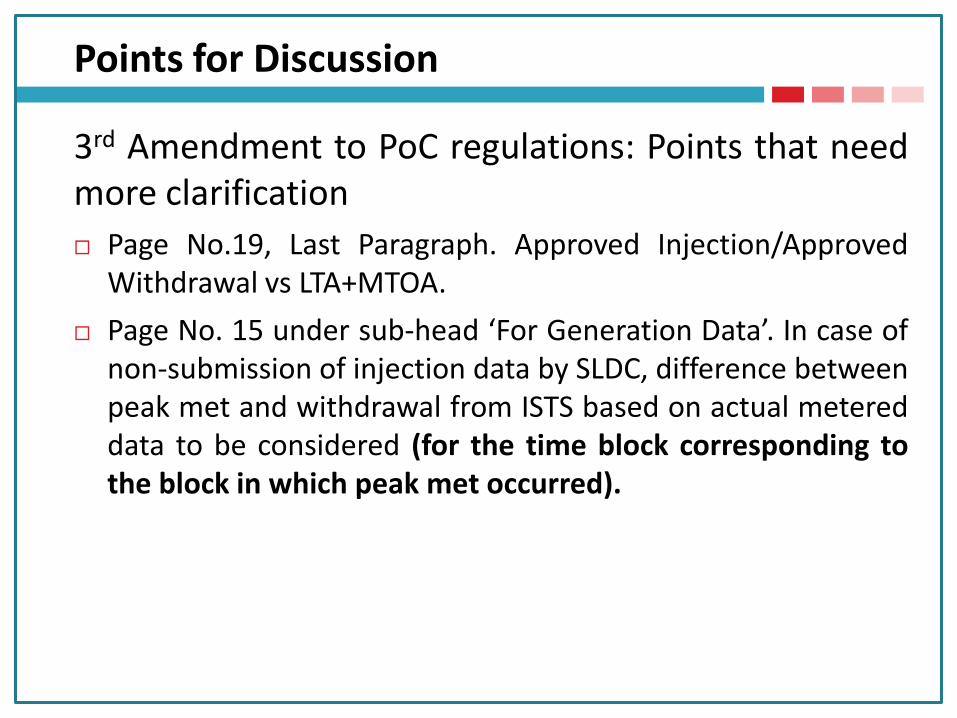
3rd Amendment to PoC regulations: Points that needmore clarification
Page No.19, Last Paragraph. Approved Injection/ApprovedWithdrawal vs LTA+MTOA.
Page No. 15 under sub-head ‘For Generation Data’. In case ofnon-submission of injection data by SLDC, difference betweenpeak met and withdrawal from ISTS based on actual metereddata to be considered (for the time block corresponding tothe block in which peak met occurred).
Points for Discussion
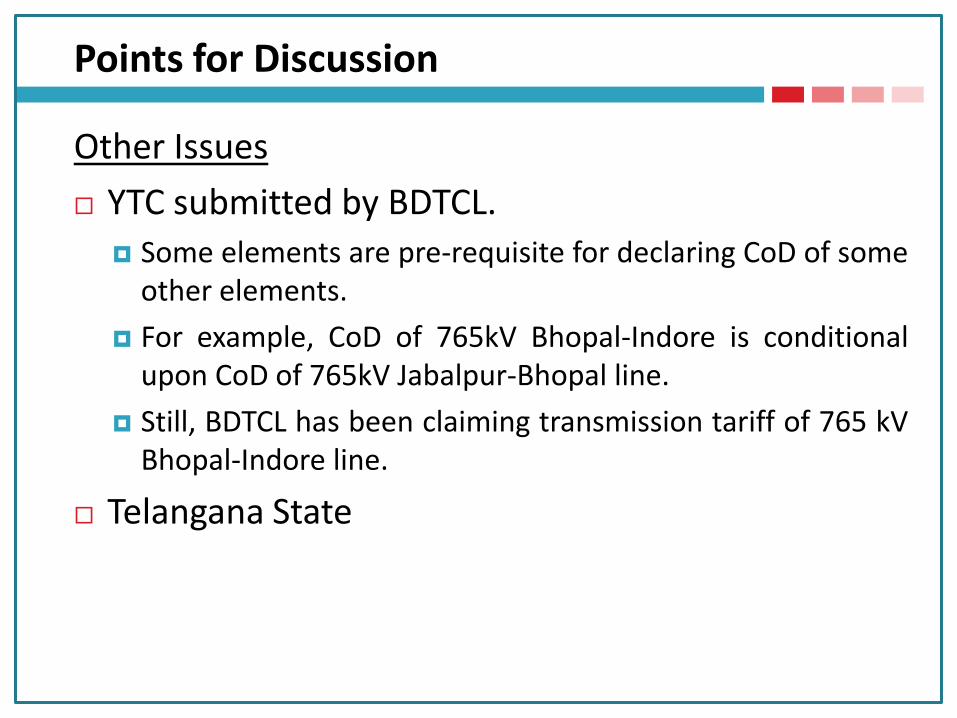
Other Issues
YTC submitted by BDTCL. Some elements are pre-requisite for declaring CoD of some
other elements.
For example, CoD of 765kV Bhopal-Indore is conditionalupon CoD of 765kV Jabalpur-Bhopal line.
Still, BDTCL has been claiming transmission tariff of 765 kVBhopal-Indore line.
Telangana State
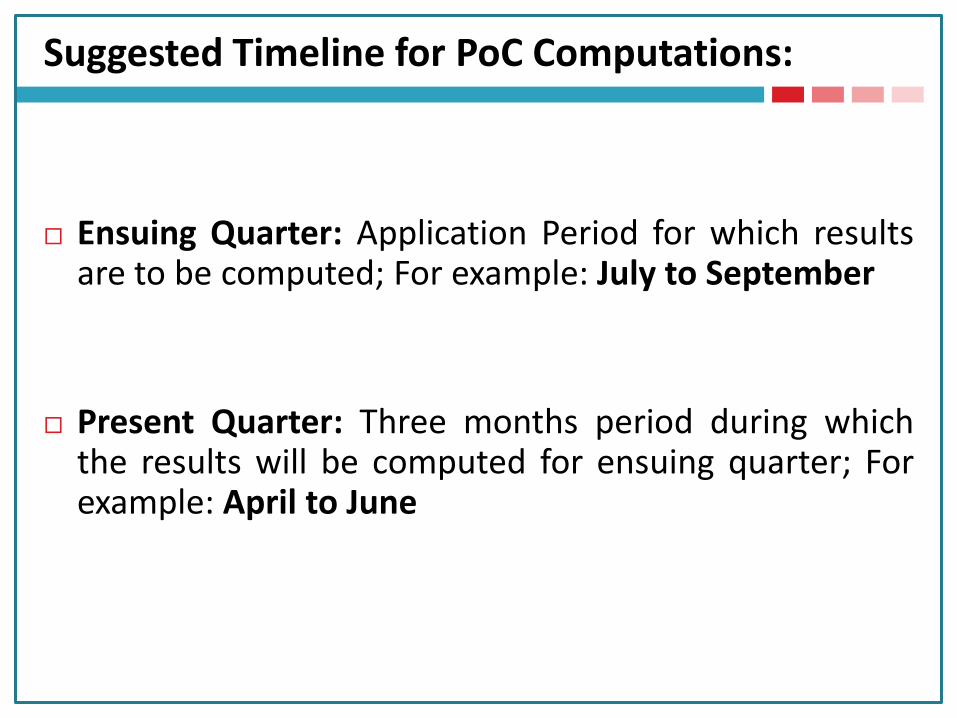
Suggested Timeline for PoC Computations:
Ensuing Quarter: Application Period for which resultsare to be computed; For example: July to September
Present Quarter: Three months period during whichthe results will be computed for ensuing quarter; Forexample: April to June
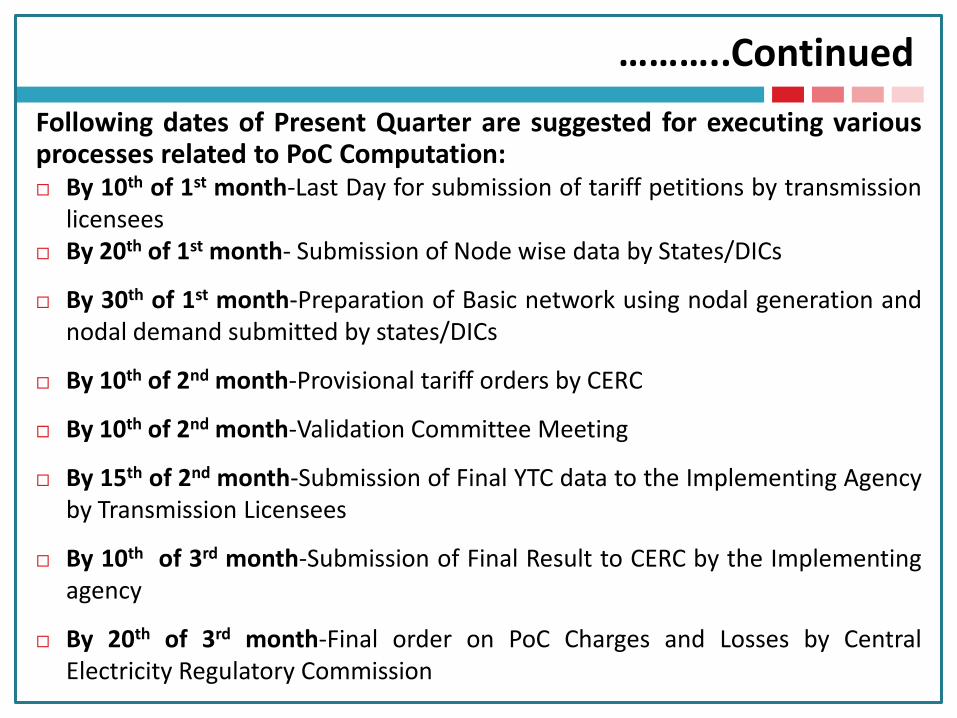
………..Continued
Following dates of Present Quarter are suggested for executing variousprocesses related to PoC Computation: By 10th of 1st month-Last Day for submission of tariff petitions by transmission
licensees By 20th of 1st month- Submission of Node wise data by States/DICs
By 30th of 1st month-Preparation of Basic network using nodal generation andnodal demand submitted by states/DICs
By 10th of 2nd month-Provisional tariff orders by CERC
By 10th of 2nd month-Validation Committee Meeting
By 15th of 2nd month-Submission of Final YTC data to the Implementing Agencyby Transmission Licensees
By 10th of 3rd month-Submission of Final Result to CERC by the Implementingagency
By 20th of 3rd month-Final order on PoC Charges and Losses by CentralElectricity Regulatory Commission

Thank You !!
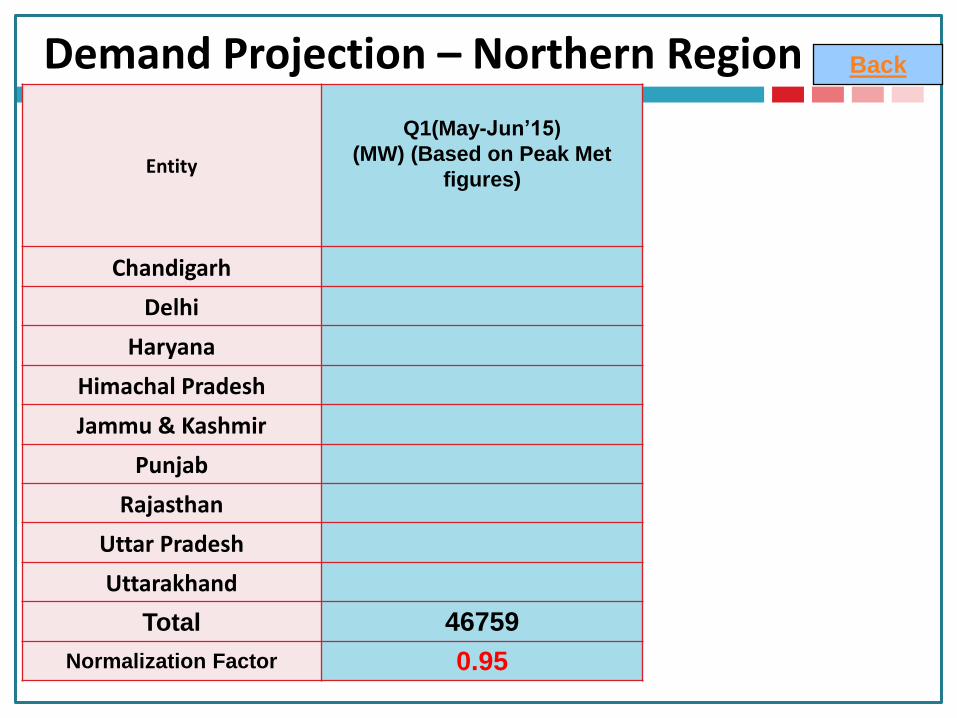
Demand Projection – Northern Region
Entity
Q1(May-Jun’15)
(MW) (Based on Peak Met
figures)
Chandigarh
Delhi
Haryana
Himachal Pradesh
Jammu & Kashmir
Punjab
Rajasthan
Uttar Pradesh
Uttarakhand
Total 46759
Normalization Factor 0.95
Back
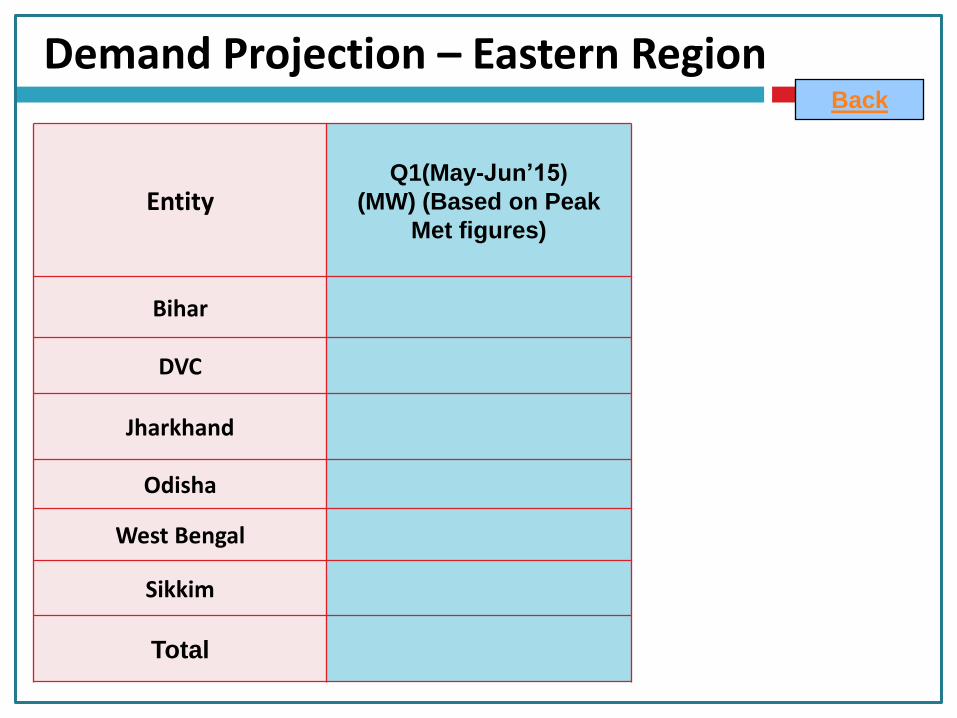
Demand Projection – Eastern Region
EntityQ1(May-Jun’15)
(MW) (Based on Peak
Met figures)
Bihar
DVC
Jharkhand
Odisha
West Bengal
Sikkim
Total
Back
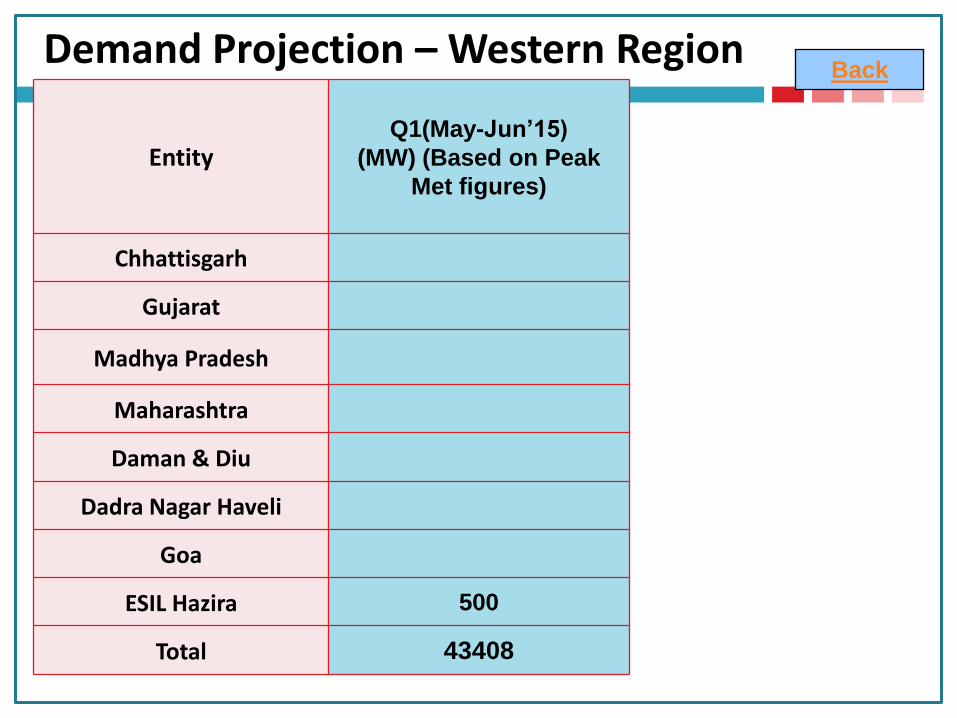
Demand Projection – Western Region
EntityQ1(May-Jun’15)
(MW) (Based on Peak
Met figures)
Chhattisgarh
Gujarat
Madhya Pradesh
Maharashtra
Daman & Diu
Dadra Nagar Haveli
Goa
ESIL Hazira 500
Total 43408
Back
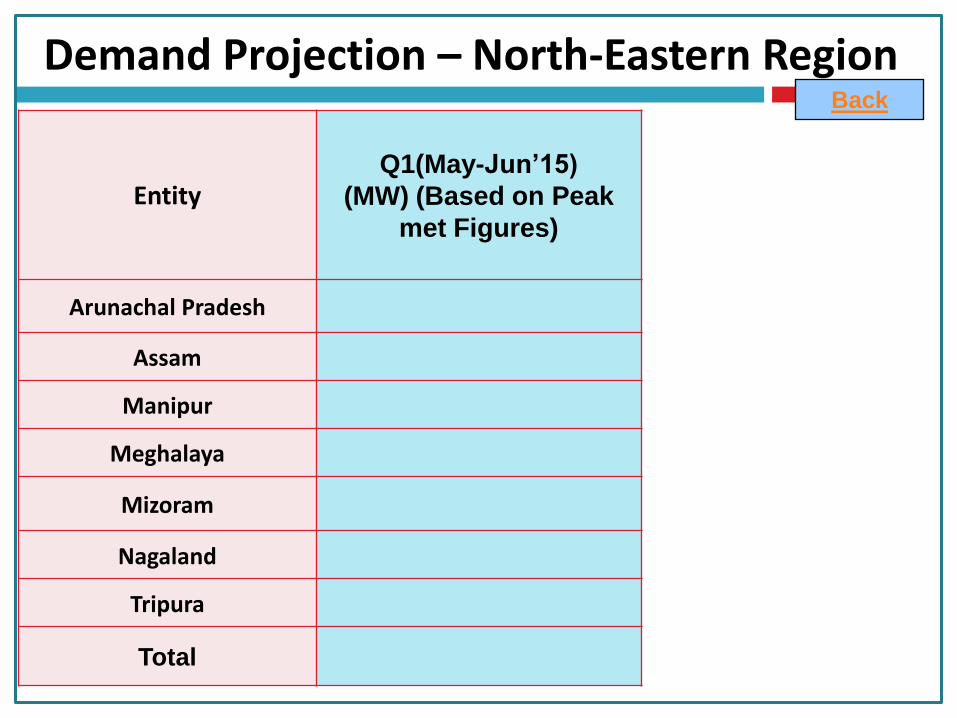
Demand Projection – North-Eastern Region
EntityQ1(May-Jun’15)
(MW) (Based on Peak
met Figures)
Arunachal Pradesh
Assam
Manipur
Meghalaya
Mizoram
Nagaland
Tripura
Total
Back
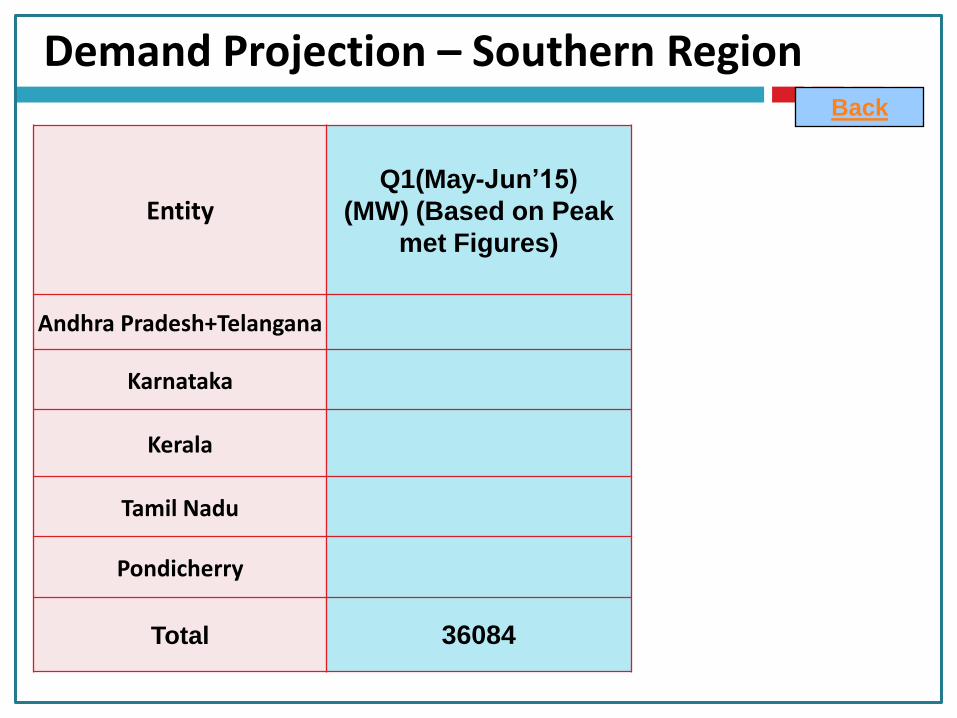
Demand Projection – Southern Region
EntityQ1(May-Jun’15)
(MW) (Based on Peak
met Figures)
Andhra Pradesh+Telangana
Karnataka
Kerala
Tamil Nadu
Pondicherry
Total 36084
Back
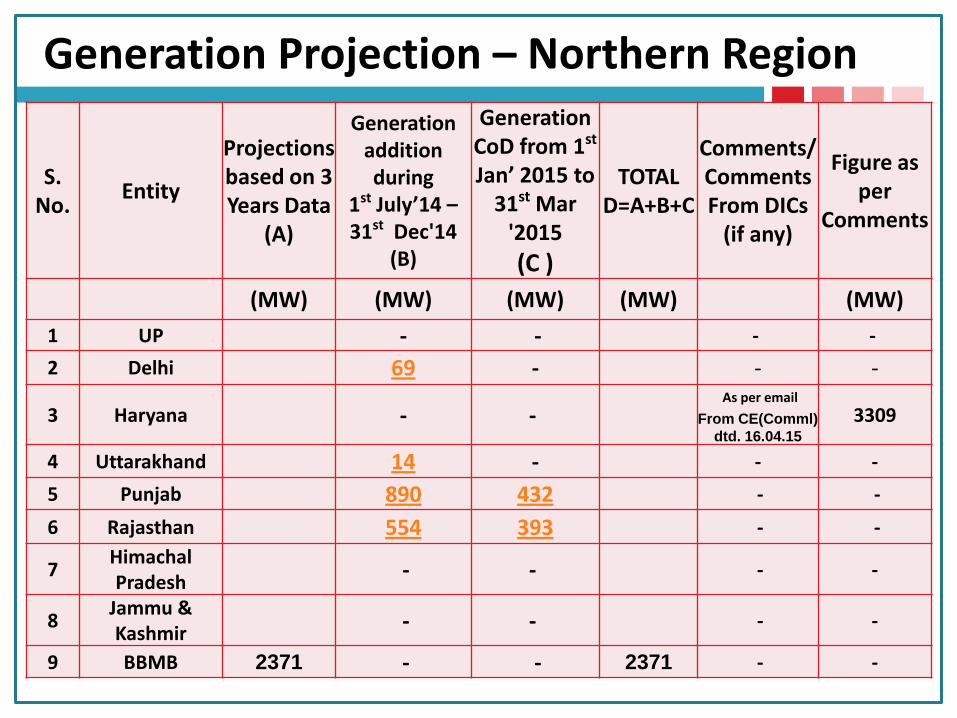
Generation Projection – Northern Region
S.No.
Entity
Projections based on 3 Years Data
(A)
Generationaddition during
1st July’14 –31st Dec'14
(B)
Generation CoD from 1st
Jan’ 2015 to 31st Mar
'2015
(C )
TOTALD=A+B+C
Comments/ Comments From DICs
(if any)
Figure as per
Comments
(MW) (MW) (MW) (MW) (MW)
1 UP - - - -
2 Delhi 69 - - -
3 Haryana - -As per email
From CE(Comml)
dtd. 16.04.15
3309
4 Uttarakhand 14 - - -
5 Punjab 890 432 - -
6 Rajasthan 554 393 - -
7Himachal Pradesh
- - - -
8Jammu & Kashmir
- - - -
9 BBMB 2371 - - 2371 - -
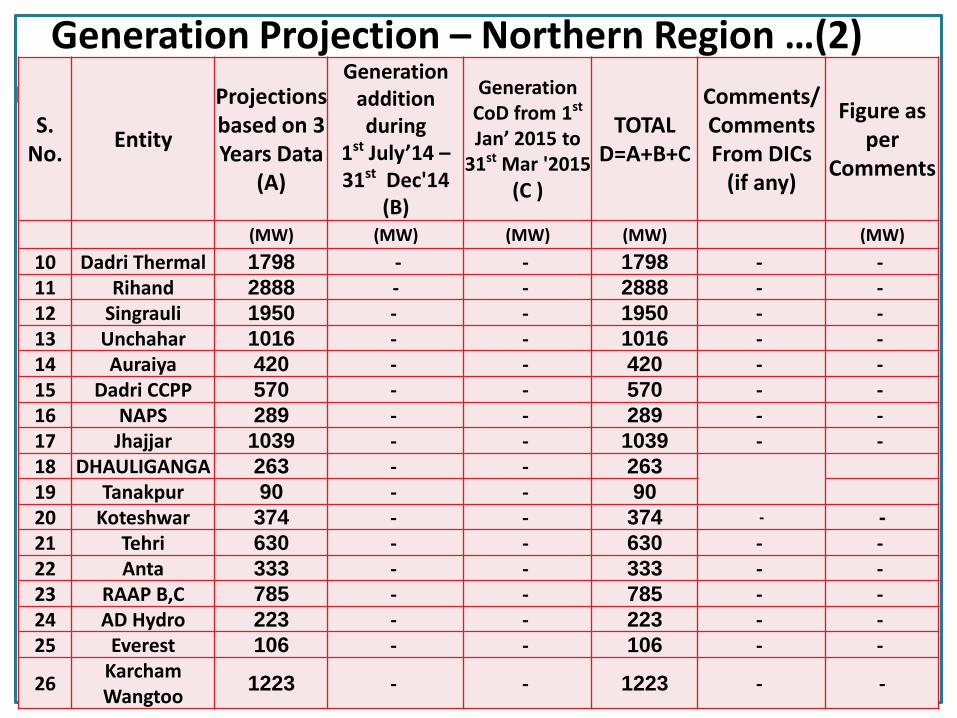
Generation Projection – Northern Region …(2)
S.No.
Entity
Projections based on 3 Years Data
(A)
Generationaddition during
1st July’14 –31st Dec'14
(B)
Generation CoD from 1st
Jan’ 2015 to 31st Mar '2015
(C )
TOTALD=A+B+C
Comments/ Comments From DICs
(if any)
Figure as per
Comments
(MW) (MW) (MW) (MW) (MW)
10 Dadri Thermal 1798 - - 1798 - -11 Rihand 2888 - - 2888 - -12 Singrauli 1950 - - 1950 - -13 Unchahar 1016 - - 1016 - -14 Auraiya 420 - - 420 - -15 Dadri CCPP 570 - - 570 - -16 NAPS 289 - - 289 - -17 Jhajjar 1039 - - 1039 - -18 DHAULIGANGA 263 - - 263
19 Tanakpur 90 - - 90
20 Koteshwar 374 - - 374 - -
21 Tehri 630 - - 630 - -22 Anta 333 - - 333 - -23 RAAP B,C 785 - - 785 - -24 AD Hydro 223 - - 223 - -25 Everest 106 - - 106 - -
26KarchamWangtoo
1223 - - 1223 - -
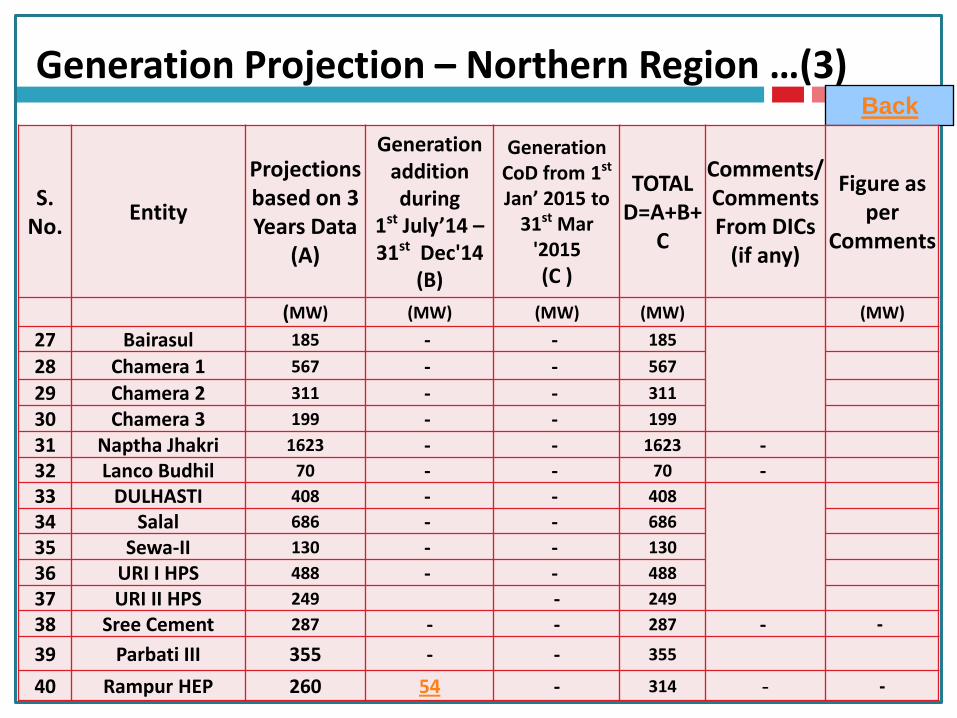
Generation Projection – Northern Region …(3)Back
S.No.
Entity
Projections based on 3 Years Data
(A)
Generationaddition during
1st July’14 –31st Dec'14
(B)
Generation CoD from 1st
Jan’ 2015 to 31st Mar
'2015
(C )
TOTALD=A+B+
C
Comments/ Comments From DICs
(if any)
Figure as per
Comments
(MW) (MW) (MW) (MW) (MW)
27 Bairasul 185 - - 185
28 Chamera 1 567 - - 567
29 Chamera 2 311 - - 311
30 Chamera 3 199 - - 199
31 Naptha Jhakri 1623 - - 1623 -32 Lanco Budhil 70 - - 70 -33 DULHASTI 408 - - 408
34 Salal 686 - - 686
35 Sewa-II 130 - - 130
36 URI I HPS 488 - - 488
37 URI II HPS 249 - 249
38 Sree Cement 287 - - 287 - -
39 Parbati III 355 - - 355
40 Rampur HEP 260 54 - 314 - -

Generation Projection – Eastern Region…(1)
S.No.
Entity
Projections based on 3 Years Data
(A)
Generationaddition during
1st July’14 –31st Dec'14
(B)
Generation CoD from 1st
Jan’ 2015 to 31st Mar
'2015
(C )
TOTALD=A+B+
C
Comments/ Comments From
DICs (if any)
Figure as per
Comments
(MW) (MW) (MW) (MW) (MW)
41 West Bengal - 196 - -
42 Odisha - -
43 Bihar - - - -
44 Jharkhand - - - -
45 Sikkim - - - -
46 Chujachan 106 - - 106 - -
47 DVC
1402
- -
140248Durgapur
Steel- - -
49 Koderma TPP - - -
50 MPL 848 - - 848 - -
51 Sterlite 1147 - - 1147 - -

Generation Projection – Eastern Region…(2)Back
S.No.
Entity
Projections based on
3 Years Data(A)
Generationaddition during
1st July’14 –31st Dec'14
(B)
Generation CoD from 1st
Jan’ 2015 to 31st Mar
'2015
(C )
TOTALD=A+B+C
Comments/ Comments From DICs
(if any)
Figure as per
Comments
(MW) (MW) (MW) (MW) (MW)
52 Teesta 531 - - 531
53 Kahalgaon 2092 - - 2092
54 Farakka 1927 - - 1927
55 Talcher 960 - - 960
56 Rangeet 69 - - 69
57 Corporate Power - - - -
58 Adhunik Power - - - - - -
59 Barh 284 - - 284 - -
60Kamalanga TPP
(GMR)545 - - 545 - -
61 JITPL 561 393 953 - -62 Bhutan 1357 - - 1357 - -
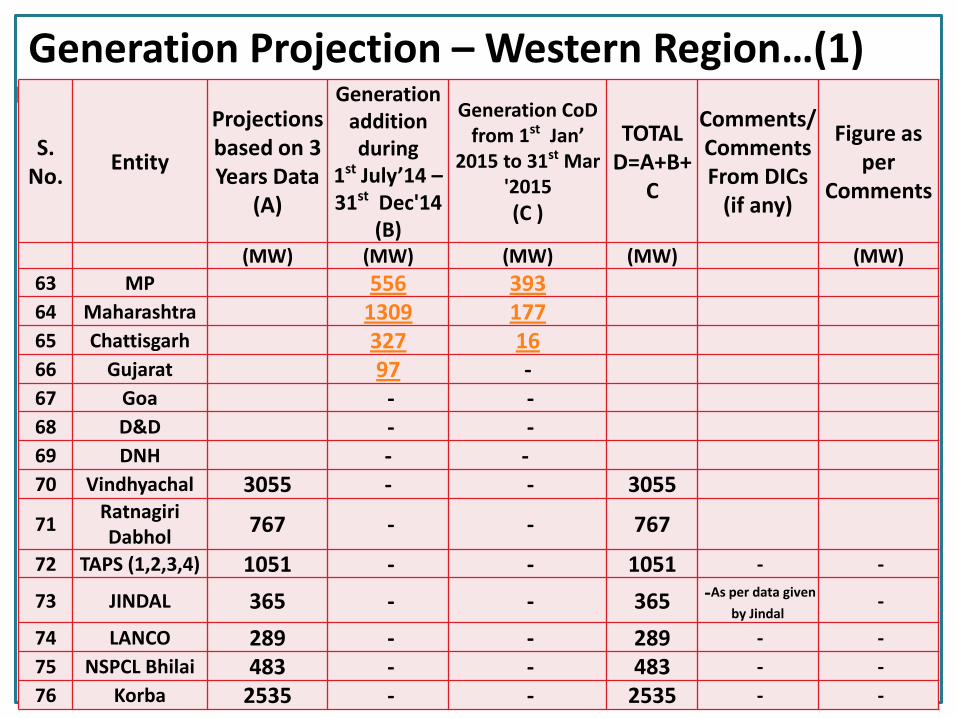
Generation Projection – Western Region…(1)
S.No.
Entity
Projections based on 3 Years Data
(A)
Generationaddition during
1st July’14 –31st Dec'14
(B)
Generation CoDfrom 1st Jan’
2015 to 31st Mar '2015
(C )
TOTALD=A+B+
C
Comments/ Comments From DICs
(if any)
Figure as per
Comments
(MW) (MW) (MW) (MW) (MW)
63 MP 556 39364 Maharashtra 1309 17765 Chattisgarh 327 1666 Gujarat 97 -67 Goa - -68 D&D - -69 DNH - -70 Vindhyachal 3055 - - 3055
71RatnagiriDabhol
767 - - 767
72 TAPS (1,2,3,4) 1051 - - 1051 - -
73 JINDAL 365 - - 365 -As per data given
by Jindal-
74 LANCO 289 - - 289 - -
75 NSPCL Bhilai 483 - - 483 - -
76 Korba 2535 - - 2535 - -
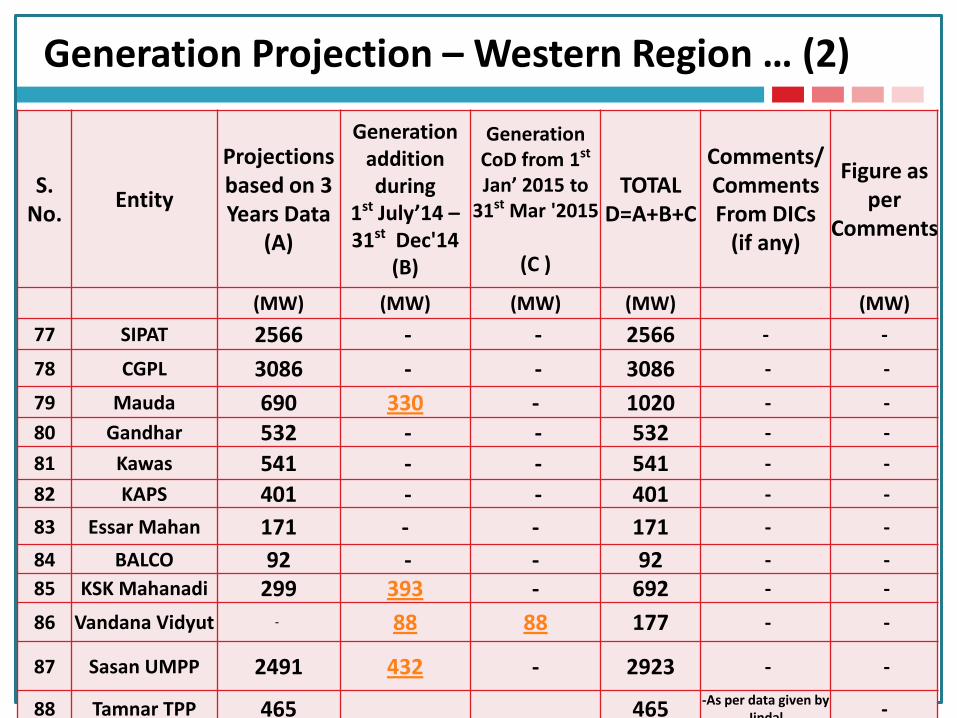
Generation Projection – Western Region … (2)
S.No.
Entity
Projections based on 3 Years Data
(A)
Generationaddition during
1st July’14 –31st Dec'14
(B)
Generation CoD from 1st
Jan’ 2015 to 31st Mar '2015
(C )
TOTALD=A+B+C
Comments/ Comments From DICs
(if any)
Figure as per
Comments
(MW) (MW) (MW) (MW) (MW)
77 SIPAT 2566 - - 2566 - -
78 CGPL 3086 - - 3086 - -
79 Mauda 690 330 - 1020 - -
80 Gandhar 532 - - 532 - -
81 Kawas 541 - - 541 - -
82 KAPS 401 - - 401 - -
83 Essar Mahan 171 - - 171 - -
84 BALCO 92 - - 92 - -
85 KSK Mahanadi 299 393 - 692 - -
86 Vandana Vidyut - 88 88 177 - -
87 Sasan UMPP 2491 432 - 2923 - -
88 Tamnar TPP 465 465 -As per data given by Jindal -
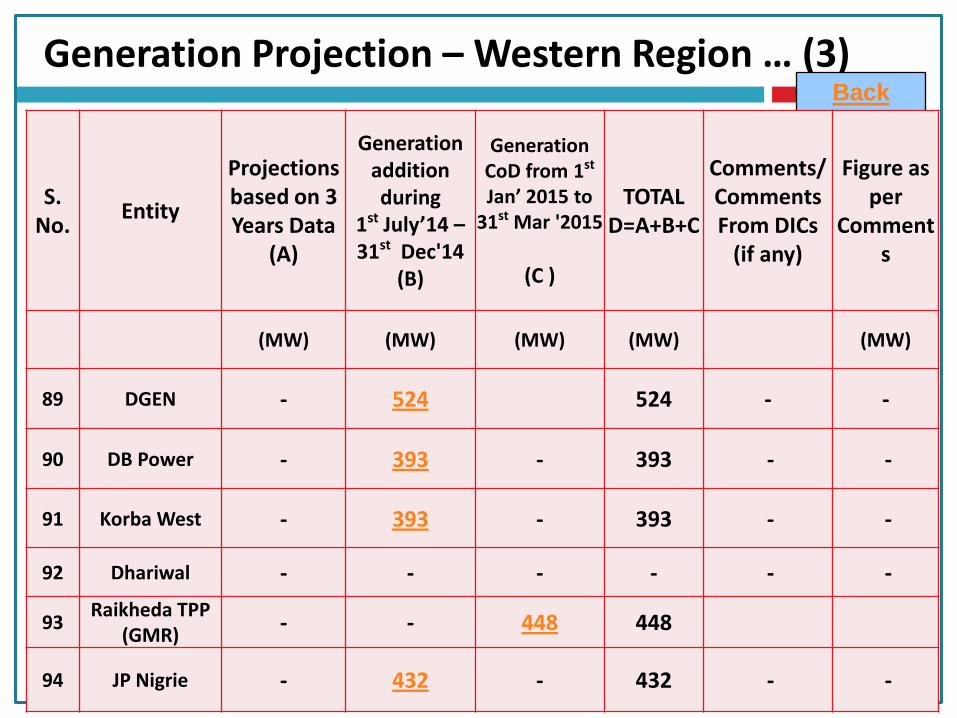
Generation Projection – Western Region … (3)Back
S.No.
Entity
Projections based on 3 Years Data
(A)
Generationaddition during
1st July’14 –31st Dec'14
(B)
Generation CoD from 1st
Jan’ 2015 to 31st Mar '2015
(C )
TOTALD=A+B+C
Comments/ Comments From DICs
(if any)
Figure as per
Comments
(MW) (MW) (MW) (MW) (MW)
89 DGEN - 524 524 - -
90 DB Power - 393 - 393 - -
91 Korba West - 393 - 393 - -
92 Dhariwal - - - - - -
93Raikheda TPP
(GMR)- - 448 448
94 JP Nigrie - 432 - 432 - -
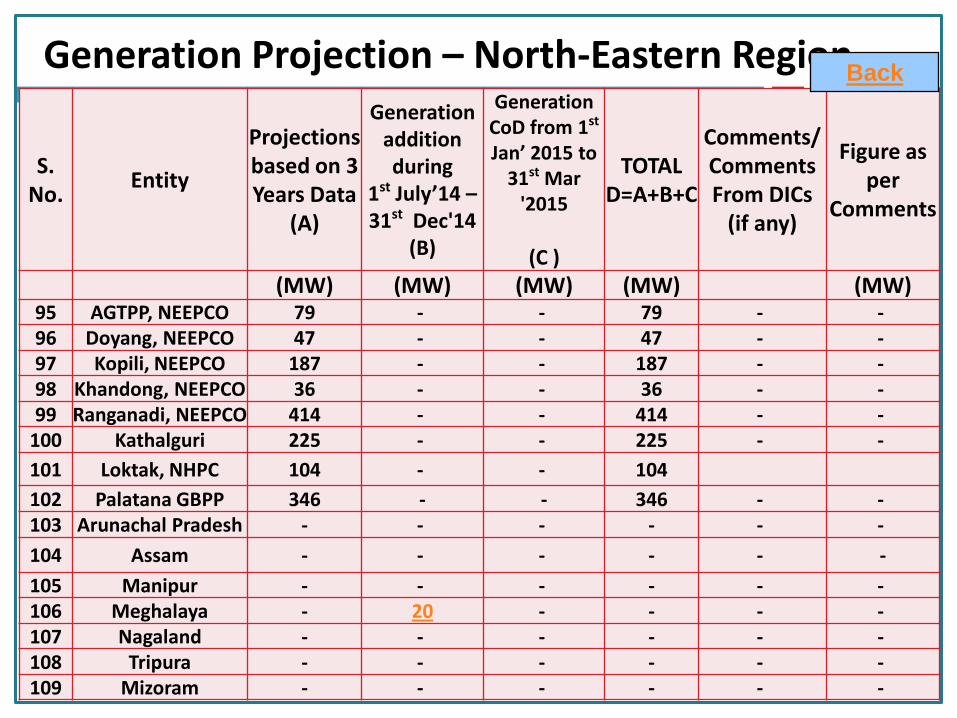
Generation Projection – North-Eastern Region
BackS.
No.Entity
Projections based on 3 Years Data
(A)
Generationaddition during
1st July’14 –31st Dec'14
(B)
Generation CoD from 1st
Jan’ 2015 to 31st Mar
'2015
(C )
TOTALD=A+B+C
Comments/ Comments From DICs
(if any)
Figure as per
Comments
(MW) (MW) (MW) (MW) (MW)95 AGTPP, NEEPCO 79 - - 79 - -96 Doyang, NEEPCO 47 - - 47 - -97 Kopili, NEEPCO 187 - - 187 - -98 Khandong, NEEPCO 36 - - 36 - -99 Ranganadi, NEEPCO 414 - - 414 - -
100 Kathalguri 225 - - 225 - -
101 Loktak, NHPC 104 - - 104
102 Palatana GBPP 346 - - 346 - -103 Arunachal Pradesh - - - - - -
104 Assam - - - - - -
105 Manipur - - - - - -106 Meghalaya - 20 - - - -107 Nagaland - - - - - -108 Tripura - - - - - -109 Mizoram - - - - - -
Back
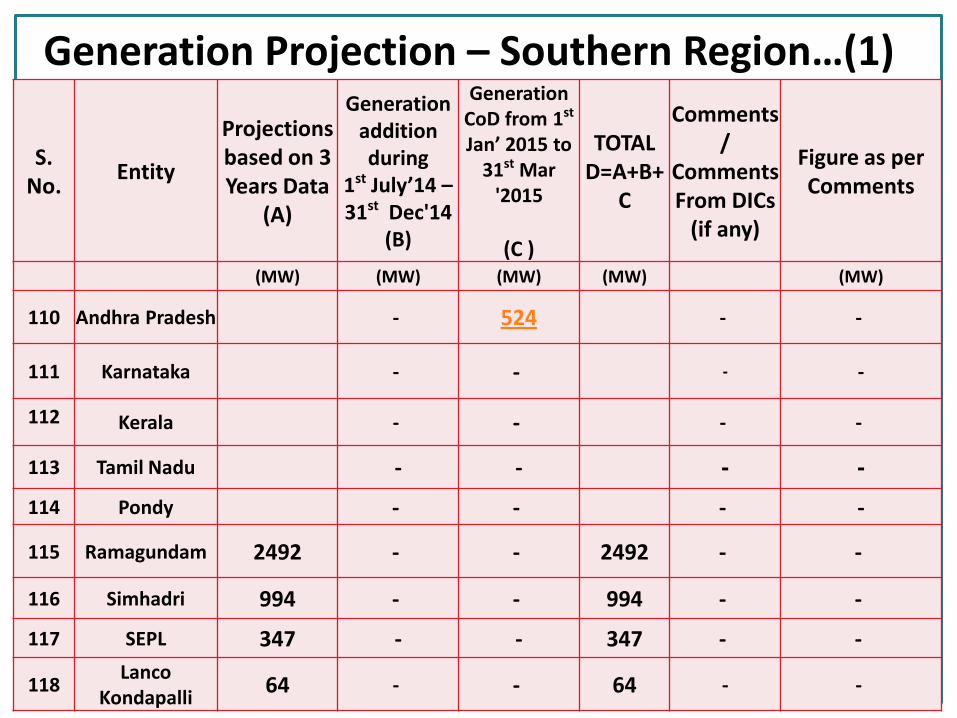
Generation Projection – Southern Region…(1)
S.No.
Entity
Projections based on 3 Years Data
(A)
Generationaddition during
1st July’14 –31st Dec'14
(B)
Generation CoD from 1st
Jan’ 2015 to 31st Mar
'2015
(C )
TOTALD=A+B+
C
Comments/
Comments From DICs
(if any)
Figure as per Comments
(MW) (MW) (MW) (MW) (MW)
110 Andhra Pradesh - 524 - -
111 Karnataka - - - -
112 Kerala - - - -
113 Tamil Nadu - - - -
114 Pondy - - - -
115 Ramagundam 2492 - - 2492 - -
116 Simhadri 994 - - 994 - -
117 SEPL 347 - - 347 - -
118Lanco
Kondapalli64 - - 64 - -
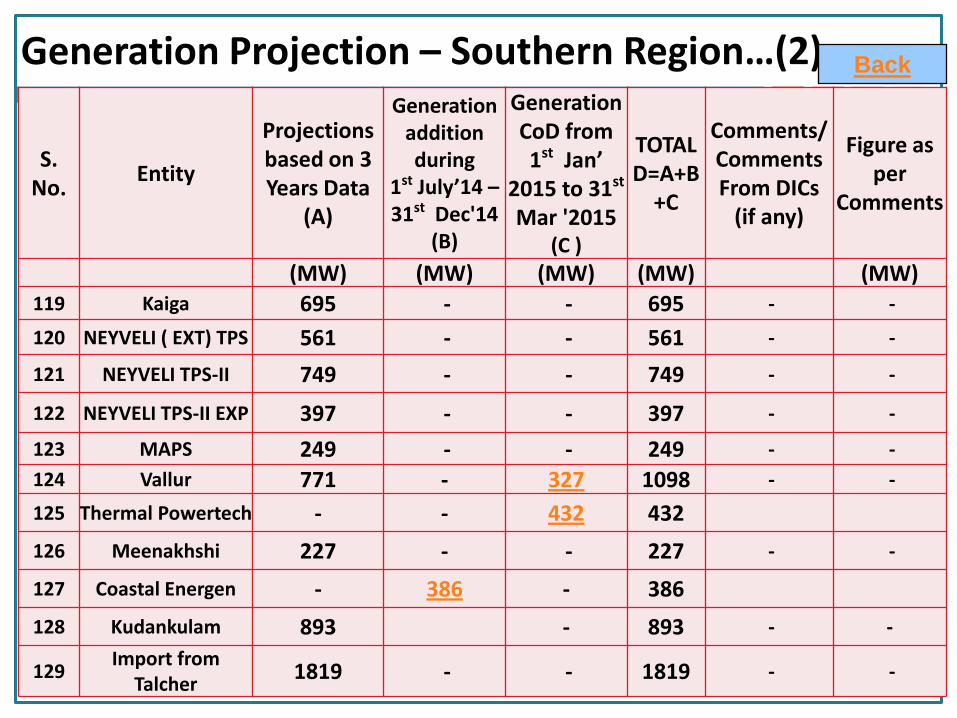
Generation Projection – Southern Region…(2) Back
S.No.
Entity
Projections based on 3 Years Data
(A)
Generationaddition during
1st July’14 –31st Dec'14
(B)
Generation CoD from 1st Jan’
2015 to 31st
Mar '2015(C )
TOTALD=A+B
+C
Comments/ Comments From DICs
(if any)
Figure as per
Comments
(MW) (MW) (MW) (MW) (MW)119 Kaiga 695 - - 695 - -
120 NEYVELI ( EXT) TPS 561 - - 561 - -
121 NEYVELI TPS-II 749 - - 749 - -
122 NEYVELI TPS-II EXP 397 - - 397 - -
123 MAPS 249 - - 249 - -
124 Vallur 771 - 327 1098 - -
125 Thermal Powertech - - 432 432
126 Meenakhshi 227 - - 227 - -
127 Coastal Energen - 386 - 386
128 Kudankulam 893 - 893 - -
129Import from
Talcher1819 - - 1819 - -
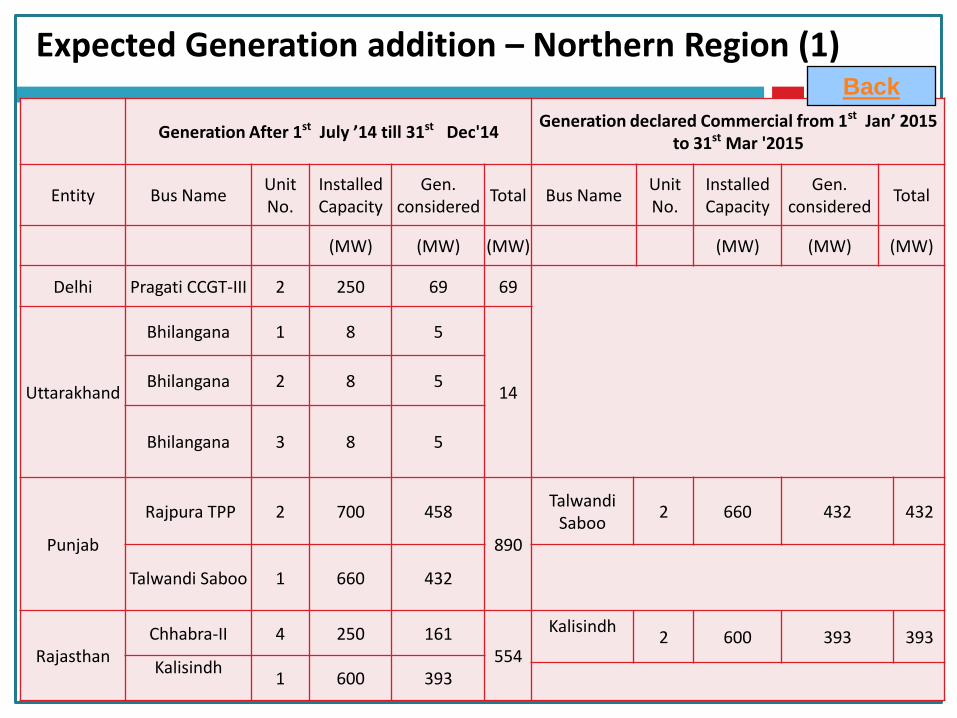
Expected Generation addition – Northern Region (1)
Generation After 1st July ’14 till 31st Dec'14Generation declared Commercial from 1st Jan’ 2015
to 31st Mar '2015
Entity Bus NameUnit No.
Installed Capacity
Gen. considered
Total Bus NameUnit No.
Installed Capacity
Gen. considered
Total
(MW) (MW) (MW) (MW) (MW) (MW)
Delhi Pragati CCGT-III 2 250 69 69
Uttarakhand
Bhilangana 1 8 5
14Bhilangana 2 8 5
Bhilangana 3 8 5
Punjab
Rajpura TPP 2 700 458
890
TalwandiSaboo
2 660 432 432
Talwandi Saboo 1 660 432
RajasthanChhabra-II 4 250 161
554
Kalisindh2 600 393 393
Kalisindh1 600 393
Back
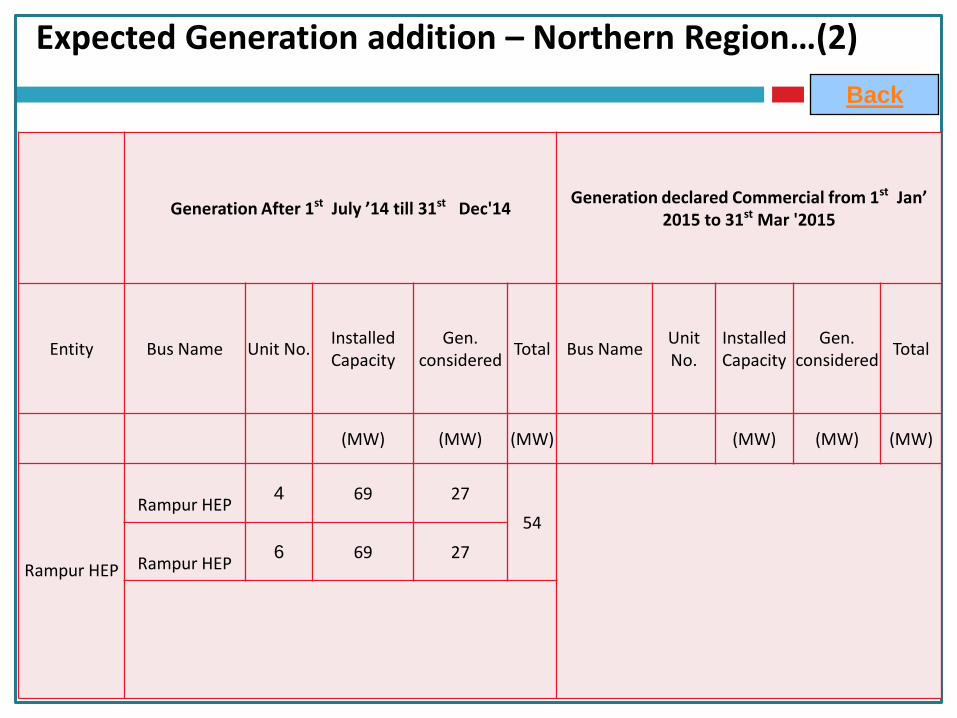
Expected Generation addition – Northern Region…(2)
Back
Generation After 1st July ’14 till 31st Dec'14Generation declared Commercial from 1st Jan’
2015 to 31st Mar '2015
Entity Bus Name Unit No.Installed Capacity
Gen. considered
Total Bus NameUnit No.
Installed Capacity
Gen. considered
Total
(MW) (MW) (MW) (MW) (MW) (MW)
Rampur HEP
Rampur HEP4 69 27
54
Rampur HEP6 69 27
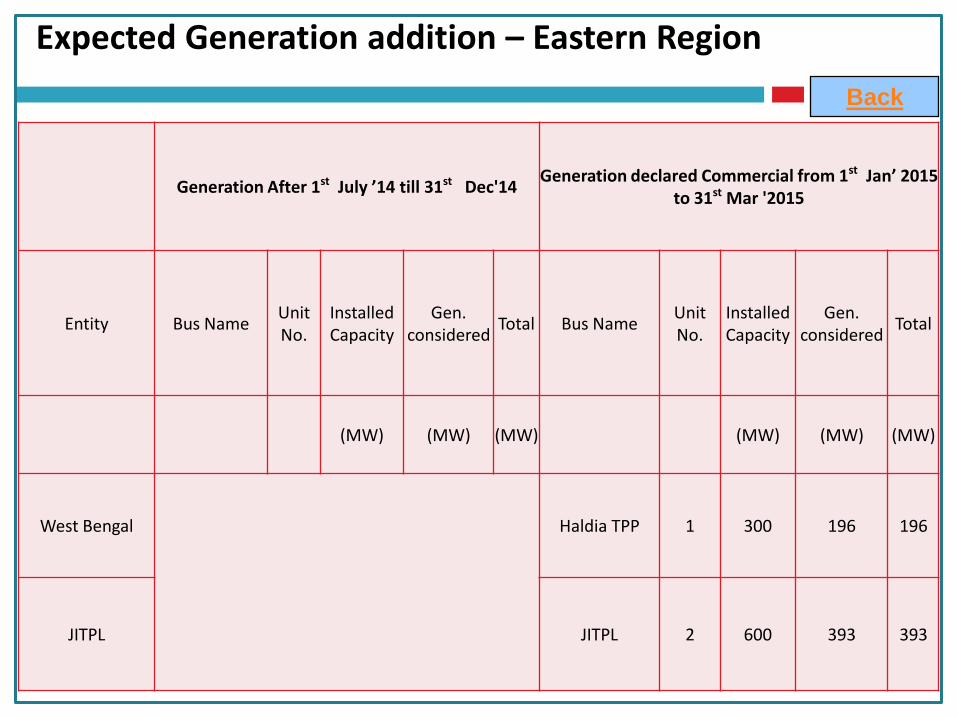
Expected Generation addition – Eastern Region
Back
Generation After 1st July ’14 till 31st Dec'14Generation declared Commercial from 1st Jan’ 2015
to 31st Mar '2015
Entity Bus NameUnit No.
Installed Capacity
Gen. considered
Total Bus NameUnit No.
Installed Capacity
Gen. considered
Total
(MW) (MW) (MW) (MW) (MW) (MW)
West Bengal Haldia TPP 1 300 196 196
JITPL JITPL 2 600 393 393

Expected Generation addition – Western Region…(1)Back
Generation After 1st July ’14 till 31st Dec'14Generation declared Commercial from 1st Jan’
2015 to 31st Mar '2015
Entity Bus NameUnit No.
Installed Capacity
Gen. considered
Total Bus Name Unit No.Installed Capacity
Gen. considered
Total
(MW) (MW) (MW) (MW) (MW) (MW)
MP
Satpura TPP Extn11 250 164
556 Malwa 2 600 393 393Malwa
1 600 393
Maharashtra
Vidarbha Power Ltd.
2 300 196
1309
Amravati(Indiabulls)
3 270 177 177
Bela TPP 1 270 177
Bhusawal II 2 500 327
Nasik(Sinner) (india-bulls)
1 270 177
Tirora TPP Ph-II 2 660 432
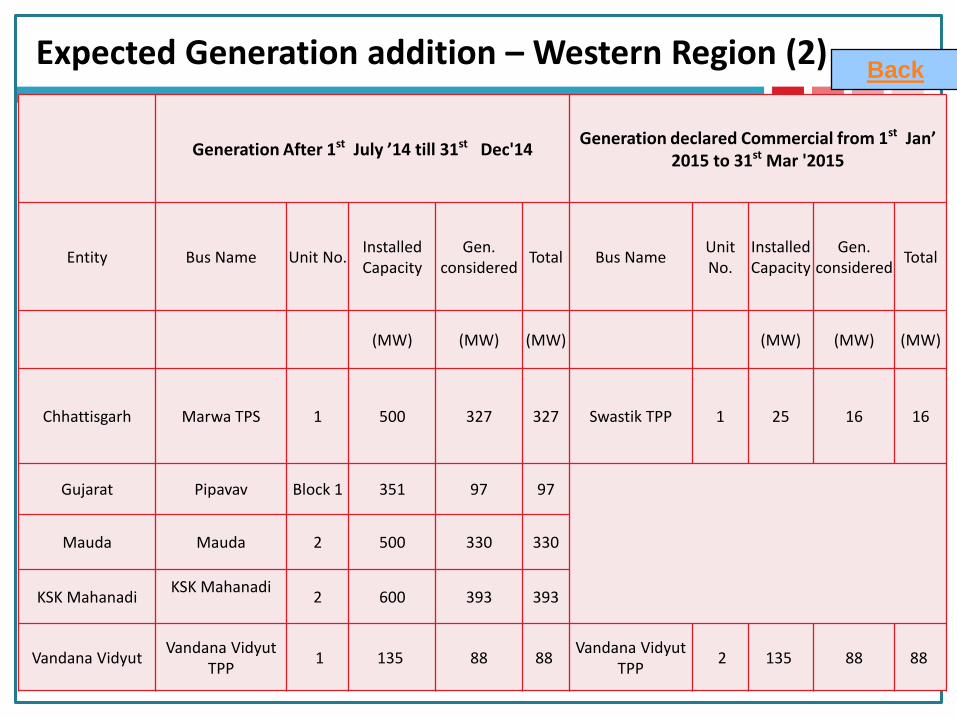
Expected Generation addition – Western Region (2)Back
Generation After 1st July ’14 till 31st Dec'14Generation declared Commercial from 1st Jan’
2015 to 31st Mar '2015
Entity Bus Name Unit No.Installed Capacity
Gen. considered
Total Bus NameUnit No.
Installed Capacity
Gen. considered
Total
(MW) (MW) (MW) (MW) (MW) (MW)
Chhattisgarh Marwa TPS 1 500 327 327 Swastik TPP 1 25 16 16
Gujarat Pipavav Block 1 351 97 97
Mauda Mauda 2 500 330 330
KSK MahanadiKSK Mahanadi
2 600 393 393
Vandana VidyutVandana Vidyut
TPP1 135 88 88
Vandana VidyutTPP
2 135 88 88
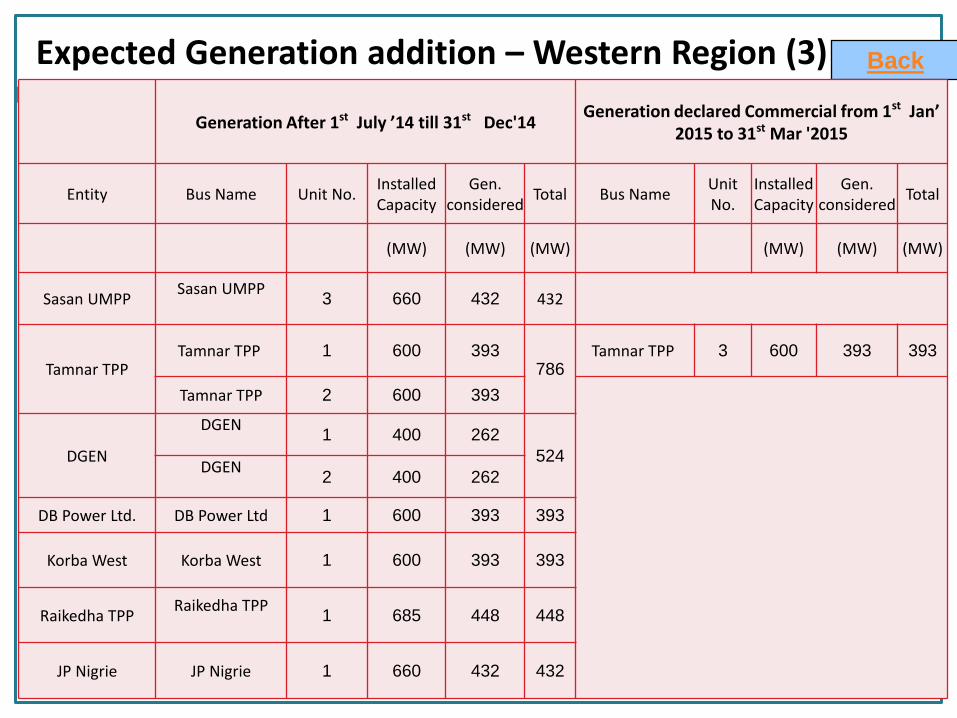
Expected Generation addition – Western Region (3) Back
Generation After 1st July ’14 till 31st Dec'14Generation declared Commercial from 1st Jan’
2015 to 31st Mar '2015
Entity Bus Name Unit No.Installed Capacity
Gen. considered
Total Bus NameUnit No.
Installed Capacity
Gen. considered
Total
(MW) (MW) (MW) (MW) (MW) (MW)
Sasan UMPPSasan UMPP
3 660 432 432
Tamnar TPPTamnar TPP 1 600 393
786Tamnar TPP 3 600 393 393
Tamnar TPP 2 600 393
DGEN
DGEN 1 400 262
524DGEN
2 400 262
DB Power Ltd. DB Power Ltd 1 600 393 393
Korba West Korba West 1 600 393 393
Raikedha TPPRaikedha TPP
1 685 448 448
JP Nigrie JP Nigrie 1 660 432 432
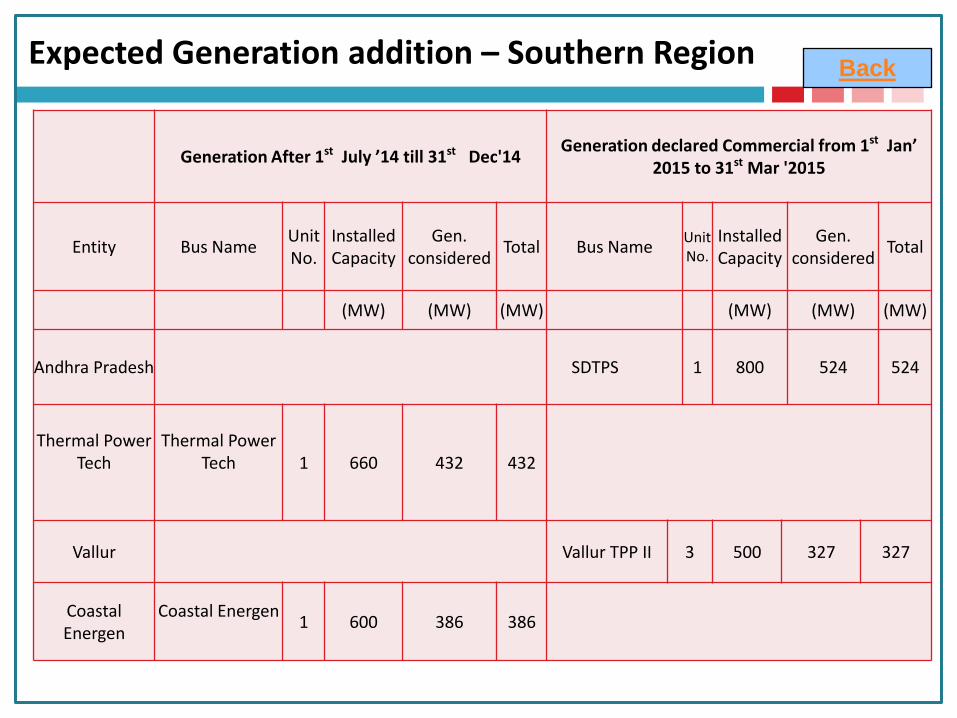
Expected Generation addition – Southern RegionBack
Generation After 1st July ’14 till 31st Dec'14Generation declared Commercial from 1st Jan’
2015 to 31st Mar '2015
Entity Bus NameUnit No.
Installed Capacity
Gen. considered
Total Bus NameUnit No.
Installed Capacity
Gen. considered
Total
(MW) (MW) (MW) (MW) (MW) (MW)
Andhra Pradesh SDTPS 1 800 524 524
Thermal PowerTech
Thermal PowerTech 1 660 432 432
Vallur Vallur TPP II 3 500 327 327
Coastal Energen
Coastal Energen1 600 386 386
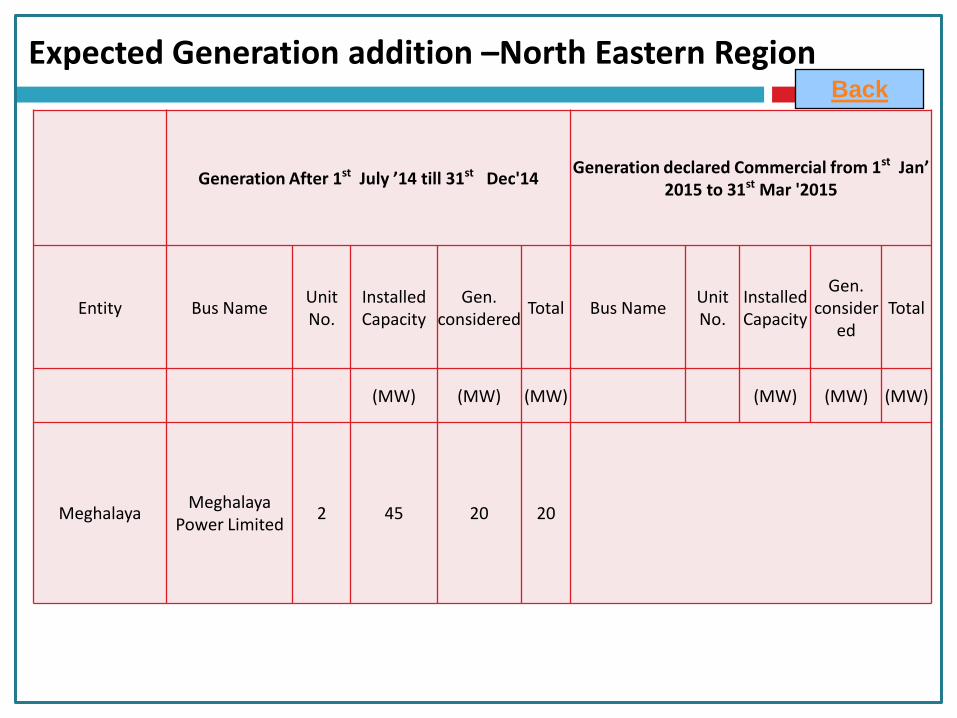
Expected Generation addition –North Eastern RegionBack
Generation After 1st July ’14 till 31st Dec'14Generation declared Commercial from 1st Jan’
2015 to 31st Mar '2015
Entity Bus NameUnit No.
Installed Capacity
Gen. considered
Total Bus NameUnit No.
Installed Capacity
Gen. consider
edTotal
(MW) (MW) (MW) (MW) (MW) (MW)
MeghalayaMeghalaya
Power Limited2 45 20 20