point count method 2.02
TRANSCRIPT

1
Point Count Method 2.02Mike Meier, December 31, 2003
This program helps with the counting and calculations done when using the systematic point countmethod for measuring the volume fraction of phases. You still have to use test grid and count pointsthat fall on the selected phase, but by using this program tallying the counts and calculating thevolume fraction and related sampling statistics is much easier, and the results can be printed.
RegistrationPlease register this software. To register simply fill out the registration form and mail or email itto me at the address given below. Your registration will give me a better idea of who is using thisprogram. I will not share your personal information with anyone.
CopyrightThis program is copyrighted by Mike Meier, July 1, 1999. All rights reserved.
DistributionEducational Users: Writing this program provided me with an opportunity to develop myDelphi/Windows programming abilities and to make something I could give to the students in mylaboratory courses. I am happy to offer it for free to non-profit educational users, including students,staff and faculty.
Commercial Users: Private and commercial users pay $10 for each copy of this program. Thisprogram represents quite a bit of midnight engineering and an investment in a number ofprogramming tools and many Windows and Delphi-programming books.
FilesThe following files are included with this program:1. Point Count Method 2.02.exe The program2. Point Count Method 2.02.pdf Documentation (this document)3. Registration Form.pdf Registration form
InstallationNo special installation procedures are required. Simply copy the program to the directory where youwant to run it from and then create a shortcut and place it in your "Start Menu".
Feedback and Contact InfoI am interested in hearing from people, particularly students and instructors, who use this program.Please email me at: [email protected] or mail me at:
Mike Meier515 K StreetDavis, CA 95616USAemail: [email protected]

2
Using Point Count MethodThis program is very easy to use. The basic procedure involves simply starting the program, settingup a measurement, and entering the counts. After five counts have been entered the results andaccompanying statistics will be displayed. Finally, print the report and quit or start anothermeasurement.
Step 1. Start the programWhen the program starts the main form (figure 1) is displayed. This form contains a grid where thecounts are entered and buttons for starting a new measurement, displaying the graph, printing thereport, etc. Most of these buttons will be disabled until a measurement has been set up.
Step 2. Set up a measurementClick the NEW button to bring up the dialog (figure 2) where you can enter basic measurementparameters.
Figure 1 Point Count Method’s main form.
3
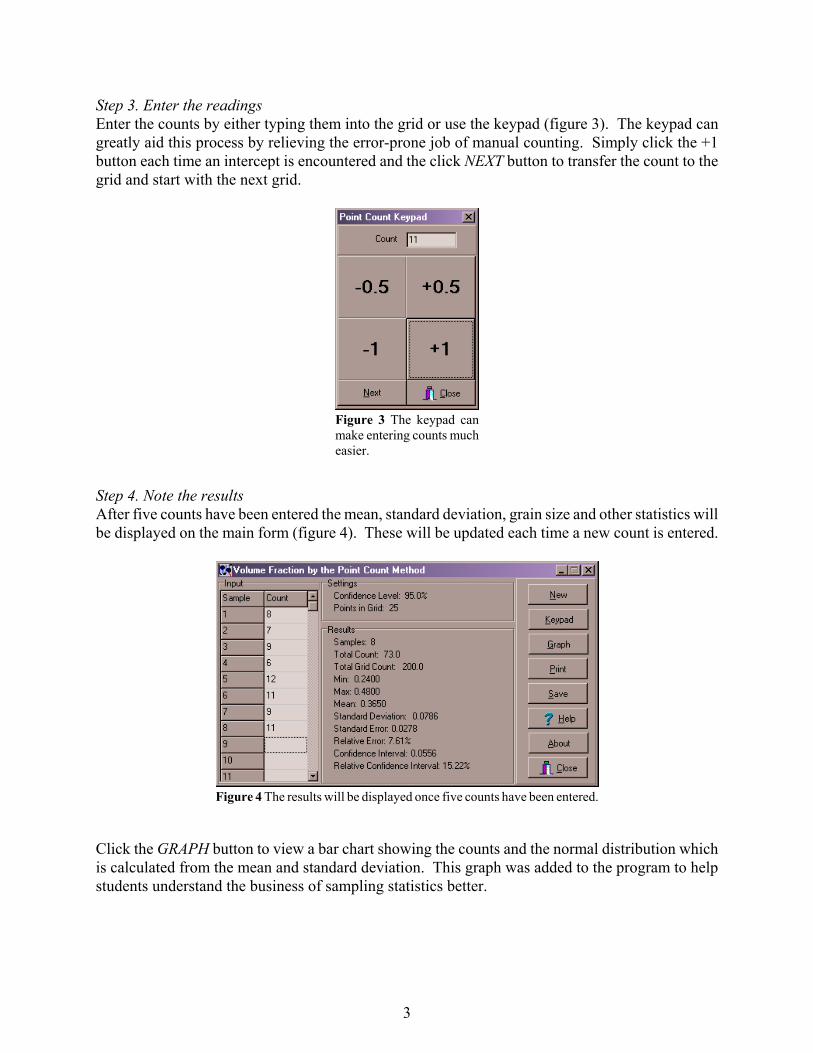
Step 3. Enter the readingsEnter the counts by either typing them into the grid or use the keypad (figure 3). The keypad cangreatly aid this process by relieving the error-prone job of manual counting. Simply click the +1button each time an intercept is encountered and the click NEXT button to transfer the count to thegrid and start with the next grid.
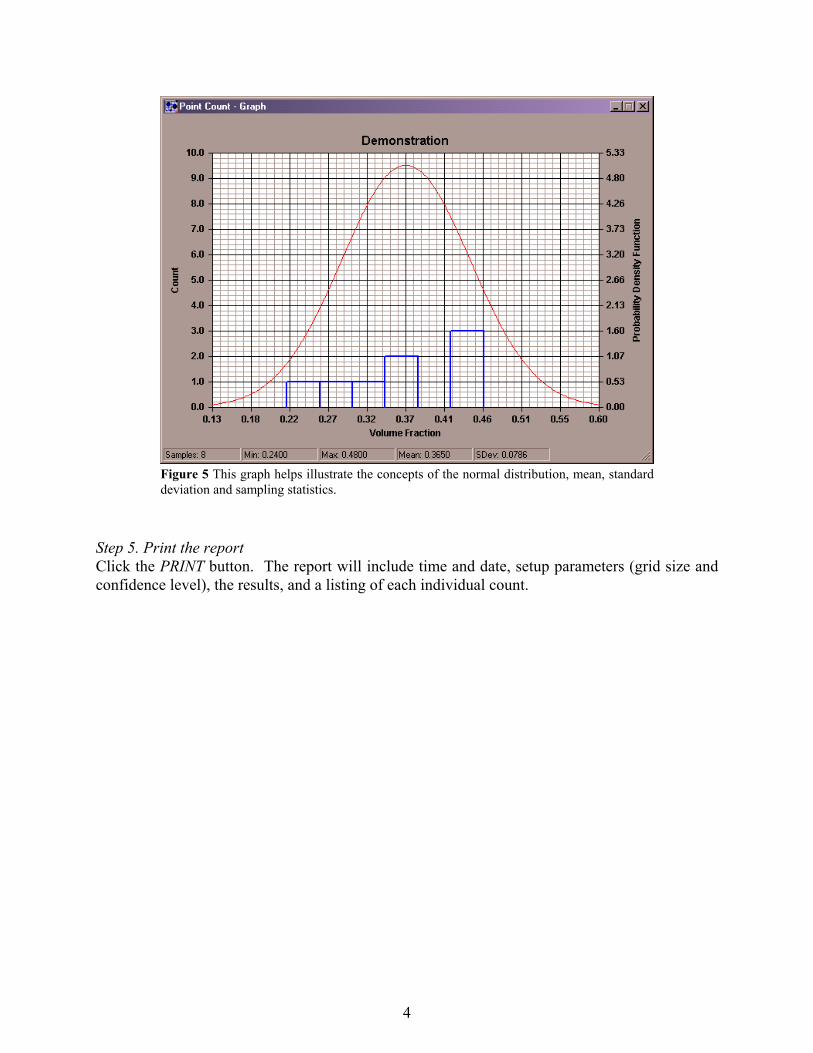
Step 4. Note the resultsAfter five counts have been entered the mean, standard deviation, grain size and other statistics willbe displayed on the main form (figure 4). These will be updated each time a new count is entered.
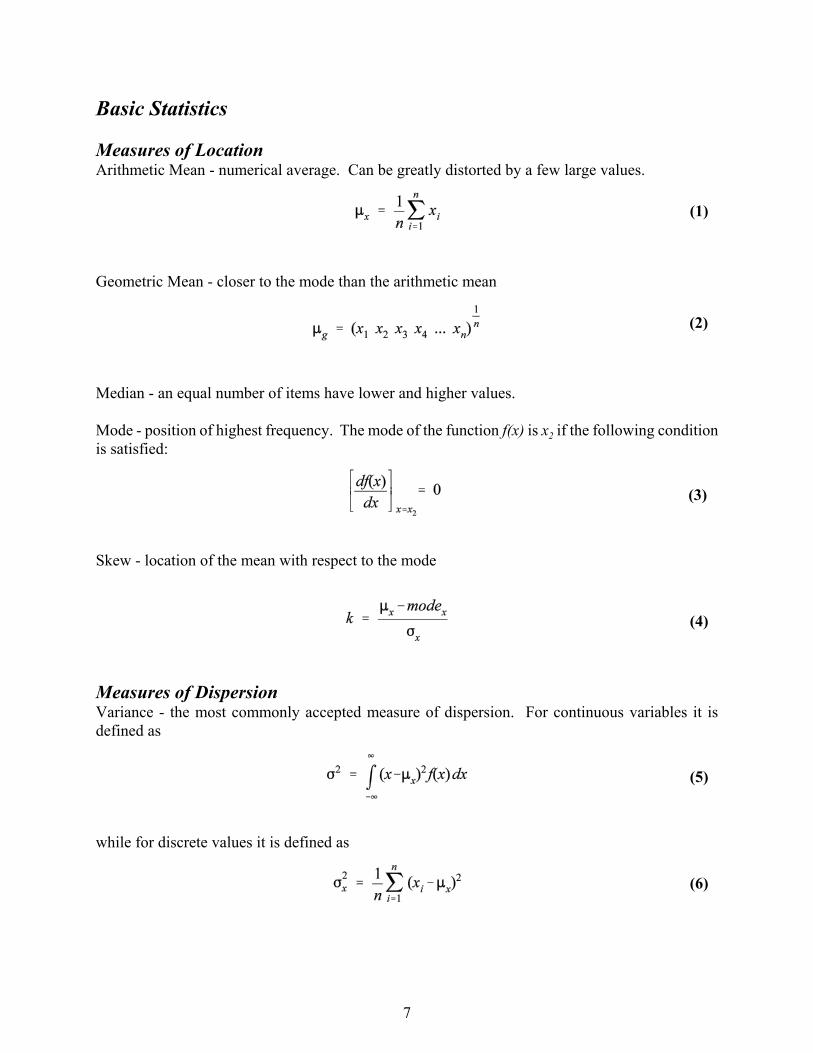
Click the GRAPH button to view a bar chart showing the counts and the normal distribution whichis calculated from the mean and standard deviation. This graph was added to the program to helpstudents understand the business of sampling statistics better.
Figure 3 The keypad canmake entering counts mucheasier.
Figure 4 The results will be displayed once five counts have been entered.
4
Step 5. Print the reportClick the PRINT button. The report will include time and date, setup parameters (grid size andconfidence level), the results, and a listing of each individual count.
Figure 5 This graph helps illustrate the concepts of the normal distribution, mean, standarddeviation and sampling statistics.

5
(1)
Measuring Volume Fraction
Mathematical BasisSampling a Two-Dimensional Structure Using Test PointsThe probability that one of an infinite number of test points falls on a group of particles (phase)contained in a sample area L2 is
where A is the total area covered by the particles and AA is the area fraction of particles. Thisrelationship is the basis of the point-count method which is used to estimate the volume fraction ofparticles or second phase in a microstructure. This is possible because the volume fraction is equalto the area fraction.
General MethodsVolume Fraction, Areal Analysis1. Trace the structure onto paper, weight the paper, cut out the parts containing the phase of interestand weigh these parts. The weight fraction equals the area fraction of phase in this section. Theaverage of a number of area fraction measurements gives one the volume fraction of phase.
2. Etch the specimen to color each phase differently. Use a computer to measure the area of eachphase (color). The average of a number area fraction measurements is equal to the volume fractionsof phases.
Volume Fraction, Lineal AnalysisUsing lines uniformly distributed but randomly oriented, the average length of the line segmentscrossing the selected phase is equal to the area fraction of the phase viewed in the planar section.The average of a number area fraction measurements is equal to the volume fractions of phases.
Volume Fraction, Point CountThe fraction of a number of points which fall on the selected phase is equal to the area fraction ofthat phase. The average of a number area fraction measurements is equal to the volume fractionsof phases.
Recommended MethodMeasurement of Volume Fraction of Phases Using the Systematic Point Count Method This method is based on the fact that the average fraction of points which fall on grains of aparticular phase is equal to the area fraction of the phase in the polished section and that the averageof these area fractions is equal to the volume fraction of the phase.
This method entails selecting a suitable array of points, overlaying it on the specimen and countingthe points which fall on a the selected phase, selecting a new are and counting again, and again untilthe desired error is obtained. The procedure is as follows:

6
(2)
Selection of gridC The most efficient method will be that which requires the least effort per observation.C Using a reticule grid and observing the polished sample is more efficient than using a
micrograph.C A square array of points is simple, symmetric and easy to obtain.C The optimum number of points in the grid large to minimize the effort of changing views (or
micrographs) and minimum to reduce the effort of counting.
Specifying the Maximum Allowable ErrorC Bear in mind that the effort involved varies inversely with the square of the error.C Specify the confidence level and the allowable confidence interval.C Obtain the variance from the confidence interval.
Counting C Select an area on the specimen where counts are to be made. This selection should be made
at random or per a predefined pattern so as to minimize bias.C Count each point which falls on the selected phase.C Assign a count value of ½ to points which fall on interphase boundaries.C After making a few preliminary counts you can estimate the number of points that must be
counted to give the desired error. This can be estimated using the following equation
where F2(VV) is the variance derived from the specified confidence interval.
Tabulate the ResultsC Compute the mean and the confidence interval.C Divide these by the number of points in the grid and multiply them by 100. This gives the
results in terms of the volume percent of phase.
7
(1)
(2)
(3)
(4)
(5)
(6)
Basic Statistics
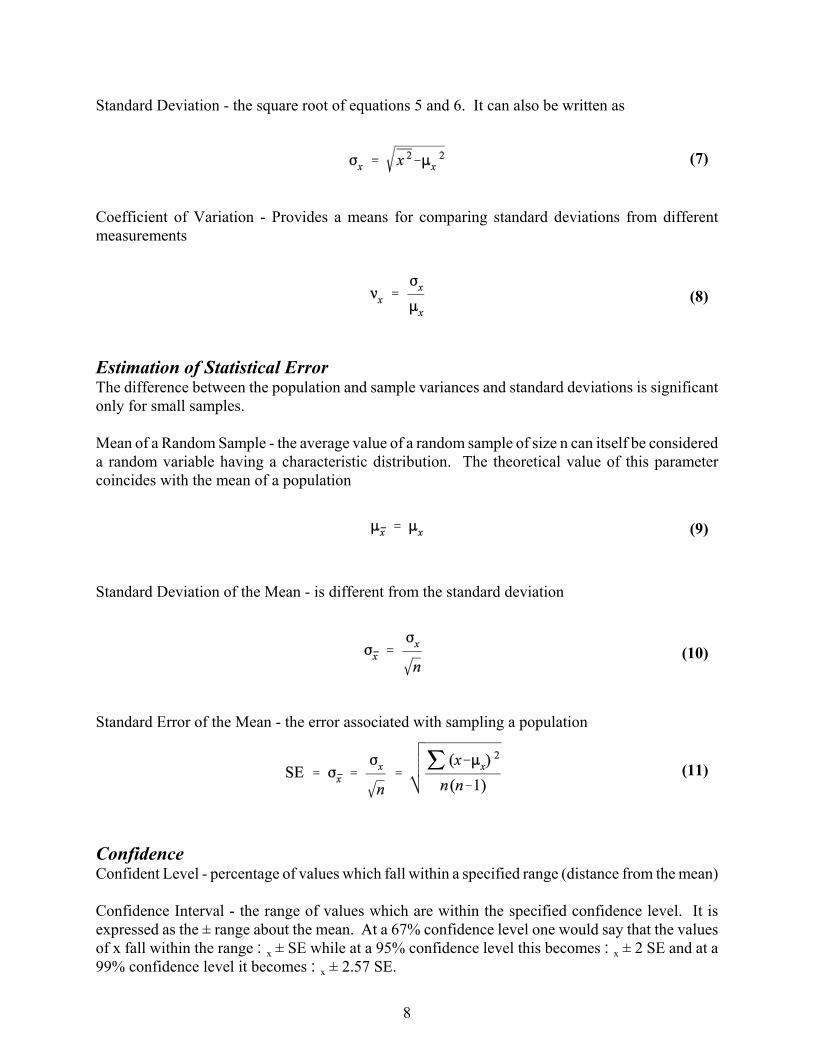
Measures of LocationArithmetic Mean - numerical average. Can be greatly distorted by a few large values.
Geometric Mean - closer to the mode than the arithmetic mean
Median - an equal number of items have lower and higher values.
Mode - position of highest frequency. The mode of the function f(x) is x2 if the following conditionis satisfied:
Skew - location of the mean with respect to the mode
Measures of DispersionVariance - the most commonly accepted measure of dispersion. For continuous variables it isdefined as
while for discrete values it is defined as
8
(7)
(8)
(9)
(10)
(11)
Standard Deviation - the square root of equations 5 and 6. It can also be written as
Coefficient of Variation - Provides a means for comparing standard deviations from differentmeasurements
Estimation of Statistical ErrorThe difference between the population and sample variances and standard deviations is significantonly for small samples.
Mean of a Random Sample - the average value of a random sample of size n can itself be considereda random variable having a characteristic distribution. The theoretical value of this parametercoincides with the mean of a population
Standard Deviation of the Mean - is different from the standard deviation
Standard Error of the Mean - the error associated with sampling a population
ConfidenceConfident Level - percentage of values which fall within a specified range (distance from the mean)
Confidence Interval - the range of values which are within the specified confidence level. It isexpressed as the ± range about the mean. At a 67% confidence level one would say that the valuesof x fall within the range :x ± SE while at a 95% confidence level this becomes :x ± 2 SE and at a99% confidence level it becomes :x ± 2.57 SE.

9
(12)
(13)
Frequency FunctionsNormal Distribution - the type one is probably most familiar with
Log-Normal Distribution - often observed in grain and particle size distributions (is skewed towardslower values of x)
where Fg is the geometric standard deviation.
Figure 1 Plot of a normal distribution that has its mean value at 50 and astandard deviation of 30. The cumulative distribution is shown in red.

10
Figure 2 This is an example of a log-normal distribution. The medianvalue is 9.06 and the average is 13.5.

11
Figure 1 Artificial duplex microstructure.
Measuring Volume Fraction of Phases Exercise
Exercise 1 – Measuring the Volume Fraction in a Duplex MicrostructureFigure 1 shows an artificial microstructure (generated using Adobe Photoshop) that represents aduplex microstructure. Make a grid using graph paper and use the systematic point count methodto determine the volume fractions of the light and dark phases. Your results should reflect a 95%confidence level and the confidence interval should be less than 10% of the mean.
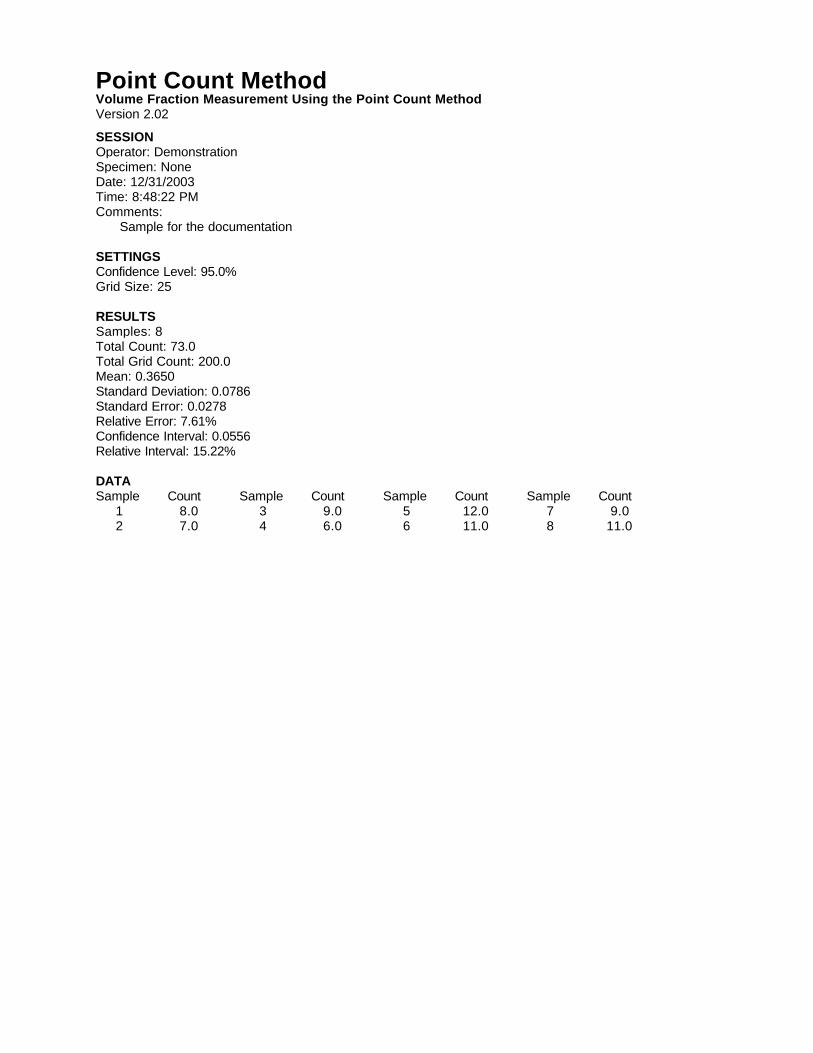
Point Count MethodVolume Fraction Measurement Using the Point Count MethodVersion 2.02
SESSIONOperator: DemonstrationSpecimen: NoneDate: 12/31/2003Time: 8:48:22 PMComments:
Sample for the documentation
SETTINGSConfidence Level: 95.0%Grid Size: 25
RESULTSSamples: 8Total Count: 73.0Total Grid Count: 200.0Mean: 0.3650Standard Deviation: 0.0786Standard Error: 0.0278Relative Error: 7.61%Confidence Interval: 0.0556Relative Interval: 15.22%
DATASample Count Sample Count Sample Count Sample Count 1 8.0 3 9.0 5 12.0 7 9.0 2 7.0 4 6.0 6 11.0 8 11.0