point- and non-point source pollution in nearshore … · adriana felix-salgado office of water...
TRANSCRIPT
Photo image area measures 2” H x 6.93” W and can be masked by a collage strip of one, two or three
images.
The photo image area is located 3.19” from left and 3.81” from top of page.
Each image used in collage should be reduced or cropped to a maximum of 2” high, stroked with a 1.5
pt white frame and positioned edge-to-edge with accompanying images.
Fran Kremer, Ph.D.Office of Research and Development
Adriana Felix-SalgadoOffice of Water
Point- and non-point source pollution in nearshore coastal and inland waters
Office of Research and DevelopmentSeptember 27, 2017
10/10/20171 U.S. Environmental Protection Agency
• Where are the geographic areas of
interest?
• What are the sources of (satellite) data?
• How do you (or does your organization)
use satellite data for your (their) routine
water quality monitoring or research
activities?
• How do you envision to use products
if they become available on a routine
basis? Or how satellite data can
further help your work or
organization’s activities
Meeting Focus
Point- and Non-point source pollution in
nearshore coastal and inland waters
•Pipelines along inland waterways or coastal areas can benefit from satellite data
• Inland water impacts from landfills.
• Data on groundwater levels, subsidence, and associated drought conditions can assist in assessing water quality impacts
• Develop a strategy to integrate land-based, aerial, and satellite monitoring data to provide improved tools to protect our water resources
10/10/20172 U.S. Environmental Protection Agency
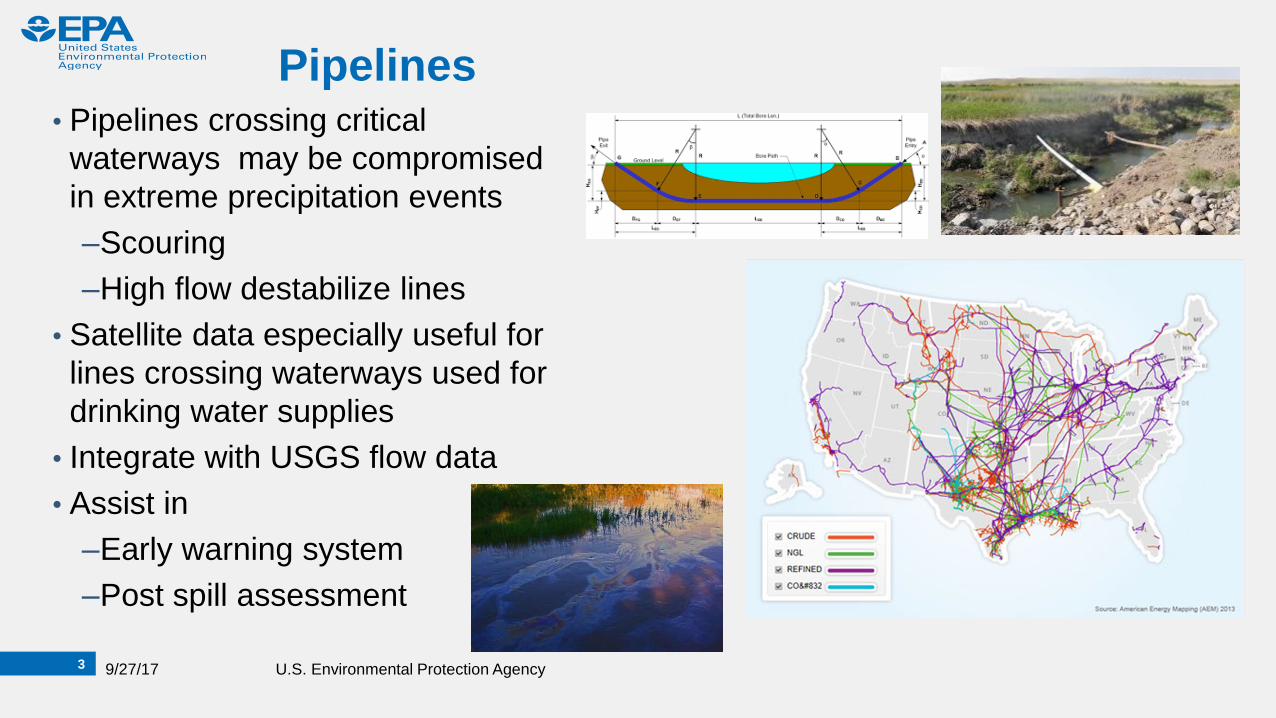
Pipelines• Pipelines crossing critical
waterways may be compromised
in extreme precipitation events
–Scouring
–High flow destabilize lines
• Satellite data especially useful for
lines crossing waterways used for
drinking water supplies
• Integrate with USGS flow data
• Assist in
–Early warning system
–Post spill assessment
9/27/173 U.S. Environmental Protection Agency
4
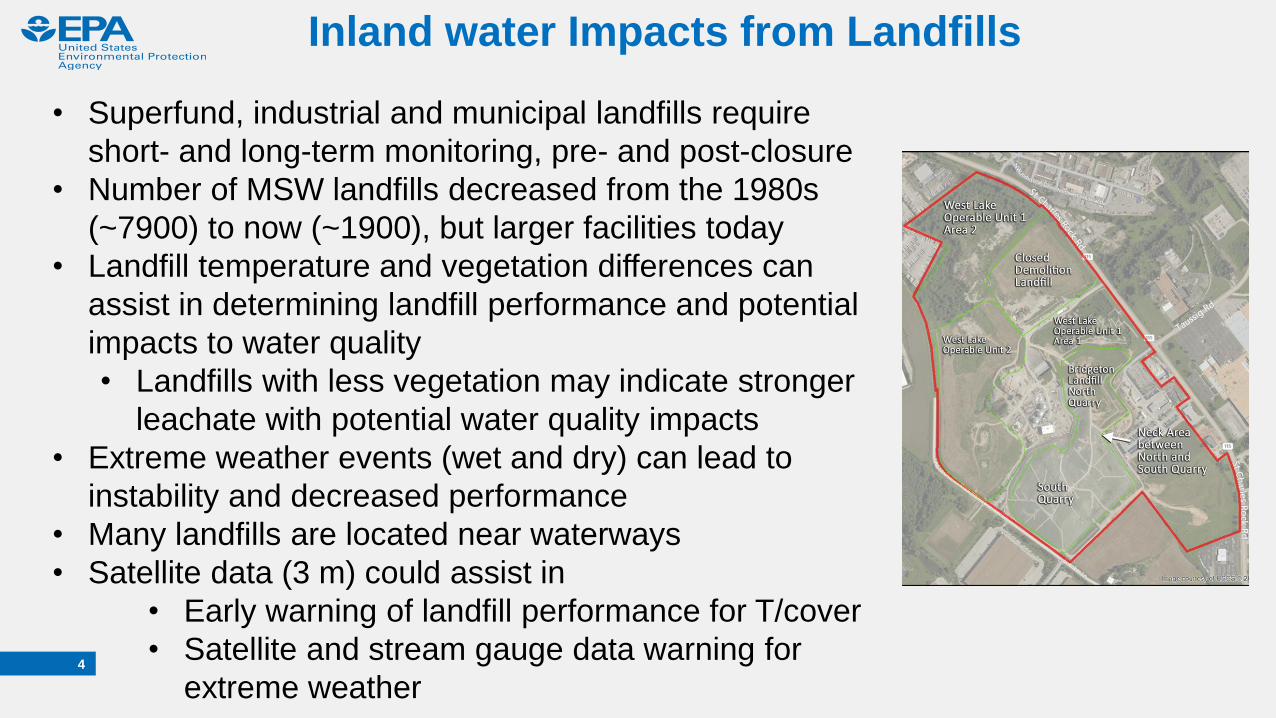
• Superfund, industrial and municipal landfills require
short- and long-term monitoring, pre- and post-closure
• Number of MSW landfills decreased from the 1980s
(~7900) to now (~1900), but larger facilities today
• Landfill temperature and vegetation differences can
assist in determining landfill performance and potential
impacts to water quality
• Landfills with less vegetation may indicate stronger
leachate with potential water quality impacts
• Extreme weather events (wet and dry) can lead to
instability and decreased performance
• Many landfills are located near waterways
• Satellite data (3 m) could assist in
• Early warning of landfill performance for T/cover
• Satellite and stream gauge data warning for
extreme weather
Inland water Impacts from Landfills

10/10/20175 U.S. Environmental Protection Agency
Drought and Ground Water Quality:
Understanding the Spatial Implications of
Contaminants Impacting Ground Water Supplies
Base scenario with 2 pumping wells
and 4 sources
3rd well is vulnerable to all sources,
one original well no longer vulnerable
Change pumping rate of 1 well
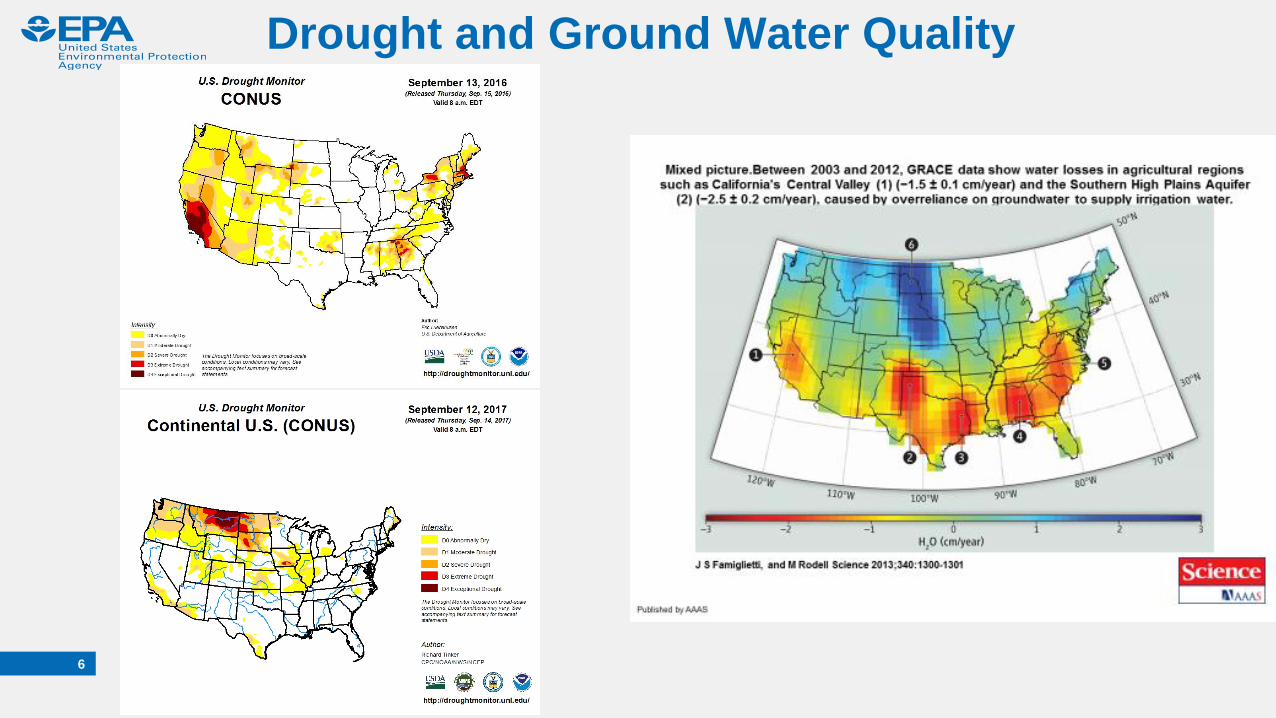
Drought and Ground Water Quality
6
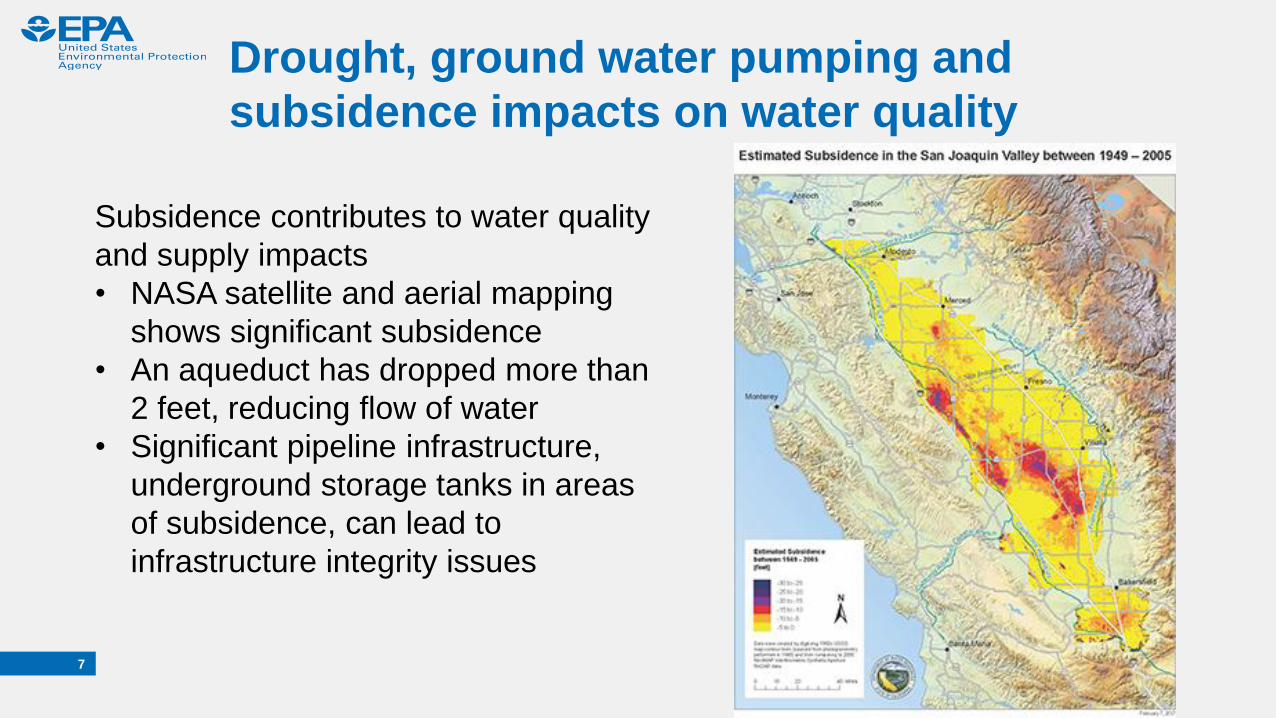
Drought, ground water pumping and
subsidence impacts on water quality
7
Subsidence contributes to water quality
and supply impacts
• NASA satellite and aerial mapping
shows significant subsidence
• An aqueduct has dropped more than
2 feet, reducing flow of water
• Significant pipeline infrastructure,
underground storage tanks in areas
of subsidence, can lead to
infrastructure integrity issues
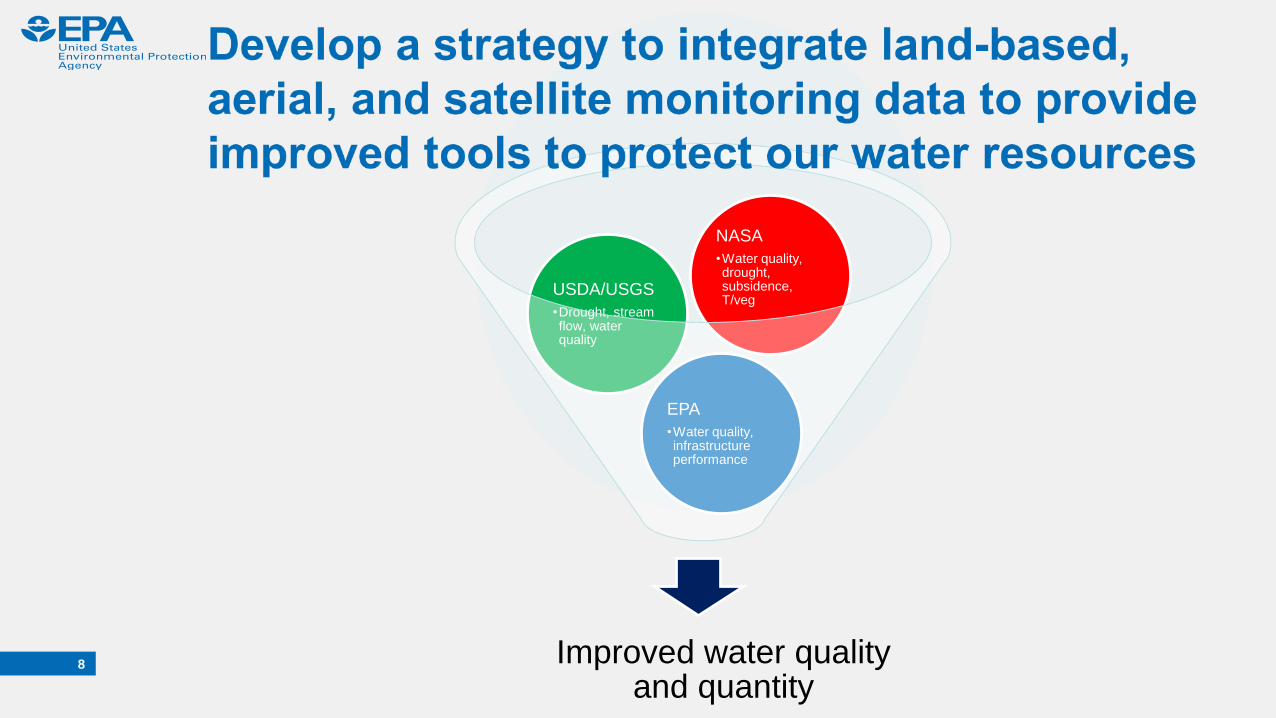
8 Improved water quality and quantity
EPA
•Water quality, infrastructure performance
USDA/USGS
•Drought, stream flow, water quality
NASA
•Water quality, drought, subsidence, T/veg
Contacts
• Dr. Fran Kremer – [email protected]
• Dr. Adriana Felix-Salgado – [email protected]
• Oil Spills
–Dr. Robyn Conmy – [email protected]
• Landfills
–Dr. Thabet Tolaymat – [email protected]
• Ground water contaminant transport/modeling
–Dr. Jim Weaver – [email protected]
9