pobreza, exclusión y desigualdad -...
TRANSCRIPT
Pobreza, exclusión y desigualdad
Jorge Granda Aguilar
Pobreza, exclusión y desigualdad
Índice
Presentación . . . . . . . . . . . . . . . . . . . . . . . . . . . . . . . . . . . . . . . . . . . . . . 9
Pobreza, exclusión y desigualdad . . . . . . . . . . . . . . . . . . . . . . . . . . . . . . 11Estudio IntroductorioJorge Granda Aguilar
POBREZA, DETERMINANTES E IMPACTOS
Hogares, empleo y pobreza en Argentina: ¿estructuras persistentes? . . . . . . . . . . . . . . . . . . . . . . . . . . . . . . . . . . . . 33Rosalía Cortés, Fernando Groisman
Movilidad de la pobreza y vulnerabilidad en Argentina: hechos y orientaciones de política . . . . . . . . . . . . . . . . . . . . . . . . . . . . . 49Luis Beccaria, Roxana Maurizio
Intergenerational transmission of education: gender and ethnicity in Guatemala . . . . . . . . . . . . . . . . . . . . . . . . . . . . 73Priscila Hermida
Erradicar el hambre como primer paso hacia la cohesión social en América Latina . . . . . . . . . . . . . . . . . . . . . . . . . . . 99Jose Luis Vivero, Carmen Porras
© De la presente edición:
FLACSO, Sede EcuadorLa Pradera E7-174 y Diego de AlmagroQuito - EcuadorTelf.: (593-2) 323 8888Fax: (593-2) 3237960www.flacso.org.ec
Ministerio de Cultura del EcuadorAvenida Colón y Juan León MeraQuito-EcuadorTelf.: (593-2) 2903 763www.ministeriodecultura.gov.ec
ISBN: 978-9978-67-186-3 Cuidado de la edición: Bolívar Lucio N. Diseño de portada e interiores: Antonio MenaImprenta: CrearimagenQuito, Ecuador, 20081ª. edición: noviembre, 2008
POBREZA Y POLÍTICA PÚBLICA
Towards a new consensus poverty reduction strategies for Bolivia. . . . . . . . . . . . . . . . . . . . . . . . . . . . . . . . . . . . . . . . 269Jorge Buzaglo and Alvaro Calzadilla
Políticas sociales y programas de transferencia monetaria condicionada en América Latina . . . . . . . . . . . . . . . . . . . . . . . . . . . . . . 303Juan Ponce
Las políticas sociales para la adolescencia y los procesos de ampliación de derechos . . . . . . . . . . . . . . . . . . . . . . . . . 317Valeria Llobet
Preferencias adaptativas: un desafío para el desarrollo de las políticas sociales . . . . . . . . . . . . . . . . . . . . . . . . . . . . 335Gustavo Pereira
Procesos de campesinización y reforma agraria: los ocupantes de tierras privadas en Misiones (Argentina). . . . . . . . . . . 121Denis Baranger
Las familias: su papel en la superación de la pobreza . . . . . . . . . . . . . . . . . . . . . . . . . . . . . . . . . . . . . . . . . . . . . 139Luz María López Montaño
EXCLUSIÓN Y COHESIÓN SOCIAL
Reflexiones sobre la trilogía: pobreza-crecimiento y desigualdad en América Latina ¿Qué se necesita para la cohesión social? . . . . . . . . . . . . . . . . . . . . . . . . . . . . . . . . . . . . . 161Daniel Sotelsek, Leonor Margalef
Cohesión social: entre inclusión social y sentido de pertenencia . . . . . . . . . . . . . . . . . . . 189Martín Hopenhayn
La cohesión social en Iberoamérica . . . . . . . . . . . . . . . . . . . . . . . . . . . . 205Tomás Mallo y Maribel Rodríguez
Envejecer en el siglo XXI en América Latina . . . . . . . . . . . . . . . . . . . . . 223Paulina Osorio
La exclusión social y el derecho del individuo y la familia: el caso del Programa de la Bolsa de la Familia en el Brasil . . . . . . . . . . 233Silvana Aparecida Mariano
Enfoques sobre vulnerabilidad social y conformación de agentes productivos agrarios: reflexiones a partir del caso argentino . . . . . . . . . . . . . . . . . . . . . . . . . . . . . . . . . . . . . . . . . 249Clara Craviotti
73
Intergenerational transmission of education: gender and ethnicity in Guatemala
Priscila Hermida*
* University of Essex
There is reason to believe that the high degree of inequality as well asstratification prevalent in developing countries may contribute to greaterpersistence in the intergenerational transmission of opportunities. Thispaper describes the intergenerational transmission of educational attain-ment in Guatemala through the degree of regression to the mean of theschooling of children compared to the schooling of their parents, inter-preted as a measure of equality of opportunity in Guatemalan society.The approach extends the study of the process of intergenerational trans-mission of educational attainment in the developing world, to includeethnicity and gender as factors associated with this process. The resultsshow that educational achievement exhibits higher persistence from gen-eration to generation among indigenous people, and for women. Thereare systematic differences in the degree of persistence in educationalattainment according to ethnicity with indigenous people being lessmobile than whites. People do not tend to regress to the mean of the pop-ulation in terms of their educational attainment –a sing of relative equal-ity of opportunity–, but that an individual’s education and chances in lifeare strongly correlated with those of his parents.
in the human capital of each child to the point at which the marginal rateof return is equal to the marginal cost. Given perfect credit and informa-tion markets, the optimal level of investment in education is reachedregardless of family background characteristics, including wealth or eth-nicity. However, in less developed countries wealth tends to be highly cor-related with ethnicity and markets do not function efficiently. Liquidityconstraints become very important in this setting, since great proportionsof the populations tend to be poor - lacking any form of collateral- andcredit markets very underdeveloped. If one ethnic group is systematical-ly poorer than others, different groups will exhibit different levels ofinvestment in education, either given by differences in credit constraints(cost of education) or rates of return (due to perceived or actual discrim-ination in the labour market)2. But not only can the average level ofschooling be influenced by inequality in the distribution of assets: disad-vantaged groups for which returns to education are lower and that faceliquidity constraints due to poverty, may show greater persistence in edu-cational attainment.
Intergenerational transmission of schooling is the result of both genet-ics –for instance, the transmission of intelligence or ability–, and environ-mental factors –like learning skills, nutritional status, and preferences foreducation–. How would these mechanisms work for different ethnicgroups if horizontal inequalities are widespread and social exclusion relat-ed to ethnicity is present? Although it would be impossible to claim thatability and intelligence are distributed in a non random fashion condi-tional on ethnicity or gender, the fact that indigenous people inGuatemala are by large at the bottom of both the education and incomedistribution in a very unequal society, can lead us to expect differences inmobility for whites and non whites due to direct and indirect effects ofParental Education, assortative matching of parents on education, andsocial exclusion.
Intergenerational transmission of education
75
Introduction
There is vast evidence that income and education are transmitted fromgeneration to generation1. These intergenerational correlations haveimplications for the degree of equality of opportunity in a particularsociety and make its members more or less mobile. Schooling in partic-ular is a mechanism of intergenerational mobility because it increases theprobability of an individual’s children to be educated, and thus increas-es their future expected income. If schooling is strongly affected by fam-ily background, then intergenerational correlation in incomes acrossfamilies will be high and social mobility will be low. Intergenerationaltransmission of schooling affects individuals’ opportunities and theirwell-being over time.
Not much is known about the process of intergenerational transmis-sion of educational attainment in the developing world, mainly due tothe lack of longitudinal datasets. There is however reason to believe thatthe high degree of inequality as well as stratification prevalent in develop-ing countries may contribute to greater persistence in the intergenera-tional transmission of opportunities. This paper will focus on the inter-generational transmission of educational attainment in Guatemala andexplore the effect of high inequality in the distribution of assets betweenthe white and indigenous ethnic groups on social mobility. The degree ofregression to the mean of the schooling of children compared to theschooling of their parents will be interpreted as a measure of equality ofopportunity in Guatemalan society.
Motivation and Hypotheses
The determinants of the parental decision on the optimal level of educa-tion of children were examined by Becker (1975). Assuming altruism andperfect capital markets, parents maximize the family wealth by investing
Priscila Hermida
74
1 For studies concerning the intergenerational transmission of income, see Solon (1992) andZimmerman (1992). For studies exploring the transmission of educational outcomes, seeBehrman et al (2001), Borjas (1992) and Mulligan (1999).
2 As noted, “..differences in opportunities, such as those resulting from discrimination and nepo-tism, affect demand curves.” Becker (1975: 110)
result of the civil war, fewer families engage now in agricultural activities.Rural economies based on grain production have given way to small-scalecommercial agriculture and activities in services, transport and other non-agricultural activities. During the 1990’s the indigenous populationmigrated to the lowland plantations, the capital or regional market citiesin order to increase their income, and has become older and more urbanas a result.
Overall, indigenous people still face barriers in the education, labourand credit markets and have less opportunities for acquiring differentforms of capital; mainly as a result of discrimination and other types ofmarket failure (Vakis, 2003). Income inequality in Guatemala has beenfound to be correlated to differences in assets such as education, land,housing and geography; and also to ethnicity (World Bank, 2003).
The Education System
School age population in Guatemala covers children between 5 to 18years old. According to ENCOVI3 data, the there are 4.65 millionGuatemalans of schooling age. The education system consists of three lev-els: Pre-primary (5 and 6 years of age), Primary (7 to 12 years) andSecondary (13 to 18 years of age). Secondary is divided in two compo-nents: basic (13 to 15 years) and diversified (16 to 18 years). The dura-tion of compulsory education is 7 years, after which students may leavethe education system at the end of Primary schooling, usually at age 12-13. Higher education is provided by one public, and several private uni-versities. The language of instruction is Spanish, and there is limitedbilingual education in rural areas.
The effectiveness of the educational system is constrained by a short-age of trained teachers, inadequate school buildings, and long distancesfrom home to school for many students. Enforcement of Primary schoolattendance is very lax. Net primary enrolment is 85%, but a gender gap
Intergenerational transmission of education
77
Guatemala
According to the World Bank, the total population of Guatemala in 2000was around 11,4 million, out of which 39,2% were indigenous and60.8% white (World Bank, 2003). Approximately 56,2% ofGuatemalans live in poverty; while 15,7% live in extreme poverty.Income inequality in the country is among the highest in the world, witha Gini coefficient is of 0,57.
The proportion of indigenous population is one of the biggest inLatin America. The largest group is the Mayan –comprising the Kiche,Qeqchi, Kaqchiquel, Mam and others–; there are also two small non-Mayan groups, the Xinca and the Garífuna. Most of the Mayan people–about one million– are of Kiche origin and live in the western highlandsnear the cities of Santa Cruz and Chichicastenango. There are betweenone million and two million Mams and Kaqchiquels, with this last grouplocated in the northwest part of the country near the Mexican border.The Qeqchi can be found in the north eastern region of Alta Verapaz, andare estimated to be around 400 000 (Dictaan-Bang-oa and Medrana,2002). Other groups include the Chorti, Achi, Ixil, Poqomam, andTzutuil.
Guatemalan society has been historically characterized by stratifica-tion based on ethnicity. Since independence from Spain in the early 19thcentury, wealth has been concentrated in a small white elite. Elites usedcheap indigenous labour for export-oriented crop industries –coffee,sugar, cotton, cardamom and rubber– during the 19th and 20th cen-turies. Forced labour in plantations and coercive recruiting systems werecommon. A functioning labour market did not develop until the mid20th century. Today indigenous people mainly engage in small farm pro-duction and obtain seasonal labour earnings from migration. Guatemalahas long been affected by political violence. Civil war started in 1960 anddid not end until democracy was reinstated in 1986. In 1996 PeaceAgreements were signed between the Guatemalan Government and theGuatemalan National Revolutionary Unity (URNG). Throughout the1980’s, rural areas and indigenous communities were particularly affect-ed by violence, with long term economic and demographic effects. As a
Priscila Hermida
76
3 Encuesta Nacional de Condiciones de Vida (ENCOVI), a national household survey carried outfor the first time in 2000.
household was collected on income, expenditure, prices, education,health, labour market participation and access to public services.
The data from ENCOVI used was education (years) of each surveyedindividual and the educational attainment of her parents. The parentaleducation variable is a categorical one and was transformed into a contin-uous variable for the effects of the analysis5. Individuals younger than 22years old were eliminated from the sample since there is a possibility thatthey are still enrolled in the education system. The final sample contains15 662 cases for which complete information on individual and parentaleducation is available. In order to explore the change in educationalmobility over time, respondents were divided into four cohorts corre-sponding to individuals born from 1900 to 1978. A variable describingbeing born in a rural area or in a city was created from information onthe survey. A variable describing the difference in educational attainmentbetween the father and the mother of the individual was also created as aproxy for the degree of assortative mating.
Descriptive Statistics:
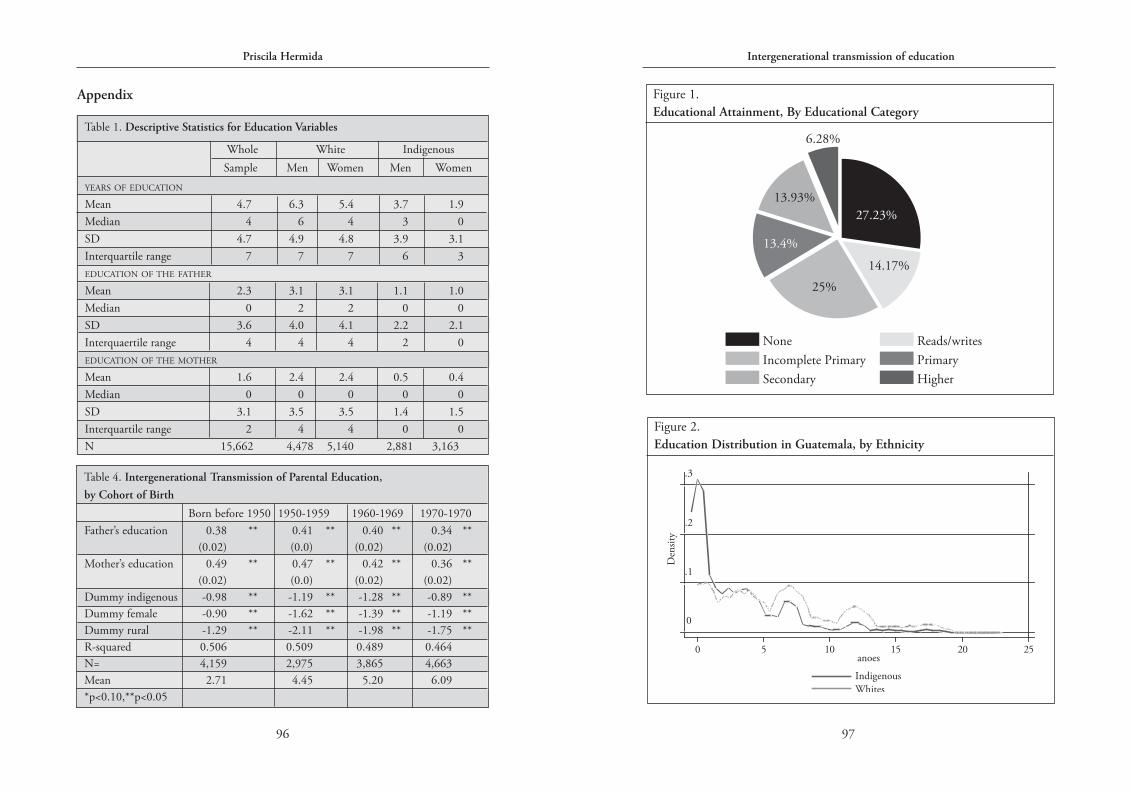
Out of the resulting sample, 47 % individuals are male and 53 % female.In terms of ethnicity, 61.4 % are white and 38,6 % describe themselvesas indigenous. The sample is evenly divided into individuals born in rural(52,4%) and in urban areas (47,6%). The average schooling for the wholesample is 4,7 years. A third of the sample (27%) has zero years of educa-tion, and an additional 39% has not completed primary school. Thesefigures are consistent with other sources of data for education inGuatemala. An important group of individuals (14%) only reads andwrites. The percentages of people who have completed primary or sec-ondary school are around 13% each. Only around 6% of the sample hashigher education.
As shown in Figure 2 in the Appendix, the distribution of education-al attainment in Guatemala is skewed to the right with mean of 4,7 years
Intergenerational transmission of education
79
remains (UNDP, 2002). An important characteristic of the Guatemalaneducation system is the problem of over-age and late enrollment(Edwards, 2002). While the system fails to meet the target for Pre-school,Secondary and Higher Education, the Primary school level is overbur-dened by over-age and repetition. Significantly, 100% coverage is notreached in any schooling level or age, which means that many childrennever go to school.
The distribution of education is very unequal and is correlated withthe income distribution (Edwards, 2002). According to the UNDP, 70%of the population reads and writes, although there are important differ-ences between urban and rural areas, and between ethnic groups (UNDP,2000). Educational attainment is considerably lower in rural communi-ties because children tend to be employed in farming and educationalfacilities are not always available. Differences in schooling between sonsand daughters have been found to be important in rural households, bothindigenous and non indigenous (UNDP, 2000). Children who abandonschool stop acquiring a very important form of human capital, and theprobability of them becoming poor in adulthood increases. They maybecome poor fathers and mothers of poor children, their educationalattainment influencing the attainment and income of their offspring.
Data set and Analysis
Dataset
The ENCOVI dataset was used in this paper for the analysis of educa-tional mobility. It is the first Living Standards Measurement Survey avail-able for Guatemala, conducted between July and November of 2000 bythe Instituto Nacional de Estadistica (INE), with support from the WorldBank and the Inter American Development Bank. It is a nationally rep-resentative survey, covering urban and rural areas4. Information from each
Priscila Hermida
78
4 The two-staged, stratified sample comprised 8 940 households without replacement. Estimatedrejection rate was 10%.
5 The categories for parental education in the survey are: “No Education” (0 years), “IncompletePrimary” (1-5 years), “Primary” (6 years), “Incomplete Secondary” (7-11 years), “Secondary”(12 years) and “Higher Education” (more than 12 years).
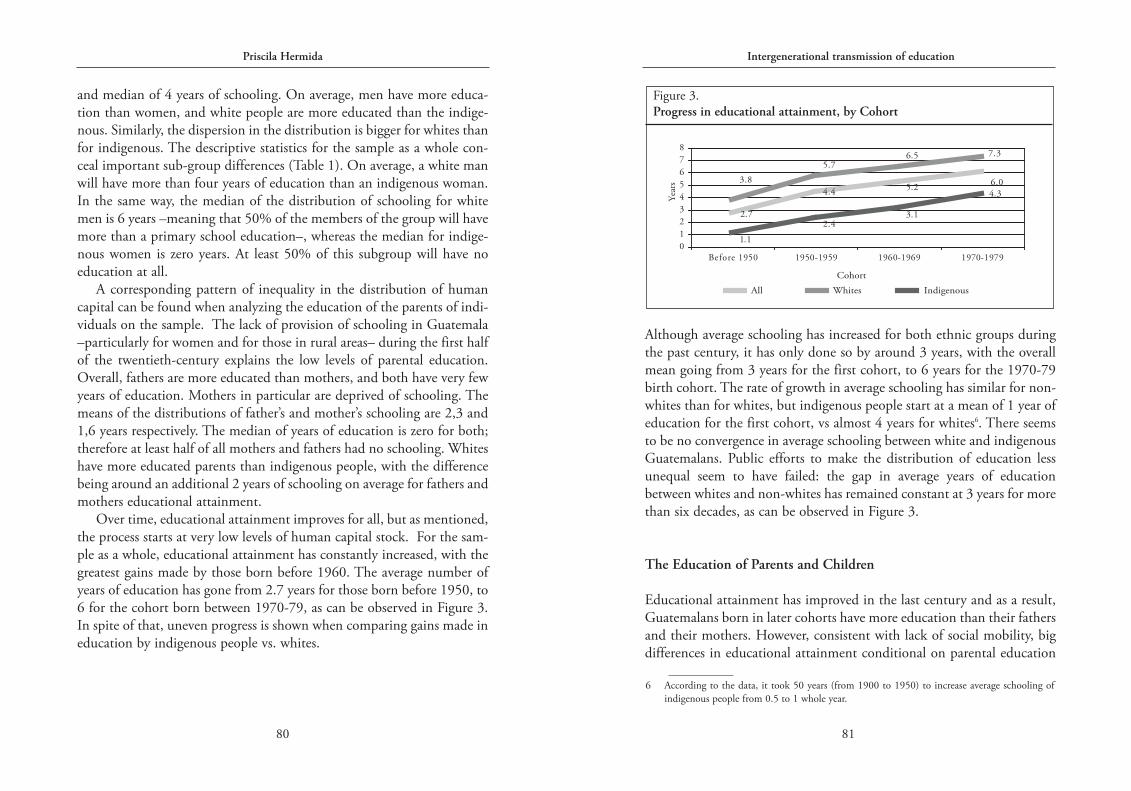
Although average schooling has increased for both ethnic groups duringthe past century, it has only done so by around 3 years, with the overallmean going from 3 years for the first cohort, to 6 years for the 1970-79birth cohort. The rate of growth in average schooling has similar for non-whites than for whites, but indigenous people start at a mean of 1 year ofeducation for the first cohort, vs almost 4 years for whites6. There seemsto be no convergence in average schooling between white and indigenousGuatemalans. Public efforts to make the distribution of education lessunequal seem to have failed: the gap in average years of educationbetween whites and non-whites has remained constant at 3 years for morethan six decades, as can be observed in Figure 3.
The Education of Parents and Children
Educational attainment has improved in the last century and as a result,Guatemalans born in later cohorts have more education than their fathersand their mothers. However, consistent with lack of social mobility, bigdifferences in educational attainment conditional on parental education
Intergenerational transmission of education
81
and median of 4 years of schooling. On average, men have more educa-tion than women, and white people are more educated than the indige-nous. Similarly, the dispersion in the distribution is bigger for whites thanfor indigenous. The descriptive statistics for the sample as a whole con-ceal important sub-group differences (Table 1). On average, a white manwill have more than four years of education than an indigenous woman.In the same way, the median of the distribution of schooling for whitemen is 6 years –meaning that 50% of the members of the group will havemore than a primary school education–, whereas the median for indige-nous women is zero years. At least 50% of this subgroup will have noeducation at all.
A corresponding pattern of inequality in the distribution of humancapital can be found when analyzing the education of the parents of indi-viduals on the sample. The lack of provision of schooling in Guatemala–particularly for women and for those in rural areas– during the first halfof the twentieth-century explains the low levels of parental education.Overall, fathers are more educated than mothers, and both have very fewyears of education. Mothers in particular are deprived of schooling. Themeans of the distributions of father’s and mother’s schooling are 2,3 and1,6 years respectively. The median of years of education is zero for both;therefore at least half of all mothers and fathers had no schooling. Whiteshave more educated parents than indigenous people, with the differencebeing around an additional 2 years of schooling on average for fathers andmothers educational attainment.
Over time, educational attainment improves for all, but as mentioned,the process starts at very low levels of human capital stock. For the sam-ple as a whole, educational attainment has constantly increased, with thegreatest gains made by those born before 1960. The average number ofyears of education has gone from 2.7 years for those born before 1950, to6 for the cohort born between 1970-79, as can be observed in Figure 3.In spite of that, uneven progress is shown when comparing gains made ineducation by indigenous people vs. whites.
Priscila Hermida
80
6 According to the data, it took 50 years (from 1900 to 1950) to increase average schooling ofindigenous people from 0.5 to 1 whole year.
Figure 3.Progress in educational attainment, by Cohort
people are faced with a different set of incentives and disincentives toinvest in the education of their offspring.
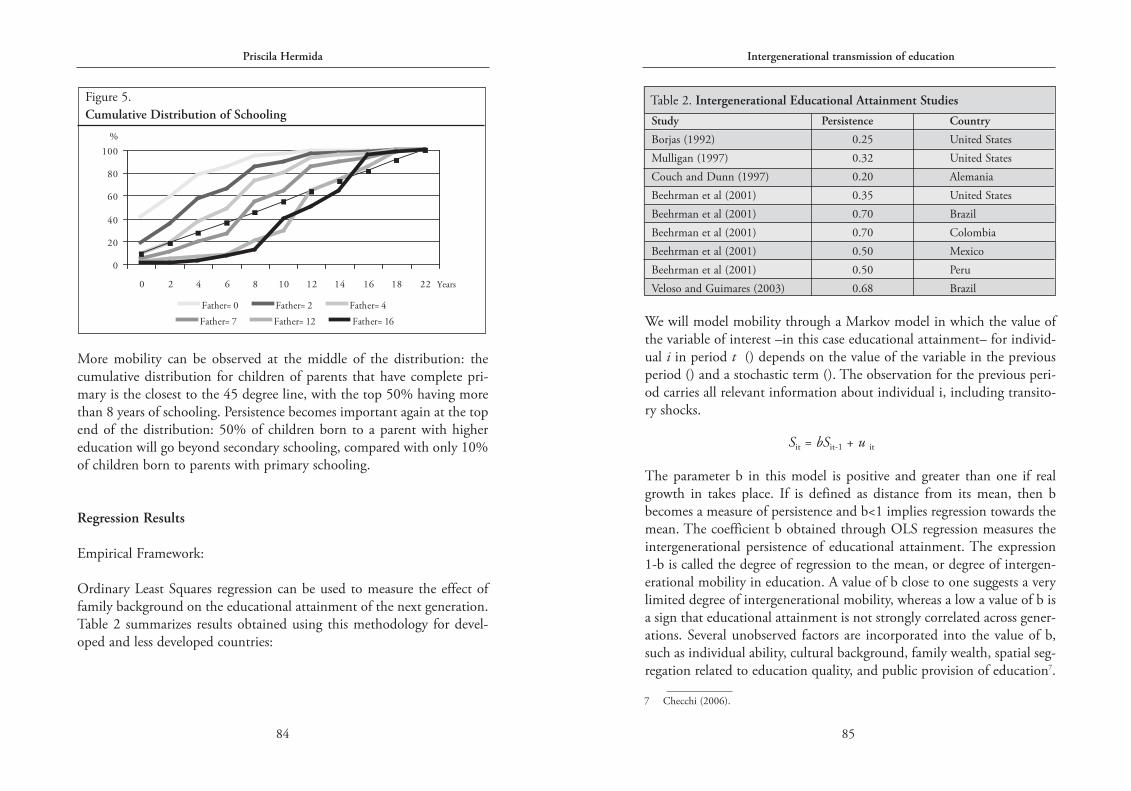
Figure 5 shows the cumulative distribution of education for the wholesample, conditional on parental years of schooling. If the probability of aperson attaining a particular level of schooling is not affected by the par-ent’s level of education, then perfect mobility exists. The black 45 degreeline represents a situation where, for a given level of parental schooling,children’s years of education are distributed evenly across all possible edu-cational outcomes, thus representing perfect mobility. The distance(upwards or downwards) from the cumulative distribution to the 45degree line can be thought of as a measure of persistence. However, giventhat the genetic inherited component of ability is correlated with educa-tional attainment, perfect mobility should not be expected even in thepresence of a good degree of educational mobility.
The graph shows that persistence is higher for children of parents withlittle or no schooling and less important for children of parents that havecompleted primary schooling. The implications of persistence at the bot-tom of the education distribution are highlighted by the fact that themedian of parental education is zero years. The probability for a child ofuneducated parents to continue in the same educational category is 40%.Having parents that only read and write halves the probability of childrenhaving no education down to 18%, while the probability of having zeroyears of education for children of parents who have primary schooling isof only 4%. Great intergenerational gains in human capital can be madewith modest increases in parental schooling.
Intergenerational transmission of education
83
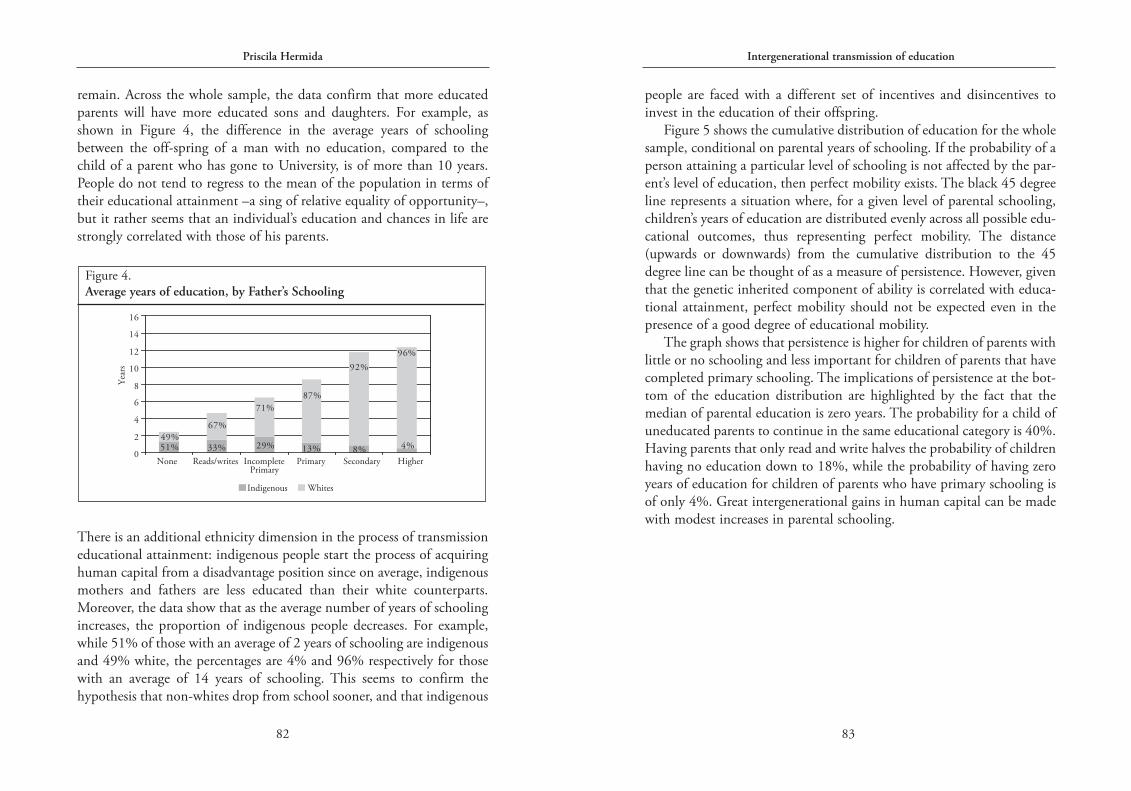
remain. Across the whole sample, the data confirm that more educatedparents will have more educated sons and daughters. For example, asshown in Figure 4, the difference in the average years of schoolingbetween the off-spring of a man with no education, compared to thechild of a parent who has gone to University, is of more than 10 years.People do not tend to regress to the mean of the population in terms oftheir educational attainment –a sing of relative equality of opportunity–,but it rather seems that an individual’s education and chances in life arestrongly correlated with those of his parents.
There is an additional ethnicity dimension in the process of transmissioneducational attainment: indigenous people start the process of acquiringhuman capital from a disadvantage position since on average, indigenousmothers and fathers are less educated than their white counterparts.Moreover, the data show that as the average number of years of schoolingincreases, the proportion of indigenous people decreases. For example,while 51% of those with an average of 2 years of schooling are indigenousand 49% white, the percentages are 4% and 96% respectively for thosewith an average of 14 years of schooling. This seems to confirm thehypothesis that non-whites drop from school sooner, and that indigenous
Priscila Hermida
82
Figure 4.Average years of education, by Father’s Schooling
We will model mobility through a Markov model in which the value ofthe variable of interest –in this case educational attainment– for individ-ual i in period t () depends on the value of the variable in the previousperiod () and a stochastic term (). The observation for the previous peri-od carries all relevant information about individual i, including transito-ry shocks.
Sit = bSit-1 + u it
The parameter b in this model is positive and greater than one if realgrowth in takes place. If is defined as distance from its mean, then bbecomes a measure of persistence and b<1 implies regression towards themean. The coefficient b obtained through OLS regression measures theintergenerational persistence of educational attainment. The expression1-b is called the degree of regression to the mean, or degree of intergen-erational mobility in education. A value of b close to one suggests a verylimited degree of intergenerational mobility, whereas a low a value of b isa sign that educational attainment is not strongly correlated across gener-ations. Several unobserved factors are incorporated into the value of b,such as individual ability, cultural background, family wealth, spatial seg-regation related to education quality, and public provision of education7.
Intergenerational transmission of education
85
More mobility can be observed at the middle of the distribution: thecumulative distribution for children of parents that have complete pri-mary is the closest to the 45 degree line, with the top 50% having morethan 8 years of schooling. Persistence becomes important again at the topend of the distribution: 50% of children born to a parent with highereducation will go beyond secondary schooling, compared with only 10%of children born to parents with primary schooling.
Regression Results
Empirical Framework:
Ordinary Least Squares regression can be used to measure the effect offamily background on the educational attainment of the next generation.Table 2 summarizes results obtained using this methodology for devel-oped and less developed countries:
Priscila Hermida
84
Figure 5.Cumulative Distribution of Schooling
Table 2. Intergenerational Educational Attainment Studies
Study Persistence Country
Borjas (1992) 0.25 United StatesMulligan (1997) 0.32 United StatesCouch and Dunn (1997) 0.20 AlemaniaBeehrman et al (2001) 0.35 United StatesBeehrman et al (2001) 0.70 BrazilBeehrman et al (2001) 0.70 ColombiaBeehrman et al (2001) 0.50 MexicoBeehrman et al (2001) 0.50 PeruVeloso and Guimares (2003) 0.68 Brazil
7 Checchi (2006).
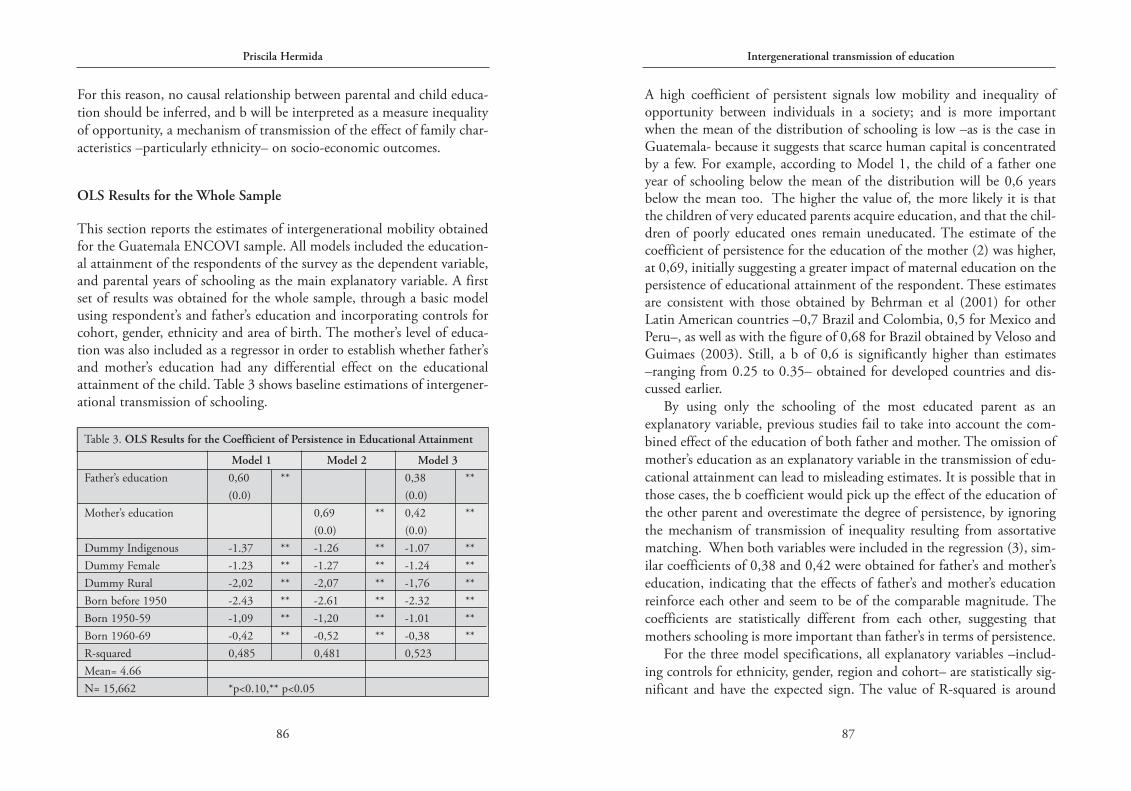
A high coefficient of persistent signals low mobility and inequality ofopportunity between individuals in a society; and is more importantwhen the mean of the distribution of schooling is low –as is the case inGuatemala- because it suggests that scarce human capital is concentratedby a few. For example, according to Model 1, the child of a father oneyear of schooling below the mean of the distribution will be 0,6 yearsbelow the mean too. The higher the value of, the more likely it is thatthe children of very educated parents acquire education, and that the chil-dren of poorly educated ones remain uneducated. The estimate of thecoefficient of persistence for the education of the mother (2) was higher,at 0,69, initially suggesting a greater impact of maternal education on thepersistence of educational attainment of the respondent. These estimatesare consistent with those obtained by Behrman et al (2001) for otherLatin American countries –0,7 Brazil and Colombia, 0,5 for Mexico andPeru–, as well as with the figure of 0,68 for Brazil obtained by Veloso andGuimaes (2003). Still, a b of 0,6 is significantly higher than estimates–ranging from 0.25 to 0.35– obtained for developed countries and dis-cussed earlier.
By using only the schooling of the most educated parent as anexplanatory variable, previous studies fail to take into account the com-bined effect of the education of both father and mother. The omission ofmother’s education as an explanatory variable in the transmission of edu-cational attainment can lead to misleading estimates. It is possible that inthose cases, the b coefficient would pick up the effect of the education ofthe other parent and overestimate the degree of persistence, by ignoringthe mechanism of transmission of inequality resulting from assortativematching. When both variables were included in the regression (3), sim-ilar coefficients of 0,38 and 0,42 were obtained for father’s and mother’seducation, indicating that the effects of father’s and mother’s educationreinforce each other and seem to be of the comparable magnitude. Thecoefficients are statistically different from each other, suggesting thatmothers schooling is more important than father’s in terms of persistence.
For the three model specifications, all explanatory variables –includ-ing controls for ethnicity, gender, region and cohort– are statistically sig-nificant and have the expected sign. The value of R-squared is around
Intergenerational transmission of education
87
For this reason, no causal relationship between parental and child educa-tion should be inferred, and b will be interpreted as a measure inequalityof opportunity, a mechanism of transmission of the effect of family char-acteristics –particularly ethnicity– on socio-economic outcomes.
OLS Results for the Whole Sample
This section reports the estimates of intergenerational mobility obtainedfor the Guatemala ENCOVI sample. All models included the education-al attainment of the respondents of the survey as the dependent variable,and parental years of schooling as the main explanatory variable. A firstset of results was obtained for the whole sample, through a basic modelusing respondent’s and father’s education and incorporating controls forcohort, gender, ethnicity and area of birth. The mother’s level of educa-tion was also included as a regressor in order to establish whether father’sand mother’s education had any differential effect on the educationalattainment of the child. Table 3 shows baseline estimations of intergener-ational transmission of schooling.
Priscila Hermida
86
Model 1 Model 2 Model 3Father’s education 0,60 ** 0,38 **
(0.0) (0.0)Mother’s education 0,69 ** 0,42 **
(0.0) (0.0)Dummy Indigenous -1.37 ** -1.26 ** -1.07 **Dummy Female -1.23 ** -1.27 ** -1.24 **Dummy Rural -2,02 ** -2,07 ** -1,76 **Born before 1950 -2.43 ** -2.61 ** -2.32 **Born 1950-59 -1,09 ** -1,20 ** -1.01 **Born 1960-69 -0,42 ** -0,52 ** -0,38 **R-squared 0,485 0,481 0,523Mean= 4.66N= 15,662 *p<0.10,** p<0.05
Table 3. OLS Results for the Coefficient of Persistence in Educational Attainment
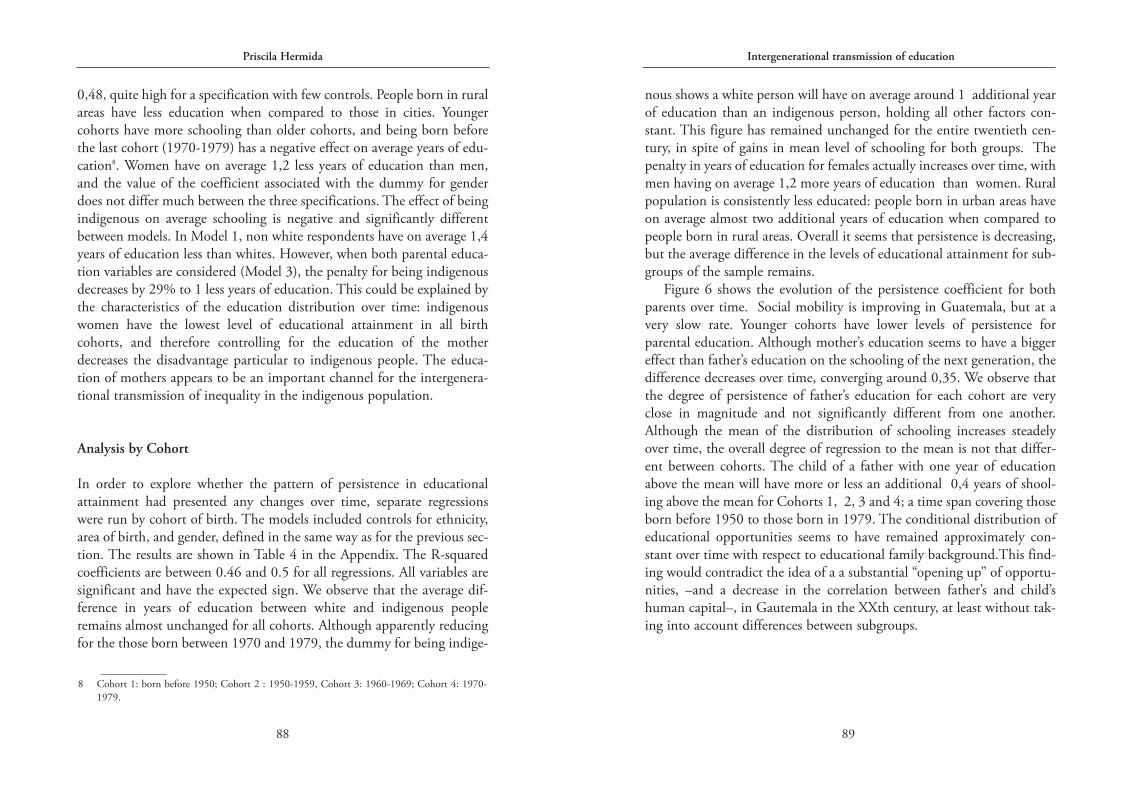
nous shows a white person will have on average around 1 additional yearof education than an indigenous person, holding all other factors con-stant. This figure has remained unchanged for the entire twentieth cen-tury, in spite of gains in mean level of schooling for both groups. Thepenalty in years of education for females actually increases over time, withmen having on average 1,2 more years of education than women. Ruralpopulation is consistently less educated: people born in urban areas haveon average almost two additional years of education when compared topeople born in rural areas. Overall it seems that persistence is decreasing,but the average difference in the levels of educational attainment for sub-groups of the sample remains.
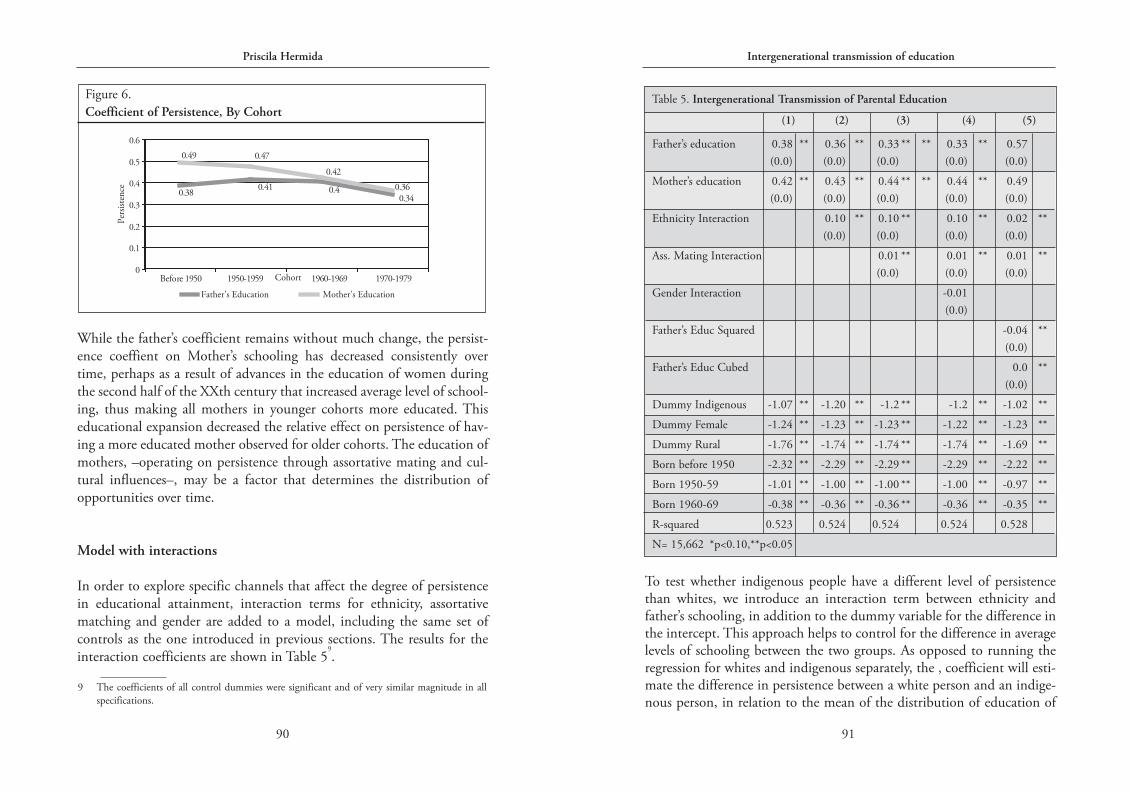
Figure 6 shows the evolution of the persistence coefficient for bothparents over time. Social mobility is improving in Guatemala, but at avery slow rate. Younger cohorts have lower levels of persistence forparental education. Although mother’s education seems to have a biggereffect than father’s education on the schooling of the next generation, thedifference decreases over time, converging around 0,35. We observe thatthe degree of persistence of father’s education for each cohort are veryclose in magnitude and not significantly different from one another.Although the mean of the distribution of schooling increases steadelyover time, the overall degree of regression to the mean is not that differ-ent between cohorts. The child of a father with one year of educationabove the mean will have more or less an additional 0,4 years of shool-ing above the mean for Cohorts 1, 2, 3 and 4; a time span covering thoseborn before 1950 to those born in 1979. The conditional distribution ofeducational opportunities seems to have remained approximately con-stant over time with respect to educational family background.This find-ing would contradict the idea of a a substantial “opening up” of opportu-nities, –and a decrease in the correlation between father’s and child’shuman capital–, in Gautemala in the XXth century, at least without tak-ing into account differences between subgroups.
Intergenerational transmission of education
89
0,48, quite high for a specification with few controls. People born in ruralareas have less education when compared to those in cities. Youngercohorts have more schooling than older cohorts, and being born beforethe last cohort (1970-1979) has a negative effect on average years of edu-cation8. Women have on average 1,2 less years of education than men,and the value of the coefficient associated with the dummy for genderdoes not differ much between the three specifications. The effect of beingindigenous on average schooling is negative and significantly differentbetween models. In Model 1, non white respondents have on average 1,4years of education less than whites. However, when both parental educa-tion variables are considered (Model 3), the penalty for being indigenousdecreases by 29% to 1 less years of education. This could be explained bythe characteristics of the education distribution over time: indigenouswomen have the lowest level of educational attainment in all birthcohorts, and therefore controlling for the education of the motherdecreases the disadvantage particular to indigenous people. The educa-tion of mothers appears to be an important channel for the intergenera-tional transmission of inequality in the indigenous population.
Analysis by Cohort
In order to explore whether the pattern of persistence in educationalattainment had presented any changes over time, separate regressionswere run by cohort of birth. The models included controls for ethnicity,area of birth, and gender, defined in the same way as for the previous sec-tion. The results are shown in Table 4 in the Appendix. The R-squaredcoefficients are between 0.46 and 0.5 for all regressions. All variables aresignificant and have the expected sign. We observe that the average dif-ference in years of education between white and indigenous peopleremains almost unchanged for all cohorts. Although apparently reducingfor the those born between 1970 and 1979, the dummy for being indige-
Priscila Hermida
88
8 Cohort 1: born before 1950; Cohort 2 : 1950-1959, Cohort 3: 1960-1969; Cohort 4: 1970-1979.
To test whether indigenous people have a different level of persistencethan whites, we introduce an interaction term between ethnicity andfather’s schooling, in addition to the dummy variable for the difference inthe intercept. This approach helps to control for the difference in averagelevels of schooling between the two groups. As opposed to running theregression for whites and indigenous separately, the ‚ coefficient will esti-mate the difference in persistence between a white person and an indige-nous person, in relation to the mean of the distribution of education of
Intergenerational transmission of education
91
While the father’s coefficient remains without much change, the persist-ence coeffient on Mother’s schooling has decreased consistently overtime, perhaps as a result of advances in the education of women duringthe second half of the XXth century that increased average level of school-ing, thus making all mothers in younger cohorts more educated. Thiseducational expansion decreased the relative effect on persistence of hav-ing a more educated mother observed for older cohorts. The education ofmothers, –operating on persistence through assortative mating and cul-tural influences–, may be a factor that determines the distribution ofopportunities over time.
Model with interactions
In order to explore specific channels that affect the degree of persistencein educational attainment, interaction terms for ethnicity, assortativematching and gender are added to a model, including the same set ofcontrols as the one introduced in previous sections. The results for theinteraction coefficients are shown in Table 5
9.
Priscila Hermida
90
Figure 6.Coefficient of Persistence, By Cohort
9 The coefficients of all control dummies were significant and of very similar magnitude in allspecifications.
(1) (2) (3) (4) (5)
Father’s education 0.38 ** 0.36 ** 0.33 ** ** 0.33 ** 0.57(0.0) (0.0) (0.0) (0.0) (0.0)
Mother’s education 0.42 ** 0.43 ** 0.44 ** ** 0.44 ** 0.49(0.0) (0.0) (0.0) (0.0) (0.0)
Ethnicity Interaction 0.10 ** 0.10 ** 0.10 ** 0.02 **(0.0) (0.0) (0.0) (0.0)
Ass. Mating Interaction 0.01 ** 0.01 ** 0.01 **(0.0) (0.0) (0.0)
Gender Interaction -0.01(0.0)
Father’s Educ Squared -0.04 **(0.0)
Father’s Educ Cubed 0.0 **(0.0)
Dummy Indigenous -1.07 ** -1.20 ** -1.2 ** -1.2 ** -1.02 **
Dummy Female -1.24 ** -1.23 ** -1.23 ** -1.22 ** -1.23 **
Dummy Rural -1.76 ** -1.74 ** -1.74 ** -1.74 ** -1.69 **
Born before 1950 -2.32 ** -2.29 ** -2.29 ** -2.29 ** -2.22 **
Born 1950-59 -1.01 ** -1.00 ** -1.00 ** -1.00 ** -0.97 **
Born 1960-69 -0.38 ** -0.36 ** -0.36 ** -0.36 ** -0.35 **
R-squared 0.523 0.524 0.524 0.524 0.528
N= 15,662 *p<0.10,**p<0.05
Table 5. Intergenerational Transmission of Parental Education
Conclusions
This paper extends the study of the process of intergenerational transmis-sion of educational attainment in the developing world, to include eth-nicity as a factor associated with this process. Using several specifications,the results show that educational achievement exhibits higher persistencefrom generation to generation among indigenous people. The effect offather’s education on persistence seems to be more important for males.For females, the education of the mother may contribute positively toeducational mobility. The finding is in line with other studies in develop-ing countries that suggest that mother’s with more schooling influenceintra-household allocation of resources. Cohort analysis shows that socialmobility is improving in Guatemala, but at a very slow rate. Youngercohorts have lower levels of persistence for parental education, but theoverall degree of regression to the mean is not that different betweencohorts. The conditional distribution of educational opportunities seemsto have remained approximately constant over time with respect to edu-cational family background. This finding would contradict the idea of aa substantial “opening up” of opportunities, –and a decrease in the corre-lation between father’s and child’s human capital–, in Gautemala in theXXth century. Women seem to be more mobile than men, an effect per-haps arising from a “catching up” resulting from a trend of improvementof the average level of schooling. persistence at the bottom and at the topof the distribution of schooling. Persistence of educational attainment ishigher among indigenous people due to the fact that they are mostlyfound at the bottom of the education distribution ( as well as in theunobserved income distribution). There seems to be evidence of a pover-ty trap, with ethnicity being a proxy for exclusion and lack of opportuni-ty associated with credit constraints.
Intergenerational transmission of education
93
the entire sample, thus testing equality of opportunity in the society as awhole. Consistent with our previous finding that indigenous people havehigher levels of persistence in educational attainment, we find the inter-action term to be significant and positive. On average, being indigenousincreases the degree of persistence from 0,36 to 0,46 years from the mean,a 28% increase in the value of the coefficient.
By including an interaction term for assortative matching, we can seehow the persistence coefficient changes as the distance between spouses’education grows. The assortative matching variable is defined as theabsolute value of the difference between the education of the father andthe education of the mother, measured in years. At high levels of sortingon education, the value of the variable will be close to zero; with less sort-ing the value of the variable increases. We find that, on average, distancebetween partner’s education has a positive effect on the degree of persist-ence. The value of the interaction coefficient is close to zero, but signifi-cant in all specifications. In addition, the specification in Model 4 showsno specific differential effect of gender on persistence. These findings seemto contradict our initial hypotheses that assortative matching decreasespersistence and that mobility patterns may differ by gender. However, itis possible that the decrease in mobility associated with educational dis-tance between the partners is related to higher educational homogamyfound amongst urban and white couples (Quisumbing and Hallman,2003); therefore catching some of the effect of ethnicity on persistence.
Finally, when non-linearity in the intergenerational correlation inschooling is taken into account by introducing a squared and cubed termfor Father’s education, we find both terms significant. The cubed termsshows higher levels of persistence at the bottom and at the top of the dis-tribution of schooling. As a result of the change in functional form, theethnicity interaction term falls in magnitude and stops being statisticallysignificant, implying that the stickiness of education attainment is high-er among indigenous people due to the fact that they are mostly found atthe bottom of the education distribution ( as well as in the unobservedincome distribution). There seems to be evidence of a poverty trap, withethnicity being a proxy for exclusion and lack of opportunity associatedwith credit constraints.
Priscila Hermida
92
Quisumbing, A. and K. Hallman (2003). “Marriage in transition:Evidence on age, education and assets from six developing coun-tries,” in Cynthia B. Lloyd, Jere Behrman, Nelly Stromquist, andBarney Cohen (eds.), The Changing Transitions to Adulthood inDeveloping Countries: Selected Studies. Washington, DC: NationalAcademies Press, pp. 200–269.
Solon, G. (1992). “Intergenerational Income Mobility in the UnitedStates,” American Economic Review, American EconomicAssociation, vol. 82(3), pages 393-408, June.
UNDP, (2000). National Human Development Reports: Guatemala2000. “Guatemala: La Fuerza Incluyente del Desarrollo Humano”.UNDP, New York.
_____ (2002). National Human Development Report: Guatemala 2002“Development, Women and Education”. UNDP, New York.
Vakis, R. (2003). “Guatemala: Livelihoods, Labor Markets and RuralPoverty”. Guatemala Poverty Assessment (GUAPA) Program.Technical Paper Nº. 1. World Bank.
Veloso Fernando. and S. Guimarães Ferreira (2003). “MobilidadeIntergeracional de Educação no Brasil,” Anais do XXXI EncontroNacional de Economia [Proceedings of the 31th BrazilianEconomics Meeting] f25, ANPEC - Associação Nacional dosCentros de Pósgraduação em Economia.
World Bank, (2003). Guatemala Poverty Assessment (GUAPA). CountryStudy, Report N.º 24221-GU. Washington, DC.
Zimmerman, D. J. (1992). “Regression toward Mediocrity in EconomicStature,” American Economic Review, American EconomicAssociation, vol. 82(3): 409-29, June.
Intergenerational transmission of education
95
Bibliography:
Becker, G. (1975). Human Capital: A Theoretical and Empirical Analysis,with special reference to Education. National Bureau of EconomicResearch.
Behrman, J., Gaviria, A. and M. Szekely (2001). IntergenerationalMobility in Latin America. Inter-American Development Bank,Working Paper no 452.
Behrman, J., R.A. Pollak, and P. Taubman (1989). “Family Resources,Family Size, and Access to Financing for College Education,”Journal of Political Economy, 97(2):398- 419.
Behrman, J. and P. Taubman (1990). “The Intergenerational Correlationbetween Children’s Adult Earnings and Their Parents’ Income:Result from the Michigan Panel Survey of Income Dynamic,”Review of Income and Wealth, Blackwell Publishing, vol. 36(2),pages 115-27, June.
Borjas, G. ( 1992). “Ethnic Capital and Intergenerational Mobility”. TheQuarterly Journal of Economics, Vol. 7, Nº. 1.
Dictaan-Bang-oa, E. and J. G. L. Medrana (2002). “The GuatemalaPeace Agreements of 1996: A Case Study Beyond the Silencing ofthe Guns”, in Chandra K. Roy, Vicky Tauli-Corpuz and AmandaRomero-Medina, eds. Tebtebba Foundation.
Edwards, J. (2002). “Education and Poverty in Guatemala”. GuatemalaPoverty Assessment (Guapa) Program Technical Paper Nº. 3.Washington DC.
Fafchamps M. and A. Quisumbing (2003), “Marriage and assortativematching in rural Ethiopia,” Manuscript. Centre for the Study ofAfrican Economies, University of Oxford and International FoodPolicy Research Institute (IFPRI).
Instituto Nacional de Estadística (2000), Encuesta Nacional deCondiciones de Vida.
Mulligan, C. B. (1999). “Galton versus the Human Capital Approach toInheritance,” Journal of Political Economy, University of ChicagoPress, vol. 107(S6): 184-29, December.
Priscila Hermida
94
Intergenerational transmission of education
97
Appendix
Priscila Hermida
96
Whole White IndigenousSample Men Women Men Women
YEARS OF EDUCATION
Mean 4.7 6.3 5.4 3.7 1.9Median 4 6 4 3 0SD 4.7 4.9 4.8 3.9 3.1Interquartile range 7 7 7 6 3EDUCATION OF THE FATHER
Mean 2.3 3.1 3.1 1.1 1.0Median 0 2 2 0 0SD 3.6 4.0 4.1 2.2 2.1Interquaertile range 4 4 4 2 0EDUCATION OF THE MOTHER
Mean 1.6 2.4 2.4 0.5 0.4Median 0 0 0 0 0SD 3.1 3.5 3.5 1.4 1.5Interquartile range 2 4 4 0 0N 15,662 4,478 5,140 2,881 3,163
Table 1. Descriptive Statistics for Education Variables
Born before 1950 1950-1959 1960-1969 1970-1970Father’s education 0.38 ** 0.41 ** 0.40 ** 0.34 **
(0.02) (0.0) (0.02) (0.02)Mother’s education 0.49 ** 0.47 ** 0.42 ** 0.36 **
(0.02) (0.0) (0.02) (0.02)Dummy indigenous -0.98 ** -1.19 ** -1.28 ** -0.89 **Dummy female -0.90 ** -1.62 ** -1.39 ** -1.19 **Dummy rural -1.29 ** -2.11 ** -1.98 ** -1.75 **R-squared 0.506 0.509 0.489 0.464N= 4,159 2,975 3,865 4,663Mean 2.71 4.45 5.20 6.09*p<0.10,**p<0.05
Table 4. Intergenerational Transmission of Parental Education,
by Cohort of Birth
Figure 1.Educational Attainment, By Educational Category
Figure 2.Education Distribution in Guatemala, by Ethnicity