pnb housing finance · pdf filepnb housing finance investor presentation ... process...
TRANSCRIPT

PNB Housing FinanceInvestor Presentation
September 2016

This presentation and the accompanying slides (the “Presentation”), which have been prepared by PNB Housing Finance Ltd (the“Company”), have been prepared solely for information purposes and do not constitute any offer, recommendation or invitationto purchase or subscribe for any securities, and shall not form the basis or be relied on in connection with any contract or bindingcommitment what so ever. No offering of securities of the Company will be made except by means of a statutory offeringdocument containing detailed information about the Company.
This Presentation has been prepared by the Company based on information and data which the Company considers reliable, butthe Company makes no representation or warranty, express or implied, whatsoever, and no reliance shall be placed on, the truth,accuracy, completeness, fairness and reasonableness of the contents of this Presentation. This Presentation may not be allinclusive and may not contain all of the information that you may consider material. Any liability in respect of the contents of, orany omission from, this Presentation is expressly excluded.
Certain matters discussed in this Presentation may contain statements regarding the Company’s market opportunity and businessprospects that are individually and collectively forward-looking statements. Such forward-looking statements are not guaranteesof future performance and are subject to known and unknown risks, uncertainties and assumptions that are difficult to predict.These risks and uncertainties include, but are not limited to, the performance of the Indian economy and of the economies ofvarious international markets, the performance of the industry in India and world-wide, competition, the company’s ability tosuccessfully implement its strategy, the Company’s future levels of growth and expansion, technological implementation, changesand advancements, changes in revenue, income or cash flows, the Company’s market preferences and its exposure to marketrisks, as well as other risks. The Company’s actual results, levels of activity, performance or achievements could differ materiallyand adversely from results expressed in or implied by this Presentation. The Company assumes no obligation to update anyforward-looking information contained in this Presentation. Any forward-looking statements and projections made by third partiesincluded in this Presentation are not adopted by the Company and the Company is not responsible for such third party statementsand projections.
Safe Harbor
2

3
About PNB Housing

Strong Parentage, Independent Professional Management and an Autonomous Board
Loans Assets of INR 322 bn (2)
Fastest growing HFC amongst the Top 5 HFCs in India (3)
Robust and scalable technology-enabled target operating model
Strong distribution network with pan India presence and over 9,200 (2) channel partners across India
Wide product offering with ~72% of the Loan Assets as housing loans
Diverse and cost effective funding mixwith average cost of borrowing at 8.79% (2)
Efficient capital utilization and delivering healthy RoEsconsistently
5th largest by Loan Assets and 2nd largest by deposits (1)
Lowest GNPAs amongst peers in India (4) at 0.26% (5)
One of the Leading Housing Finance Company
1. Source CRISIL; 5th largest by loan assets as on 31st March, 16; Source IMACS: 2nd largest by deposits as on 31 March, 15 (amongst housing finance companies)2. As on 30th Sept, 163. Source: IMACS; Based on CAGR of Loan Assets during FY2012-2016
4. Source: IMACS; Lowest GNPAs as on 31st March, 16 at 0.20%5. As a % of Loan Assets as on 30th Sept, 16
4

• Destimoney Enterprises Limited (“DEL”) acquired 26% stake in the company
• Crossed INR10,000 mn in deposits
• ‘CRISIL AA+’ rating (for NCDs and bank term loans) and FAAA (for Deposits)
• Introduced new brand image• Robust and scalable target
operating model (“TOM”) implementation commenced
Commenced Journey in 1988
1988 2009
2010
2011
2012
2013
2014
2015
2016
• Company incorporated
• Launched business process re-engineering project-“Kshitij”
• DEL raises stake from 26% to 49%
• Gross and net NPAs brought below 0.5% of the asset portfolio
• AUM: INR 39,697 mn• Deposits: INR 3,333 mn• PAT: INR 752 mn
• PAT crossed INR 1,000 mn and portfolio crossed INR 100,000 mn
• Implemented end-to end Enterprise System Solution
• AAA rating by ICRA and India Ratings (Fitch Group)
• DEL is acquired by Quality Investment Holdings (QIH), of the Carlyle Group (1)
Business process re-engineering sponsored by Parent
Put in place a highly experienced, independent and professional management team
Robust underwriting, monitoring and collection platform
Leverage technology as enabler and facilitator to enhance customer experience and engagement
Board Managed Entity with a Professional Management Team
1 QIH is an affiliate of Carlyle Asia Partners IV, L.P.2 As on 30th Sept, 16
AUM: Asset Under Management, PAT: Profit After Tax
Strong distribution network with well-defined operating procedures across the Company
PNB Housing - a brand to reckon with
• IPO - Raised INR 30,000 mn• TOM implemented• AUM: INR 348,960 mn (2)
• Deposits: INR 78,310 mn (2)
5
6
Operational and Financial Performance

Key Highlights - H1 FY17 vs H1 FY16
INR 349 bn56%
INR 102 bn48%
INR 322 bn47%
0.26% vs 0.23%
AUM
Disbursements
Loan Assets
Gross NPA
7
INR 2,336 mn75%
INR 4,376 mn45%
1.46%11 bps
Profit After Tax
Net Interest Income
Return on Assets
Opex to ATA0.77%
12 bps
Gross NPA calculated as a % of total loan assets as on 30th Sept, 16/15ATA: Average Total Asset

Strong Growth and Best in Class Asset Quality
1 Expenses on account of “Standard Asset and NPA Provisions
8
Asset Quality Improving over Years (% of Loan Assets)Disbursements (INR bn)
4225
102
69
76
52
30
H1 FY17FY15FY14 FY16
0.18%
0.26%
0.14%0.15%
0.07%
0.32%
0.20% 0.22%
Credit Costs (% of Loan Assets)(1)Loan Assets (INR bn)
322
272
168
106
0.04%
0.36%
0.23%
0.04%
NNPAGNPAH1 H2
0.18%
FY14 FY16 H1FY17
0.23%
FY15
0.14%
NPA ProvisionStandard Asset Provision
0.08%
0.03%
0.03%
0.01%
31-Mar-14 31-Mar-15 31-Mar-16 30-Sep-16
31-Mar-14 31-Mar-15 31-Mar-16 30-Sep-16

Product - Breakup
9
67.2 69.0 71.1 71.3
32.8 31.0 28.9 28.7
FY14 FY15 FY16 H1 FY17
Housing Non-Housing
As a % of Total Disbursements As a % of Loan Assets
70.4 71.1 70.3 71.8
29.6 28.9 29.7 28.2
31-Mar-14 31-Mar-15 31-Mar-16 30-Sep-16
Housing Non-Housing

Construction FinanceLoans (1) – 11.2%
196167
104
68
+56.7%
31-Mar-14
36
25
16
6
+104%
Individual HousingLoan (1) – 60.7%
86%
5%
4%4% 1% Home Purchase
Loans
Residential PlotLoans
Residential Plot cumConstruction Loans
ResidentialConstruction Loans
Home ImprovementLoans
Home ExtensionLoans
ATS 3.2mn
1. As a % of loan assets on 30th Sept, 2016
Loan Assets Distribution
Housing Loan - 71.8% (1) Non-Housing Loan(1)
28.2%
9181
49
31
+61.6%
64%
12%
14% 10%
Loan AgainstProperty
Lease RentalDiscounting
Non-residentialPremises Loans
Corporate TermLoan
10
ATS 7.1mn
ATS: Average Ticket Size
31-Mar-15 31-Mar-16 30-Sep-16 31-Mar-14 31-Mar-15 31-Mar-16 30-Sep-16 31-Mar-14 31-Mar-15 31-Mar-16 30-Sep-16

One Of The Most Diversified Liability Profile
…leading to decline in Cost of Borrowings
(%)
Amongst the few HFCs with strong deposit taking franchise
INR bn
Total Borrowing of INR 315 bn as on 30th Sept, 16
Access to a Diverse Base of Funding…
43%
25%
14%
10%
3%5%
NCDs and other debt instruments Public deposits
Commercial paper Refinancing from NHB
Loans from banksand financial institutions
ECBs
17
49
71 78 +104%
9.7%
FY16
-87 bps
FY15FY14 H1FY17
9.1%9.4%8.8%
Credit Rating• Fixed Deposit has been rated “FAAA” by CRISIL and “AAA” by CARE. The rating of “FAAA” and “AAA” indicates “High Safety”
with regards to the repayment of interest and principal.• Commercial Paper is rated at “A1(+)” by CARE and Non-Convertible Debenture (NCD) are rated at “AAA” by CARE, “AAA” by
India Ratings, “AA+” by CRISIL and “AA+” by ICRA
11
31-Mar-14 31-Mar-15 31-Mar-16 30-Sep-16

Margin Analysis
Average Cost of BorrowingsAverage Yield on Loan Assets
H1 FY17
12.61%
10.96%11.25%
FY16FY15
12.39%
FY14 H1 FY17
9.10%
FY15
8.79%
FY16FY14
9.66%
9.42%
NIM %Spread %
2.73%
FY14 FY16FY15
2.15%
3.19%
2.17%
H1 FY17 FY16FY15FY14 H1 FY17
2.73%
3.08%
3.22%3.17%
12
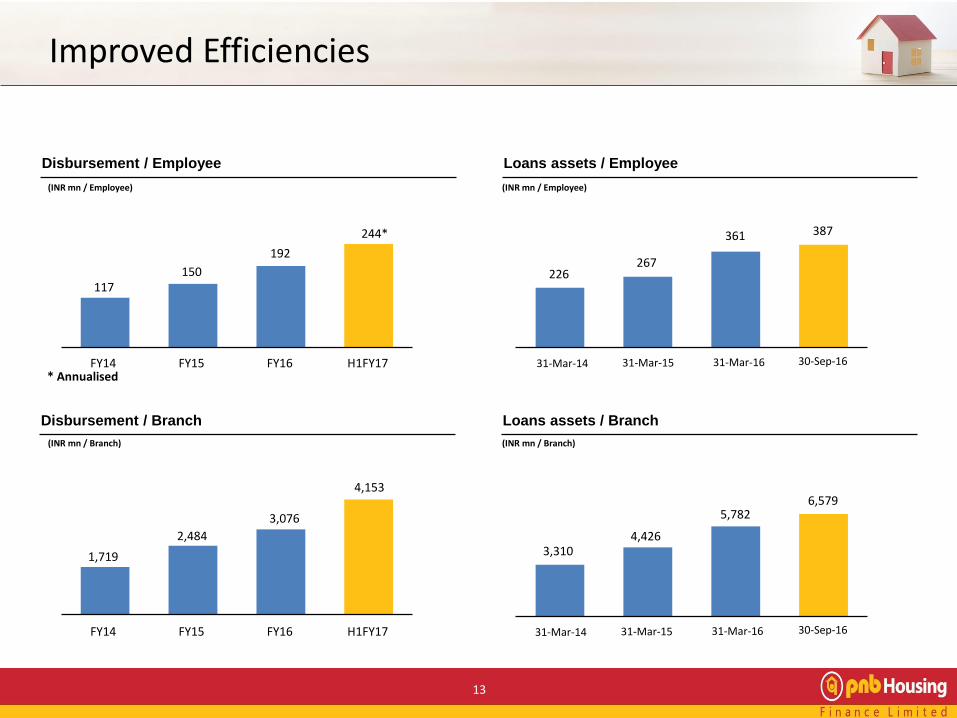
Improved Efficiencies
Disbursement / Employee Loans assets / Employee
Disbursement / Branch Loans assets / Branch
117150
192
244*
H1FY17FY16FY15FY14
1,719
2,484
3,076
4,153
FY16FY14 H1FY17FY15
3,310 4,426
5,782 6,579
(INR mn / Employee)(INR mn / Employee)
(INR mn / Branch) (INR mn / Branch)
226 267
361 387
13
* Annualised31-Mar-14 31-Mar-15 31-Mar-16 30-Sep-16
31-Mar-14 31-Mar-15 31-Mar-16 30-Sep-16

Operating Leverage Playing Out
Opex to ATA
H1FY14
0.99%
H1FY17
0.77%
H1FY16
1.0%0.89%
H1FY15
Cost Income Ratio
28.18%29.92%30.04%
25.34%
Return on Assets
1.37%1.46%
1.39% 1.35%
Return on Equity
15.43%16.67%
17.78%
20.73%
14
H1FY14 H1FY17H1FY16H1FY15
H1FY14 H1FY17H1FY16H1FY15H1FY14 H1FY17H1FY16H1FY15

15
Our Business Model

Map not to scale. All data, information and maps are provided “as is” without warranty or any representation of accuracy, timeliness or completeness.
Geographical Presence across India
In-depth analysis of demographics and growth prospects
Market deepening strategy
Track operational break-even for each establishment
Establish branches as per business potential
Hubs aid and support branch expansion
Branches – Point of Sales & Services
HUBs – Fountain head for Decision Making
Zonal Hubs - Guides, Supervises & Monitors the HUB
16

Well-thought Strategy
01• In-house channels, third party channels
including DMAs, market aggregators• ~57% loans sourced in-house to reduce
third party dependability (1)
• Over 9,200 channel partners spread across India (2)
02• Wide product basket to cater to needs of
customers• Achieving growth across segments to
maintain a diversified portfolio
03• Product programs, capabilities around
serving the self-employed segment‒ Self employed forms ~52% of loan
Assets (2)
‒ LAP forms ~18% which is pre-dominantly self employed segment (2)
04• Pricing as per the customer segment and
product category• Differentiated pricing for salaried and self
employed segments
Text
Here
Various Components of
Our Strategy
Origination
Products
Segment
Pricing
1 For 3 months ended 30th Sept, 162 As on 30th Sept, 16
17

Robust Delivery Model…
Supported by End-to-End Technology
Focus on productivity, efficiency and quality
People
ProcessTechnology
TOM
Target Operating Model (TOM)
In-House Sales Team
Third Party DMAs and Market Aggregators
Hub and Spoke Branch Model
Developer Relationships
Robust Delivery Model
18

All Processes Subject to Internal Audits
Robust Credit Underwriting Processes and Control
Mortgage professional
s taking credit
decisions
Underwriter
Identifies and prevents
fraud at early stage
itself
Fraud Control Unit
Technical appraisal of a property
Technical Service Group
Manages property
title verification
Legal Team
Collections professional
s with expertise in
SARFAESI
Collection Team
HUB
19

Economies of Scale
Diversified Liability Profile
Robust Technology
Best-in-Class Asset Quality
Differentiating Strategy
Brand Recognition &
Delivery Model
Strong Industry Growth
Indian Housing Finance Sector Poised For Strong Growth
Strong Brand Recognition Coupled with Robust Delivery Model
Differentiated Strategy for Business Expansion
Steady Underwriting Processes,Best-in-Class Asset Quality andBenign Credit Costs
Robust Technology Platform In Place as Growth Enablers
Well Diversified Liability Profile With Access to Multiple Sources of Funding
Economies Of Scale Delivering Improved Efficiency and Profitability
A Platform with Significant Growth Potential
20
Strong Head room for
Expansion
With 49 Branches, good opportunity for expansion to untapped market

21
Shareholding Pattern

Categories (%) Pre-IPO On Allotment in IPO
Promoter 51% 39.1%
Destimoney Enterprises Ltd (Carlyle Group) 49% 37.6%
FII/FPI 6.4%
Mutual Funds 3.1%
Financial Institutions/Banks 1.2%
Insurance Companies 0.9%
Bodies Corporate 1.7%
Retail & Others 10.0%
Total 100% 100%
Shareholding Pattern
IPO Proceeds to be used to augment our capital base to meet our future capital requirements
22

23
Appendix

Strong Team with Extensive Industry Experience
Age : 43 Years
No. of Years with PNB HF : 6 Years
Prior Engagements : IndusInd BankABN AMRO Bank NV ICICI Bank Limited
Age : 38 Years
No. of Years with PNB HF : 2 Years
Prior Engagements :
Gruh Finance Limited
Age : 50 Years
No. of Years with PNB HF : 4 Years
Prior Engagements : Religare Finvest LtdGE Money Indiabulls Financial Services
Shaji Varghese – Business Head
Jayesh Jain – Chief Financial officer
Ajay Gupta - Chief Risk Officer
Age : 54 Years
No. of Years with PNB HF : 5 Years
Prior Engagements : HDFC Standard Life Insurance, Union National Bank, ICICI Bank
Age : 52 Years
No. of Years with PNB HF : 21 Years
Prior Engagements : Ansal Buildwell Limited
Age : 49 Years
No. of Years with PNB HF : 5Years
Prior Engagements : ARMS (Arcil) Indian Army
Nitant Desai - Chief Centralised Operation & Technology Officer
Sanjay Jain - Company Secretary & Head Compliance
Anshul Bhargava - Chief People Officer
Sanjaya Gupta -Managing Director
24
Age : 53 Years
No. of Years with PNB HF : 6 Years
Prior Engagements : AIG, ABN Amro Bank N.V. and HDFC Limited

Usha Ananthasubramanian
Chairperson – Non Executive
Dr. Ram S. SangapureNon Executive Director
Sunil KaulRepresentative Carlyle Group
Devinjit SinghRepresentative Carlyle Group
Shital Kumar JainIndependent Director
Tejinder Singh LascharIndependent Director
R ChandrasekaranIndependent Director
Nilesh S. VikamseyIndependent Director
Gourav VallabhIndependent Director
Sanjaya GuptaManaging Director
Age:
57 Years
Current Position:
MD & CEO of PNB
Age:
56 Years
Current Position:
MD, Carlyle
Head, SE Asia, FIG, Carlyle
Age:
49 Years
Current Position: MD, Carlyle
Age:
76 Years
Current Position: Retired
Age:
58 Years
Current Position: Executive Director at PNB
Age:
68 Years
Current Position: Retired
Age:
51 Years
Current Position:
Partner, Khimji Kunverjiand Co
Age:
38 Years
Current Position: Professor
Age:
53 Years
Current Position: MD, PNB Housing Finance
Age:
58 Years
Current Position: Founder and Executive Vice Chairman, Cognizant
And Overlooked by Highly Experienced Board
25

Profit & Loss Statement
Particulars INR mn Q2FY17 Q2FY16 Y-o-Y Change H1FY17 H1FY16 Y-o-Y Change FY16
Income
Interest Income 9,011 6,082 48% 17,131 11,362 51% 25,441
Interest Expense 6,454 4,191 54% 12,287 8,117 51% 17,876
Net Interest Income 2,556 1,891 35% 4,844 3,245 49% 7,565
Other Operating Income 692 350 98% 1,200 674 78% 1,525
Total Operating Revenue 3,248 2,241 45% 6,044 3,919 54% 9,090
Expenses
Other Finance Cost 392 271 45% 639 372 72% 727
Employee Benefit Expense 266 201 32% 487 392 24% 753
Office Operating Expenses 172 136 26% 332 264 26% 564
Other Expenses 525 240 119% 896 456 96% 1,053
Depreciation and
Amortisation45 35 30% 90 66 36% 150
Provision for Doubtful Debts
and Contingencies-225 196 -215% 48 361 -87% 786
Bad Debts Written
Off/Business Loss0 7 - 26
Total Expenses 1,175 1,079 9% 2,499 1,911 31% 4,059
Profit Before Tax 2,073 1,162 78% 3,545 2,008 77% 5,031
Less: Provision for Taxation
Current Tax 541 367 48% 1,053 639 65% 1,673
Deferred Tax (Net) 155 23 573% 156 33 372% 93
Profit After Tax 1,377 772 78% 2,336 1,336 75% 3,265
26

Balance Sheet Statement
Particulars INR mn Sept 2016 March 2016
Equity and Liabilities
Shareholder's Funds 23,794 21,459
Share Capital 1,269 1,269
Reserves and Surplus 22,525 20,190
Non-Current Liabilities 235,130 169,384
Long-Term Borrowings 231,387 166,462
Deferred Tax Liabilities (Net) 460 305
Other Long-Term Liabilities 1,668 1,008
Long-Term Provisions 1,614 1,609
Current Liabilities 95,428 105,866
Short-Term Borrowings 54,667 74,484
Short-Term Provisions 268 711
Trade Payables 1,058 748
Other Current Liabilities 39,436 29,923
Total 354,353 296,708
Particulars INR mn Sept 2016 March 2016
Assets
Non-Current Assets 313,703 266,877
Fixed Assets 589 622
Tangible Assets 486 482
Intangible Assets 97 100
Capital Work-in-Progress 7 41
Non-Current Investments 8,932 8,140
Deferred Tax Assets (Net) 0 0
Loans and Advances 301,931 256,236
Other Non-Current Assets 2,251 1,880
Current Assets 40,650 29,832
Current Investments 2,617 8,083
Cash and Bank Balances 11,190 2,485
Short-Term Loans and Advances 758 180
Other Current Assets 26,085 19,083
Total 354,353 296,708
27

Thank You
28