plume visualization of orion launch abort vehicle …. small jm (ptjm = avg) nozzle bos...
TRANSCRIPT

AEDC-TR-09-T-13
Plume Visualization of Orion Launch Abort Vehicle Jettison Motors Using
Background-Oriented Schlieren
Carrie K. Reinholtz, Fred L. Heltsley, and Kenneth E. Scott Aerospace Testing Alliance
January 2010
Final Report for Period 1 – 16 June 2009
Statement A: Approved for public release; distribution is unlimited.
ARNOLD ENGINEERING DEVELOPMENT CENTER ARNOLD AIR FORCE BASE, TENNESSEE
AIR FORCE MATERIEL COMMAND UNITED STATES AIR FORCE

NOTICES
When U. S. Government drawings, specifications, or other data are used for any purpose other than a definitely related Government procurement operation, the Government thereby incurs no responsibility nor any obligation whatsoever, and the fact that the Government may have formulated, furnished, or in any way supplied the said drawings, specifications, or other data, is not to be regarded by implication or otherwise, as in any manner licensing the holder or any other person or corporation, or conveying any rights or permission to manufacture, use, or sell any patented invention that may in any way be related thereto.
Qualified users may obtain copies of this report from the Defense Technical Information Center.
References to named commercial products in this report are not to be considered in any sense as an endorsement of the product by the United States Air Force or the Government.
DESTRUCTION NOTICE
For unclassified, limited documents, destroy by any method that will prevent disclosure or reconstruction of the document.
APPROVAL STATEMENT
Prepared by:
CARRIE K. REINHOLTZ FRED L. HELTSLEY KENNETH E. SCOTT Aerospace Testing Alliance Aerospace Testing Alliance Aerospace Testing Alliance Reviewed by:
WINFORD C. PHIPPS Air Force Project Manager 716th Test Squadron Approved by:
JOHN J. WALTERS Deputy Director 716th Test Squadron

REPORT DOCUMENTATION PAGE Form Approved
OMB No. 0704-0188The public reporting burden for this collection of information is estimated to average 1 hour per response, including the time for reviewing instructions, searching existing data sources, gathering and maintaining the data needed, and completing and reviewing the collection of information. Send comments regarding this burden estimate or any other aspect of this collection of information, including suggestions for reducing the burden, to Department of Defense, Washington Headquarters Services, Directorate for Information Operations and Reports (0704-0188), 1215 Jefferson Davis Highway, Suite 1204, Arlington, VA 22202-4302. Respondents should be aware that notwithstanding any other provision of law, no person shall be subject to any penalty for failing to comply with a collection of information if it does not display a currently valid OMB control number.
PLEASE DO NOT RETURN YOUR FORM TO THE ABOVE ADDRESS 1. REPORT DATE (DD-MM-YYYY) 2. REPORT TYPE 3. DATES COVERED (From – To)
xx-01-2010 Final 1-16 June 2009 4. TITLE AND SUBTITLE 5a. CONTRACT NUMBER
Plume Visualization of NASA CEV Jettison Motors Using Background-Oriented Schlieren
5b. GRANT NUMBER
5c. PROGRAM ELEMENT NUMBER
6. AUTHOR(S) 5d. PROJECT NUMBER
Reinholtz, C. K., Heltsley, F. L, and Scott, K. E. Aerospace Testing Alliance
12696 5e. TASK NUMBER
5f. WORK UNIT NUMBER
7. PERFORMING ORGANIZATION NAME(S) AND ADDRESS(ES) 8. PERFORMING ORGANIZATION
REPORT NO.
Arnold Engineering Development Center/716th Test Squadron AEDC-TR-09-T-13 9. SPONSORING/MONITORING AGENCY NAME(S) AND ADDRESS(ES) 10. SPONSOR/MONITOR’S ACRONYM(S) NASA Johnson Space Center Mail Code: EG3 2101 NASA Parkway Houston, TX 77058
NASA JSC 11. SPONSOR/MONITOR’S REPORT
NUMBER(S)
12. DISTRIBUTION/AVAILABILITY STATEMENT
Statement A: Approved for public release; distribution is unlimited. 13. SUPPLEMENTARY NOTES
Available in the Defense Technical Information Center (DTIC). 14. ABSTRACT
A background-oriented schlieren (BOS) system has recently been implemented in the Aerodynamic Wind Tunnel 16T at Arnold Engineering Development Center (AEDC) to qualitatively visualize the jettison motor plumes on the NASA Crew Exploration Vehicle (CEV). As applied to aerodynamics, BOS is an optical technique that exploits gradients in the refractive index of fluid volumes like schlieren, shadowgraph, and interferometry techniques to visualize flow structures and density gradients. BOS requires only small optical accesses to view a painted dot pattern through a refracting media to visualize density gradients in the fluid. This is of particular interest in wind tunnels or other testing facilities where optical access is limited and/or other common visualization techniques are not readily available. Images were acquired for multiple Mach number flows, plenum pressures and model attitudes to visualize the jet plume and model shock interactions for two Jettison Motor geometries. 15. Subject Terms
jettison motor, high-pressure air, plume interaction, separation, crew module, launch abort tower, ARES I Launch Vehicle, abort, re-entry phase, wind tunnel test, AEDC Propulsion Wind Tunnel 16T, transonic, reverse freestream flow, background-oriented schlieren, plume visualization. 16. SECURITY CLASSIFICATION OF: 17. LIMITATION OF
ABSTRACT 18. NUMBER
OF PAGES
19A. NAME OF RESPONSIBLE PERSON
A. REPORT B. ABSTRACT C. THIS PAGE Mr. Winford C. Phipps
Unclassified Unclassified Unclassified Same as Report 53 19B. TELEPHONE NUMBER (Include area code)
(931) 454-3011
Standard Form 298 (Rev. 8/98) Prescribed by ANSI Std. 739.18

PREFACE
The work reported herein was conducted by the Arnold Engineering Development Center (AEDC), Air Force Materiel Command (AFMC), at the request of the NASA Johnson Space Center Mail Code: EG3 2101 NASA Parkway Houston, TX 77058. The Sponsor project manager was Mr. Tuan H. Truong of NASA JSC. The Customer representative was Mr. Matthew C. Rhode of the NASA Langley Research Center, Mail Stop 408A, Hampton, VA 23681. The test results were obtained by Aerospace Testing Alliance (ATA), the operations, maintenance, information management, and support contractor for AEDC, AFMC, Arnold Air Force Base, TN 37389. The ATA project manager was Mr. Charles L. Smith. The test was conducted in the Propulsion Wind Tunnel (PWT) 16T of the PWT Facility during the period from 1 – 16 June 2009 under AEDC Job Number 12696, PWT Test Number TF-1045.
AEDC-TR-09-T-13
Statement A: Approved for public release; distribution is unlimited. i

CONTENTS
Page 1.0 INTRODUCTION ............................................................................................................... 5
2.0 APPARATUS .................................................................................................................... 5
2.1 Test Facility ........................................................................................................... 5
2.2 Test Article ............................................................................................................ 6
2.3 Background-Oriented Schlieren Theory ................................................................ 6
2.4 Background-Oriented Schlieren Technique........................................................... 6
2.5 Background-Oriented Schlieren Data System ....................................................... 7
3.0 PROCEDURES ................................................................................................................. 7
3.1 Test Conditions ..................................................................................................... 7
3.2 Data Acquisition .................................................................................................... 7
3.3 Data Reduction ...................................................................................................... 8
4.0 RESULTS AND DISCUSSION .......................................................................................... 8
5.0 SUMMARY ........................................................................................................................ 9
REFERENCES ................................................................................................................ 10
FIGURES
Figure
1. Launch Abort System Test Article Details ......................................................................... 11
2. Crew Exploration Vehicle Test Article Installed in Tunnel 16T HAAS Cart. ...................... 12
3. BOS System Configuration ............................................................................................... 13
4. BOS System Schematic Looking Downstream ................................................................. 14
5. BOS Installation Photos .................................................................................................... 15
6. Close-Up Image of BOS Dot Pattern Applied to East Wall ............................................... 16
7. Large JM (PTJM = avg) Nozzle BOS Visualization During Configuration 101 High-Pressure Air Checkout and Simulated Schlieren Images for a Multipass Processor Using a 32 x 32 Pixel Region at 50% Overlap Down to a 16 x 16 Pixel Region at 87% Overlap ..................................................................................................... 17
8. Large JM Nozzle (PTJM = avg) BOS Visualization During Configuration 101 High-Pressure Air Checkout and Simulated Schlieren Images for a Multipass Processor Using a 64 x 64 Pixel Region at 75% Overlap Down to a 32 x 32 Pixel Region at 87% Overlap ..................................................................................................... 17
1Statement A: Approved for public release; distribution is unlimited.
AEDC-TR-09-T-13
9. Small JM (PTJM = avg) Nozzle BOS Visualization During Configuration 101 High-Pressure Air Checkout and Simulated Schlieren Images for a Multipass Processor Using a 32 x 32 Pixel Region at 50% Overlap Down to a 16 x 16 Pixel Region at 87% Overlap ..................................................................................................... 18
10. Small JM Nozzle (PTJM = avg) BOS Visualization During Configuration 101 High-Pressure Air Checkout and Simulated Schlieren Images for a Multipass Processor Using a 64 x 64 Pixel Region at 75% Overlap Down to a 32 x 32 Pixel Region at 87% Overlap ..................................................................................................... 18
11. BOS Visualization of C101 Large JM Nozzle (PTJM = avg) at Mach 0.7 and 4 Model Attitudes. Processed with Mach 0.7 Jet-Off Background Image ...................................... 19
12. BOS Visualization of C101 Small JM Nozzle (PTJM = avg) at Mach 0.7 and 4 Model Attitudes. Processed with Mach 0.7 Jet-Off Background Image ...................................... 20
13. BOS Visualization of C103 Large JM Nozzle (PTJM = avg) at Mach 0.5 and 4 Model Attitudes. Processed with Mach 0.5 Jet-Off Background Image ...................................... 21
14. BOS Visualization of C103 Small JM Nozzle (PTJM = avg) at Mach 0.5 and 4 Model Attitudes. Processed with Mach 0.5 Jet-Off Background Image ...................................... 22
15. BOS Visualization of C103 Large JM Nozzle (PTJM = avg) at Mach 0.9 and 4 Model Attitudes. Processed with Mach 0.9 Jet-Off Background Image ...................................... 23
16. BOS Visualization of C103 Small JM Nozzle (PTJM = avg) at Mach 0.9 and 4 Model Attitudes. Processed with Mach 0.9 Jet-Off Background Image ...................................... 24
17. BOS Visualization of C103 Large JM Nozzle (PTJM = avg) at Mach 1.2 and 4 Model Attitudes. Processed with Mach 1.2 Jet-Off Background Image ...................................... 25
18. BOS Visualization of C103 Small JM Nozzle (PTJM = avg) at Mach 1.2 and 4 Model Attitudes. Processed with Mach 1.2 Jet-Off Background Image ...................................... 26
19. BOS Visualization of C105 Large JM Nozzle (PTJM = avg) at Mach 0.9 and 2 Model Attitudes. Processed with Mach 0.9 Jet-Off Background Image ...................................... 27
20. BOS Visualization of C105 Small JM Nozzle (PTJM = avg) at Mach 0.9 and 2 Model Attitudes. Processed with Mach 0.9 Jet-Off Background Image ...................................... 27
21. BOS Visualization of C105 Large JM Nozzle (PTJM = avg) at Mach 1.2 and 4 Model Attitudes. Processed with Mach 1.2 Jet-Off Background Image ...................................... 28
22. BOS Visualization of C105 Small JM Nozzle (PTJM = avg) at Mach 1.2 and 2 Model Attitudes. Processed with Mach 1.2 Jet-Off Background Image ...................................... 29
23. BOS Visualization of C106 Small JM Nozzle (PTJM = avg) at Mach 0.9 and 2 Model Attitudes. Image (a) was Processed Using the Atmosphere Jet-Off Background Image Due to Model Dynamics, While Image (b) Used the Mach 0.9 Jet-Off Background Image ................................................................................................ 29
24. BOS Visualization of C106 Large JM Nozzle (PTJM = avg) at Mach 0.9 and 4 Model Attitudes. Image (a) was Processed Using the Atmosphere Jet-Off Background Image Due to Model Dynamics. Images (b)-(d) were Processed Using the Mach 0.9 Jet-Off Background Image ................................................................ 30
25. BOS Visualization of C106 Large JM Nozzle (PTJM = avg) at Mach 1.2 and 4 Model Attitudes. Processed with Mach 1.2 Jet-Off Background Image ...................................... 31
2Statement A: Approved for public release; distribution is unlimited.
AEDC-TR-09-T-13

26. BOS Visualization of C106 Small JM Nozzle (PTJM = avg) at Mach 1.2 and 4 Model Attitudes. Processed with Mach 1.2 Jet-Off Background Image ...................................... 32
27. BOS Visualization of C107 Large JM Nozzle (PTJM = avg) at Mach 0.9 and 4 Model Attitudes. Processed with Mach 0.9 Jet-Off Background Image ...................................... 33
28. BOS Visualization of C107 Small JM Nozzle (PTJM = avg) at Mach 0.9 and 4 Model Attitudes. Processed with Mach 0.9 Jet-Off Background Image ...................................... 34
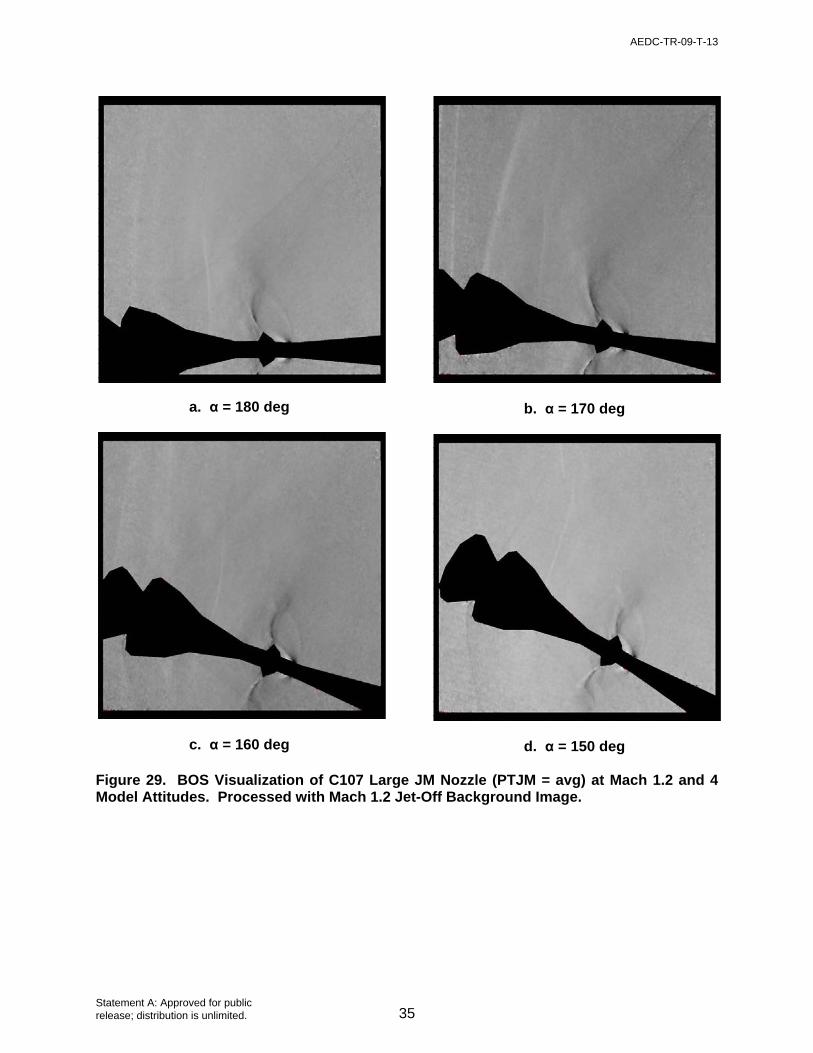
29. BOS Visualization of C107 Large JM Nozzle (PTJM = avg) at Mach 1.2 and 4 Model Attitudes. Processed with Mach 1.2 Jet-Off Background Image ...................................... 35
30. BOS Visualization of C107 Small JM Nozzle (PTJM = avg) at Mach 1.2 and 4 Model Attitudes. Processed with Mach 1.2 Jet-Off Background Image ...................................... 36
31. BOS Visualization of C109 Large JM Nozzle at Mach 0.5 and Pitched to 170 deg for 3 Nozzle Pressures. Processed with Mach 0.5 Jet-Off Background Image ..................... 37
32. BOS Visualization of C109 Large JM Nozzle at Mach 0.9 and Pitched to 170 deg for 3 Nozzle Pressures. Processed with Mach 0.9 Jet-Off Background Image ..................... 38
33. BOS Visualization of C109 Large JM Nozzle at Mach 1.2 and Pitched to 170 deg for 3 nozzle Pressures. Processed with Mach 1.2 Jet-Off Background Image ..................... 39
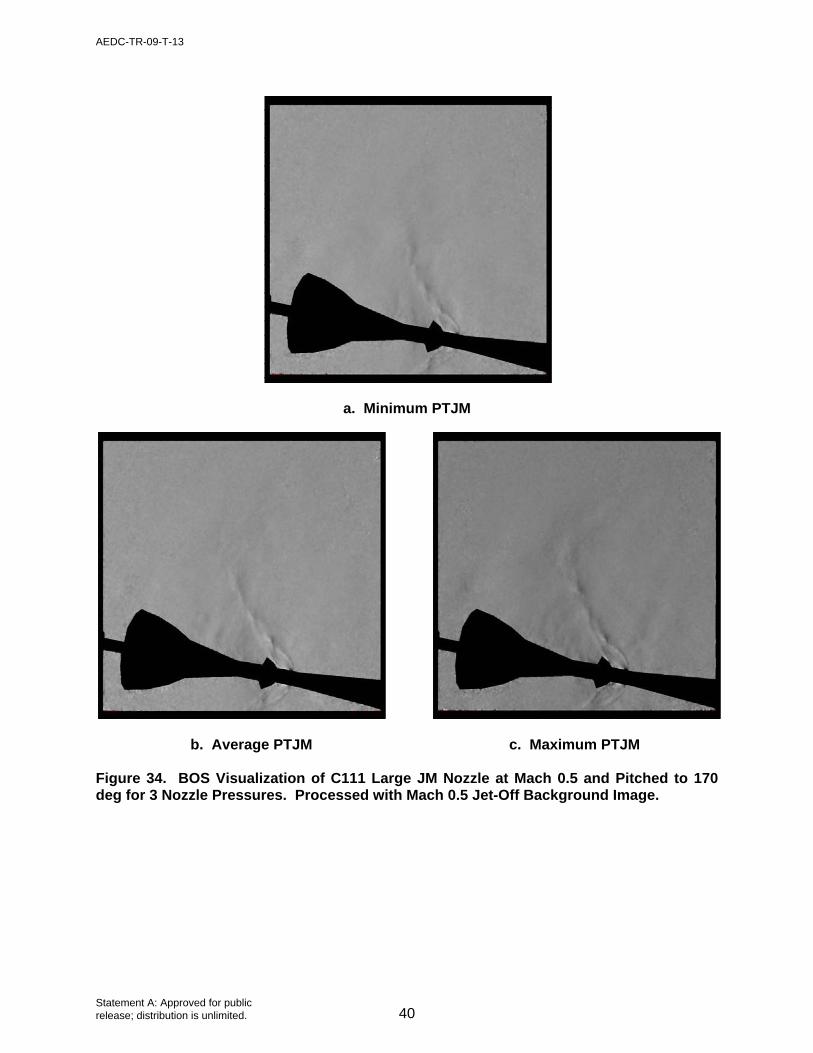
34. BOS Visualization of C111 Large JM Nozzle at Mach 0.5 and Pitched to 170 deg for 3 Nozzle Pressures. Processed with Mach 0.5 Jet-Off Background Image ..................... 40
35. BOS Visualization of C111 Large JM Nozzle at Mach 0.9 and Pitched to 170 deg for 3 Nozzle Pressures. Processed with Mach 0.9 Jet-Off Background Image ..................... 41
36. BOS Visualization of C111 Large JM Nozzle at Mach 1.2 and Pitched to 170 deg for 3 Nozzle Pressures. Processed with Mach 1.2 Jet-Off Background Image ..................... 42
TABLES
Table
1. Nominal Test Conditions ................................................................................................... 43
2. Run Number Summary ..................................................................................................... 43
APPENDICES
Appendix
A. Lamina BL3000 Series LED SPECIFICATION .................................................................. 45
B. Axon Retroreflective Paint ................................................................................................. 48
C. Photometrics CoolSNAP K4 Camera ................................................................................ 51
NOMENCLATURE .......................................................................................................... 53
3Statement A: Approved for public release; distribution is unlimited.
AEDC-TR-09-T-13

1.0 INTRODUCTION
The background-oriented schlieren (BOS) data acquisition system in the Arnold Engineering Development Center’s (AEDC) Propulsion Wind Tunnel (PWT) 16T was used to visualize the jettison motor (JM) plumes on a scaled NASA Orion Launch Abort System (LAS). The overall objective of this effort was to provide plume visualization of the NASA Crew Exploration Vehicle (CEV) Jettison Motors and their mutual interaction with the freestream flow. For this test a single optical port was used to accommodate a high-resolution CCD camera (4MP) and two white LED arrays. A pseudo-random pattern of 3/16-in. black dots applied over a 9- by 9-ft area of retroreflective paint on the opposite wall provided the image background texture required for BOS processing.
During testing, multiple air-on images were acquired at each selected test condition to record apparent distortion of a background dot pattern caused by flow-induced refractive index gradients within the test article flow field. Displacement vectors that indicate the direction and magnitude of flow-induced background pattern distortion were computed by cross-correlating each air-on image with an undistorted reference image acquired with the jets off. Standard Particle Image Velocimetry (PIV) software was used to calculate displacement vectors and create grayscale images that resemble schlieren photographs.
2.0 APPARATUS
2.1 TEST FACILITY
The AEDC Propulsion Wind Tunnel 16T is a closed-loop, continuous-flow, variable-density tunnel capable of being operated at Mach numbers from 0.06 to 1.60 and stagnation pressures from 120 to 4,000 psfa. The maximum attainable Mach number can vary slightly depending upon the tunnel pressure ratio requirements of a particular test installation. The maximum stagnation pressure attainable is a function of Mach number and available electric power. The tunnel stagnation temperature can be varied from approximately 60 to 160°F depending upon the available cooling water temperature. The tunnel is equipped with a scavenging system that removes combustion products when rocket motors or turbo-engines are being tested.
The high-angle automated sting (HAAS) cart was used during the test. It has a 16-ft-square by 40-ft-long test section enclosed by porous walls. The wall porosity is fixed at 6% and is provided by regularly spaced 0.75-in.-diam holes, which are inclined upstream at a 60-deg angle. The test section is completely enclosed in a plenum chamber from which air is evacuated at transonic and supersonic conditions, thus removing part of the tunnel airflow boundary layer through the porous walls of the test section. The HAAS test section has a sidewall angle variation capability from -2.0 deg (convergence) to 0.8 deg (divergence). To compensate for the HAAS strut blockage, each sidewall has a bulge section 6.0 in. deep. The model support system consisted of a pitch sector and sting attachment with a pitch capability from approximately -3 to 40 deg (position 2) with respect to the tunnel centerline and a roll capability of 180 deg about the sting centerline.
No conventional schlieren system is available in Tunnel 16T because of spatial restrictions and optical access limitations imposed by the porous walls. Additional information about Tunnel 16T, its capabilities, its operating characteristics, and its support systems is presented in Ref. 1.
5Statement A: Approved for public release; distribution is unlimited.
AEDC-TR-09-T-13

2.2 TEST ARTICLE
The test article was a scaled model of the NASA Orion LAS including the Crew Module (CM), Boost Protective Cover (BPC), and Launch Abort Tower (LAT) as shown in Fig. 1. The model was mounted with the CM heat shield forward while simulating rocket plumes from the four JM ports located on the LAT with high-pressure air. Figure 2 shows the test article installed in the 16T HAAS cart. Several different model configurations were tested. Configuration 101 included the CM only, while configurations 103 through 111 incorporated different translations and pitch angularities of the CM with respect to the LAT.
2.3 BACKGROUND-ORIENTED SCHLIEREN THEORY
Just as in classical schlieren photography, background-oriented schlieren exploits the relationship between the density and refractive index of a gas. When a light ray passes through a medium with a refractive index gradient, the ray is bent in the direction of increasing density. The refractive index of a fluid can be related to the density by the empirical Gladstone-Dale equation
DGKn
1, (1)
where KG-D, the Gladstone-Dale constant, is constant for a given gas (Refs. 2, 3), ρ is the density, and n is the index of refraction. The radius of curvature of a light ray passing through a gas can be expressed as inversely proportional to the gradient of the index of refraction, or
nR
1
, (2)
where R is the radius of curvature and n is the index of refraction.
The deflected angle of the light ray, ε, is given by:
DGLKR
L, (3)
where L is the path length traveled by the light ray and ρ is the density gradient. This relation shows that the deflection of the light ray is proportional to the density gradient of the medium through which it is travelling.
2.4 BACKGROUND-ORIENTED SCHLIEREN TECHNIQUE
The BOS technique differs from classical schlieren imagery in that images are acquired and then post-processed to visualize the density gradients in the flow field. Figure 3 is a conceptual drawing of the BOS installation showing the arrangement of the digital camera, LED light source, and East wall dot pattern relative to the test article. Two images of the dot pattern have to be acquired for BOS visualizations: one during a wind-off event (zero-density gradients) and a second during wind-on, or in the presence of density gradients and the associated background pattern distortion. Algorithms in standard Particle Image Velocimetry (PIV) software can be used to cross-correlate the two images and calculate the displacement vectors from the two images. The displacement vectors represent the local deflection of the light rays as they
Statement A: Approved for public release; distribution is unlimited.
AEDC-TR-09-T-13
6
pass through the gradients within the measurement volume. Plotting scalar values extracted from vector components allow schlieren-like images to be created. For the purpose of this test, BOS images were acquired for qualitative visualization.
2.5 BACKGROUND-ORIENTED SCHLIEREN DATA SYSTEM
A BOS system is comprised of four main components: a high-resolution digital camera, a light source, a painted dot pattern, and a data acquisition/analysis computer. Figure 4 shows a schematic of the BOS system installation. Installation photographs of the system components are presented in Fig. 5. The background pattern (Fig. 5a) consists of a 9- x 9-ft area of retroreflective paint applied to the tunnel east wall. Random black dots were then stamped on top of the retroreflective paint to provide a suitable background texture for the BOS images (Fig. 6). The dot size of approximately 3/16-in. diameter was chosen to appear as 3-5 pixel diameter dots when imaged to allow for subpixel accuracy during cross-correlation using PIV software (Ref. 4). One Photometrics® CoolSNAP™ K4 12-bit, interline transfer camera with 2,048 x 2,048 pixel spatial resolution was installed level with the test section centerline at a tunnel station 174 in. from the beginning of the test section (Fig. 2). At the expense of perspective distortion, the camera was angled approximately 12 deg both upstream and above the model in the tunnel. This arrangement provided a field of view approximately 4.5 x 4.5 ft around the CEV to visualize the JM jet plumes. The camera was outfitted with an 18-35 mm focal length zoom lens (f/5.6), and a 500-µs exposure time was used to provide a sufficient contrast ratio. Two light sources, each configured with eight Lamina® BL-3000™ white LED arrays, were positioned above and below the camera to illuminate the retroreflective paint. Each LED array consisted of 39 individual cavities for a total of 624 LEDs. A PC with a single quad-core processor was used to control the cameras and data acquisition. The camera was connected to the computer via a PCI card and fiber optic cable. WinView32™ was used for image acquisition, while LaVision® DaVis™ software was used to process and export the final BOS videos and images.
3.0 PROCEDURES
3.1 TEST CONDITIONS
The test was conducted at a constant unit Reynolds number of 1.0 million/ft. The interaction of the model and the JM jet plumes was assessed for configurations 101-107 at Mach numbers of 0.5, 0.7, 0.9, and 1.2 for corresponding average jettison motor pressures (PTJM). For configurations 109 and 111, three different PTJM pressures were imaged corresponding to the minimum, maximum, and average nozzle pressure at one model attitude. The nominal test conditions established during the test are given in Table 1. Several test points were omitted due to model dynamics. A test run summary is presented in Table 2. Run numbers are tabulated in the appropriate Mach number column next to the associated test condition, model configuration, and model attitudes.
3.2 DATA ACQUISITION
BOS images were acquired for seven different model configurations under three circumstances; wind-off jet-off, wind-on jet-off at test condition, and wind-on jet-on at test condition. Selective postprocessing of these data points allows for jet-on and wind-on phenomena to be distinguished separately. This is especially useful in the transonic regime where flow may be locally accelerated and local supersonic regions become apparent around the test article. Sets of 5 background images were acquired for each model attitude at both jet-off conditions, and sets of 10 images were acquired for each model attitude at the jet-on condition, each at 1.5 Hz.
7Statement A: Approved for public release; distribution is unlimited.
AEDC-TR-09-T-13

For each test condition the model was paused at each selected roll and pitch angle to allow the acquisition of multiple BOS images. Comparison of the large and small JM plumes was accomplished by rolling the model to -135 and -225 deg, respectively, and thus positioning each JM in turn on top of the model and in the BOS field of view. At each roll angle, images were acquired with the model pitched to angles of 180, 170, 160 and 150 deg. Images were stored based on the facility run and point numbers for association with the analogous test conditions.
3.3 DATA REDUCTION
Upon acquisition, each image set was stored as a single, 10-frame image file. For data reduction, the 10 image frames were separated into single images and converted to a standard 12-bit TIFF file. Each jet-on data set was paired with its appropriate jet-off wind-on background image and imported into DaVis™ for postprocessing. Alternately, wind-off jet-off images were used as background for processing the data in Figs 23a and 24a because model dynamics prevented the acquisition of wind-on jet-off data for those conditions. Additionally, only wind-off jet-off backgrounds were available for processing the wind-off jet-on images in Figs. 7 through 10. Once these files were imported, a batch processor was set up to 1) create wind-off/wind-on image pairs, 2) apply an image mask around the test article, 3) cross-correlate the image pairs using PIV algorithms, and 4) extract the scalar field for contour plots. A mask of each configuration and model attitude was created to reduce the number of stray and spurious vectors from around the edges of the test article. The mask also reduces the number of processed pixels, which slightly decreases the overall processing time.
For the data represented in Figs. 7 through 36, two main PIV processing schemes were employed. The first processing scheme was used during the high-pressure air checkout of the JMs (Figs. 7 through 10). This scheme used a multipass correlation algorithm with initial window size of 64 x 64 pixels at 75% overlap down to a final window size of 32 x 32 pixels at 87% overlap. The second processing scheme employed on the remaining data sets also used a multipass algorithm; however an initial interrogation volume of 32 x 32 pixels with 50% overlap was used and processed down to a 16 x 16 pixel region with 87% overlap. The second process (finer grid) resulted in data loss for the high-pressure air checkouts of the JMs because of the large density gradients in the plumes. Therefore, the first processing scheme was used and resulted in lower resolution images.
After each vector field was computed for each of the data sets, scalar fields were extracted. Density gradients were the strongest in the streamwise direction; therefore, the scalar fields representing vertical knife edge schlieren images are presented herein with the exception of the JM high-pressure air checkout. Both vertical and horizontally simulated schlieren images are presented in Figs. 7 through 10 for the JM to more clearly depict the shock diamond pattern within the plume.
4.0 RESULTS AND DISCUSSION
Figures 7 through 36 show a representative dataset from the BOS tunnel entry and include only a single image from each unique configuration and model attitude combination. The full dataset that was delivered to the customer includes all 10 images for each combination, presented both individually and as pseudo-video clips displayed at 1 Hz. The package also included additional images that were processed using wind-off jet-off data for background.
Prior to the wind-on runs, a series of images were acquired during the tunnel wind-off high-pressure air checkout to determine whether BOS would be feasible for visualization of the JM
8Statement A: Approved for public release; distribution is unlimited.
AEDC-TR-09-T-13
plumes during the remainder of the test. Figures 7 through 10 show these results and confirm the applicability of the BOS system for plume visualization.
Figures 7 and 9 show the large and small JM plumes, respectively, for configuration 101, crew module (CM) only and show the shock diamonds as well as the upstream plume propagation. This image set was processed using a multipass processing scheme with initial interrogation region of 32 x 32 pixels and 50% overlap down to a 16 x 16 pixel region with 87% overlap. The images in Figs. 8 and 10 used a similar processor; however, they used an initial region of 64 x 64 pixels with 50% overlap down to a 32 x 32 pixel region with an overlap of 87%. Horizontal (a) and vertical (b) knife edge schlieren images were simulated during postprocessing to differentiate between vertical and horizontal density gradients. Note the resolution differences between Figs. 7 and 8 as well as Figs. 9 and 10 due to the finer grid processor used in Figs. 7 and 9. Although a finer grid may give more detail of the system, notice that the data fall out around the nozzle exit as indicated by the black pixels. Density gradients are extremely strong in this region, resulting in large displacements of the background dot pattern and violating the allowable displacement within an interrogation window. This violation results in a bad vector and missing data on the final BOS image. The problem is mitigated when processed using a larger window size.
Figures 11 through 30 show the JM nozzle plumes in flows of Mach 0.5, 0.7, 0.9, and 1.2 grouped in order of configuration number at the corresponding average jettison motor total pressures (PTJM). Small and large JM nozzle geometries were imaged for configurations 101 through 107. Due to model dynamics, several model attitudes had to be omitted. Jet-off images could not be captured for configuration 106 in Mach 0.9 flow and pitched to 180 deg due to model dynamics. Similarly, jet-on images at higher angles of attack could not be acquired in configurations 105 and 106 at Mach numbers of 0.9 and 1.2.
For configurations 109 and 111, only one model attitude was imaged for the large JM at 2 Mach numbers. Figures 31 through 36 show the minimum, maximum, and average pressure setting for the JMs in Mach 0.9 and 1.2 flows.
5.0 SUMMARY
The AEDC BOS data acquisition and analysis system has recently been improved and implemented for use in the 16-ft transonic wind tunnel. The improvements were demonstrated during the subject test performed in support of the Orion program. Background and wind-on image pairs of an optical dot pattern were acquired and cross-correlated using standard PIV data reduction techniques to provide plume visualization of the jettison motor jet plumes and their mutual interaction with the NASA CEV flow field.
The authors would like to acknowledge the work and support of the NASA CEV test team. A special thanks to Matt Rhode from NASA Langley; Chuck Niskey from Black Ram; Jim Ross, J.T. Heineck, and Louise Walker from NASA Ames; and Win Phipps, Charlie Smith, Reggie Riddle, and David Smith from AEDC. Without the assistance, patience, and expertise of these individuals, this test would not have been successful.
9Statement A: Approved for public release; distribution is unlimited.
AEDC-TR-09-T-13

REFERENCES
1. Test Facilities Handbook, Vol. 4, “Propulsion Wind Tunnel Facility,” Arnold Engineering Development Center, May 1992 (Thirteenth Edition).
2. Ladenburg, R. W., Lewis, B., Pease, R. N., and Taylor, H. S. Physical Measurements in Gas Dynamics and Combustion. Princeton University Press, New Jersey, 1954.
3. Shapiro, A. H. The Dynamics and Thermodynamics of Compressible Fluid Flow. John Wiley and Sons, New York, 1953.
4. Santiago, J. G., Wereley, S. T., Meinhart, C. D., Beebe, D. J. and Adrian, R. J., “A Particle Image Velocimetry System for Microfluidics,” Experiments in Fluids. Vol. 25, 1998, pp. 316-319.
10Statement A: Approved for public release; distribution is unlimited.
AEDC-TR-09-T-13

Figure 1. Launch Abort System Test Article Details.
Attached to HAAS
Support System
JM Rocket Plume
Simulation
CM Extends, Translates
Vertically, and Pitches
Tunnel Free-Stream Flow
Test Article
ARES Launch Abort VehicleOrion Launch Abort Vehicle
11Statement A: Approved for public release; distribution is unlimited.
AEDC-TR-09-T-13

Fig
ure
2.
Cre
w E
xplo
rati
on
Veh
icle
Tes
t A
rtic
le In
stal
led
in T
un
nel
16T
HA
AS
Car
t.
12Statement A: Approved for public release; distribution is unlimited.
AEDC-TR-09-T-13

Fig
ure
3.
BO
S S
yste
m C
on
fig
ura
tio
n.
13Statement A: Approved for public release; distribution is unlimited.
AEDC-TR-09-T-13

Fig
ure
4.
BO
S S
yste
m S
chem
atic
Lo
oki
ng
Do
wn
stre
am.
14Statement A: Approved for public release; distribution is unlimited.
AEDC-TR-09-T-13

a. Model Configuration 101 in Front of the Dot Pattern on the East Wall.
b. Camera and LED Arrays in the West Wall Optical Port.
Figure 5. BOS Installation Photos.
15Statement A: Approved for public release; distribution is unlimited.
AEDC-TR-09-T-13
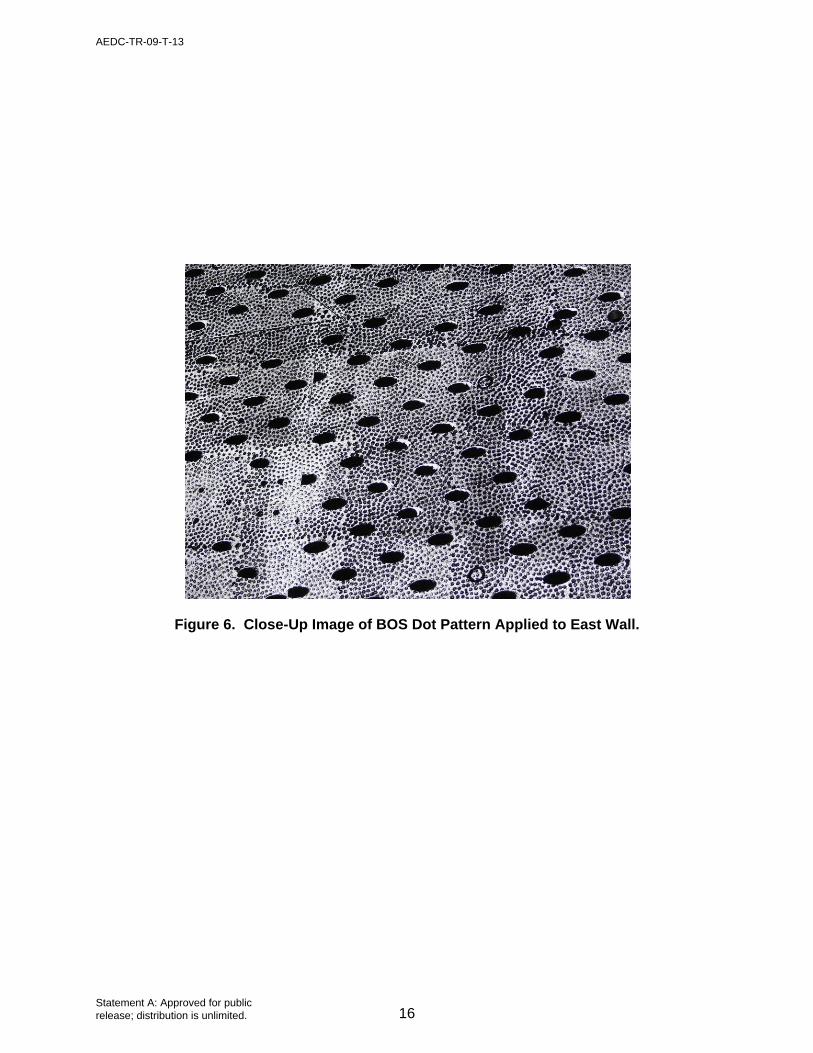
Figure 6. Close-Up Image of BOS Dot Pattern Applied to East Wall.
16Statement A: Approved for public release; distribution is unlimited.
AEDC-TR-09-T-13

a. Vertical Knife-Edge (x-component)
b. Horizontal Knife-Edge (y-component)
Figure 7. Large JM (PTJM = avg) Nozzle BOS Visualization During Configuration 101 High-Pressure Air Checkout and Simulated Schlieren Images for a Multipass Processor Using a 32 x 32 Pixel Region at 50% Overlap Down to a 16 x 16 Pixel Region at 87% Overlap.
a. Vertical Knife-Edge (x-component)
b. Horizontal Knife-Edge (y-component) Figure 8. Large JM Nozzle (PTJM = avg) BOS Visualization During Configuration 101 High-Pressure Air Checkout and Simulated Schlieren Images for a Multipass Processor Using a 64 x 64 Pixel Region at 75% Overlap Down to a 32 x 32 Pixel Region at 87% Overlap.
17Statement A: Approved for public release; distribution is unlimited.
AEDC-TR-09-T-13

a. Vertical Knife-Edge (x-component)
b. Horizontal Knife-Edge (y-component)
Figure 9. Small JM (PTJM = avg) Nozzle BOS Visualization During Configuration 101 High-Pressure Air Checkout and Simulated Schlieren Images for a Multipass Processor Using a 32 x 32 Pixel Region at 50% Overlap Down to a 16 x 16 Pixel Region at 87% Overlap.
a. Vertical Knife-Edge (x-component)
b. Horizontal Knife-Edge (y-component)
Figure 10. Small JM Nozzle (PTJM = avg) BOS Visualization During Configuration 101 High-Pressure Air Checkout and Simulated Schlieren Images for a Multipass Processor Using a 64 x 64 Pixel Region at 75% Overlap Down to a 32 x 32 Pixel Region at 87% Overlap.
18Statement A: Approved for public release; distribution is unlimited.
AEDC-TR-09-T-13

a. α = 180 deg
c. α = 160 deg
b. α = 170 deg
d. α = 150 deg
Figure 11. BOS Visualization of C101 Large JM Nozzle (PTJM = avg) at Mach 0.7 and 4 Model Attitudes. Processed with Mach 0.7 Jet-Off Background Image.
19Statement A: Approved for public release; distribution is unlimited.
AEDC-TR-09-T-13

a. α = 180 deg
c. α = 180 deg
b. α = 180 deg
d. α = 180 deg Figure 12. BOS Visualization of C101 Small JM Nozzle (PTJM = avg) at Mach 0.7 and 4 Model Attitudes. Processed with Mach 0.7 Jet-Off Background Image.
20Statement A: Approved for public release; distribution is unlimited.
AEDC-TR-09-T-13

a. α = 180 deg
c. α = 160 deg
b. α = 170 deg
d. α = 150 deg
Figure 13. BOS Visualization of C103 Large JM Nozzle (PTJM = avg) at Mach 0.5 and 4 Model Attitudes. Processed with Mach 0.5 Jet-Off Background Image.
21Statement A: Approved for public release; distribution is unlimited.
AEDC-TR-09-T-13

a. α = 180 deg
c. α = 160 deg
b. α = 170 deg
d. α = 150 deg
Figure 14. BOS Visualization of C103 Small JM Nozzle (PTJM = avg) at Mach 0.5 and 4 Model Attitudes. Processed with Mach 0.5 Jet-Off Background Image.
22Statement A: Approved for public release; distribution is unlimited.
AEDC-TR-09-T-13

a. α = 180 deg
c. α = 160 deg
b. α = 170 deg
d. α = 150 deg
Figure 15. BOS Visualization of C103 Large JM Nozzle (PTJM = avg) at Mach 0.9 and 4 Model Attitudes. Processed with Mach 0.9 Jet-Off Background Image.
23Statement A: Approved for public release; distribution is unlimited.
AEDC-TR-09-T-13

a. α = 180 deg
c. α = 160 deg
b. α = 170 deg
d. α = 150 deg
Figure 16. BOS Visualization of C103 Small JM Nozzle (PTJM = avg) at Mach 0.9 and 4 Model Attitudes. Processed with Mach 0.9 Jet-Off Background Image.
24Statement A: Approved for public release; distribution is unlimited.
AEDC-TR-09-T-13

a. α = 180 deg
c. α = 160 deg
b. α = 170 deg
d. α = 150 deg Figure 17. BOS Visualization of C103 Large JM Nozzle (PTJM = avg) at Mach 1.2 and 4 Model Attitudes. Processed with Mach 1.2 Jet-Off Background Image.
25Statement A: Approved for public release; distribution is unlimited.
AEDC-TR-09-T-13

a. α = 180 deg
c. α = 160 deg
b. α = 170 deg
d. α = 150 deg Figure 18. BOS Visualization of C103 Small JM Nozzle (PTJM = avg) at Mach 1.2 and 4 Model Attitudes. Processed with Mach 1.2 Jet-Off Background Image.
26Statement A: Approved for public release; distribution is unlimited.
AEDC-TR-09-T-13

a. α = 180 deg
b. α = 170 deg
Figure 19. BOS Visualization of C105 Large JM Nozzle (PTJM = avg) at Mach 0.9 and 2 Model Attitudes. Processed with Mach 0.9 Jet-Off Background Image.
c. α = 160 deg
d. α = 150 deg
Figure 20. BOS Visualization of C105 Small JM Nozzle (PTJM = avg) at Mach 0.9 and 2 Model Attitudes. Processed with Mach 0.9 Jet-Off Background Image.
27Statement A: Approved for public release; distribution is unlimited.
AEDC-TR-09-T-13

a. α = 180⁰
c. α = 160⁰
b. α = 170⁰
d. α = 150⁰ Figure 21. BOS Visualization of C105 Large JM Nozzle (PTJM = avg) at Mach 1.2 and 4 Model Attitudes. Processed with Mach 1.2 Jet-Off Background Image.
28Statement A: Approved for public release; distribution is unlimited.
AEDC-TR-09-T-13

a. α = 180 deg
b. α = 170 deg
Figure 22. BOS Visualization of C105 Small JM Nozzle (PTJM = avg) at Mach 1.2 and 2 Model Attitudes. Processed with Mach 1.2 Jet-Off Background Image.
a. α = 180 deg
b. α = 170 deg Figure 23. BOS Visualization of C106 Small JM Nozzle (PTJM = avg) at Mach 0.9 and 2 Model Attitudes. Image (a) was Processed Using the Atmosphere Jet-Off Background Image Due to Model Dynamics, While Image (b) Used the Mach 0.9 Jet-Off Background Image.
29Statement A: Approved for public release; distribution is unlimited.
AEDC-TR-09-T-13

a. α = 180 deg
c. α = 160 deg
b. α = 170 deg
d. α = 150 deg Figure 24. BOS Visualization of C106 Large JM Nozzle (PTJM = avg) at Mach 0.9 and 4 Model Attitudes. Image (a) was Processed Using the Atmosphere Jet-Off Background Image Due to Model Dynamics. Images (b)-(d) were Processed Using the Mach 0.9 Jet-Off Background Image.
30Statement A: Approved for public release; distribution is unlimited.
AEDC-TR-09-T-13

a. α = 180 deg
c. α = 160 deg
b. α = 170 deg
d. α = 150 deg
Figure 25. BOS Visualization of C106 Large JM Nozzle (PTJM = avg) at Mach 1.2 and 4 Model Attitudes. Processed with Mach 1.2 Jet-Off Background Image.
31Statement A: Approved for public release; distribution is unlimited.
AEDC-TR-09-T-13

a. α = 180 deg
c. α = 160 deg
b. α = 170 deg
d. α = 150 deg
Figure 26. BOS Visualization of C106 Small JM Nozzle (PTJM = avg) at Mach 1.2 and 4 Model Attitudes. Processed with Mach 1.2 Jet-Off Background Image.
32Statement A: Approved for public release; distribution is unlimited.
AEDC-TR-09-T-13

a. α = 180 deg
c. α = 160 deg
b. α = 170 deg
d. α = 150 deg Figure 27. BOS Visualization of C107 Large JM Nozzle (PTJM = avg) at Mach 0.9 and 4 Model Attitudes. Processed with Mach 0.9 Jet-Off Background Image.
33Statement A: Approved for public release; distribution is unlimited.
AEDC-TR-09-T-13

a. α = 180 deg
c. α = 160 deg
b. α = 170 deg
d. α = 150 deg
Figure 28. BOS Visualization of C107 Small JM Nozzle (PTJM = avg) at Mach 0.9 and 4 Model Attitudes. Processed with Mach 0.9 Jet-Off Background Image.
34Statement A: Approved for public release; distribution is unlimited.
AEDC-TR-09-T-13
a. α = 180 deg
c. α = 160 deg
b. α = 170 deg
d. α = 150 deg Figure 29. BOS Visualization of C107 Large JM Nozzle (PTJM = avg) at Mach 1.2 and 4 Model Attitudes. Processed with Mach 1.2 Jet-Off Background Image.
35Statement A: Approved for public release; distribution is unlimited.
AEDC-TR-09-T-13

a. α = 180 deg
c. α = 160 deg
b. α = 170 deg
d. α = 150 deg
Figure 30. BOS Visualization of C107 Small JM Nozzle (PTJM = avg) at Mach 1.2 and 4 Model Attitudes. Processed with Mach 1.2 Jet-Off Background Image.
36Statement A: Approved for public release; distribution is unlimited.
AEDC-TR-09-T-13

a. Minimum PTJM
b. Average PTJM
c. Maximum PTJM Figure 31. BOS Visualization of C109 Large JM Nozzle at Mach 0.5 and Pitched to 170 deg for 3 Nozzle Pressures. Processed with Mach 0.5 Jet-Off Background Image.
37Statement A: Approved for public release; distribution is unlimited.
AEDC-TR-09-T-13

a. Minimum PTJM
b. Average PTJM
c. Maximum PTJM
Figure 32. BOS Visualization of C109 Large JM Nozzle at Mach 0.9 and Pitched to 170 deg for 3 Nozzle Pressures. Processed with Mach 0.9 Jet-Off Background Image.
38Statement A: Approved for public release; distribution is unlimited.
AEDC-TR-09-T-13

a. Minimum PTJM
b. Average PTJM
c. Maximum PTJM
Figure 33. BOS Visualization of C109 Large JM Nozzle at Mach 1.2 and Pitched to 170 deg for 3 nozzle Pressures. Processed with Mach 1.2 Jet-Off Background Image.
39Statement A: Approved for public release; distribution is unlimited.
AEDC-TR-09-T-13
a. Minimum PTJM
b. Average PTJM
c. Maximum PTJM
Figure 34. BOS Visualization of C111 Large JM Nozzle at Mach 0.5 and Pitched to 170 deg for 3 Nozzle Pressures. Processed with Mach 0.5 Jet-Off Background Image.
40Statement A: Approved for public release; distribution is unlimited.
AEDC-TR-09-T-13

a. Minimum PTJM
b. Average PTJM
c. Maximum PTJM
Figure 35. BOS Visualization of C111 Large JM Nozzle at Mach 0.9 and Pitched to 170 deg for 3 Nozzle Pressures. Processed with Mach 0.9 Jet-Off Background Image.
41Statement A: Approved for public release; distribution is unlimited.
AEDC-TR-09-T-13

a. Minimum PTJM
b. Average PTJM
c. Maximum PTJM
Figure 36. BOS Visualization of C111 Large JM Nozzle at Mach 1.2 and Pitched to 170 deg for 3 Nozzle Pressures. Processed with Mach 1.2 Jet-Off Background Image.
42Statement A: Approved for public release; distribution is unlimited.
AEDC-TR-09-T-13
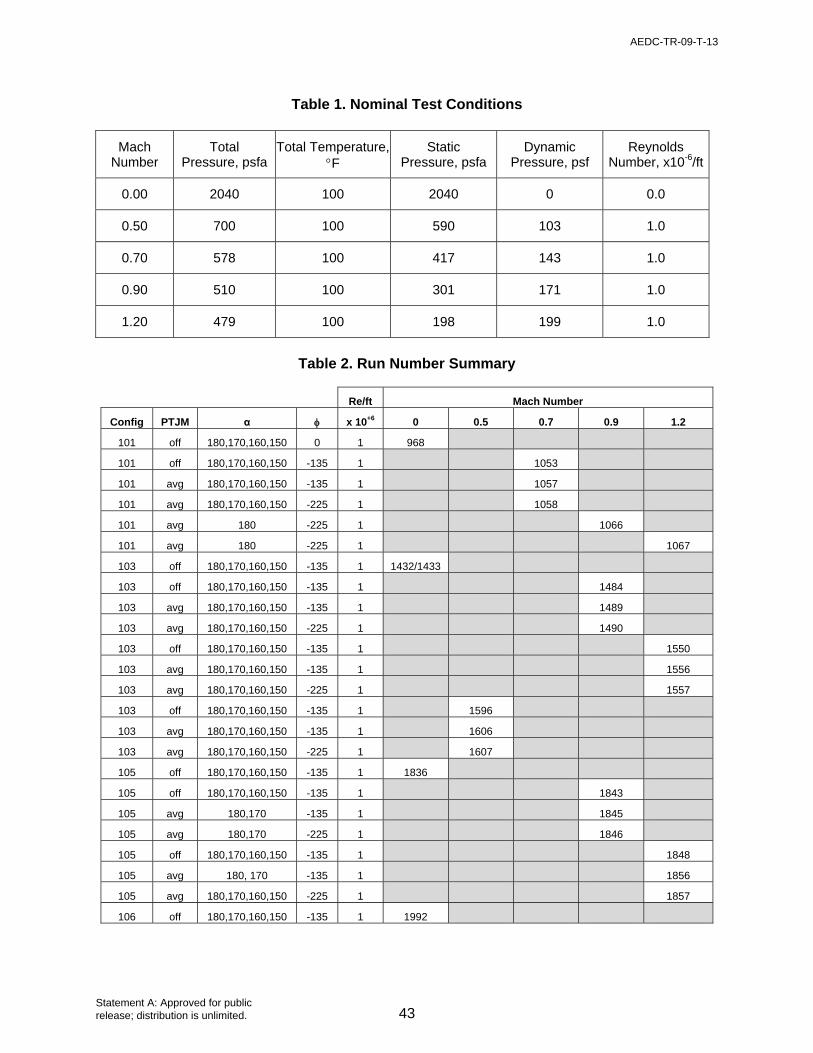
Table 1. Nominal Test Conditions
Mach Number
Total Pressure, psfa
Total Temperature, F
Static Pressure, psfa
Dynamic Pressure, psf
Reynolds Number, x10-6/ft
0.00 2040 100 2040 0 0.0
0.50 700 100 590 103 1.0
0.70 578 100 417 143 1.0
0.90 510 100 301 171 1.0
1.20 479 100 198 199 1.0
Table 2. Run Number Summary
Re/ft Mach Number
Config PTJM α x 10+6 0 0.5 0.7 0.9 1.2
101 off 180,170,160,150 0 1 968
101 off 180,170,160,150 -135 1 1053
101 avg 180,170,160,150 -135 1 1057
101 avg 180,170,160,150 -225 1 1058
101 avg 180 -225 1 1066
101 avg 180 -225 1 1067
103 off 180,170,160,150 -135 1 1432/1433
103 off 180,170,160,150 -135 1 1484
103 avg 180,170,160,150 -135 1 1489
103 avg 180,170,160,150 -225 1 1490
103 off 180,170,160,150 -135 1 1550
103 avg 180,170,160,150 -135 1 1556
103 avg 180,170,160,150 -225 1 1557
103 off 180,170,160,150 -135 1 1596
103 avg 180,170,160,150 -135 1 1606
103 avg 180,170,160,150 -225 1 1607
105 off 180,170,160,150 -135 1 1836
105 off 180,170,160,150 -135 1 1843
105 avg 180,170 -135 1 1845
105 avg 180,170 -225 1 1846
105 off 180,170,160,150 -135 1 1848
105 avg 180, 170 -135 1 1856
105 avg 180,170,160,150 -225 1 1857
106 off 180,170,160,150 -135 1 1992
43Statement A: Approved for public release; distribution is unlimited.
AEDC-TR-09-T-13

Re/ft Mach Number
Config PTJM α x 10+6 0 0.5 0.7 0.9 1.2
106 off 170,160,150 -135 1 2003
106 avg 180,170,160,150 -135 1 2014
106 avg 180,170 -225 1 2015
106 off 180,170,160,150 -135 1 2049
106 avg 180,170,160,150 -135 1 2060
106 avg 180,170,160,150 -225 1 2061
107 off 180,170,160,150 -135 1 2197
107 off 180,170,160,150 -135 1 2203
107 avg 180,170,160,150 -135 1 2214
107 avg 180,170,160,150 -225 1 2215
107 off 180,170,160,150 -135 1 2252
107 avg 180,170,160,150 -135 1 2261
107 avg 180,170,160,150 -225 1 2262
109 off 170 -135 1 2607
109 off 170 -135 1 1641
109 min 170 -135 1 2646
109 avg 170 -135 1 2651
109 max 170 -135 1 2656
109 off 170 -135 1 2686
109 min 170 -135 1 2692
109 avg 170 -135 1 2697
109 max 170 -135 1 2707
109 off 170 -135 1 2751
109 min 170 -135 1 2757
109 avg 170 -135 1 2763
109 max 170 -135 1 2769
111 off 170 -135 1 2929
111 off 170 -135 1 3020
111 min 170 -135 1 3021
111 avg 170 -135 1 3029
111 max 170 -135 1 3042
111 off 170 -135 1 3088
111 min 170 -135 1 3074
111 avg 170 -135 1 3069
111 max 170 -135 1 3062
111 off 170 -135 1 3125
111 min 170 -135 1 3096
111 avg 170 -135 1 3101
111 max 170 -135 1 3106
44Statement A: Approved for public release; distribution is unlimited.
AEDC-TR-09-T-13

APPENDIX A. LAMINA BL3000 SERIES LED SPECIFICATIONS
45Statement A: Approved for public release; distribution is unlimited.
AEDC-TR-09-T-13

46Statement A: Approved for public release; distribution is unlimited.
AEDC-TR-09-T-13

47Statement A: Approved for public release; distribution is unlimited.
AEDC-TR-09-T-13

APPENDIX B. AXON RETROREFLECTIVE PAINT
48Statement A: Approved for public release; distribution is unlimited.
AEDC-TR-09-T-13

49Statement A: Approved for public release; distribution is unlimited.
AEDC-TR-09-T-13

50Statement A: Approved for public release; distribution is unlimited.
AEDC-TR-09-T-13

APPENDIX C. PHOTOMETRICS COOLSNAP K4 CAMERA
51Statement A: Approved for public release; distribution is unlimited.
AEDC-TR-09-T-13

52Statement A: Approved for public release; distribution is unlimited.
AEDC-TR-09-T-13

NOMENCLATURE
Alpha, α Model angle of attack, deg
Phi, Model roll angle, deg
BOS Background-oriented schlieren
BPC Boost protective cover
CCD Charged coupled device
CEV Crew Exploration Vehicle
CFD Computational fluid dynamics
CM Crew Module
Config Model configuration number
F.S. Model fuselage station, model scale in.
HAAS High-angle automated sting
KVM Keyboard, video, mouse
LAT Launch abort tower
LED Light emitting diode
Mach Freestream Mach number
P Pressure at wind-on condition, psfa
P Freestream static pressure, psfa
PCI Peripheral Component Interconnect
PTJM Jettison motor total pressure, psia
Re/ft Freestream unit Reynolds number, ft-1
Q Freestream dynamic pressure, psf
t Time, sec
T.S. Tunnel station, in.
53Statement A: Approved for public release; distribution is unlimited.
AEDC-TR-09-T-13