plp 2016-17 kolhapur district executive summary 1
TRANSCRIPT

PLP 2016-17 KOLHAPUR DISTRICT
… 1 …
Executive Summary
1. Characteristics of District Economy
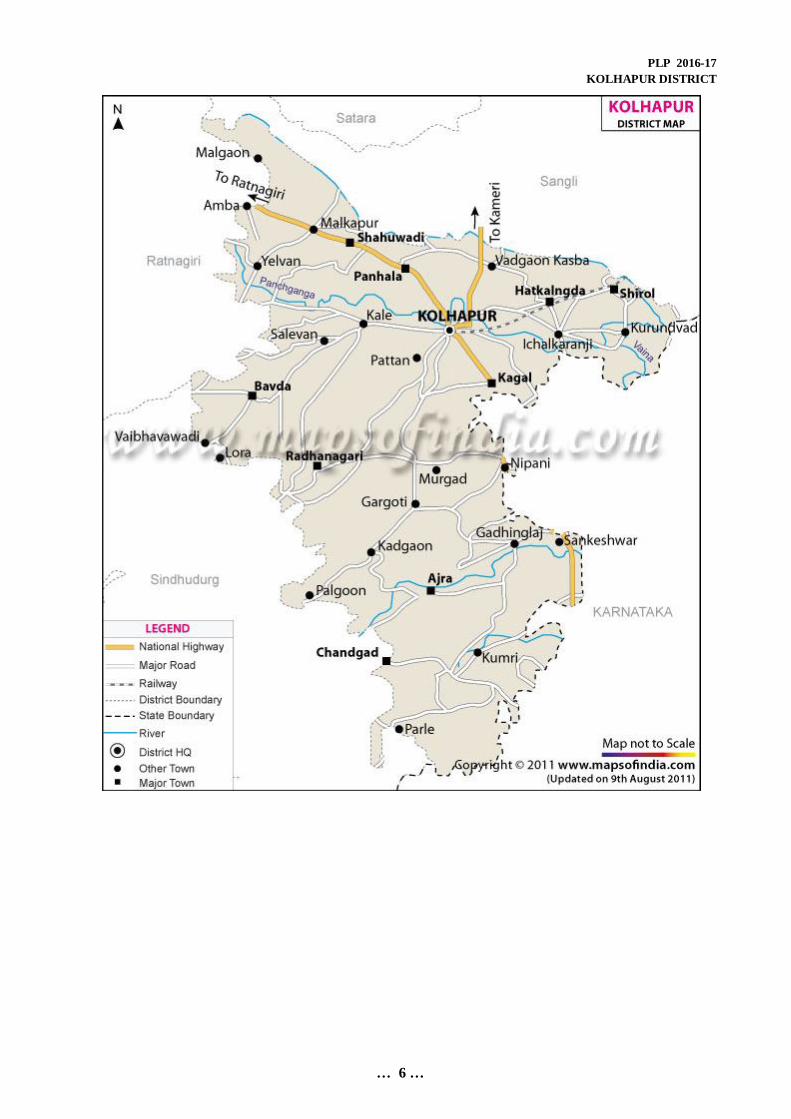
The geographical area of Kolhapur district is 7.76 lakh ha and as per Census-2011 data, the population is 38.76 lakh of which 26.46 lakh is rural population. The district is in the assured rainfall zone with average annual rainfall of 1899.04 mm and is blessed with fertile soil. The economy of Kolhapur district is predominantly agrarian with sugarcane as the major crop. The major kharif crops are paddy, jowar, nagali, cereals, pulses, oils seeds and rabi crops are jowar, wheat, cereals, pulses. Paddy, sugarcane, soyabean, groundnut, vegetables are important crops of district. Out of the Net sown area of 3.91 lakh ha, 1.28 lakh ha is net irrigated area. The district is endowed with 7 main perennial rivers. viz. Panchaganga, Krishna, Warana, Ghataprabha, Doodhganga, Vedganga, Hiranyakeshi. Textile industry through co-operative spinning and weaving mills and small power loom units have developed around Ichalkaranji. ‘Kolhapuri Chappals’, ‘Kolhapuri Jaggery’, “Kolhapuri silver works” are famous in the country for its special Kolhapur ‘touch’.
2. Performance under District Credit Plan during 2014-15
During the year 2014-15, the performance of the banks under Annual Credit Plan in Kolhapur District was as under –
(` in lakh) Sr. No. Item Target Achievement % Achievement
1. Crop Loans 159,675.00 178,693.00 111.91%
2. Agri. And allied terms loans 91,211.00 110,187.00 120.80%
3. NFS 149,878.00 148,345.00 98.98%
4. OPS 79,436.00 80,876.00 101.81%
Total 480,200.00 518,101.00 107.89%
The Annual Credit Plan (ACP) was substantially lower (` 480200.00 lakh) than PLP projections (` 631999.21 lakh) for the year 2014-15. As per SLBC decision during the month of January 2014, Lead Bank Manger had reduced the crop loan target by 30% and taken the crop loan projection to the actual crop loan disbursement as on 31.3.2014. Therefore the ACP target for 2014-15 were on lowerside. Further LDM had increased targets in MSME to ` 149878.00 lakh to match the ACP target to PLP projection.
3. Potential Linked Credit Plan (PLP) Projections for 2016-17
The PLP projections for 2016-17 have been kept higher taking into account the long term potential available in the district in the form of physical units and related natural resources as also revised Priority sector guidelines issued by RBI vide its circular no RBI/2014-15/573 dated April 23,2015. Through PLP, credit potential for

PLP 2016-17 KOLHAPUR DISTRICT
… 2 …
priority sector in Kolhapur district has been assessed at ` 718527.16 lakh, an increase of 8.2% over the potential of ` 663833.49 estimated for the year 2015-16.
(` in lakh)
Sr. No. Item
PLP Projections
2015-16
ACP target 2015-16
PLP Projections
2016-17
Growth (%) vis-a-vis
PLP ACP
1. Crop Loans 261588.50 178814.00 267633.09 2.3% 49.7%
2. Agri. and allied terms loans
163814.68 72890.00 178928.79 9.2% 145.5%
3. MSME 117654.02 164867.00 198041.26 68.3% 18.0%
4. OPS 120776.29 87382.00 73924.02 -38.8% -15.4%
Total 663833.49 503953.00 718527.16 8.2% 41.7%
4. Highlights of Sub-sector wise PLP projections :
a. Crop loans projections of ` 267633.09 lakh constitute a major share (37%) in the credit potential of the district.
b. As per revised RBI guidelines, Agricultural Term Loan has been divided into 3 distinct sub-sectors viz. Farm credit – term loan, Agriculture infrastructure and Ancillary activities. Accelerating the pace of capital formation in Agriculture sector including allied sector is a concern of our policymakers. Projections of ` 178928.79 lakh have been made for the year 2016-17 constituting 25% of the credit potential under Priority sector.
Out of which, an amount of ` 145561.16 lakh has been assessed for Term Loan under Farm credit. The sub sectors which have been provided focused attention and importance from the point of food security are Minor Irrigation, Farm Mechanization, Animal Husbandry, Plantation and Horticulture.
Credit potential of ` 26654.53 lakh has been estimated for Agriculture infrastructure sector which includes Land Development and Storage structures. Further, projections of ` 6703.10 lakh have been made for Ancillary activities which includes Food and Agro-processing.
Keeping in view the importance of the sector, PLP envisages substantial growth in the credit flow for these activities from the Banking sector.
c. In spite of high potentials for private investments in agricultural sector in the district, the growth in the credit flow has been inhibited due to various factors like landholding pattern, fragmented landholdings, low levels of recovery of bank loans, staff constraints particularly non-availability of technically qualified professionals, infrastructural gaps etc. The PLP has attempted to identify emerging and potential sectors and activities in the district to be supported by the Banks and government agencies together.
d. MSME sector in the district is fairly well developed. The PLP envisages credit flow of ` 198041.26 lakh to MSME (28%). Of this, the estimated credit flow to manufacturing sector is ` 1160.44 lakh (16%) and to the services sector `81997.00 lakh (12%). Inclusion of medium industries/service sector units have been the primary reason for substantial increase in credit potential assessment for the sector.

PLP 2016-17 KOLHAPUR DISTRICT
… 3 …
e. As per revised RBI guidelines, Other Priority Sector has been restructured and now it includes Export credit, Education, Housing, Renewable Energy, Social Infrastructure and others including SHGs/JLGs. The credit flow to the Other Priority Sector has been estimated at ` 73924.02 lakh (10%). The PLP also envisages, among others, credit flow of ` 6322.50 lakh to Self Help Groups, Joint Liability Group / Activity Based Groups thereby providing easy access of banking services to rural poor.
5. Major constraints and suggested action points
a) Low crop diversification, inadequate capital formation in Agriculture, difficulties in getting credit by SF/MF, share croppers/tenant farmers.
b) About 93% of cultivators are SF/MF owning fragmented landholdings underscores the need for promoting JLGs so as to facilitate their access to credit from formal banking system.
c) To reduce the excess use of fertilizers and pesticides by the farmers, there is a need to promote organic farming practices.
d) Considering the large area under sugarcane cultivation, adoption of micro-irrigation systems by the farmers needs to be encouraged. Sugar factories, Govt. agencies, KVKs can play a lead role in this.
e) Dairy loans need to be encouraged on a large scale with tie up arrangements with Milk Unions.
f) To avoid distress sale by farmers, there is a need for promotion of pledge financing against Negotiable Warehouse Receipts (NWRs).
g) Banks may extend loans to MSME sector under CGTMSE.
Conclusion : There is a need for coordinated approach for enhancing capital formation in Agriculture sector, strengthening of SAMIS reporting system, better monitoring and review at BLBC and DLCC meetings, increasing coverage of farmers under KCCs.

PLP 2016-17 KOLHAPUR DISTRICT
… 4 …
SUMMARY OF BROAD SECTOR-WISE PROJECTIONS WITH A PIE DIAGRAM
(` in Lakh)
Sr No Sector
Financial Projections
1 Crop Production, Maintenance and Marketing 267633.09
2 Term Loan for Agriculture and Allied Activites 145561.16
3 Agriculture Infrastructure 26664.53
4 Ancillary Activities 6703.10
5 Total Agriculture ( 1+2+3) 446561.88
6 MSME 198041.26
7 Export Credit 7500.00
8 Education 13425.00
9 Housing 43392.00
10 Renewable Energy 2909.52
11 Others including SHG/JLG, O/D under PMJDY 6322.50
12 Social Infrastructure 375.00
TOTAL PRIORITY SECTOR ( 5+6+7+8+9+10+11+12) 718527.16
Crop Production, Maintenance and Marketing
37%
Term Loan for Agriculture and Allied Activites
20%
Agriculture Infrastructure
4%
Ancillary Activities1%
MSME28%
Export Credit1%
Education2%
Housing6%
Renewable Energy0%
Others (SHG/JLG, O/D under PMJDY)
1%Social Infrastructure
0%
PLP 2016-17 KOLHAPUR DISTRICT
… 5 …
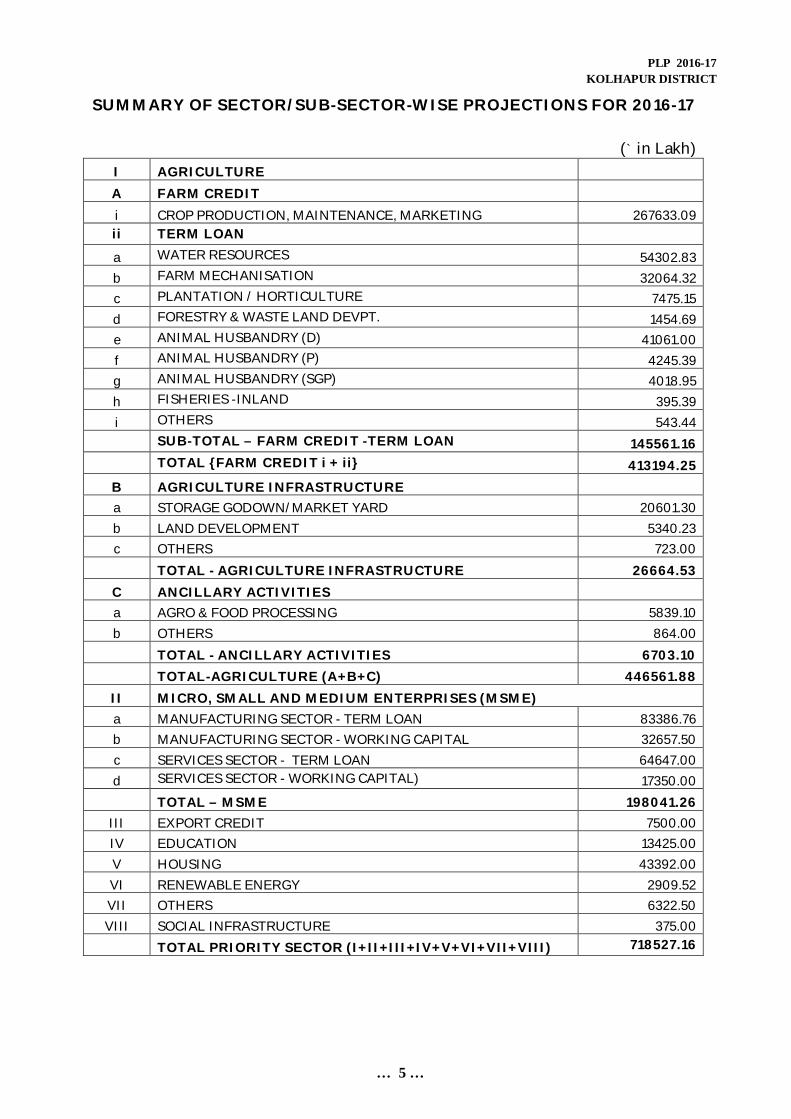
SUMMARY OF SECTOR/SUB-SECTOR-WISE PROJECTIONS FOR 2016-17
(` in Lakh)
I AGRICULTURE
A FARM CREDIT
i CROP PRODUCTION, MAINTENANCE, MARKETING 267633.09 ii TERM LOAN
a WATER RESOURCES 54302.83
b FARM MECHANISATION 32064.32
c PLANTATION / HORTICULTURE 7475.15
d FORESTRY & WASTE LAND DEVPT. 1454.69
e ANIMAL HUSBANDRY (D) 41061.00
f ANIMAL HUSBANDRY (P) 4245.39
g ANIMAL HUSBANDRY (SGP) 4018.95
h FISHERIES -INLAND 395.39
i OTHERS 543.44
SUB-TOTAL – FARM CREDIT -TERM LOAN 145561.16
TOTAL {FARM CREDIT i + ii} 413194.25
B AGRICULTURE INFRASTRUCTURE
a STORAGE GODOWN/MARKET YARD 20601.30
b LAND DEVELOPMENT 5340.23
c OTHERS 723.00
TOTAL - AGRICULTURE INFRASTRUCTURE 26664.53
C ANCILLARY ACTIVITIES
a AGRO & FOOD PROCESSING 5839.10
b OTHERS 864.00
TOTAL - ANCILLARY ACTIVITIES 6703.10
TOTAL-AGRICULTURE (A+B+C) 446561.88
II MICRO, SMALL AND MEDIUM ENTERPRISES (MSME)
a MANUFACTURING SECTOR - TERM LOAN 83386.76
b MANUFACTURING SECTOR - WORKING CAPITAL 32657.50
c SERVICES SECTOR - TERM LOAN 64647.00
d SERVICES SECTOR - WORKING CAPITAL) 17350.00
TOTAL – MSME 198041.26
III EXPORT CREDIT 7500.00
IV EDUCATION 13425.00
V HOUSING 43392.00
VI RENEWABLE ENERGY 2909.52
VII OTHERS 6322.50
VIII SOCIAL INFRASTRUCTURE 375.00
TOTAL PRIORITY SECTOR (I+II+III+IV+V+VI+VII+VIII) 718527.16
PLP 2016-17 KOLHAPUR DISTRICT
… 6 …

PLP 2016-17 KOLHAPUR DISTRICT
… 7 …
State
776
4
12
1195
12
776 Normal 2012-13 2013-14 2014-15
140 1899 1694.4 2208.8 1611.1
78 -204.6 309.8 -288.0
17 Balance
4 31033.65
76
5
22 Nos. % to Total Ha. % to Total
393 496110 79.88 163069 38.85
438 86312 13.90 119302 28.42
45 38652 6.22 137370 32.73
111.45% 621074 100.00 419740 100.00
621 Total Male Female Rural Urban582 3876 1981 1895 2646 1230
266 504 253 251 342 162
60 30 15 15 20 10- 2826 1560 1266 1854 972
717 98 50 48 75 23
821 806 771
556 971 610
272 1217 -
1216 4369 43
1216 77 29
562 424 2207
1217
2597 22 106763
72 115644 23498
971 278.48 2300
1199 - 1
5932 35
567976 1800 850
128584 9900 1
151000
120000 36 4
79566 107.78 521
3756.00 35.67 155150
4211.00 797798 38
135151 890173 14976.50
No of units Cap.[MT]
369 996.27 Area ('00Ha) Prod. ('00MT) Area ('00Ha) Prod. ('00MT)
128 46116.50 39 97 2475
37 9.61 875 2650 976 2876 2947
293 8.40 54 99 43 72 1677
87 140.95 17 42 13 31 2400
11 17.00 408 706 429 674 1572
4245 95125056.00 452 1023 504 1035 2054
4 10.00 141800 201356 1463 146300 100000
6 1000000.00
Category of animal Total Male Female 178 4Cattle - Cross bred 173298 8696 164602 - 592
Cattle - Indigenous 101815 77323 24492 234 47
Buffaloes 612998 26811 586187 - -Sheep - Cross bred 4599 949 3650 - 4
Sheep - Indigenous 99531 18809 80722 4117 3
Goat 162503 35877 126626 - 14
Pig - Cross bred 327 135 192
Pig - Indigenous 4266 842 3424 Fish 2500.00 N/AHorse/Donkey/Camel 2026 - - Egg 1867.00 N/A
Poultry - Cross bred 2538793 - - Milk 8014.22 N/A
Poultry - Indigenous 660535 - - Meat - N/A
Sources (if not mentioned against the respective item):
Item Nos. 1, 6, 7, 9 & 10 - Census 2001; Item Nos. 2, 3, 12, 13,14,16 - Dept. of Agr/Dir. of Eco. & Stat.; Item No. 4,5 - Dept. of Agr./Water Resources; Item No. 8 - BPL Survey 2002; Item No. 15 - District Ind Centre/Dir. of Eco. & Stat.; Item No. 17 - AH Census 2012; Item Nos. 18 & 19 - Dir. of Animal Hus./Dir. of Eco. & Stat.
Production [MT] Per cap avail. [gm/day]
Production [Lakh Nos] Per cap avail. [nos/p.a.]
Production [MT] Per cap avail. [gm/day]
Per cap avail. [gm/day]
Dairy Cooperative Societies [Nos]
Improved Fodder Farms [Nos] Slaughter houses [Nos]
Poultry hatcheries [Nos]
Animal Markets [Nos]
Disease Diagnostic Centres [Nos] Milk Collection Centres [Nos]
Artificial Insemination Centers [Nos] Fishermen Societies [Nos]
Veterinary Hospitals/Dispensaries [Nos]
19. MILK, FISH, EGG PRODUCTION & THEIR PER CAPITA AVAILABILITY
Cotton (Ginnining/Spinning/Weaving) Gr.Nut
Milk (Chilling/Cooling/Processing) Soyabean
Dry-fruit (Cashew/Almond/Raisins)
Fish Markets [Nos]
Animal Breeding Farms [Nos] Fish seed farms [Nos]
Animal Husbandry Tng Centres [Nos]
Production [Lakh] Ltr.
Animal feed (Cattle/Poultry/Fishmeal) Production of Cotton(lint), Jute, Mesta & Sanhemp are in Bales(177.8 kg per bale in India)
17. ANIMAL POPULATION AS PER CENSUS 2012 [in '000] 18. INFRASTRUCTURE FOR DEVELOPMENT OF ALLIED ACTIVITIES
Food (Rice/Flour/Dal/Oil/Tea/Coffee)
Meat (Chicken/Motton/Pork/Dryfish) SugarCane
Sugarcane (Gur/Khandsari/Sugar) Wheat
Maize
Cold Storage [Nos]
Type of Processing ActivityCrop
2013-14 2014-15
Irrigation Potential Utilized (Gross Irrigated Area) Goods Transport Vehicle [Nos] Cold Store Capacity[MT]
Area irrigated by Canals / Channels Rural/Urban Mandi/Haat [Nos] Wholesale Market [Nos]
Fruit (Pulp/Juice/Fruit drink) Paddy
Spices (Masala Powders/Pastes) Jawar
Area irrigated by Wells Length of Pucca Road [Km] Godown [Nos]
Avg. Yield [Kg/Ha]
Area irrigated by Tanks Length of Railway Line [Km] Godown Capacity[MT]
Area irrigated by Other Sources Public Transport Vehicle [Nos]
15. AGRO-PROCESSING UNITS 16. AREA, PRODUCTION & YIELD OF MAJOR CROPS
Total Area Available for Irrigation (NIA + Fallow) Power Tillers [Nos] Farmers' Clubs [Nos]
Threshers/Cutters [Nos] Krishi Vigyan Kendras[Nos]
Net Irrigated Area(Total area irrigated at least once) 14. INFRASTRUCTURE FOR STORAGE, TRANSPORT & MARKETING
Irrigation Potential Created
Villages connected with Paved Approach Roads Pesticides Consumed [MT] Soil Testing Centres [Nos]
13. IRRIGATION COVERAGE [Ha] Agriculture Tractors [Nos] Plantation nurseries [Nos]
12. INFRASTRUCTURE & SUPPORT SERVICES FOR AGRICULTUREVillages having Primary Schools Fertiliser/Seed/Pesticide Outlets [Nos] Agriculture Pumpsets[Nos]
Villages having Primary Health Centres Total N/P/K Consumption [MT] Pumpsets Energised [Nos]
Villages having Banking Facilities
Villages Electrified Anganwadis Dispensaries
BPL Households
Villages having Potable Water Supply Certified Seeds Supplied [MT] Agro Service Centres [Nos]
Villages having Post Offices Primary Health Sub-Centres Hospital Beds
Villages having Agriculture Power Supply Primary Health Centres Hospitals (incl specialized)
Rural Households Having source of drinking water Having independent toilets
Having access to banking services Having radio/tv sets
10. VILLAGE-LEVEL INFRASTRUCTURE [Nos] 11. INFRASTRUCTURE RELATING TO HEALTH & SANITATION [Nos]
Cropping Inensity [GCA/NSA] Total
Workers engaged in Allied Agro-activities
Having electricity supply incl Solar
Scheduled Caste
Workers engaged in Household Industries Scheduled Tribe
BPL
8. HOUSEHOLDS [in '000] (2011 Census) 9. HOUSEHOLD AMENITIES [Nos. in '000 Households] Census 2011
Total Households Having brick/stone/concrete houses
Of the above, Small/Marginal Farmers Population
Agricultural Labourers
Other workers
Literate
6. WORKERS PROFILE [in '000] (2011 census) 7. DEMOGRAPHIC PROFILE [in '000] (Census 2011)
Cultivators
Current Fallow (1000 ha.)Classification of Holding
Holding Area
Other Fallow (1000 ha.)
Category
Total or Gross Cropped Area (1000 ha.) >1 to <=2 Ha
Area Cultivated More than Once >2 Ha
<= 1 Ha
Permanent Pasture and Grazing Land Availability of Ground Water [Ham]
Net annual recharge
Net Sown Area (1000 ha.)
Net annual draft
Land under Miscellaneous Tree Crops 82343.88 45866.62Cultivable Wasteland (1000 ha.) 5. DISTRIBUTION OF LAND HOLDING (individuals)
medium to deep black, shallow red, red loamyNo. of Panchayats
Total Area Reported (1000 ha.)
Rainfall [in mm]Actual
Forest Land (1000 ha.)
Area Not Available for Cultivation (1000 ha.) Variation from Normal
3. LAND UTILISATION [Ha] 4. RAINFALL & GROUND WATER
Agro-climatic Zone Western Plateau & Hills region - Western Hills zoneNo. of Sub Divisions
No. of Blocks Climate Semi-arid
District Profile
MAHARASHTRA District KOLHAPUR
No. of Villages (Inhabited)Soil Type
1. PHYSICAL & ADMINISTRATIVE FEATURES (CENSUS 2012 2. SOIL & CLIMATE
Total Geographical Area (1000 ha.)

PLP 2016-17 KOLHAPUR DISTRICT
… 9 …
State - Maharashtra District Lead Bank - Bank of India
Total Rural Semi-urban Urban mFIs/mFOs SHGs/JLGs BCs/BFs Villages Households
Commercial Banks 31 341 155 71 115 NIL 28372 341 3.5 2407
Regional Rural Bank 1 7 5 1 1 NIL - - 170 11246
District Central Coop. Bank 1 191 158 16 17 NIL 30493 - 6.3 4298
Coop. Agr. & Rural Dev. Bank - - - - - NIL - - - -
Primary Agr. Coop. Society 1856 1856 1856 - - NIL - - 0.64 442
Others - - - - - NIL - - - -
All Agencies 1880 2386 2165 88 133 NIL 58865 341 0.5 344
31-Mar-12 31-Mar-13 31-Mar-14 Growth(%) Share(%) 31/03/2013 31-Mar-14 31-Mar-15 Growth(%) Share(%)
Commercial Banks N.A. N.A. N.A. N.A. N.A. 902188 1242061 1428265 14.99 83.07
Regional Rural Bank N.A. N.A. N.A. N.A. N.A. 2804 5985 2142 -64.21 0.12
Cooperative Banks N.A. N.A. N.A. N.A. N.A. 186656 261915 288975 10.33 16.81
Others N.A. N.A. N.A. N.A. N.A.
All Agencies N.A. N.A. N.A. N.A. N.A. 1091648 1509961 1719382 13.87 100.00
31-Mar-12 31-Mar-13 31-Mar-14 Growth(%) Share(%) 31/03/2013 31-Mar-14 31-Mar-15 Growth(%) Share(%)
Commercial Banks N.A. N.A. N.A. N.A. N.A. 802947 997587 1065292 6.79 82.74
Regional Rural Bank N.A. N.A. N.A. N.A. N.A. 7795 5551 5593 0.76 0.43
Cooperative Banks N.A. N.A. N.A. N.A. N.A. 134392 181777 216700 19.21 16.83
Others # N.A. N.A. N.A. N.A. N.A. - - - - -
All Agencies N.A. N.A. N.A. N.A. N.A. 945134 1184915 1287585 26.76 100.00
31-Mar-13 31-Mar-14 31-Mar-15 Deposit Credit Deposit Credit
Commercial Banks 89 80 75 172382 - 364718 -
Regional Rural Bank 278 314 93 5404 - 5712 -
Cooperative Banks 72 83 69 35831 - 42703 -
Others - - - -
All Agencies 87 78 78 213617 413133
Commercial Banks 361255.00 69.73 155372.00 53.78 26628.00 98.17 362.00 98.64 6065.00 94.84
Regional Rural Bank 2269.00 0.44 1011.00 0.35 497.00 1.83 5.00 1.36 330.00 5.16
Cooperative Banks 154577.00 29.84 132497.00 45.87 - - - -
Others#
All Agencies 518101.00 100.00 288880.00 100.00 27125.00 100.00 367.00 100.00 6395.00 100.00
Commercial Banks 335398.00 297222.00 88.62 368623.00 265982.00 72.16 161427.00 199372.00 123.51 94.76
Regional Rural Bank 4616.00 1287.00 27.88 5225.00 7063.00 135.18 3214.00 1011.00 31.46 64.84
Cooperative Banks 150116.00 139647.00 93.03 160038.00 165350.00 103.32 86246.00 132497.00 153.63 116.66
Others#
All Agencies 490130.00 438156.00 89.40 533886.00 438395.00 82.11 250887.00 332880.00 132.68 101.40
Crop Loan 202652.00 146339.00 72.21 247925.00 182819.00 73.74 159686.00 178693.00 111.90 85.95
Term Loan (Agr) 117601.00 92893.00 78.99 100666.00 95489.00 94.86 91201.00 110187.00 120.82 98.22
Total Agri. Credit 320253.00 239232.00 74.70 348591.00 278308.00 79.84 250887.00 288880.00 115.14 89.89
Non-Farm Sector 85032.00 91024.00 107.05 97104.00 90427.00 93.12 149877.00 148345.00 98.98 99.72
Other Priority Sector 80229.00 106613.00 132.89 88191.00 69660.00 78.99 79436.00 80876.00 101.81 104.56
Total Priority Sector 485514.00 436869.00 89.98 533886.00 438395.00 82.11 480200.00 518101.00 107.89 93.33
Commercial Banks 87958.00 60142.00 68 93779.00 66154.00 70.54 98268.00 69770.00 71.00 69.97
Regional Rural Bank 1637.00 335.00 20 1690.00 438.00 25.92 1724.00 1310.00 75.99 40.79
Cooperative Banks 45320.00 35018.00 77 46379.00 41228.00 88.89 47770.00 37261.00 78.00 81.39
Others #
All Agencies 134915.00 95495.00 71 141848.00 107820.00 76.01 147762.00 108341.00 73.32 73.37
Sources : Lead Bank & SLBC
# Private Sector Banks were earlier reported as others by Lead Bank. However, based on revised SLBC format, they have been clubbed with commercial banks
Ach'ment [%]
Demand [` Lakhs]
Recovery [` Lakhs]
Recovery[%]
Demand [` Lakhs]
Recovery [` Lakhs]
Recovery[%]
9. RECOVERY POSITION
Agency
2013-14 2014-15 Average Rec. [%] in last 3
yearsDemand [` Lakhs]
Recovery [` Lakhs]
Recovery[%]
2012-13
Broad Sector
2013-14 2014-15
Ach'ment [%]
Target [`.Lakhs]Ach'ment [` Lakhs]
Ach'ment [%]
2012-13
Ach'ment [` Lakhs]
Average Ach[%] in
last 3 yearsTarget
[`.Lakhs]Ach'ment [` Lakhs]
Ach'ment [%]
Target [`.Lakhs]
Ach'ment [` Lakhs]
Ach'ment [` Lakhs]
Ach'ment [%]
8. SECTOR-WISE PERFORMANCE UNDER ANNUAL CREDIT PLANS
Ach'ment [%]
7. AGENCY-WISE PERFORMANCE UNDER ANNUAL CREDIT PLANS
Agency
2013-14 2014-15 Average Ach[%] in
last 3 yearsTarget
[`.Lakhs]Ach'ment [` Lakhs]
Target [`.Lakhs]
Target [`.Lakhs]
Amount [` Lakhs]
% of Total Loans
Agency
Priority Sector Loans Loans to Agr. Sector Loans to Weaker Sections
Amount [` Lakhs]
% of Total Loans
Amount [` Lakhs]
% of Total Loans
Amount [` Lakhs]
% of Total Loans
Amount [` Lakhs]
% of Total Loans
During 2014-15 Cumulative
Commercial Banks
Regional Rural Bank
Loans under DRI Scheme Loans to Women
Agency
No. of accounts Amount of Loan (H42 in Lakhs)
Agency
6. PERFORMANDE TO FULFILL NATIONAL GOALS (As on 31/3/2015)
4. CD-RATIO 5. PERFORMANCE UNDER FINANCIAL INCLUSION (No. of A/cs)
AgencyCD Ratio
Agency
Banking ProfileKolhapur
AgencyNo. of
Banks/Soc.No. of Branches No. of non-formal agencies assoiated
2012-13
Per Branch Outreach (ASK DDMs on how to calculate)
2. DEPOSITS OUTSTANDING
1. NETWORK & OUTREACH (As on 31/03/2015)
No. of accounts Amount of Deposit (` in Lakhs)
3. LOANS & ADVANCES OUTSTANDING
All Agencies
Cooperative Banks
Others