plos biology thermal stress and coral cover as drivers of ... · thermal stress and coral cover as...
TRANSCRIPT

Thermal Stress and Coral Cover as Drivers ofCoral Disease OutbreaksJohn F. Bruno
1*, Elizabeth R. Selig
2, Kenneth S. Casey
3, Cathie A. Page
4, Bette L. Willis
4, C. Drew Harvell
5,
Hugh Sweatman6
, Amy M. Melendy7
1 Department of Marine Sciences, The University of North Carolina at Chapel Hill, Chapel Hill, North Carolina, United States of America, 2 Curriculum in Ecology and
Department of Marine Sciences, The University of North Carolina at Chapel Hill, Chapel Hill, North Carolina, United States of America, 3 National Oceanographic Data Center,
National Oceanic and Atmospheric Administration, Silver Spring, Maryland, United States of America, 4 Australian Research Council Centre of Excellence in Coral Reef Studies,
School of Marine and Tropical Biology, James Cook University, Townsville, Queensland, Australia, 5 Section of Ecology and Evolutionary Biology, Cornell University, Ithaca,
New York, United States of America, 6 Australian Institute of Marine Science, Townsville, Queensland, Australia, 7 Department of Epidemiology, The University of North
Carolina at Chapel Hill, Chapel Hill, North Carolina, United States of America
Very little is known about how environmental changes such as increasing temperature affect disease dynamics in theocean, especially at large spatial scales. We asked whether the frequency of warm temperature anomalies is positivelyrelated to the frequency of coral disease across 1,500 km of Australia’s Great Barrier Reef. We used a new high-resolution satellite dataset of ocean temperature and 6 y of coral disease and coral cover data from annual surveys of48 reefs to answer this question. We found a highly significant relationship between the frequencies of warmtemperature anomalies and of white syndrome, an emergent disease, or potentially, a group of diseases, of Pacificreef-building corals. The effect of temperature was highly dependent on coral cover because white syndromeoutbreaks followed warm years, but only on high (.50%) cover reefs, suggesting an important role of host density as athreshold for outbreaks. Our results indicate that the frequency of temperature anomalies, which is predicted toincrease in most tropical oceans, can increase the susceptibility of corals to disease, leading to outbreaks where coralsare abundant.
Citation: Bruno JF, Selig ER, Casey KS, Page CA, Willis BL, et al. (2007) Thermal stress and coral cover as drivers of coral disease outbreaks. PLoS Biol 5(6): e124. doi:10.1371/journal.pbio.0050124
Introduction
Climatic and oceanographic conditions can modify a widevariety of ecological processes. For example, ocean temper-ature can control species ranges, the strength of speciesinteractions, the dispersal and survival of marine larvae, andthe rates of metabolism and speciation [1–6]. Additionally,anomalously high temperature and other environmentalstresses can influence the severity and dynamics of infectiousdiseases by increasing host susceptibility and pathogenvirulence [7,8]. For example, the severity of human epidemicsincluding cholera [9–11] and tick-borne encephalitis [12] areboth related to temperature and, possibly, to recent climatechange [13]. Temperature and climate change have also beenimplicated in plant and animal disease outbreaks in bothterrestrial and aquatic habitats [7,14–17], and could influencecoral disease severity [18–20], potentially accelerating theglobal loss of coral reefs.
Corals are the foundation species of tropical coral reefecosystems. They directly facilitate thousands of associatedspecies by generating the physically complex reef structure[21,22]. Reductions in coral abundance can cause rapid loss ofreef biodiversity [23]. The hypothesized link between anom-alously high temperatures and coral disease outbreaks issupported by small-scale field studies indicating that preva-lence and the rate of within-colony spread of several coraldiseases are higher during the summer [24–30]. Such seasonalchanges in disease severity could be driven in part by highersummertime temperature, but could also be caused by avariety of other abiotic factors that vary seasonally withinsites. Additionally, such investigations do not directly address
the role of temperature anomalies in driving the conspicuousvariability of coral disease severity among years and locations[30–32] that has long intrigued coral reef ecologists. Missingare large-scale, longitudinal investigations that combine long-term monitoring of multiple populations with accurate, fine-grained measurements of local temperature anomalies.Longitudinal studies (i.e., the repeated sampling of individ-uals or populations) help control for potential confoundingfactors and inherent temporal variability [33]. Such powerfulepidemiological approaches are rarely applied to marineepidemics (but see [34,35]), which has limited our under-standing of potential links between temperature and diseaseoutbreaks in the ocean, especially at large spatial scales.Here we describe a regional-scale test of the hypothesis that
ocean temperature can influence disease frequency. Weanalyzed the relationship between the frequency of whitesyndrome in scleractinian corals and of warm temperatureanomalies across the Great Barrier Reef (GBR). Forty-eightreefs were monitored for 6 y (1998–2004), and reef-specific
Academic Editor: Callum Roberts, University of York, United Kingdom
Received August 23, 2006; Accepted March 5, 2007; Published May 8, 2007
Copyright: � 2007 Bruno et al. This is an open-access article distributed under theterms of the Creative Commons Public Domain declaration which stipulates that,once placed in the public domain, this work may be freely reproduced, distributed,transmitted, modified, built upon, or otherwise used by anyone for any lawfulpurpose.
Abbreviations: GBR, Great Barrier Reef; OISST, Optimum Interpolation Sea SurfaceTemperature; SST, sea surface temperature; WSSTA, weekly sea surface temper-ature anomaly
* To whom correspondence should be addressed. E-mail: [email protected]
PLoS Biology | www.plosbiology.org June 2007 | Volume 5 | Issue 6 | e1240001
PLoS BIOLOGY
weekly sea surface temperature anomalies (WSSTAs; thefrequency of deviations � 1 8C) were derived from a satellitesea surface temperature (SST) database. White syndrome is anemerging disease of Pacific reef-building corals, reported in17 species from families including Acroporidae, Pocillopor-idae, and Faviidae, which comprise the majority of dominantspecies on the GBR [30]. Severe white syndrome outbreakscan affect coral composition and cover [30]. Little is knownabout the etiology of white syndrome, although it ispresumably infectious and the characteristics are similar toCaribbean white diseases such as white band and white plague[36]. Like the Caribbean white diseases, white syndrome couldcomprise a group of distinct diseases with similar signs [30].White syndrome can cause either partial or whole colonymortality and is characterized by a white band of tissue orrecently exposed skeleton that moves across the colony as thedisease progresses [30,37].
Results
White syndrome has been present on the GBR since at leastthe beginning of systematic disease monitoring in 1998, butits frequency increased 20-fold in 2002 [30]. This rise cameafter a year in which the region experienced its secondwarmest summer in the 20-y satellite record, with 58% ofreefs having weekly anomalies of 1 8C or higher. However,even during the peak of the outbreak, there was considerablevariation in disease frequency among reefs (0 to 343 cases per1,500 m2) (Figure 1B). WSSTA also varied substantially amongreefs, especially during the warm summers of 1998/1999 and2001/2002 when some reefs were anomalously warm for 30 wkof the year, but the weekly temperatures on many othersnever deviated from the long-term local averages (i.e., WSSTA¼ 0).
Reefs with relatively high coral cover and WSSTA had thegreatest white syndrome frequency (Table 1). From thenegative binomial regression model, the parameter estimatesfor the three covariates (WSSTA, coral cover, and theinteraction between the two) were positive (i.e., theypredicted an increase in frequency) and highly significant
(all p , 0.000; Table 2). The interaction term (WSSTA3 coralcover) explained a statistically significant amount of theincrease in frequency of disease among all the covariates inthe model (v2 ¼ 17.49, df ¼ 1, p , 0.0000). The deviancestatistic for the negative binomial model was 1.0201, suggest-ing a very good fit to the data. Disease frequency predictedfor nine WSSTA–coral cover combinations (based on thetenth, 50th, and 90th observed quintiles of these covariates) ispresented in Table 3. The observed and predicted valuesindicate that disease frequency only increases substantiallywith the combination of extreme levels of both covariates.The model is a fairly conservative predictor of this relation-ship because the observed number of cases with high WSSTAand high coral cover (Table 1) was actually higher thanpredicted by the model.
Discussion
Influence of Warm Temperature AnomaliesThe frequency of warm temperature anomalies was
positively related to white syndrome frequency across theGBR. The disease surveys documented considerable variationin white syndrome frequency (0 to 343 cases per 1,500 m2)among years and reefs. Our results suggest that this variancewas caused in part by the number of warm temperatureanomalies during the year preceding the disease surveys. Apositive effect of high temperature on the severity of coraldisease outbreaks might be caused by physiological stressimpairing host immunity [8,38,39]. WSSTA, our metric ofthermal stress, is based on the frequency of warm anomaliesof 1 8C or higher because short-term temperature increases ofthis degree can cause measurable physiological stress in acoral host [40–46]. WSSTA summarized temperature anoma-lies throughout the year, including winter anomalies thatmight also affect the susceptibility of corals to disease [46].Increased densities of symbiotic dinoflagellate algae (zoox-anthellae) at the beginning of winter and the subsequentaccumulation of coral-tissue biomass throughout coolermonths are thought to influence coral responses to futurestresses [47]. These processes are compromised by longerwarm periods during the summer or warmer than usualwinter temperatures [45]. In fact, winter warming could havethe dual effect of predisposing hosts to disease and facilitat-ing more rapid pathogen growth [7]. Summertime anomaliescould also increase pathogen virulence by initiating virulencefactors [48] or increasing the growth of pathogens [39] forwhich the normal summertime temperature is below thethermal optima.
Influence of Coral CoverOur results also indicate that thermal stress is necessary,
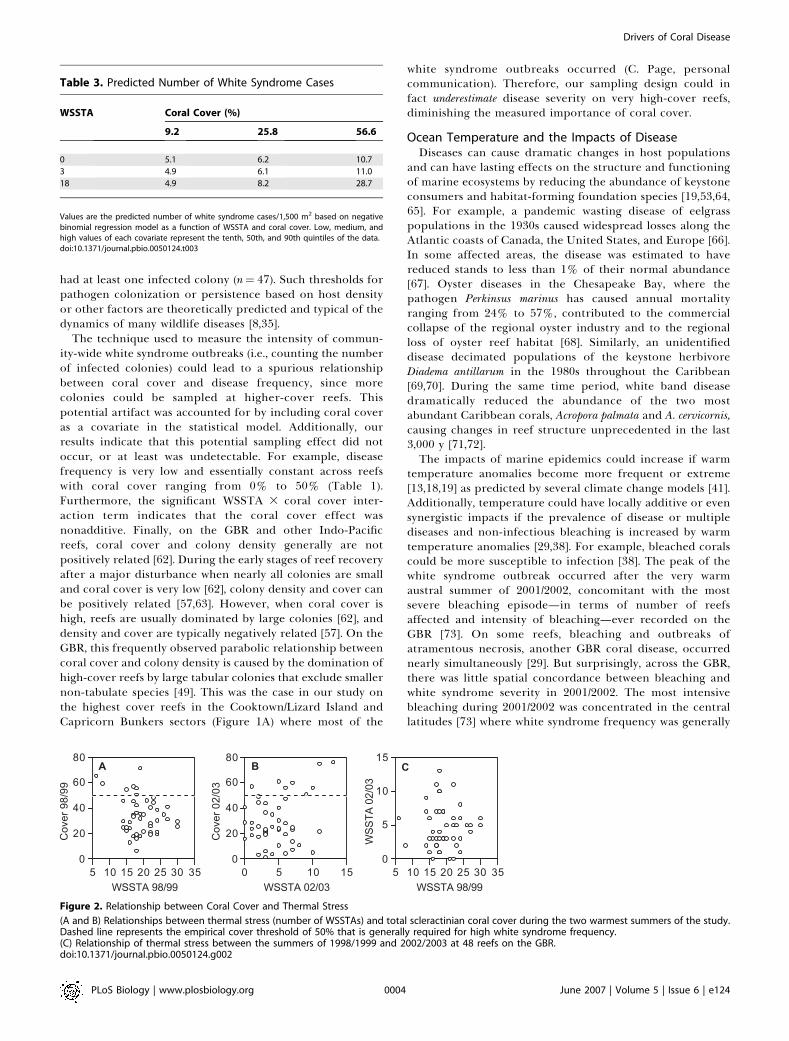
but not sufficient, for white syndrome outbreaks to occur.Coral cover must also be high; generally 50% or higher (Table1). White syndrome was uncommon during the 12 mo afterthe summer of 1998/1999 when WSSTAs were more frequentand occurred at more sites than during 2002/2003. But in1998/1999, total coral cover was less than 50% at the 20 reefswith the highest WSSTA (Figure 2A), and there was a weaknegative relationship between WSSTA and cover (p ¼ 0.09,linear regression analysis; Figure 2A). In contrast, in 2002/2003, there was a positive association between WSSTA andcoral cover (p ¼ 0.05, Figure 2B). This was possible because
PLoS Biology | www.plosbiology.org June 2007 | Volume 5 | Issue 6 | e1240002
Drivers of Coral Disease
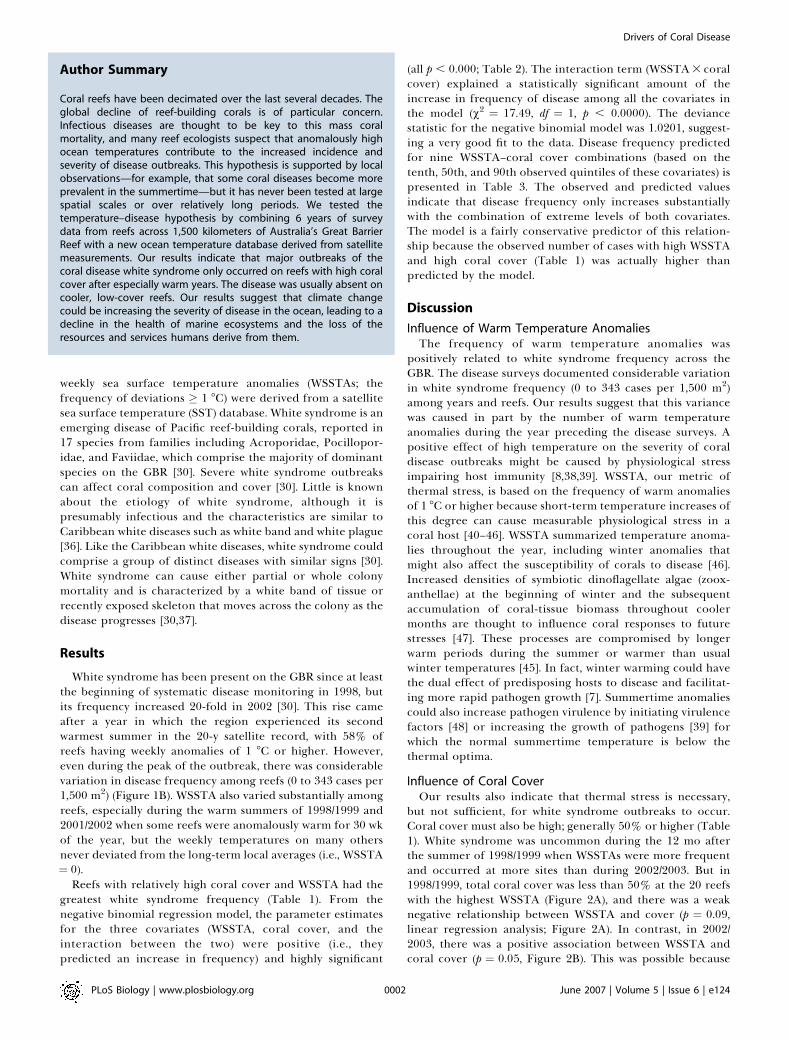
Author Summary
Coral reefs have been decimated over the last several decades. Theglobal decline of reef-building corals is of particular concern.Infectious diseases are thought to be key to this mass coralmortality, and many reef ecologists suspect that anomalously highocean temperatures contribute to the increased incidence andseverity of disease outbreaks. This hypothesis is supported by localobservations—for example, that some coral diseases become moreprevalent in the summertime—but it has never been tested at largespatial scales or over relatively long periods. We tested thetemperature–disease hypothesis by combining 6 years of surveydata from reefs across 1,500 kilometers of Australia’s Great BarrierReef with a new ocean temperature database derived from satellitemeasurements. Our results indicate that major outbreaks of thecoral disease white syndrome only occurred on reefs with high coralcover after especially warm years. The disease was usually absent oncooler, low-cover reefs. Our results suggest that climate changecould be increasing the severity of disease in the ocean, leading to adecline in the health of marine ecosystems and the loss of theresources and services humans derive from them.

there was no reef-specific correlation of WSSTA between1998/1999 and 2002/2003 (p ¼ 0.90, Figure 2C).
Total coral cover is a reasonable estimation of hostabundance in this system because the susceptible speciesare the competitively dominant space holders [30,49]. Apositive relationship between host density and diseaseprevalence has been clearly demonstrated in many host-pathogen systems [35,50–52], and is considered a hallmark ofthe infectious process [53]. High host density can have severaleffects on disease dynamics. For example, it is most oftenassociated with greater rates of horizontal transmission [54–56], leading to localized increases in prevalence. High coralcover reduces the distance between neighboring coralcolonies [57] and thus between infected and healthy hosts,increasing the potential for horizontal disease transmissionbetween corals in close proximity. In addition, host densitycan be positively related to the density of disease vectors[58,59], although no specific vector(s) have been identified forwhite syndrome.
Independent of host density, total coral cover itself,including the abundance of nonsusceptible individuals andspecies, might also be causally linked with increased white
syndrome frequency. A wide variety of biological propertiesof coral reefs are related to coral cover. For example, theabundance and composition of fishes and invertebrates thatcould act as disease vectors are tightly linked with total coralcover and reef heterogeneity [21,23]. Competitive interac-tions among corals increase nearly exponentially with totalcoral cover and, on the GBR, are relatively rare when cover isbelow 50% [57]. Corals compete directly by damaging thetissue of neighboring colonies with tentacles and digestivefilaments [60]. These encounters usually cause lesions andlocal tissue necrosis [60] that could facilitate pathogentransmission and colony infection. Additionally, uninfectedhosts likely experience physiological stress and a reduction infitness on high-cover reefs from such direct competitiveencounters [61] as well as from indirect competition such asshading [60], which could also reduce disease resistance.Regardless of the relative importance of these and other
potential mechanisms for increased host susceptibility ordisease transmission where coral cover is high, there is acover threshold of approximately 50% (Table 1) for whitesyndrome outbreaks and, frequently, even for the occurrenceof this disease on a reef. No white syndrome cases wererecorded on 45% of the reefs with cover less than 50% (n ¼235). In contrast, 88% of reefs with cover greater than 50%
Figure 1. Study Sites and Disease Conditions during the Peak of White Syndrome Frequency in 2002
(A) Frequency of white syndrome cases from March 2002 to March 2003; (B) bleaching intensity for scleractinian coral in March 2002 (modified fromBerkelmans et al., 2004 [73]); and (C) WSSTAs in 2002.doi:10.1371/journal.pbio.0050124.g001
Table 1. Observed Number of White Syndrome Cases
WSSTA Coral Cover (%)
0–24 25–49 50–75
0 WSSTAs 0.9 6 0.3 (24) 0.9 6 0.3 (18) 10.4 6 4.8 (7)
,5 WSSTAs 3.6 6 1.2 (53) 9.8 6 3.2 (40) 23.3 6 5.7 (21)
�5 WSSTAs 4.7 6 2.1 (49) 4.5 6 1.0 (50) 80.1 6 27.3 (20)
Values are the mean number of white syndrome cases/1,500 m2 6 1 SE as a function ofWSSTA and coral cover. Values in parentheses are the number of sampled reefs in eachcategory.doi:10.1371/journal.pbio.0050124.t001
Table 2. Coefficient Estimates
Parameter Estimate Standard Error p-Value (Wald)
Intercept 1.776 0.232 , 0.000
WSSTA 0.875 0.023 , 0.000
Coral cover 1.034 0.005 , 0.000
Coral cover 3 WSSTA 1.003 0.001 , 0.000
Results of the negative binomial regression population-averaged model. Model-basedstandard errors (SE) are also shown.doi:10.1371/journal.pbio.0050124.t002
PLoS Biology | www.plosbiology.org June 2007 | Volume 5 | Issue 6 | e1240003
Drivers of Coral Disease
had at least one infected colony (n¼ 47). Such thresholds forpathogen colonization or persistence based on host densityor other factors are theoretically predicted and typical of thedynamics of many wildlife diseases [8,35].
The technique used to measure the intensity of commun-ity-wide white syndrome outbreaks (i.e., counting the numberof infected colonies) could lead to a spurious relationshipbetween coral cover and disease frequency, since morecolonies could be sampled at higher-cover reefs. Thispotential artifact was accounted for by including coral coveras a covariate in the statistical model. Additionally, ourresults indicate that this potential sampling effect did notoccur, or at least was undetectable. For example, diseasefrequency is very low and essentially constant across reefswith coral cover ranging from 0% to 50% (Table 1).Furthermore, the significant WSSTA 3 coral cover inter-action term indicates that the coral cover effect wasnonadditive. Finally, on the GBR and other Indo-Pacificreefs, coral cover and colony density generally are notpositively related [62]. During the early stages of reef recoveryafter a major disturbance when nearly all colonies are smalland coral cover is very low [62], colony density and cover canbe positively related [57,63]. However, when coral cover ishigh, reefs are usually dominated by large colonies [62], anddensity and cover are typically negatively related [57]. On theGBR, this frequently observed parabolic relationship betweencoral cover and colony density is caused by the domination ofhigh-cover reefs by large tabular colonies that exclude smallernon-tabulate species [49]. This was the case in our study onthe highest cover reefs in the Cooktown/Lizard Island andCapricorn Bunkers sectors (Figure 1A) where most of the
white syndrome outbreaks occurred (C. Page, personalcommunication). Therefore, our sampling design could infact underestimate disease severity on very high-cover reefs,diminishing the measured importance of coral cover.
Ocean Temperature and the Impacts of DiseaseDiseases can cause dramatic changes in host populations
and can have lasting effects on the structure and functioningof marine ecosystems by reducing the abundance of keystoneconsumers and habitat-forming foundation species [19,53,64,65]. For example, a pandemic wasting disease of eelgrasspopulations in the 1930s caused widespread losses along theAtlantic coasts of Canada, the United States, and Europe [66].In some affected areas, the disease was estimated to havereduced stands to less than 1% of their normal abundance[67]. Oyster diseases in the Chesapeake Bay, where thepathogen Perkinsus marinus has caused annual mortalityranging from 24% to 57%, contributed to the commercialcollapse of the regional oyster industry and to the regionalloss of oyster reef habitat [68]. Similarly, an unidentifieddisease decimated populations of the keystone herbivoreDiadema antillarum in the 1980s throughout the Caribbean[69,70]. During the same time period, white band diseasedramatically reduced the abundance of the two mostabundant Caribbean corals, Acropora palmata and A. cervicornis,causing changes in reef structure unprecedented in the last3,000 y [71,72].The impacts of marine epidemics could increase if warm
temperature anomalies become more frequent or extreme[13,18,19] as predicted by several climate change models [41].Additionally, temperature could have locally additive or evensynergistic impacts if the prevalence of disease or multiplediseases and non-infectious bleaching is increased by warmtemperature anomalies [29,38]. For example, bleached coralscould be more susceptible to infection [38]. The peak of thewhite syndrome outbreak occurred after the very warmaustral summer of 2001/2002, concomitant with the mostsevere bleaching episode—in terms of number of reefsaffected and intensity of bleaching—ever recorded on theGBR [73]. On some reefs, bleaching and outbreaks ofatramentous necrosis, another GBR coral disease, occurrednearly simultaneously [29]. But surprisingly, across the GBR,there was little spatial concordance between bleaching andwhite syndrome severity in 2001/2002. The most intensivebleaching during 2001/2002 was concentrated in the centrallatitudes [73] where white syndrome frequency was generally
Figure 2. Relationship between Coral Cover and Thermal Stress
(A and B) Relationships between thermal stress (number of WSSTAs) and total scleractinian coral cover during the two warmest summers of the study.Dashed line represents the empirical cover threshold of 50% that is generally required for high white syndrome frequency.(C) Relationship of thermal stress between the summers of 1998/1999 and 2002/2003 at 48 reefs on the GBR.doi:10.1371/journal.pbio.0050124.g002
Table 3. Predicted Number of White Syndrome Cases
WSSTA Coral Cover (%)
9.2 25.8 56.6
0 5.1 6.2 10.7
3 4.9 6.1 11.0
18 4.9 8.2 28.7
Values are the predicted number of white syndrome cases/1,500 m2 based on negativebinomial regression model as a function of WSSTA and coral cover. Low, medium, andhigh values of each covariate represent the tenth, 50th, and 90th quintiles of the data.doi:10.1371/journal.pbio.0050124.t003
PLoS Biology | www.plosbiology.org June 2007 | Volume 5 | Issue 6 | e1240004
Drivers of Coral Disease

very low (Figure 1). In contrast, there was little or nobleaching on reefs in the southern GBR, including theCapricorn Bunkers sector, where white syndrome outbreakswere most severe (Figure 1). The causes of this negativecorrelation are unclear, but could include variable hostsusceptibility, local species composition, thermal history, andprior disturbances. Regardless of potential causes, thesegregation of these two impacts of anomalously hightemperatures might limit local coral loss, but could lead toadditive net declines in coral cover across the region.
Alternatively, rising ocean temperature or an increase insummertime anomalies could inhibit marine epidemics.Environmental stress is often assumed to increase diseaseseverity, but stresses that directly reduce host density canhave the opposite effect [8] (Figure 3). The role of coral coverin mediating the influence of temperature on diseasefrequency suggests that temperature could have an importantinhibitory effect on white syndrome via bleaching-inducedcoral mortality. High temperatures only 1–2 8C above thenormal summer maximum can cause bleaching and masscoral mortality [41,42], leading to a reduction in host densityand total coral cover. Therefore, anomalously high watertemperature could, in contrast to our results, reduce theprevalence of coral diseases with host density or coral coverthresholds. However, host density is not always related to thespread of disease, such as when the disease is not infectious, iflocal secondary transmission is rare, and when pathogensoriginate outside the local host population or in other hostspecies [8]. In such cases, the relationship between stress anddisease severity is generally predicted to be positive [8](Figure 3).
Environmental stress can also reduce the intensity orprobability of outbreaks by negatively affecting pathogenfitness or virulence [8]. It is possible that coral pathogens arenegatively affected by anomalously high water temperature.In fact, laboratory studies have found that beyond thermaloptima, coral pathogens can have reduced photosynthetic[74] and growth rates [39]. Direct, negative effects ofenvironmental stresses on either hosts or pathogens could
cause a parabolic relationship between the magnitude orfrequency of environmental stresses and disease incidence,with outbreaks occurring mainly at intermediate stress levels(Figure 3). Thus, future increases in thermal anomalies orother forms of environmental stress could decrease theprobability and severity of marine epidemics.Paradoxically, management activities that increase host
abundance could facilitate epidemics. Indeed, most of themajor coral reef epidemics over the last 20 y have been ofhigh-density hosts. Caribbean examples include acroporidwhite band disease outbreaks [71], the D. antillarum epidemic[69,70], and sea fan aspergillosis [75]. Once the density ofthese hosts was sufficiently diminished, prevalence oftendecreased [34], and host populations began to recover [76,77].
ConclusionsWarm temperature anomalies and coral cover are clearly
important drivers of white syndrome on the GBR. Noprevious study has demonstrated a link between oceantemperature and coral disease dynamics, especially at region-al spatial scales. Our results are supported by basicepidemiological principles, and could apply to other coraldisease systems and to disease ecology in general. However,coral disease dynamics are likely to be affected by a variety ofbiotic and abiotic factors, the relative importance of whichwill vary among regions, scales, and species [32]. In somelocations, coral disease outbreaks are apparently decoupledfrom temperature, and several other factors are also knownor suspected to influence the dynamics of coral and othermarine diseases [19]. For example, the severity of at leastthree coral diseases is linked with nutrient concentrations[25,32,75], whereas the frequency of others, like whitesyndrome, is greatest on remote reefs in highly oligotrophicwaters [30].Coral reefs around the world have been dramatically
transformed over the last several decades as coral coverdecreased and reefs became dominated by macroalgae[71,78–80]. These changes affect entire coral reef ecosystems,resulting in declines in biodiversity, fisheries yield, and otherecosystem services [81]. Our results indicate warm temper-ature anomalies can drive outbreaks of coral disease underconditions of high coral cover. The general increase in coraldisease prevalence and the emergence of several new coraldiseases over the last two decades [20,82,83] could also havebeen caused in part by thermal anomalies. Deciphering theseand other effects of increasing temperature on diseasedynamics in the ocean presents an urgent challenge tomarine scientists.
Materials and Methods
Disease and coral cover surveys. Surveys of white syndromefrequency and total coral cover (i.e., the percentage of the bottomcovered by living scleractinian corals) were performed by theAustralian Institute of Marine Science Long-term MonitoringProgram. The 48 surveyed reefs are grouped within six latitudinalsectors that span nearly 1,500 km of the GBR from 148 S to 248 S(Figure 1A). Surveys were performed annually between 1998 and 2004using SCUBA along a depth contour of 6 to 9 m on the northeastflank of each reef. The frequency of white syndrome cases on eachreef (number/1,500 m2) was measured by counting the number ofinfected colonies within 15 permanent 50-m 3 2-m belt transects[30,84]. The percentage of the substrate covered with living, hard(scleractinian) coral tissue was quantified on 15 permanent 50-mtransects, within a 25-cm-wide belt along the transect using a video
Figure 3. Predicted Effects of Environmental Stress on Disease Severity
Conceptual model of potential effects of environmental stress (magni-tude or frequency) on the probability or severity (e.g., prevalence orimpacts on host populations) of disease outbreaks. The model includesthree possible scenarios: (A) the null model of no effect, (B) a positive,linear effect of stress such as when host density is unrelated to incidenceand when the pathogen is not negatively affected by the stress, and (C) aparabolic stress effect.doi:10.1371/journal.pbio.0050124.g003
PLoS Biology | www.plosbiology.org June 2007 | Volume 5 | Issue 6 | e1240005
Drivers of Coral Disease

camera [85]. A point sampling technique was then used to estimatelive coral cover from the videos in the laboratory [85].
Satellite temperature database and thermal stress metric. Wederived weekly sea surface temperature values for each reef from anewly developed 4-km Advanced Very High Resolution RadiometerPathfinder temperature anomaly dataset (Version 5.0) developed bythe National Oceanic and Atmospheric Association and theUniversity of Miami’s Rosenstiel School of Marine and AtmosphericScience. This dataset covers the longest time period (1985–2004) atthe highest resolution of any consistently processed, global satellitetemperature dataset. We used nighttime, weekly-averaged values witha quality level of four or better [86]. Some plausible values were givenlow-quality levels by the Pathfinder algorithm, which eliminates anyobservation with an SST more than 2 8C different than a relativelycoarse resolution SST field based on the Version 2 ReynoldsOptimum Interpolation Sea Surface Temperature (OISST) value, along-term, in situ–based dataset [86,87]. Therefore, we includedobservations if the SST was greater than the OISST, but less than theOISSTþ5 8C. Gaps in the record caused by persistent cloudiness werefilled using simple temporal interpolation to provide a completeweekly time series at each reef spanning 1985–2004.
We generated a 19-y, weekly SST climatology (i.e., a long-termrecord) for the 43 4-km grid cell that encompassed each reef. A 5-wkrunning mean was then used to smooth each gap-free climatology tominimize any unusual fluctuations caused by periods of limited dataavailability. Although thermal stress metrics have been created topredict bleaching events from satellite SST data [73,88,89], little isknown about the thresholds relevant to coral disease. In general,increases of 0.5–1.5 8C for several weeks can induce coral bleaching[42]. We assumed that temperatures that may lead to bleaching andphysiological stress in corals [42,45] could also potentially increasesusceptibility to disease [7].
In a pilot study, we created 16 different metrics of thermal stress.After initial screening, Akaike Information Criteria (AIC) identifiedWSSTA as the metric that best explained the relationship betweentemperature and disease (three of the other metrics and the selectionprocedure are described in [37]). WSSTA quantified the frequency ofhigh-temperature anomalies experienced by coral hosts and by thepotential white syndrome pathogen(s), during the 52 wk prior to theannual disease surveys. WSSTAs represent the number of annualdeviations of 1 8C or higher from a mean climatology calculated fromrecords between 1985 and 2004 for that calendar week at that reef.Thus, the metric is both week specific and location specific, andconsiders deviations from local climatological averages, i.e., typicalSST throughout the year, including wintertime high-temperatureanomalies that could also influence coral fitness and susceptibility toinfection [46]. Because recent field and laboratory studies indicatethat corals on the GBR are significantly adapted to local thermalconditions [43,90], we based WSSTA on the local SST climatologycreated independently for each of the 48 reefs. Furthermore, ourlong-term, fine-grained measurements of SST and SST anomaliesmatch the scale of the biological surveys, eliminating the usualmismatch between climate and health data that has plagued similarstudies of human and wildlife disease dynamics [91].
Statistical analysis. We used negative binomial regression to modelthe relationship between thermal stress and coral cover and thefrequency of white syndrome cases (i.e., the number/1,500 m2).Negative binomial regression was ideal for this analysis because thedependent variable was continuous and overdispersed (i.e., thevariance exceeds the mean). The covariates in the model includedWSSTA, coral cover, and the interaction term, which represents themultiplicative relationship between coral cover and temperature.Because there is a biologically plausible mechanism by which aninteraction between coral cover and temperature could affect theoverall outcome (i.e., the influence of thermal stress could be coralcover dependent), it was important to include this interaction as a
covariate. A host density threshold is a common signature ofinfectious disease outbreaks of humans and other marine taxa suchas viral diseases of seals [50,52,53]. Total coral cover or the abundanceof susceptible species could both influence disease frequency and theeffect of temperature on frequency. Coral cover was also included inthe model to account for the potential positive relationship betweencover and disease frequency based solely on the fact that the numberof surveyed colonies may have increased with coral cover.
Because the individual sampling units (reefs) were nested withinlarger groupings (sectors), this factor was included as a stratificationvariable to control for the main effect of variance within and betweensectors. We used the general estimating equations (GEE) (i.e.,population averaged) to estimate parameters of the negativebinomial model, which accounted for the repeated measurement ofthe individual sampling unit (reefs, each sampled once a year for sixconsecutive years). An autocorrelative structure was initially in-cluded; however, the parameter was sufficiently close to zero (0.01 60.05 standard error [SE]) to consider the autocorrelative effectsnegligible, and thus was not included in the final model. We alsocalculated a deviance statistic (i.e., deviance/degrees of freedom) toassess the goodness of fit of the model. If the model and thedesignated distribution are correct, this value should be approx-imately 1.0.
Many longitudinal datasets with continuous dependent variablesare modeled using Poisson regression [33]. However, the variancestructure of the related regression model, the negative binomial,includes a random dispersion term and is thus more flexible andappropriate in assessing the relationship between the covariates andan overdispersed dependent variable [92,93]. We did run a Poissonregression model, and the deviance statistic was 24.4203, indicating apoor fit to the data. Zero inflation, that is, the possibility of theexistence of a population of hosts for which the outcome cannothappen (e.g., reefs with no susceptible individuals), was also ofpotential concern. To address this issue, we fit zero-inflated negativebinomial and Poisson regression models. There was no difference inparameter estimates from the standard models; thus, the simplestnegative binomial model was used in the final analysis. All regressionanalyses were conducted using Intercooled Stata 9.1 (Stata Corpo-ration, http://www.stata.com).
Acknowledgments
We thank A. Barton, C. Mitchell, K. France, S. Lee, S. Neale, M.O’Connor, N. O’Connor, and L. Stearns for their helpful commentson the manuscript, and A. Alker, D. Serano, G. Trussell, J. Weis, and C.Weisen for their assistance with statistical analysis. We thank all pastand present members of the Australian Institute of Marine Science’sLong-term Monitoring team for collection of the disease data.
Author contributions. JFB, ERS, BLW, and CDH conceived theproject. CAP and HS collected the disease and coral cover data. JFB,ERS, and KSC developed the temperature anomaly database. AMManalyzed the data with assistance from JFB. JFB, ERS, and AMM wrotethe paper with assistance from KSC, CAP, BLW, and CDH.
Funding. This research was funded in part by grants from theNational Science Foundation to CDH and JFB (OCE-0326705), anEPA STAR Fellowship to ERS, the National Oceanic and AtmosphericAdministration (NOAA) Coral Reef Conservation Program and itsNational Environmental Satellite, Data, and Information Service(NESDIS) Coral Reef Watch project, the Australian Institute ofMarine Science, the Coral Disease Working Group of the GEF-CoralReef Targeted Research Program, and The University of NorthCarolina at Chapel Hill.
Competing interests. The authors have declared that no competinginterests exist.
References
1. Sanford E (1999) Regulation of keystone predation by small changes inocean temperature. Science 283: 2095–2097.
2. Allen AP, Brown JH, Gillooly JF (2002) Global biodiversity, biochemicalkinetics, and the energetic-equivalence rule. Science 297: 1545–1548.
3. Allen AP, Gillooly JF, Savage VM, Brown JH (2006) Kinetic effects oftemperature on rates of genetic divergence and speciation. Proc Natl AcadSci U S A 103: 9130–9135.
4. Thomas CD, Cameron A, Green RE, Bakkenes M, Beaumont LJ, et al. (2004)Extinction risk from climate change. Nature 427: 145–148.
5. Helmuth B, Mieszkowska N, Moore P, Hawkins SJ (2006) Living on n the
edge of two worlds: Forecasting the responses of rocky intertidalecosystems to climate change. Annu Rev Ecol Evol Syst 37: 373–404.
6. O’Connor MI, Bruno JF, Gaines SD, Halpern BS, Lester SE, et al. (2006)Temperature control of larval dispersal and its implications for marineecology, evolution, and conservation. Proc Natl Acad Sci U S A 104: 1266–1271.
7. Harvell CD, Mitchell CE, Ward JR, Altizer S, Dobson AP, et al. (2002)Climate warming and disease risks for terrestrial and marine biota. Science296: 2158–2162.
8. Lafferty KD, Holt RD (2003) How should environmental stress affect thepopulation dynamics of disease? Ecol Lett 6: 654–664.
PLoS Biology | www.plosbiology.org June 2007 | Volume 5 | Issue 6 | e1240006
Drivers of Coral Disease

9. Pascual M, Rodo X, Ellner SP, Colwell R, Bouma MJ (2000) Choleradynamics and El Nino-Southern Oscillation. Science 289: 1766–1769.
10. Rodo X, Pascual M, Fuchs G, Faruque ASG (2002) ENSO and cholera: Anonstationary link related to climate change? Proc Natl Acad Sci U S A 99:12901–12906.
11. Colwell RR (1996) Global climate and infectious disease: The choleraparadigm. Science 274: 2025–2031.
12. Lindgren E, Gustafson R (2001) Tick-borne encephalitis in Sweden andclimate change. Lancet 358: 16–18.
13. Patz JA, Epstein PR, Burke TA, Balbus JM (1996) Global climate change andemerging infectious diseases. JAMA 275: 217–223.
14. Kim Y, Powell EN (1998) Influence of climate change on interannualvariation in population attributes of Gulf of Mexico oysters. J Shellfish Res17: 265–274.
15. Kiesecker JM, Blaustein AR, Belden LK (2001) Complex causes ofamphibian population declines. Nature 410: 681–684.
16. Raimondi PT, Wilson CM, Ambrose RF, Engle JM, Minchinton TE (2002)Continued declines of black abalone along the coast of California: Are massmortalities related to El Nino events? Mar Ecol Prog Ser 242: 143–152.
17. Pounds JA, Bustamante MR, Coloma LA, Consuegra JA, Fogden MPL, et al.(2006) Widespread amphibian extinctions from epidemic disease driven byglobal warming. Nature 439: 161–167.
18. Hayes ML, Bonaventura J, Mitchell TP, Prospero JM, Shinn EA, et al. (2001)How are climate and marine biological outbreaks functionally linked?Hydrobiologia 460: 213–220.
19. Harvell CD, Kim K, Burkholder JM, Colwell RR, Epstein PR, et al. (1999)Emerging marine diseases–Climate links and anthropogenic factors.Science 285: 1505–1510.
20. Porter JW, Dustan P, Jaap WC, Patterson KL, Kosmynin V, et al. (2001)Patterns of spread of coral disease in the Florida Keys. Hydrobiologia 460:1–24.
21. Idjadi JA, Edmunds PJ (2006) Scleractinian corals act as facilitators forother invertebrates on a Caribbean reef. Mar Ecol Prog Ser 319: 117–127.
22. Bruno JF, Bertness MD (2001) Habitat modification and facilitation inbenthic marine communities. In: Bertness MD, Gaines SD, Hay ME, editors.Marine community ecology. Sunderland (Massachusetts): Sinauer Associ-ates. pp. 201–218.
23. Jones GP, McCormick MI, Srinivasan M, Eagle JV (2004) Coral declinethreatens fish biodiversity in marine reserves. Proc Natl Acad Sci U S A 101:8251–8253.
24. Edmunds PJ (1991) Extent and effect of black band disease on a Caribbeanreef. Coral Reefs 10: 161–165.
25. Kuta KG, Richardson LL (2002) Ecological aspects of black band disease ofcorals: Relationships between disease incidence and environmental factors.Coral Reefs 21: 393–398.
26. Kuta KG, Richardson LL (1996) Abundance and distribution of black banddisease on coral reefs in the northern Florida Keys. Coral Reefs 15: 219–223.
27. Patterson KL, Porter JW, Ritchie KE, Polson SW, Mueller E, et al. (2002) Theetiology of white pox, a lethal disease of the Caribbean elkhorn coral,Acropora palmata. Proc Natl Acad Sci U S A 99: 8725–8730.
28. Gil-Agudelo DL, Garzon-Ferreira J (2001) Spatial and seasonal variation ofDark Spots Disease in coral communities of the Santa Marta area(Colombian Caribbean). Bull Mar Sci 69: 619–629.
29. Jones RJ, Bowyer J, Hoegh-Guldberg O, Blackall LL (2004) Dynamics of atemperature-related coral disease outbreak. Mar Ecol Prog Ser 281: 63–77.
30. Willis BL, Page CA, Dinsdale EA (2004) Coral disease on the Great BarrierReef. In: Rosenberg E, Loya Y, editors. Coral health and disease. Berlin:Springer-Verlag. pp. 69–104.
31. Borger JL, Steiner SCC (2005) The spatial and temporal dynamics of coraldiseases in Dominica, West Indies. Bull Mar Sci 77: 137–154.
32. Bruno JF, Petes LE, Harvell CD, Hettinger A (2003) Nutrient enrichmentcan increase the severity of coral diseases. Ecol Lett 6: 1056–1061.
33. Rothman K, Greenland S, editors (1998) Modern epidemiology. Philadel-phia: Lippincott-Raven. 738 p.
34. Kim K, Harvell CD (2004) The rise and fall of a six-year coral-fungalepizootic. Am Nat 164: S52–S63.
35. Lafferty KD (2004) Fishing for lobsters indirectly increases epidemics in seaurchins. Ecol Appl 14: 1566–1573.
36. Roff G, Hoegh-Guldberg O, Fine M (2006) Intra-colonial response toAcroporid ‘‘white syndrome’’ lesions in tabular Acropora spp. (Scleractinia).Coral Reefs 25: 255–264.
37. Selig ER, Harvell CD, Bruno JF, Willis BL, Page CA, et al. (2006) Analyzingthe relationship between ocean temperature anomalies and coral diseaseoutbreaks at broad spatial scales. In: Phinney J, Hoegh-Guldberg O, KleypasJ, Skirving W, Strong A, editors. Coral reefs and climate change: Scienceand management. Washington (D. C.): American Geophysical Union. pp.111–128.
38. Harvell D, Kim K, Quirolo C, Weir J, Smith G (2001) Coral bleaching anddisease: Contributors to 1998 mass mortality in Briareum asbestinum(Octocorallia, Gorgonacea). Hydrobiologia 460: 97–104.
39. Alker AP, Smith GW, Kim K (2001) Characterization of Aspergillus sydowii(Thom et Church), a fungal pathogen of Caribbean sea fan corals.Hydrobiologia 460: 105–111.
40. Glynn PW (1996) Coral reef bleaching: Facts, hypotheses and implications.Glob Change Biol 2: 495–509.
41. Hoegh-Guldberg O (1999) Climate change, coral bleaching and the futureof the world’s coral reefs. Mar Freshw Res 50: 839–866.
42. Glynn PW (1993) Coral-reef bleaching—Ecological perspectives. CoralReefs 12: 1–17.
43. Berkelmans R (2002) Time-integrated thermal bleaching thresholds of reefsand their variation on the Great Barrier Reef. Mar Ecol Prog Ser 229: 73–82.
44. Winter A, Appeldoorn RS, Bruckner A, Williams EH, Goenaga C (1998) Seasurface temperatures and coral reef bleaching off La Parguera, Puerto Rico(northeastern Caribbean Sea). Coral Reefs 17: 377–382.
45. Fitt WK, Brown BE, Warner ME, Dunne RP (2001) Coral bleaching:Interpretation of thermal tolerance limits and thermal thresholds intropical corals. Coral Reefs 20: 51–65.
46. Fitt WK, McFarland FK, Warner ME, Chilcoat GC (2000) Seasonal patternsof tissue biomass and densities of symbiotic dinoflagellates in reef coralsand relation to coral bleaching. Limnol Oceanogr 45: 677–685.
47. Brown BE, Dunne RP, Ambarsari I, Le Tissier MDA, Satapoomin U (1999)Seasonal fluctuations in environmental factors and variations in symbioticalgae and chlorophyll pigments in four Indo-Pacific coral species. Mar EcolProg Ser 191: 53–69.
48. Banin E, Vassilakos D, Orr E, Martinez RJ, Rosenberg E (2003) Superoxidedismutase is a virulence factor produced by the coral bleaching pathogenVibrio shiloi. Curr Microbiol 46: 418–422.
49. Connell JH (1978) Diversity in tropical rain forests and coral reefs. Science199: 1302–1310.
50. Altizer S, Nunn CL, Thrall PH, Gittleman JL, Antonovics J, et al. (2003)Social organization and parasite risk in mammals: Integrating theory andempirical studies. Annu Rev Ecol Evol Syst 34: 517–547.
51. Rudolf VHW, Antonovics J (2005) Species coexistence and pathogens withfrequency-dependent transmission. Am Nat 166: 112–118.
52. Anderson RM, May RM (1979) Population biology of infectious diseases.Part I. Nature 280: 361–367.
53. Lafferty KD, Gerber LR (2002) Good medicine for conservation biology:The intersection of epidemiology and conservation theory. Conserv Biol16: 593–604.
54. Holt RD, Pickering J (1985) Infectious disease and species coexistence—Amodel of Lotka-Volterra form. Am Nat 126: 196–211.
55. Getz WM, Pickering J (1983) Epidemic models—Thresholds and populationregulation. Am Nat 121: 892–898.
56. Altizer SM, Augustine DJ (1997) Interactions between frequency-dependentand vertical transmission in host-parasite systems. Proc R Soc Lond B BiolSci 264: 807–814.
57. Connell JH, Hughes TE, Wallace CC, Tanner JE, Harms KE, et al. (2004) Along-term study of competition and diversity of corals. Ecol Monogr 74:179–210.
58. Rosenberg E, Falkovitz L (2004) The Vibrio shiloi/Oculina patagonica modelsystem of coral bleaching. Annu Rev Microbiol 58: 143–159.
59. Williams DE, Miller MW (2005) Coral disease outbreak: Pattern, prevalenceand transmission in Acropora cervicornis. Mar Ecol Prog Ser 301: 119–128.
60. Lang JC, Chornesky EA (1990) Competition between scleractinian reefcorals—A review of mechanisms and effects. In: Dubinsky Z, editor.Ecosystems of the world. Volume 25: Coral reefs. Amsterdam: Elsevier. pp.209–252.
61. Tanner JE (1997) Interspecific competition reduces fitness in scleractiniancorals. J Exp Mar Biol Ecol 214: 19–34.
62. Colgan MW (1987) Coral reef recovery on Guam (Micronesia) aftercatastrophic predation by Acanthaster planci. Ecology 68: 1592–1605.
63. Connell JH, Hughes TP, Wallace CC (1997) A 30-year study of coralabundance, recruitment, and disturbance at several scales in space andtime. Ecol Monogr 67: 461–488.
64. Aronson RB, Precht WF (2006) Conservation, precaution, and Caribbeanreefs. Coral Reefs 25: 441–450.
65. Smith KF, Sax DF, Lafferty KD (2006) Evidence for the role of infectiousdisease in species extinction and endangerment. Conserv Biol 20: 1349–1357.
66. Short FT, Wyllie-Echeverria S (1996) Natural and human-induceddisturbance of seagrasses. Environ Conserv 23: 17–27.
67. Cottam C (1934) Past periods of eelgrass scarcity. Rhodora 36: 261–264.68. Andrews JD (1996) History of Perkinsus marinus, a pathogen of oysters in
Chesapeake Bay 1950–1984. J Shellfish Res 15: 13–16.69. Lessios HA (1988) Mass mortality of Diadema antillarum in the Caribbean:
What have we learned? Annu Rev Ecol Syst 19: 371–393.70. Carpenter RC (1990) Mass mortality of Diadema antillarum. Mar Biol 104: 67–
77.71. Aronson RB, Precht WF (2001) White-band disease and the changing face
of Caribbean coral reefs. Hydrobiologia 460: 25–38.72. Aronson RB, MacIntyre IG, Precht WF, Murdoch TJT, Wapnick CM (2002)
The expanding scale of species turnover events on coral reefs in Belize.Ecol Monogr 72: 233–249.
73. Berkelmans R, De’ath G, Kininmonth S, Skirving WJ (2004) A comparisonof the 1998 and 2002 coral bleaching events on the Great Barrier Reef:Spatial correlation, patterns, and predictions. Coral Reefs 23: 74–83.
74. Richardson LL, Kuta KG (2003) Ecological physiology of the black band
PLoS Biology | www.plosbiology.org June 2007 | Volume 5 | Issue 6 | e1240007
Drivers of Coral Disease

disease cyanobacterium Phormidium corallyticum. FEMS Microbiol Ecol 43:287–298.
75. Kim K, Harvell CD (2002) Aspergillosis of sea fan corals: Disease dynamicsin the Florida Keys. In: Porter JW, Porter KG, editors. The Everglades,Florida Bay, and coral reefs of the Florida Keys: An ecosystem sourcebook.Boca Raton (Florida): CRC Press. pp. 813–824.
76. Edmunds PJ, Carpenter RC (2001) Recovery of Diadema antillarum reducesmacroalgal cover and increases abundance of juvenile corals on aCaribbean reef. Proc Natl Acad Sci U S A 98: 5067–5071.
77. Idjadi JA, Lee SC, Bruno JF, Precht WF, Allen-Requa L, et al. (2006) Rapidphase-shift reversal on a Jamaican coral reef. Coral Reefs 25: 209–211.
78. Gardner TA, Cote IM, Gill JA, Grant A, Watkinson AR (2003) Long-termregion-wide declines in Caribbean corals. Science 301: 958–960.
79. Bellwood DR, Hughes TP, Folke C, Nystrom M (2004) Confronting the coralreef crisis. Nature 429: 827–833.
80. Hughes TP, Baird AH, Bellwood DR, Card M, Connolly SR, et al. (2003)Climate change, human impacts, and the resilience of coral reefs. Science301: 929–933.
81. Graham NAJ, Wilson SK, Jennings S, Polunin NVC, Bijoux JP, et al. (2006)Dynamic fragility of oceanic coral reef ecosystems. Proc Natl Acad Sci U SA 103: 8425–8429.
82. Sutherland KP, Porter JW, Torres C (2004) Disease and immunity inCaribbean and Indo-Pacific zooxanthellate corals. Mar Ecol Prog Ser 266:273–302.
83. Ward JR, Lafferty KD (2004) The elusive baseline of marine disease: Arediseases in ocean ecosystems increasing? PloS Biol 2: 542–547. doi:10.1371/journal.pbio.0020120
84. Sweatman H, Abdo D, Burgess S, Cheal A, Coleman G, et al. (2003) Long-
term monitoring of the Great Barrier Reef: Status report number 6.Townsville (Australia): Australian Institute of Marine Science. 226 p.
85. Ninio R, Meekan M, Done T, Sweatman H (2000) Temporal patterns incoral assemblages on the Great Barrier Reef from local to large spatialscales. Mar Ecol Prog Ser 194: 65–74.
86. Kilpatrick KA, Podesta GP, Evans R (2001) Overview of the NOAA/NASAadvanced very high resolution radiometer Pathfinder algorithm for seasurface temperature and associated matchup database. J Geophys Res 106:9179–9197.
87. Reynolds RW, Rayner NA, Smith TM, Stokes DC, Wang WQ (2002) Animproved in situ and satellite SST analysis for climate. J Clim 15: 1609–1625.
88. Liu G, Skirving W, Strong AE (2003) Remote sensing of sea surfacetemperatures during 2002 Barrier Reef coral bleaching. Eos 84: 137–144.
89. Bruno JF, Siddon CE, Witman JD, Colin PL, Toscano MA (2001) El Ninorelated coral bleaching in Palau, Western Caroline Islands. Coral Reefs 20:127–136.
90. Berkelmans R, Willis BL (1999) Seasonal and local spatial patterns in theupper thermal limits of corals on the inshore Central Great Barrier Reef.Coral Reefs 18: 219–228.
91. Patz JA (2002) A human disease indicator for the effects of recent globalclimate change. Proc Natl Acad Sci U S A 99: 12506–12508.
92. Slymen DJ, Ayala GX, Arredondo EM, Elder JP (2006) A demonstration ofmodeling count data with an application to physical activity. EpidemiolPerspect Innov 3: 3.
93. DeMaris A (2004) Regression with social data: Modeling continuous andlimited response variables.Hoboken (New Jersey): JohnWiley and Sons. 534p.
PLoS Biology | www.plosbiology.org June 2007 | Volume 5 | Issue 6 | e1240008
Drivers of Coral Disease