plii r ltpreliminary results 20112011 - marston's circa £1.0m of cost inflation –...
TRANSCRIPT

P li i R lt 2011Preliminary Results 2011

Highlights
1. Encouraging performance against challenging consumer backdrop • Revenue and profit growth Revenue and profit growth, strong margin performance• strong margin performance • Double digit EPS growth
22. Focused and consistent growth plansFocused and consistent growth plans • New-builds performing ahead of target • Continued roll out of Retail Agreement, performing in line with expectations
3. Full year dividend of 5.8p per share with improving cover
44. Clearly defined strategic objectives Clearly defined strategic objectives • Sustainable growth • Improve ROC
•• Reduce leverage Reduce leverage
Copper Pot, Knowsley
Improving performance and clear strategy 2

Andrew Andrea Chief Financial Officer

Financial summary
52 weeks 2011 2010 % change
Revenue £682.2m £650.7m +4.8%
Operating Margin 22.6% 22.9% (0.3)%
EBITDA £195.8m £188.6m +3.8%
Operating Profit £154.3m £148.7m +3.8%
Profit before tax* £80.4m £73.5m +9.4%
Adjusted EPS* 11.2p 10.0p +12.0%
CROCCE 9.8% 9.6% +0.2% Full Year Dividend 5.8p 5.8p Level
Dividend Cover 1.9x 1.7x +0.2x
* before exceptional items
Revenue, profit and returns growth; dividend cover improving 4
Presentation name > date
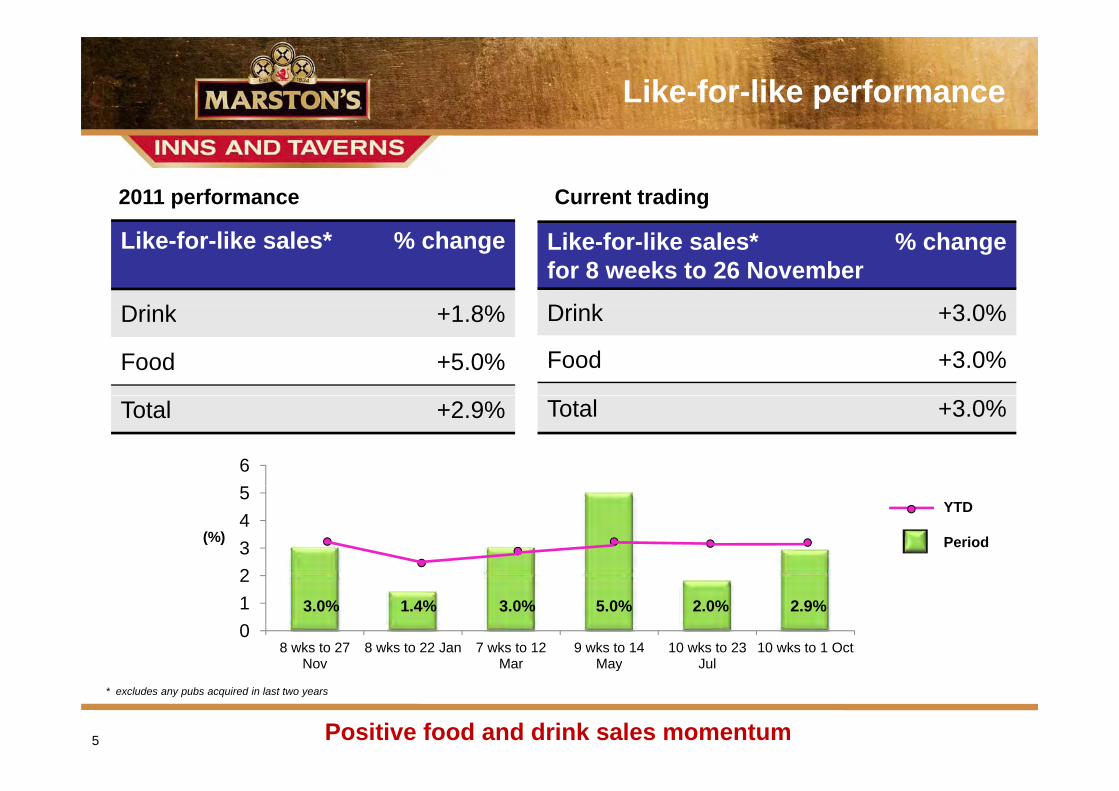
Like-for-like performance
2011 performance Current trading
Like-for-like sales* % change
D i k 1 8%
Like-for-like sales* for 8 weeks to 26 November
% change
D i k 3 0% Drink +1.8% Drink +3.0%
Food +5.0% Food +3.0%
Total +2.9% Total +3.0%
6
2 3 4 5
YTD
Period(%)
0 1 2
3.0% 1.4% 3.0% 5.0% 2.0% 2.9%
8 wks to 27 8 wks to 22 Jan 7 wks to 12 9 wks to 14 10 wks to 23 10 wks to 1 Oct NovNov MarMar MayMay JulJul
* excludes any pubs acquired in last two years
Positive food and drink sales momentum 5

Retail margin performance
(%)( ) 18.5
0.2% 18.1%
in
0.2%
0.1%
0.2% 18.1%
Mar
g
17.5 17.4%
0.2%
16.5 2010 Drinks Food Labour Other 2011
Continuing the improved margin performance 6
2010 Drinks Food Labour Other 2011

2012 cost outlook
£m£m
7
8 £1.5m
£1.0m £2.0m
1% RSP
5
6 £2.0m £3.0m
RSP
2%
3
4 £1.5m £1.5m
2% RSP
1
2
3 £2.0m
£1.5m
0
1
Drink Food Labour Utilities Carbon levy Wet price Food price Menu management
Cost management
2012 cost pressures will be mitigated 7

Heading (Arial Black 22pt) Heading (Arial Black 22pt)
g g
MPC segmented: 2011 performance
Long-term Retail Agreement Total leases estate
No. of pubs c1,000 c600 c1,600
Turnover +0.7% +22% +7.7%
Rent +1.6% n/a -
YOY EBIT % +0.8% - % +0.6%
STABILITY OPPORTUNITY STABILITY OPPORTUNITY
First 8 weeks: EBIT growth of 2.0%
Long-term leases stable, Retail Agreements in growth 8

• Operating profit up 0.6%, margins maintained • Strong cash generation
Continued market outperformance
1. Revenue growth • Revenue up 0.4% • Group ale volume up 2% • Group ale volume up 2% • Strong ale performance in all channels
2. Robust financial performancep
3. 2012 cost outlook • Circa £1.0m of cost inflation – primarily energy and barley
Will be mitigated mainly through price and improved • Will be mitigated mainly through price and improved production/distribution efficiency
Ale revenues in growth, higher margins, cost outlook manageable 9

t£ 2011 2010 2009 C
Cashflow summary
£m 2011 2010 2009 Comments
Operating cashflow 182.4 189.3 147.3 £13m higher tax
Net interest (69.9) (72.6) (77.3)
Pre-investment FCF 112.5 116.7 70.0
Net capex* (94.2) (63.3) (32.6) New-builds and Retail Agreements
Pre-dividend FCF 18.3 53.4 37.4
Dividend (33.0) (33.0) (35.9)
Net cashflow (14.7) 20.4 1.5
* Net of disposal proceeds FCF = Free cashflow
Strong pre-investment free cashflow maintained 10
t t
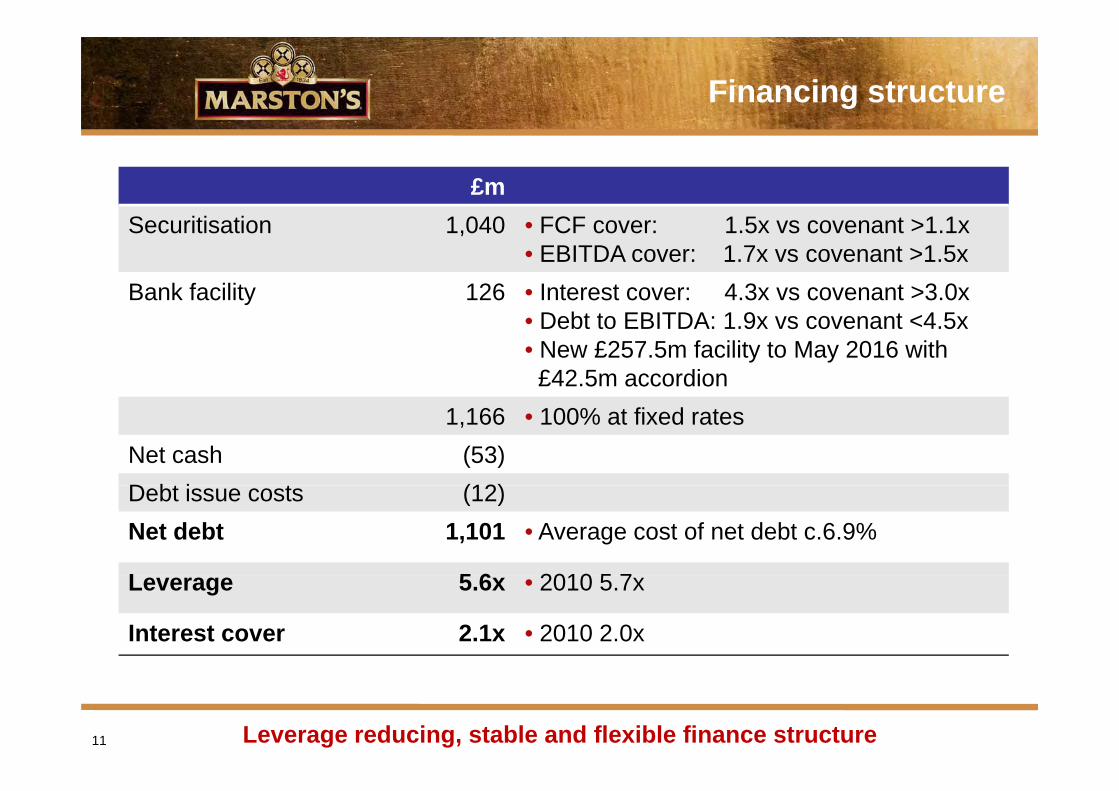
Financing structure
£m Securitisation 1,040
Bank facility 126
1,166 Net cash (53) D b iDebt issue costs (12)(12) Net debt 1,101
LLeverage 5 65.6x
Interest cover 2.1x
S i i i 1 040 FCF 1 1 1 • FCF cover: 1.5x vs covenant >1.1x • EBITDA cover: 1.7x vs covenant >1.5x • Interest cover: 4.3x vs covenant >3.0x • Debt to EBITDA: 1.9x vs covenant <4.5x • New £257.5m facility to May 2016 with £42.5m accordion
• 100% at fixed rates
• Average cost of net debt c.6.9%
2010 5 7 • 2010 5.7x
• 2010 2.0x
Leverage reducing, stable and flexible finance structure 11

Core Strategic Objectives
1. Sustainable Growth 2010Turnover Turnover £m £m 2011
2010EBITDAEBITDA £m £m 2011
2. Reduce Leveragge
3. Improve ROC
651 +5% 682
189 +4% 196 +4%
2010 2011
EPS 10.0p 11 2p
+12% 2011 (pence per share) 11.2p
2010 2011 Debt: EBITDA
5.7x 5.6x
0.1x lower
2010 2011 CROCCE %
9.6% 9.8%
+0.2% 2011 9.8%
Progress on all strategic objectives 12

Ralph FindlayRalph Findlay Chief Executive Officer

t
Dealing with the downturn
Macro/environment Discretionary spend under pressure
Inflation above pay settlements Prolonged economic uncertainty
Consumers Strategy
Value Service Quality
C i
Licensees
Business building
Relevant Focused and clear
Consistent Consistency Business building
Financial assistance Access to buying power
Strategy adapted to current consumer and customer trends 14
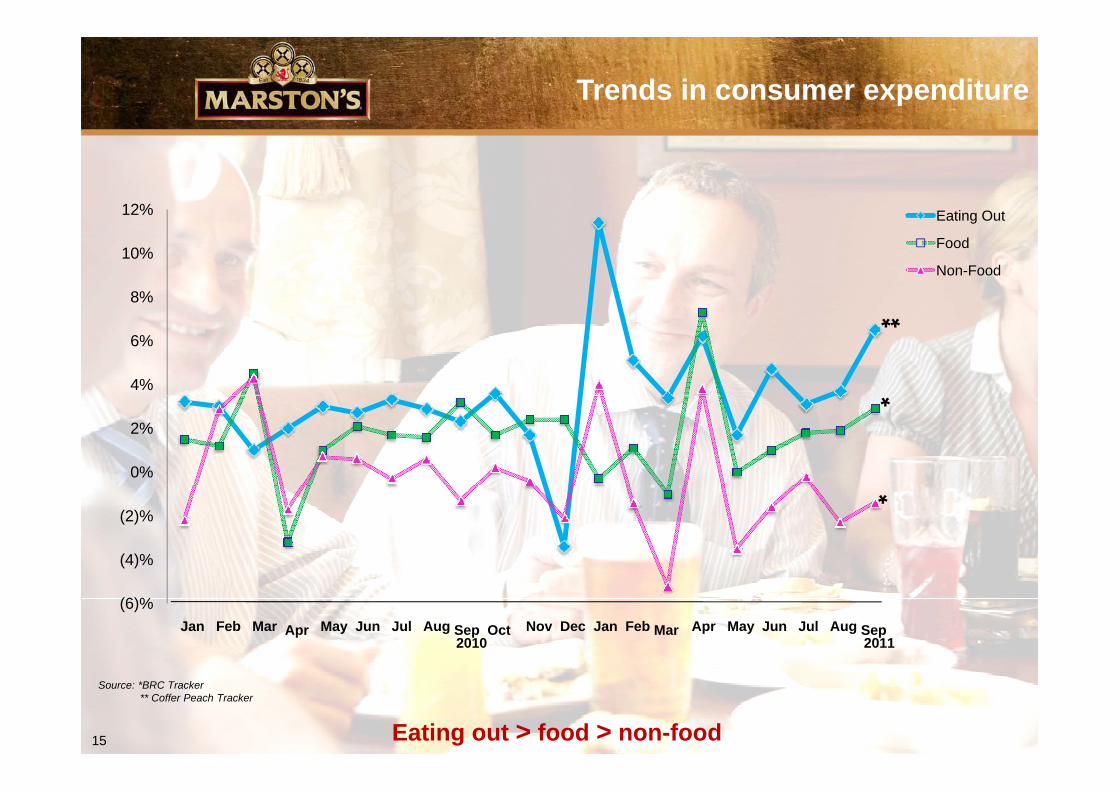
Trends in consumer expenditure
12% Eating Out
8%
10%
Eating Out
Food
Non-Food
4%
6%
** 0%
2%
*
(4)%
(2)%
*
(6)% Jan Feb Mar Apr May Jun Jul Aug Sep Oct Nov Dec Jan Feb Mar
2010 Apr May Jun Jul Aug Sep
2011
Eating out > food > non-food15
Source: *BRC Tracker ** Coffer Peach Tracker

Clear divisional strategies
STRATEGY KEY COMPONENTS OBJECTIVES
• ‘F-Plan’ • New-build investment
Exploit and develop competitive advantage in pubs and brewing
• Innovative agreements • Greater control of retail offer 1. Sustainable growth
2. Lower gearing ratios 3 I d ROC in pubs and brewing
sectors
L l
3. Increased ROC
• Localness • Premium ales
A clear strategy focused on growth and return 16
•
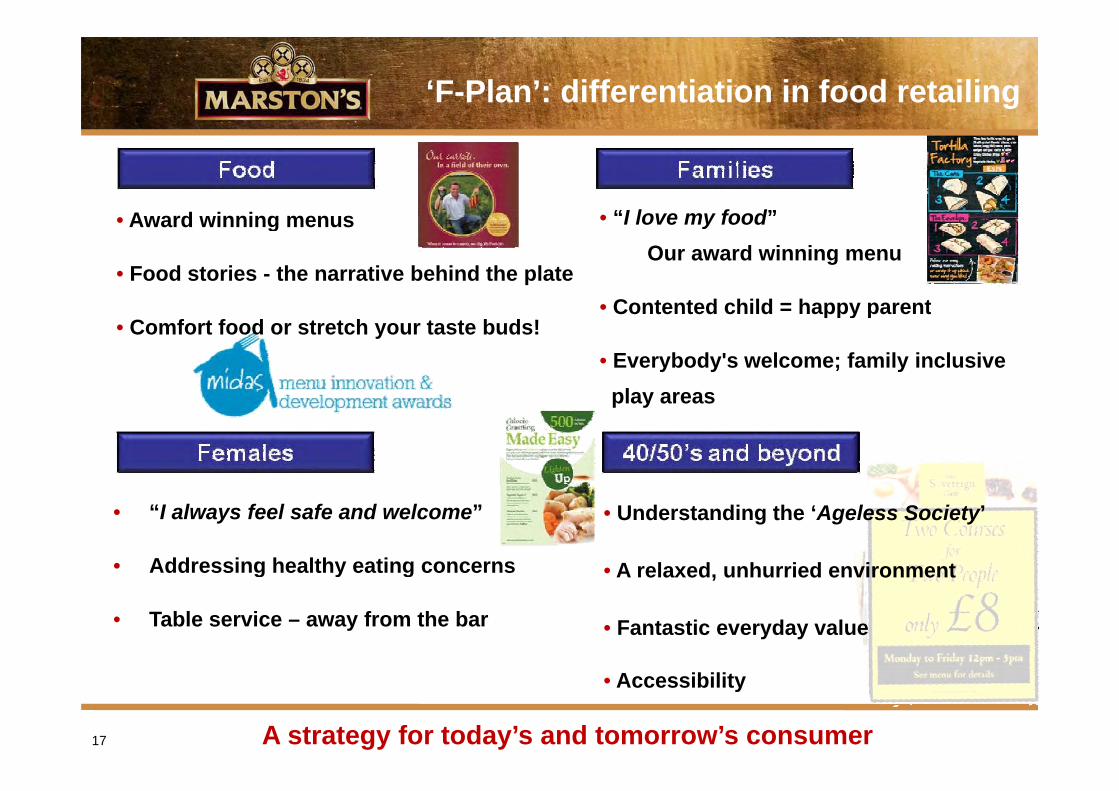
‘F-Plan’: differentiation in food retailing
• “I love my food”A ard inning men s • I love my food Our award winning menu
• Award winning menus
• Food stories - the narrative behind the plate • Contented child = happy parent• Contented child = happy parent
• Everybody's welcome; family inclusive play areas
• Comfort food or stretch your taste buds!
play areas
• “I always feel safe and welcome”
• Addressing healthy eating concerns
• Understanding the ‘Ageless Society’
A relaxed, unhurried environment g y g
• Table service – away from the bar
A relaxed, unhurried environment
• Fantastic everyday value
• Accessibility
A strategy for today’s and tomorrow’s consumer 17
or ne
g y
B d d Hi h
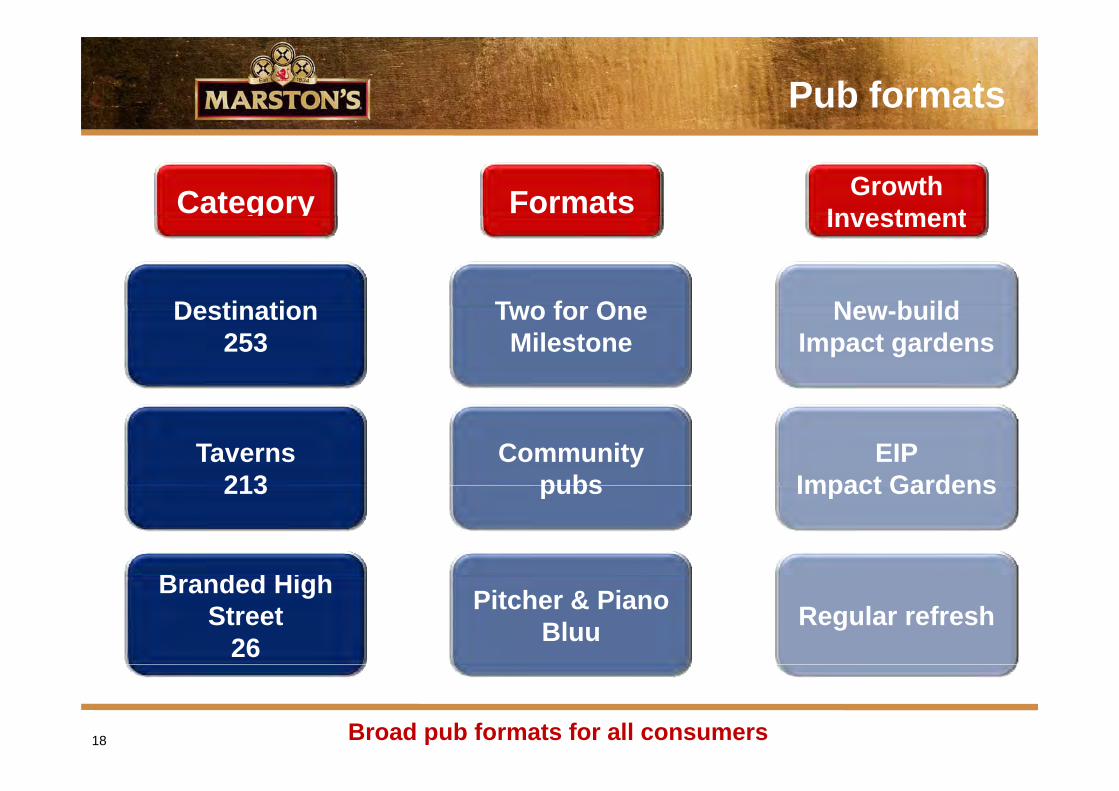
Pub formats
Growth InvestmentFormatsCategory Investment
DestinationDestination 253
Taverns 213213
T o f OTwo for One Milestone
Community pubspubs
Ne b ildNew-build Impact gardens
EIP Impact Gardens Impact Gardens
Branded High Street
26 Regular refreshPitcher & Piano
Bluu
Broad pub formats for all consumers 18

Two for One
Food Families
Females 40/50’s and beyond
Excellent customer satisfaction scores consistently higher than industry average 19

Two for One
• Strong lfl sales• Strong lfl sales • Wet +6% • Food +8%
• High food mix 61% • Kids meals +25% • 11 million meals per annum• 11 million meals per annum
• Quality offer encourages trading up • Starters +20%• Starters +20% • Desserts +26% • Coffee +20%
20 Consistent, value for money format driving growth
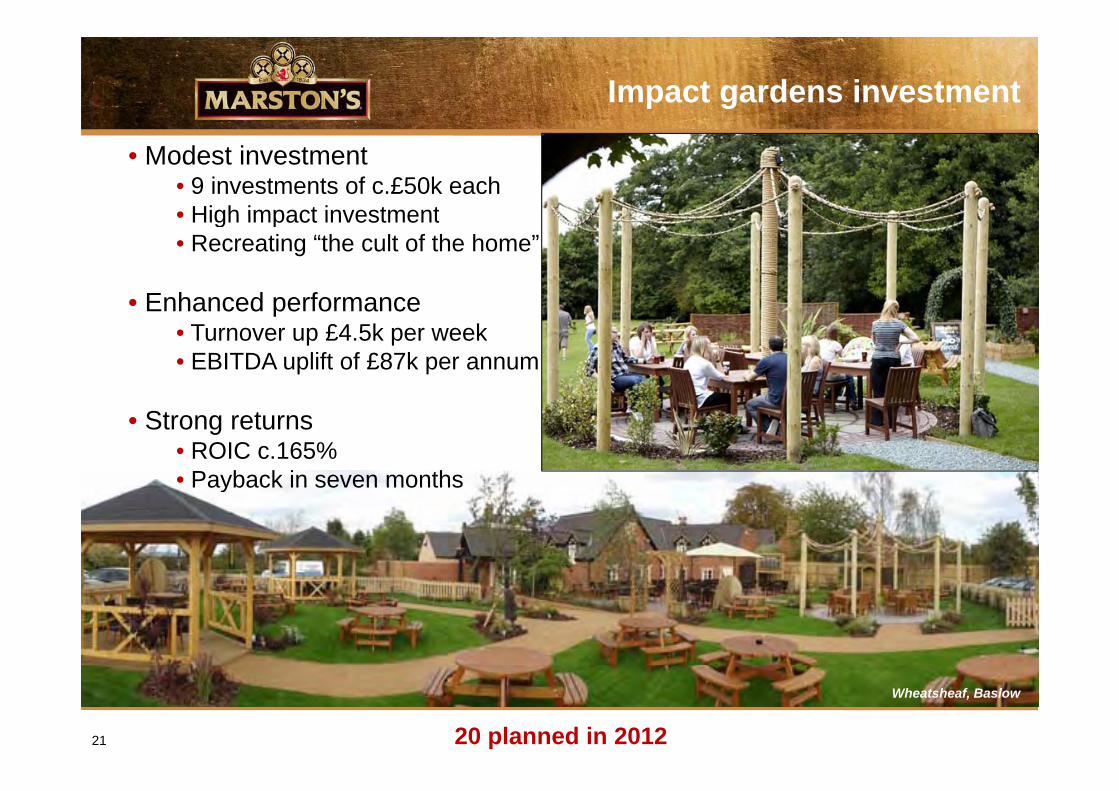
Impact gardens investment
• Modest investment • 9 investments of c.£50k each •• High impact investmentHigh impact investment • Recreating “the cult of the home”
• Enhanced performanceEnhanced performance • Turnover up £4.5k per week • EBITDA uplift of £87k per annum
• Strong returns • ROIC c.165% • Payback in seven monthsPayback in seven months
Wheatsheaf, Baslow
20 planned in 2012 21

New-build performance
2009 Pre 2010 2009 target
Pre 2010 sites
£27k
32%
c.£6.50
Post 2010/11 Post 2010/11 sites
Turnover pper week £20k £21k
EBITDA conversion 30% 32%
Food mix 55% 57% 62%
Food spend per head c.£6.00 c.£6.00
EBITDA ROI* 15% 17.3% 18.6%
*annualised pro-forma
Strong performance continues; investment at 5.4x EBITDA 22

New-builds: regional performance
MAT Performance on new-build sites: 55 sites 2005-2011*
North West 14 pubs AWT: £25kAWT: £25k EBITDA ROI: 18%
Wales 6 pubs AWT: £23k EBITDA ROI: 18%
South West South West 7 pubs AWT: £23k EBITDA ROI: 16%
North East 10 pubs10 pubs AWT: £23k EBITDA ROI: 18%
South East 18 pubs AWT: £22k EBITDA ROI: 17%
*sites trading at least 3 months
Strong trading across all regions, key factor is pub location and offer 23

20
New-build performance
Cobblestones March Blue Jay DerbyCobblestones, March Blue Jay, Derby
Running Horse, Fakenham The Orchard at Amesbury

e a ted a c se
Heading (Arial Black 22pt) Heading (Arial Black 22pt)
O ti M d l
Flexible Operating Models
Operating Model
Tenanted Franchise
Bespoke offer Higher food mix
Standardised consumer proposition Every day value Higher food mix
Entrepreneur taking risk More skilled operator driving stability
Every day value Lower risk for licensee
Turnover focused operator
Flexibility ensures right pub, right operator, right model 25
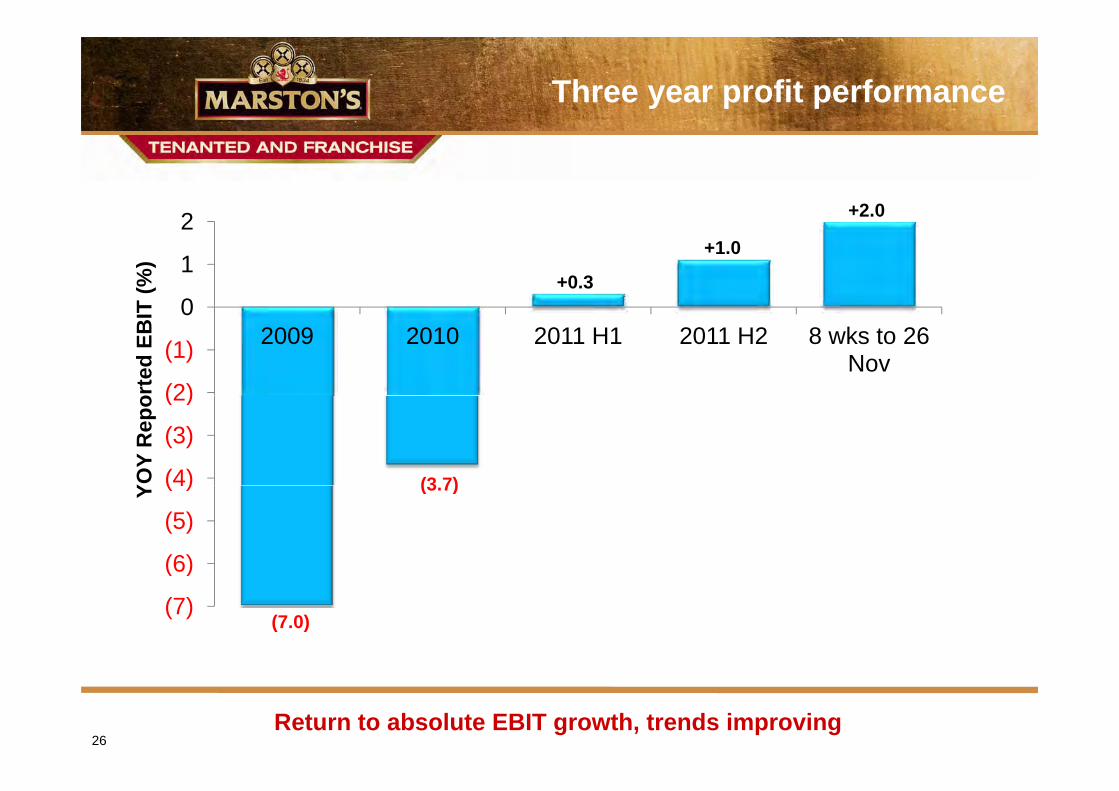
Heading (Arial Black 22pt) Heading (Arial Black 22pt)Three year profit performance
+2.02.0 2
(7.0)
0
1
2
+0.3
+1.0
T (%
)
(2)
(1)
0 2009 2010 2011 H1 2011 H2 8 wks to 26
Nov
orte
d EB
IT
(4)
(3)
(2)
(3 7) YOY
Rep
o
(6)
(5)
(4) (3.7)Y
(7)
( )
Return to absolute EBIT growth, trends improving 26

Heading (Arial Black 22pt) Heading (Arial Black 22pt)
Retail Agreement performance
1. Post-conversion performance 2. 2010 sites improving: Turnover p wTurnover p.w.
• Turnover per week: £3,700 => continuing to improve 4000
£ pe
r pub 3500
3000
2500
• Food mix: 13% 20002000
12 1 2 3 4 5 6 7 8 9 10 11 12 Period
Volume MAT TVolume MA
230
• EBITDA: £45kpa
=> achieving EBITDA target
• ROIC: 45% => approx. 2 year payback
Brls
. pper
pub 210
190190
170
150
12 1 2 3 4 5 6 7 8 9 10 11 12 Period
12 1 2 3 4 5 6 7 8 9 10 11 12
Turnover and profit improvement being achieved 27

Heading (Arial Black 22pt) Heading (Arial Black 22pt)
George, Winslow
Retail Agreement appeal
Retailer • High number of applicants – 3x higher than traditional tenancy • Retention high • High approval rating – 93% recommend
Consumer • Leverage managed house insights and disciplines • Refurbished pub: “best place around here” • Consistent marketing offer • Value for money focus
Peers • Others introducing alternative models...
- but all still have rent and beer price issues • Tenanted Pubco of the Year Award
Increased control over retail offer 28

Heading (Arial Black 22pt) Heading (Arial Black 22pt)
Stability in traditional estate
1. Enhanced licensee support • C bi d
i l d tCombined commercial departmentt • Revenue generating support • Access to Group buying power
2. Improved licensee quality • Internal code of conduct introduced
- PProcess ddesigned t d to redduce riiskk o f t f tenant fail ilurei
t f • Minimum “skill-bar” for licensees
33. Agreement flexibility Agreement flexibility • Focus on overall commercial structure that suits licensee • Flexibility on drinks pricing and tie arrangements
- Includes free of tieIncludes free of tie
4. Selective capital investment • Recognise quality licensees need investment support • I t t i t t ith
d h j t ( dInvestments consistent with proven managed house projects (e.g. gardens))
Focus on growth and business building driving stability 29

Continued progress in beer
1. Group ale up 2% despite a declining market • Innovation assisting growth, fastcaskTM now 20% of cask ale brewed
2. Localness •• Independent Free Trade success continues Independent Free Trade success continues
- 7% increase in customers
- Cask ale up 4%
• Local marketingg su pppp ort maintained
3. Premium • Leading market share in premium cask and premium bottled ale • National marketing support
- Pedigree – Official Beer of England Cricket
- Hobgoblin – Unofficial “Beer of Halloween”
4. Asset utilisation driving strong EBITDA return • Tetley and Bass brewing • Contract bottling trunkingContract bottling, trunking
Focused strategy driving consistent and strong returns 30

Summary
4. Current trading encouraging
1. Clear, consistent and focused strategy
2. Strategy designed to respond to long-term consumer and customer trendstrends
3. Progress on all three strategic objectives
Watermead, Northwich
Improving trends, clear agenda for growth 31


AppendicesAppendices

2,148 pubs +
Marston’s Pubs Limited 276 Managed pubs
1 554 Tenanted pubs
Other Group companies 218 Managed pubs 100 Tenanted pubs 1,554 Tenanted pubs
1,830 100 Tenanted pubs 318
+
85% of pubs are securitised 334

Segmental analysis
H1 H2 Full Year 2011 2010 2011 2010 2011 2010 £m £m % £m £m % £m £m %
TurnoverTurnover Marston’s Inns and Taverns 181.7 175.4 3.6% 210.1 198.4 5.9% 391.8 373.8 4.8% Marston’s Pub Company 85.9 82.2 4.5% 98.0 88.6 10.6% 183.9 170.8 7.7% Marston’s Beer Company 50.3 51.6 (2.5%) 56.2 54.5 3.1% 106.5 106.1 0.4% Marston’s Group Services - - - - - - - - -Total 317.9 309.2 2.8% 364.3 341.5 6.7% 682.2 650.7 4.8%
EBITDA Marston’s Inns and Taverns 36.5 35.3 3.4% 54.7 49.3 11.0% 91.2 84.6 7.8% Marston’s Pub Company 43.6 43.3 0.7% 46.0 45.1 2.0% 89.6 88.4 1.4% Marston’s Beer Company 11.6 11.5 0.9% 13.4 13.4 0.0% 25.0 24.9 0.4% Marston’s Group Services (4.9) (4.6) (6.5%) (5.1) (4.7) (8.5%) (10.0) (9.3) (7.5%) Total Total 86 8 86.8 85 5 85.5 1 5% 1.5% 109 0 109.0 103 1 103.1 5 7% 5.7% 195 8 195.8 188 6 188.6 3 8% 3.8%
Operating Profit Marston’s Inns and Taverns 26.5 25.5 3.9% 44.5 39.6 12.4% 71.0 65.1 9.1% Marston’s Pub Company 38.6 38.5 0.3% 40.7 40.3 1.0% 79.3 78.8 0.6% Marston’s Beer Company 7.3 7.2 1.4% 9.0 9.0 0.0% 16.3 16.2 0.6% Marston’s Group Services Marston s Group Services (6 0) (6.0) (5 7) (5.7) (5 3%) (5.3%) (6 3) (6.3) (5 7) (10 5%) (5.7) (10.5%) (12 3) (12.3) (11 4) (11.4) (7 9%) (7.9%) Total 66.4 65.5 1.4% 87.9 83.2 5.6% 154.3 148.7 3.8%
Margin % Marston’s Inns and Taverns 14.6% 14.5% 0.1% 21.2% 20.0% 1.2% 18.1% 17.4% 0.7% Marston’s Pub Company 44.9% 46.8% (1.9%) 41.5% 45.5% (4.0%) 43.1% 46.1% (3.0%) Marston’s Beer Company Marston s Beer Company 14 5% 14.5% 14 0% 14.0% 0 5% 0.5% 16 0% 16.0% 16 5% 16.5% (0 5%) (0.5%) 15 3% 15.3% 15 3% 15.3% 0 0% 0.0% Marston’s Group Services Total 20.9% 21.2% (0.3%) 24.1% 24.4% (0.3%) 22.6% 22.9% (0.3%)
Finance Costs (37.2) (37.7) 1.3% (36.7) (37.5) 2.1% (73.9) (75.2) 1.7%
Profit Before Tax Profit Before Tax 29 2 29.2 27 8 27.8 5 0% 5.0% 51 2 51.2 45 7 45.7 12 0% 12.0% 80 4 80.4 73 5 73.5 9 4% 9.4%
35

Average number of shares in 2011 Average number of shares in 2011 568 9m 568.9m
Number of shares in issue as at 1 October 2011 568.9m
Additional dilutive number of shares 3.1m
Actual Forecast 2011 2012
Tax rate c.21% 22 - 24%
Capex £111m £100-110m
Disposal proceeds c.£15m c.£30m
36

Securitisation as at 1 October 2011
Securitisation results £m Actual
• Gross debt(1) outstanding as at 1 Oct 2011 1,039.7
• EBITDA 131.3
• Free cashflow (FCF) 113.4
• Debt service (DSCR) 77.7Debt service (DSCR) 77.7
Financial covenants Actual Covenant
• FCF : DSCR 1 5x >1 1x(2) >1.1x(2)• FCF : DSCR 1.5x
• EBITDA : DSCR 1.7x >1.5x(3)
• Net worth £572.8m £90m
(1)before debt issue costs (1)before debt issue costs (2)restricted payment covenant >1.3x (3)restricted payment covenant only
Strong headroom on securitised covenants 37

Securitisation debt profile
Tranche Type Principal outstanding
Step-up Final Maturity outstanding at 1/10/2011
Date Date
A1 Floating £162.1m July 2012 2020g y
A2 Fixed/Floating £214.0m July 2019 2027
A3 Fixed/Floating £200.0m April 2027 2032
A4 Floating £228.6m October 2012 2031
AB1 Floating £80.0m October 2012 2035
B Fixed/Floating £155.0m July 2019 2035
Total £1,039.7m
38

100.0 Securitised Debt Service (DS)
80.0
90.0
50.0
60.0
70.0
£m
30.0
40.0
£
10.0
20.0
-
'11
'12
'13
'14
'15
'16
'17
'18
'19
'20
'21
'22
'23
'24
'25
'26
'27
'28
'29
'30
'31
'32
'33
'34
'35
Securitisation profile
M £86 3 /£84 2
70 0 Total DS
DS pre Interest Income A1 Stepup A3 StepupMax £86.3m/£84.2m
PrincipalInterest
A4 AB1 Stepup
A2 B1 Stepup
Deposit interest
Financial year
39

www.marstons.co.uk