playing fair: how fairness beliefs influence health reform ... · playing fair: how fairness...
TRANSCRIPT

Playing Fair: How Fairness Beliefs Influence Health Reform Policy Preferences in the United States
May 26, 2009
Julia Lynch Janice and Julia Bers Assistant Professor in the Social Sciences
(corresponding author)
and
Sarah E. Gollust Robert Wood Johnson Foundation Health and Society Scholar
1

ABSTRACT
Conventional wisdom suggests that the best strategy to persuade Americans to support health reform is to appeal to Americans’ self-interest—their economic security and concerns about their personal health. An alternative strategy might be to frame problems in the health system to emphasize inequalities, thus activating the public’s underlying attitudes about the fairness of these inequalities to mobilize their support for health reform. In this paper, we draw on original data from a nationally representative survey to describe Americans’ perceptions of the fairness of health inequalities, and assess the effect of these fairness considerations on health policy opinions. We find that after taking into account self-interest considerations, political orientations, membership in a disadvantaged group, and egalitarian and humanitarian values, perceptions of the unfairness of inequalities in health strongly influence respondents’ preferences for government provision of health insurance. Acknowledgements: The authors acknowledge the University of Pennsylvania’s University Research Fund and the Robert Wood Johnson Foundation for financial support of this research. We are indebted to the networks of scholars engaged in the RWJF Health Policy Scholars, Health and Society Scholars, and Investigator Awards programs for ongoing intellectual support of and engagement with this project. We would especially like to thank Nicholas Christakis, David Cutler, Vincent Hutchings, and Craig Pollack for their help with survey design; and Matt Levendusky and Elizabeth Rigby for their perspicacious comments on earlier drafts of this paper.
2
It is probably no accident that the failed reform efforts of the Clinton administration appealed to middle-class self-interest and to the self-interest of large employers worried about costs, with no appeal to the moral considerations about equality and fairness that lie at the heart of universal coverage.” (Daniels, Kennedy and Kawachi 2000, p. 93)
With that sense of the battle-scarred history of health care politics, Mr. Obama began a careful campaign to frame the issue more as a pocketbook concern than a moral one. Given that four of five Americans are dissatisfied with health costs, while only 15 percent lack insurance, strategists have argued since the Clinton health care debacle of the 1990s that success would depend on persuading the vast middle of its economic self-interest.” (Sack 2008)
Health care reform is back, again, on the U.S. political agenda. The latest polling data indicate widespread dissatisfaction with the current health care system, with a majority of Americans now ranking the state of the health care system as fair or poor (Blendon et al. 2008a). As in the previous major health care reform experience of 1993-1994, public opinion is likely to be a critical contributor to the policy-making process (Koch 1998). But what aspects of public opinion are most important? Are policy preferences informed for the most part by citizens’ self-interest? Or do the considerations about fairness cited by Daniels, Kennedy and Kawachi play an important role in public opinion about health care reform? In this paper we argue that public perceptions of the fairness of inequalities in health care are powerful predictors of policy preferences, stronger even than traditional self-interest. We provide empirical insight into what Americans think fairness means in the domain of health, and we demonstrate that beliefs about fairness matter for health policy preferences even after taking into account the “usual suspects” of partisanship, ideology, group identity, and egalitarian and humanitarian values. In a context in which social inequalities in health care access, health care quality and health outcomes are emerging on the public agenda, fairness considerations likely weigh heavily in health policy opinions and may form the basis for a coalition in support of a larger government role in providing health insurance. Scholars of the failed Clinton health care reform attempt have argued that public opinion of a particular kind – that is, opinion driven by self-interest – critically undermined that reform. Political elites successfully shifted public opinion against the health reform proposal Clinton introduced in 1993, the story goes, by making middle-class Americans anxious about losing their current health benefits (Goldsteen et al. 2001; Jacobs 2001). Lessons taken from the mid-1990s inform the current conventional wisdom: that the most effective way to capture public support is to emphasize health care reform’s ability to enhance the economic security, and hence self-interest, of middle-class Americans. And if the New York Times commentary cited in the second epigraph is to be
3
believed, this is the strategy the Obama administration will employ to mobilize public support for proposals to change the health care system. However, the conventional political wisdom may well be wrong. Decades of American public opinion research has demonstrated that self-interest is rarely the most important determinant of the public’s policy opinions (Sniderman 1993). Other factors, especially the public’s values and group identities, have a more consistent relationship with individuals’ support of, or opposition to, public policies (Kinder and Sanders 1996; Markus 2001). If self-interest considerations do not explain the bulk of Americans’ attitudes toward health care policy proposals, then appealing to self-interest may not be the best way to build a public coalition for health care reform. We find in this paper that while self-interest variables directly related to experiences with the health care system (uninsurance and ill health status) do affect health policy preferences, Americans’ beliefs about the fairness of health care inequalities tell us much more about the policies they prefer. To understand the politics of health care reform, then, we must be attentive to the role of fairness beliefs in shaping public opinion about health policy alternatives. And, we must understand what ordinary Americans mean when they talk of fairness in the domain of health.
BACKGROUND What Drives Public Opinion on Health Policy?
The standard view of American public opinion towards social policy issues is that several key ‘ingredients’ –self-interest, ideology, racial or social group identity, and fundamental social values—contribute to the public’s beliefs and preferences (Kinder and Sanders 1996). One perspective suggests that the public will support those policies that will help them maximize their individual goals or interests, such as improved financial or health status. This theory is the foundation for the political conventional wisdom cited above, and enjoys widespread currency in the academic literature as well (Brook et al. 1998; Cnaan et al. 1993; d'Anjou et al. 1995). Despite the intuitive appeal of such a notion, however, abundant empirical evidence demonstrates that self-interest generally has only a modest association with public policy opinion (Sears et al. 1980). Instead, people rely heavily on partisan and ideological cues as shortcuts to inform their opinions on complex policy matters (Sniderman 1993). Americans’ attitudes toward the social groups to which they belong and their attitudes toward other groups also contribute significantly to their policy opinions (Bobo and Hutchings 1996; Gilens 1999; Kinder and Sanders 1996; Nelson and Kinder 1996). Social values such as egalitarianism and humanitarianism comprise another important framework within which the public interprets their opinions across multiple policy issues (Rokeach 1968; Sniderman 1993; Tetlock 1986). More accessible to most Americans than ideological considerations, values provide an efficient benchmark against which to measure complex policy choices.
4
5
These basic ‘ingredients’ of policy opinion predict health policy preferences rather well. Sears and colleagues (1980) find that characteristics plausibly predictive of respondents’ direct interest in health policy (i.e., lacking health insurance, being underinsured, or having a low income) predict support for government-sponsored health insurance. So too, though, do political orientations (i.e., being liberal and/or a Democrat), and, as suggested above, ideology and partisanship are more strongly associated with policy opinions than are self-interest variables (Sears et al., 1980). Recent data on Americans’ opinions toward health reform suggest the continued importance of political identity, manifested by a substantial gulf in opinions between Republicans and Democrats regarding multiple health policy issues in 2008 (Blendon et al. 2008b). Group membership also matters for health policy preferences. For example, African Americans are significantly more likely than whites to report that health care was the first or second most important issue contributing to their presidential votes in the 2008 election (Blendon et al. 2008a). Finally, Koch (1998) finds that, adjusting for self-interest, political self-identifications, and socio-demographic factors, egalitarian values strongly predict support for government-sponsored health insurance.
The ‘ingredients’ described above all represent characteristics of individuals. But public evaluations of policies are also based, at least in part, on individuals’ judgments of the policy context – including whether they perceive the policy mechanisms or outcomes to be fair (Corneo and Gruner 2002; Fong 2001; Hochschild 1981; Kluegel and Smith 1986; Rasinski and Tyler 1986, 1988).1 The epitaph by Daniels, Kennedy, and Kawachi that begins this paper offers normative justification for why fairness considerations may be important to opinions about health policy. Empirical studies also suggest that beliefs about fairness are salient considerations underlying health policy opinions. Bernstein and Stevens (1999), for instance, find that evaluations of fairness frequently emerge in Medicare beneficiaries’ discussions of potential policy changes to Medicare. Moreover, Schlesinger (2002) and Laugesen (2005) show that clashes in norms of fairness between the public and elites explain public antipathy toward managed care and other market-oriented health care reform strategies in the U.S. and other advanced industrial democracies.
Fairness has multiple meanings and dimensions in the American political context.
Most research suggests that for a plurality of Americans, the idea of fairness in general is most closely linked to the notion of equal opportunity or equal treatment, rather than to equal outcomes (de Tocqueville 1963; Lipset 1990; Verba and Orren 1985; Rasinski and Tyler 1988). Equal opportunity —notably Daniels’ “fair equality of opportunity” account (1985)— and concerns about fair procedures, including transparency, accountability, and agreed-upon decision rules for resource allocation play an important role in contemporary thinking about health equity (Ruger 2008a).
Yet despite the conceptual similarity between these components of fairness and
concepts embedded in social values like egalitarianism, perceptions of fairness are not 1 Another aspect of the policy context that is significant for health policy preferences is the way that policies themselves shape the attitudes of beneficiaries. See e.g., Barabas (2009), Campbell and Morgan (2009).

synonymous with social values. Rasinski (1987) shows that predisposing values, including egalitarianism, are important predictors of judgments about fairness, but that social values do not explain all of the variation in fairness judgments. He suggests that fairness perceptions may also be influenced by factors unrelated to values, such as personal experiences with the government or the media agenda (Rasinski 1987, p. 209). Other research indicates that perceptions of the fairness of particular policies are also associated with the perceived deservingness of the target population that would be helped by the policy (Gilens 1999; Schneider and Ingram 1993).
But while concepts like equal opportunity and deservingness are typically viewed as central to Americans’ perceptions of fairness, beliefs about fairness may not be consistent across policy domains (Hochschild 1981; Walzer 1983). Thus, beliefs about fairness in the policy arena of income inequalities, for example, may not tell us very much about fairness beliefs in health policy. Whether or not health is a good with “special moral importance” (as Daniels 2008 and Ruger 2008b argue), the content and salience of fairness beliefs may differ between the health domain and the policy areas that govern other social goods. Thus, one of our research goals is to contribute empirical evidence about the meaning and dimensions of fairness in the health domain as distinct from other policy domains.
Inequalities, Framing, and Fairness
While the evidence just reviewed suggests that a host of considerations, including self-interest, group interest, political identifications, values, and perceptions of fairness might explain much of the variation in Americans’ health policy preferences, the relative importance of these specific components can change, and new factors can emerge, depending on how policy debates are framed in public discourse. When the communication environment emphasizes certain issues over others, thus making certain beliefs more available, accessible, or otherwise influential, we expect to observe corresponding changes in the beliefs the public draws from in forming their opinions (Chong and Druckman 2007a). This is because politicians and other elites aim to mobilize the public’s support for particular policies by “encouraging [the public] to think about these policies along particular lines…by highlighting certain features of the policy, such as its likely effects or its relationship to important values” (Chong and Druckman 2007a, p. 106). Such framing effects have been observed in studies of health policy opinion in the past. Koch (1998) demonstrates that the structure of public preferences toward health insurance changed along with the prominence of different kinds of arguments for health care reform advanced by political elites. Egalitarian values had a stronger impact on opinion in 1992 than in earlier years, corresponding to Clinton’s framing of the issue during the presidential campaign, while ideological considerations had a stronger impact after the health care reform debate became politicized by 1994 (Koch 1998). Similarly, Winter (2005) shows that views about gender roles became newly activated as contributors to health policy opinion during the mid-1990s as the public came to identify Hillary Clinton as a major player in the policy debate.
6

Considerations about fairness seem particularly likely to emerge as important
predictors of policy opinion when public discourse emphasizes inequalities in health. The concept of fairness is central to elite understandings of health inequalities, which are commonly defined as those differences in health that are “avoidable, unfair, and unjust” (emphasis added) (Braveman 2006, Whitehead 1992; see also Fleurbaey and Schokkaert 2009). The authors of a recent report by a bipartisan commission conceded, after describing health inequalities related to education and income, that “[t]his shouldn’t be the case in a nation whose highest ideals and values are based on fairness and equality of opportunity (emphasis added)” (Commission to Build a Healthier America 2009).
Moreover, in the book Healthy, Wealthy, and Fair (Morone and Jacobs
2005), health policy experts promote health reform policies predicated, in part, on the unfairness of the inequalities inherent in the current system. Thus, at least among elites (defined here as health policy experts), there appears to be a strong conceptual linkage between inequalities and concepts of fairness. Yet, there has been no research, to our knowledge, on whether the public, like policy elites, considers health and health care inequalities to be unfair.
Health inequalities have an increasingly prominent position in the current
information environment in the United States, suggesting their potential resonance as frames in the policy discourse. Academic attention to health inequalities has increased exponentially since 1990 (Kaplan 2004), and appears to have at least some influence on health policy and the news media. The Institute of Medicine’s landmark 2003 report Unequal Treatment, a major policy statement by a government-funded policy research unit, contained a bibliography citing over 600 academic works documenting racial disparities in health care (Smedley et al. 2003). Taylor-Clark and colleagues (2007) illustrate increasing news media attention to health care disparities, and the documentary film Unnatural Causes, which aired on public television in the spring of 2008, brought new public attention to inequalities in health outcomes and their social and economic causes.
Moreover, given the ongoing activities of two major domestic and international
commissions charged with promoting public and policymaker awareness of health inequalities, the World Health Organization Commission on Social Determinants and the Robert Wood Johnson Commission to Build a Healthier America, we expect attention to inequalities to grow. Thus, in the current information environment, rich with descriptions of unequal access to health care, unequal quality of care, and unequal health outcomes, individuals’ perceptions of the fairness of these inequalities may be (or become) relevant and salient contributors to American public opinion about health reform.
RESEARCH GOALS AND STUDY DESIGN
The present research draws on original survey research by Lynch (2007) to advance three specific goals: 1) To better understand the concepts and definitions Americans associate with fairness in the domain of health; 2) To evaluate how Americans perceive
7

8
the fairness of inequalities in health and health care; and, 3) To assess whether these fairness considerations influence Americans’ opinions about government health insurance expansions. The What’s Fair in Health Care survey (Lynch 2007), from which we draw our data, is a nationally representative, Internet-based survey that uses embedded vignettes to elicit Americans’ attitudes and opinions about inequalities, fairness, and health policy. Study respondents were asked to read a series of vignettes related to inequalities in health status, health care access, and health care quality. They were then asked to evaluate the fairness of the inequalities, to state their opinions on health care reform proposals, and to identify a definition of fairness that most closely matches their own opinions. (We describe the key measures in more detail below, with the complete text of the questions and vignettes appearing in Appendix A.) The survey exposed all respondents to information about health inequalities, making these inequalities more salient or accessible to respondents than they would otherwise be within the current information environment.2 If we are correct in hypothesizing that considerations of fairness are activated by content about inequalities, the information about inequalities contained in the survey will have primed respondents to consider their beliefs about fairness when articulating their health policy preferences (Iyengar and Kinder 1987). Thus, we expect the survey data to illuminate the impact of fairness considerations on policy opinions in a way that is analogous to what we would observe if health policy makers framed the problem of health reform in terms that emphasize inequalities. We interpret and discuss our results with this overarching framing effect in mind.
Sample
The Knowledge Networks survey firm recruited a nationally representative sample of individuals who took the What’s Fair in Health Care survey between August 22 and September 13, 2007 (over two waves of data collection). The completion rate for this survey was 72.6% in Wave 1 and 79.7% in Wave 2, considerably higher than the average completion rate of 65% in Knowledge Networks surveys. Details about the sample and the cumulative response rate are presented in Appendix C.
All results in the analyses (except where otherwise indicated) use the survey weights calculated by Knowledge Networks to adjust the sample to be representative, in demographic terms, of the national U.S. population. However, the sample may not be representative of the national population in other respects that may be relevant to their health policy preferences, such as health insurance status or health status. We observe that 15.3% of the Knowledge Network respondents under age 65 were without health insurance (unweighted), which is comparable to the 16.5% of the U.S. population without 2 All surveys, of course, “frame” their topics for respondents by highlighting the salience of the
topic at hand.

9
insurance as reported in the 2007 National Health Interview Survey (NHIS 2007). The Knowledge Networks sample appears to be in poorer health than the national population, with 17.5% reporting poor or fair health, as opposed to 10% in the 2007 NHIS. However, other recent surveys of health policy opinions find rates of fair/poor self-assessed health that are similar to the Knowledge Networks sample (20% in 2006 and 16% in 2007) (McInturff et al. 2008). We are therefore confident in generalizing the results of this study to the U.S. population as a whole.
Measures
The main variable of interest for this study is a measure of public opinion about the fairness of inequalities. All respondents were exposed to three vignettes about inequalities in health outcomes (life expectancy), inequalities in health care access (health insurance), and inequalities in the health care quality received. Respondents were randomly assigned to vignettes that varied the particular social groups who were said to be affected by the inequality: men versus women, African Americans versus White, high school- versus college-educated Americans, or low-income versus higher-income groups. Because these experimental manipulations are not central to the analyses we present here, we control for the vignette exposure statistically unless otherwise stated. After reading the vignettes, all respondents were asked to what extent they perceived the difference (in life expectancy, in access to health insurance, and in receipt of high quality medical care) to be fair or unfair, measured on a Likert scale where 1=Very fair, 2=Somewhat fair, 3=Neither fair nor unfair, 4=Somewhat unfair, and 5=Very unfair. See Appendix A for the text of all vignettes.
Since fairness in general is a multidimensional and contested concept that is likely to be difficult to measure in a survey context; and since there is little empirical research into the public’s conceptions of fairness in health and health care;3 we also asked respondents several additional questions to clarify what they perceive fairness to mean. One item asked respondents to endorse one of six definitions of fairness in general – in other words, not specifically in the health domain. The response options were derived from the literature on fairness and on preliminary in-depth interview research conducted by one author. In another question, designed to distinguish Americans’ perceptions of health care from other social goods, respondents were asked whether they perceive access to a good-quality education, access to a well-paying job, or access to affordable health care as most important to a “good life.” Then, they were asked to rank whether their chosen good was important because it assures that everyone has an “equal chance to get ahead” (anchored as 1 on a scale) or assures “that everyone has a right to [the outcome of that social good] (anchored as 10 on a scale).” The full item text is reported in Appendix A.
3 Most of the extant empirical survey research on fairness beliefs is in the domain of earnings
inequality or, particularly in the U.S. context, affirmative action. See, e.g., Kinder and Sanders
1996, Kluegel and Smith 1986, Osberg and Smeeding 2006.

The main dependent variable in the analyses presented here is support for a government-sponsored universal insurance plan. We use this particular policy question because an expanded public role in health insurance is one of several policy tools that has been presented recently as a health reform option (Obama 2008), and because it matches a question asked regularly in the American National Election Studies. The question reads: “Some people feel there should be a government insurance plan that would cover all medical and hospital expenses for everyone. Others feel that medical expenses should be paid by individuals, and through private insurance plans. Where would you place yourself on this scale?” The response scale ranged from 1= ‘Individuals and private insurance’ to 7= ‘Government insurance plan.’ This item was asked at the end of the survey. The mean was 4.56 (95 percent confidence interval=4.43-4.68).
We also assess various sets of independent variables as predictors of opinions
about a governmental role in health insurance. These include self-interest-related variables, which we define as self-rated health (a five-point scale ranging from excellent to poor), recent history of uninsurance (being without any form of health coverage for one month or longer at any time in the past three years), respondent or a close family member having a serious medical condition, being economically insecure (defined as the respondent or main income earner having been unemployed during the past 3 years or having earnings at 200 to 300 percent of the federal poverty level, adjusted for household size), or being in poverty (an indicator variable representing size-adjusted household income at or below 200 percent of the federal poverty level). We expect that sick, uninsured, unemployed, or otherwise economically insecure respondents will support government payment of medical expenses for self-interested reasons.
Other independent variables included in the analyses include group interest or
symbolic politics variables, which we define following Sears et al. (1980) and Sniderman (1993) as encompassing political group identities and membership in a group affected by inequalities in health and health care. These variables include political party identification (a 7-point variable ranging from 1=Strong Democrat to 7=Strong Republican) and ideological identification (a 7-point variable ranging from 1=Very Liberal to 7=Very Conservative). We also construct a variable that indicates whether the respondent is a member of the disadvantaged group described in the inequality scenario to which he or she was exposed in the survey vignette (having below a high school education, being at or below 200 percent of the poverty level by household size, or being nonwhite).
Finally, we include measures of egalitarianism and humanitarianism. These fundamental values have been shown to influence public preferences on social policy matters (Feldman and Steenbergen 2001), and may be important predictors of fairness judgments (Rasinski 1987). The egalitarianism variable is constructed as the mean response to the 6-item egalitarianism battery from the American National Election Study, scaled 1-5 with higher values indicating more egalitarian views. In this sample, the scale has a Cronbach’s alpha of 0.80. The mean level of egalitarianism is 3.29 (SE=0.03). The humanitarianism scale is constructed from 4 items from Feldman and Steenbergen
10

11
(2001). Mean humanitarianism is 3.76 (SE=0.02), and the scale has a Cronbach’s alpha in this sample of .72.4 See Appendix A for the text of these items.
Analysis
In addition to calculating descriptive statistics (distributions on relevant variables), we conduct multivariate ordinary least squares (OLS) regression analysis using the survey functions in Stata 10.1, regressing opinions about private versus governmental health insurance on various covariates, with judgments of the fairness of inequalities as the key independent variable. We then simulate predicted levels of policy opinion under alternative scenarios of fairness judgments. To do so, we first calculate the predicted value (ŷ) of support for governmental provision of health insurance using the actual sample distribution of fairness evaluations. Then we estimate predicted support under a counterfactual condition. We begin by shifting everyone in the sample who actually evaluated health care inequalities as fair to evaluating these inequalities as neutral (neither fair nor unfair), holding all other respondents’ fairness judgments and all other variables in the model constant. We repeat this procedure for shifts from each level of fairness judgments in the model (fair to neutral, neutral to somewhat unfair, somewhat unfair to very unfair). Finally, using the Clarify program for Stata 10.1 (Tomz, Wittenberg & King 2003), we calculate the predicted value of policy support if all individuals were to evaluate health care inequalities as very unfair.
RESULTS What Does Fairness Mean?
Because of the difficulties inherent in measuring a concept as multidimensional as fairness, we begin with a validation check, asking respondents to endorse their chosen definition of fairness. Does the survey instrument at hand produce results consonant with known findings about American’s fairness beliefs?
Answers to an item asking respondents to endorse one of six potential definitions of fairness in general (not specifically in health or health care) provide confirmation that respondents in this survey understand fairness in much the way we would expect (see Table 1). The distribution of responses reveals plurality support for the notion of fairness as equal opportunity (everyone has equal chances, 38.0 percent), with the next most popular responses divided between defining fairness as everyone treated equally (18.5 percent) and everyone having a decent standard of living (18.0 percent).
[Table 1 about here]
However, this question elicited beliefs about fairness in general, and not in the domain of health in particular. Since equal opportunity is such an important component of many Americans’ definitions of fairness in other domains, and has also been 4 Respondents missing values on any one of the egalitarianism or humanitarianism scale items (3% of the sample) were dropped in the construction of these variables.

12
hypothesized to play a central role in theoretical conceptions of justice in health (see, e.g., Daniels 2008), we examine whether the relative importance accorded to opportunity versus outcomes is the same in the domain of health as it is in other policy areas.
Respondents who identified health care as most important to a good life (n=339) had a mean score on the 1-10 opportunity-outcomes scale of 7.97 (95 percent confidence interval=7.69-8.24), revealing that the importance they accorded to health care arises mainly out of concern about equal outcomes (“everyone has a right to be in decent health”). This contrasts with the stronger appeal to opportunity (“it assures equal chance to get ahead”) as a justification among those who identified education as most important (n=567, mean=4.98, CI 4.67-5.29) and among those who identified access to well-paying jobs as most important (n=423, mean=5.76, CI 5.48-6.03). These differences in the mean opportunity-outcome score between the three groups were robust to controls for socio-demographic, health status, and political and ideological characteristics associated with choosing health care, education, or income as the highest priority domain (results not shown). Those who placed a high priority on health care indicated that health care is not important mainly because it provides opportunities to get ahead in life, but because the outcome it affords—“to be in decent health”—is a right in itself.
Evaluations of the Fairness of Health and Health Care Inequalities
After reading vignettes about inequalities in life expectancy, access to health insurance, and receipt of quality health care, respondents ranked the fairness of these inequalities, on a scale of 1 (very fair) to 5 (very unfair). Table 2 summarizes the evaluations of fairness across the three types of inequalities. Overall, respondents judged inequalities in life expectancy to be less unfair than they judged inequalities in health care quality or access to be. The majority of study respondents (over 70 percent) perceived health care inequalities to be unfair, while only 30 percent perceived health status inequalities to be unfair. 5 We find that evaluations of the fairness of inequalities in life expectancy differed significantly across the vignette treatment groups, with respondents evaluating inequalities in life expectancy across groups defined by income as the most unfair (see Appendix B, Table A).6 However, we observed no significant differences across these vignette treatment groups in the fairness respondents attributed to health care inequalities.
[Table 2 about here]
5 The differences in fairness judgments between health care access and quality versus life expectancy inequalities may be a manifestation of a priming effect. Before asking respondents to judge the fairness of inequalities, the survey asked respondents to consider what they perceived to be the causes of the inequalities – but only following the vignette about life expectancy inequalities. As a result, respondents may have been primed to consider their attitudes about blame and fault when they evaluated the fairness of inequalities in life expectancy, but not when they evaluated the fairness of inequalities in health care, depressing their judgments of fairness. 6 In results not shown here, we find that the causes respondents’ adduced to explain inequalities (whether they perceived these inequalities to result from individuals’ behaviors, from prejudice, from failure of the health care system, failure of the economic system, or to bad luck or biology) accounted for much of the differences in fairness evaluations we observe across groups.

13
Perceptions of Fairness Strongly Influence Policy Preferences
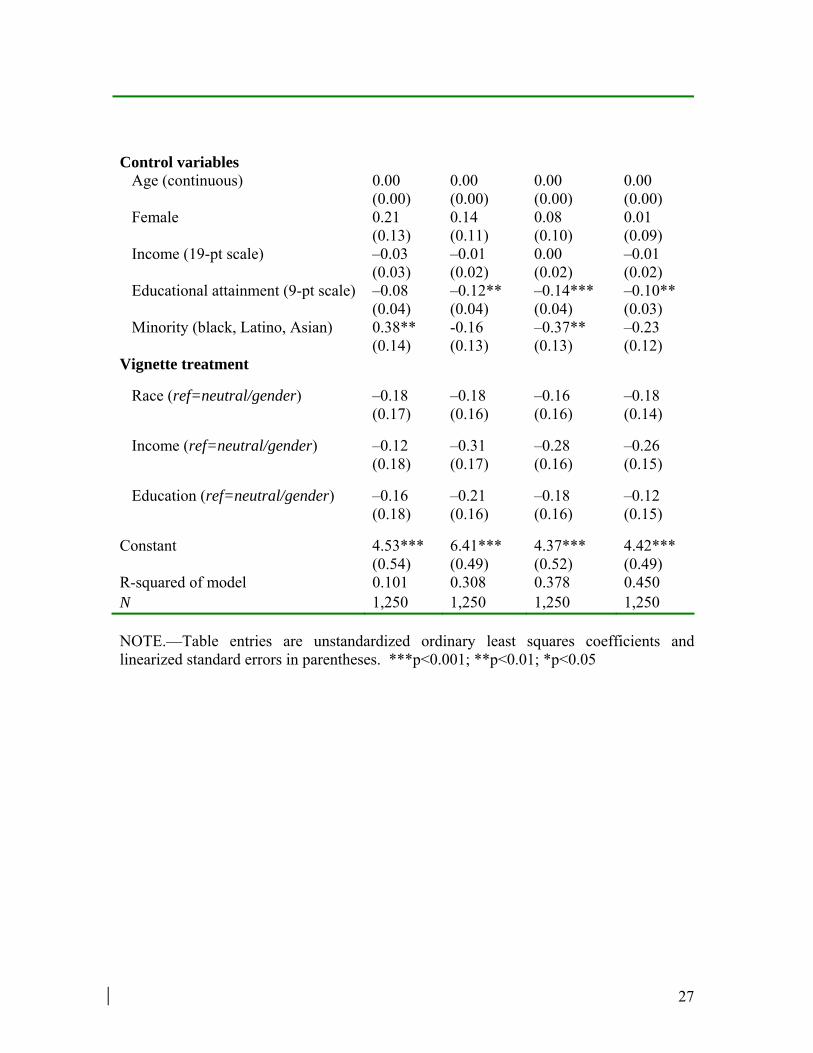
How do these perceptions of fairness influence the public’s preferences regarding health policy reform? The conventional wisdom outlined in the introduction to this paper holds that self-interest is the most important driver of the public’s opinions on government health insurance expansion. However, given the likely importance of fairness appraisals in policy opinion and the relevance of inequalities within health policy discourse, we expect fairness perceptions to play an important role as well. To explain the variation of public opinion regarding government provision of health insurance, we begin by regressing the policy opinion outcome upon “self-interest” variables (see Table 3, Model 1), using ordinary least squares regression. Each of the self-interest variables is coded so that higher values indicate having more self-interested reasons to support government health insurance, such as being sicker, economically insecure, or uninsured. All independent variables are re-scaled (where necessary) to run from 0 to 1. All models also include dummy variables for the specific version of the inequalities vignette that the respondent viewed (i.e., gender, race, income, or education), in order to control for any differences in opinions that might result from being exposed to content about inequalities among a particular social group. In addition, to control for the standard associations between demographic variables and policy opinions, we include variables for age, gender, educational attainment, income, and a single dummy variable indicating respondents of minority (Black, Latino or Asian) racial-ethnic background. [Table 3 about here] Table 3, Model 1, shows that self-interest variables plus demographic controls explain just ten percent of the variation in respondent preferences vis-a-vis government health insurance provision. Respondents in poorer health and those with a recent history of uninsurance or unemployment were significantly more likely to support government-provided health insurance. These findings buttress the claims of commentators who argue that support for health reform will come from those who are economically insecure (at least in terms of employment and insurance stability) and concerned about their health. However, contrary to expectations, we do not find a strong relationship between respondents’ economic status and their health policy opinions. We find no evidence that the working class often evoked in policy discussions (i.e., those with income levels in the range of 200 to 300 percent of the federal poverty level) are more supportive of government health insurance.7 Next, in Table 3, Model 2, we add group interest variables (political party identification, ideological identification, and disadvantaged group membership) to the model of health policy opinions. Adding these group variables to the model explains an additional twenty percent of the variation in policy preferences. Republicans and Conservatives are significantly more likely to prefer that individuals obtain insurance from the private market. 7 These SES findings are robust to removing the control for household income.

14
Next, we add a set of values variables (egalitarianism and humanitarianism) to the model (Table 3, Model 3). The addition of humanitarianism and egalitarianism explains a significant increment of the variation in policy preferences. After adjusting for all the covariates identified above, respondents with strong egalitarian values are significantly more likely to support government provision of health insurance. Lastly, we ask whether respondents’ perceptions of the fairness of health and health care inequalities influence their opinions toward government health insurance, net of other considerations (see Table 3, Model 4). Given the high correlation between fairness evaluations for health care quality and health care access (r=0.65), visible in their similar distributions in Table 2, we construct a single variable for health care fairness evaluations by taking the average of both items. (The correlation between this new health care fairness variable and the life expectancy fairness variable is 0.47.) We introduce a series of indicator variables representing fairness beliefs (separately for evaluations of health inequalities and health care inequalities) into the model above: variables indicating that these inequalities are “fair”, “somewhat unfair”, and “very unfair,” with “neither fair nor unfair” serving as the reference category.
Perceptions of fairness contribute significantly to preferences regarding the government’s role in health insurance provision, increasing the variation explained to 45.0 percent. Compared to those who perceive inequalities in health care as neither fair nor unfair, respondents who perceive health care inequalities as somewhat unfair were more supportive of government provision of health insurance by 0.63 units on the seven-point policy scale, while those who perceive health care inequalities as very unfair were more supportive of government provision of health insurance by 1.43 units—even after controlling for other sources of policy opinions. In contrast, beliefs about the fairness of inequalities in life expectancy were not significantly associated with policy opinions (perhaps because the policy outcome under consideration concerned health care, and not a policy strategy directly related to increasing longevity). The effect on policy preferences of believing health care inequalities are very unfair (relative to neither fair nor unfair) was significantly larger in magnitude (p<.05, from Wald tests of parameters) than the effect of lacking health insurance or having a history of unemployment. In sum, even after controlling for other important predictors, we find that fairness beliefs have a statistically significant and substantively large effect on health policy preferences.8 Moreover, the additional variation in health policy preferences explained by fairness evaluations suggests that considerations of the fairness of specific health care inequalities are distinct from more stable characteristics of individuals such as their values or political orientations.9
8 We also estimated models in which fairness evaluations were interacted with the group treatment, and found no evidence that the group treatment affected the impact of fairness evaluations on policy opinions. 9 Multicollinearity does not appear to be a problem in the model. Variance inflation factors for the full model shown in Table 3, column 4 range from 1.0 to 3.78, offering no evidence that fairness evaluations are collinear with any other predictors in the model.

Finally, to assess what the potential influence on policy opinions might be if
people were to change their existing fairness beliefs, we estimated models simulating support for governmental provision of health insurance under alternative scenarios in the sample’s distribution of fairness beliefs. Figure 1 illustrates the increases in support for governmental provision of health insurance, relative to the current distribution of fairness beliefs, that would result from shifting respondents from one level of fairness evaluations to another, holding all other variables constant. These simulations indicate the aggregate level of support for governmental provision of health insurance that would be predicted, if, for instance (shown in the second bar), all people who had judged health care inequalities to be fair were to judge them as neither fair nor unfair, with no other changes in those individuals’ characteristics or any changes in any others’ fairness beliefs. The last bar of Figure 1 shows the predicted level of support for governmental provision of health insurance if everyone were to perceive these inequalities as very unfair. Our results indicate that if all Americans were to perceive health care inequalities as one increment more unfair than they currently do (so those who currently think health care inequalities are fair were to come to see these inequalities as neither fair nor unfair, those who think health care inequalities are neither fair nor unfair would come to see them as somewhat unfair, and those who currently perceive them as unfair would come to see them as very unfair), aggregate support for government provision of health insurance would increase from 4.54 to 4.93 on the seven-point scale, an increase of 8.6 percent over current levels, ceteris paribus. If all people were to consider health care inequalities as “very unfair”, that change in fairness evaluations would produce a 13.4 percent increase in support for government health insurance (equivalent to a move from 4.54 to 5.15 on the scale of support for government involvement in health insurance). [Figure 1 about here]
DISCUSSION
Health care reform is back on the political agenda, a result of its high profile during the 2008 presidential campaign and of Americans’ increasing dissatisfaction with the health care system (Blendon et al. 2008a). Experience suggests that public support for health care reform is likely to be a critical aspect of the unfolding political process (Koch 1998). In this paper, we argue that Americans’ opinions regarding an expanded governmental role in health care are strongly influenced by their beliefs about the fairness of existing health care inequalities.
Using unique survey data representative of all Americans, we assess how
Americans understand fairness in the context of health and health care. While we find that a plurality of Americans endorse a definition of fairness in general that evokes equal opportunities, Americans perceive health care as an important social good different from education or access to jobs. They view health care equity as important because everyone has a right to decent health, not just because health confers equal opportunities to get ahead in life. This finding conflicts with the central emphasis ethicist Norman Daniels and his co-authors have placed on health equity as a guarantor of opportunities (Daniels 1985; Daniels, Light and Caplan 1996; Daniels, Kennedy and Kawachi 2000; Daniels
15

2005; Daniels 2008). It also signals that beliefs about fairness in the domain of health are likely to be somewhat distinct from beliefs about inequality in other domains.
Our analysis of perceptions of the fairness of inequalities in health and health care
indicates that more Americans perceive inequalities in health care than in life expectancy to be unfair. (Moreover, as we show in Appendix B, Americans perceive some inequalities in life expectancy to be more unfair than others). Overall, however, we find that a majority of Americans believe that inequalities in health care access and health care quality are fundamentally unfair, regardless of the social group affected by these inequalities.
Furthermore, these perceptions of the unfairness of health care inequalities
strongly influence opinions about the appropriate role for government versus individuals or private markets in health insurance provision—even after controlling for the effects of “the usual suspects” that predict policy opinions. These results suggest that Americans’ predisposing attitudes about fairness, and not just their self-interest, could be harnessed in a political effort to mobilize support for reform of the current health insurance system. This finding supports Gamson’s (1992) contention that emphasizing injustice in the framing of social problems is an important precondition for popular mobilization around policy change. Fairness beliefs may be particularly important when the policies in question require sacrificing individual self-interest in order to achieve either a more equitable distribution of resources or a long-term goal like addressing climate change (see e.g. McCormick 2009).
To be sure, Americans without health insurance and Americans who are ill
represent important elements of any coalition in support of insurance expansions. Moreover, Americans with a history of unemployment, even adjusting for a history of lacking health insurance, tend to be more supportive of an expanded government role in health insurance. Yet, in contrast to the conventional wisdom posing economic self-interest as the most critical single lever on which to push to generate support for reform, we find that considerations of fairness in fact have a greater potential impact on policy opinions than do individuals’ economic interests.
Study Limitations and Future Research
The results of this study are conditioned by the fact that survey respondents were exposed to more information about health inequalities than they would likely encounter in everyday discourse. The survey, then, was an intensive information environment in which inequalities were framed as salient to respondents – an environment, that is, analogous to the one that they would confront if political actors, other elites, and the media focused sustained attention on health inequalities. Respondents’ evaluations of the policy items likely incorporated those fairness considerations that were suggested by the dominant frame to which they were exposed, precisely as the literature on framing
16
17
suggests (Chong and Druckman 2007a; Iyengar and Kinder 1987; Valentino et al. 2002).10
There is potential for an endogeneity bias in our analysis. That is, respondents’
health care policy opinions might influence their opinions about the fairness of health care inequalities, instead of (or in addition to) the other way around. For example, a respondent’s belief that government should be responsible for providing health care insurance might cause her to conclude that any inequality in access to health insurance would be unfair -- whereas holding the opposite belief, that the private sector is responsible for providing care, might cause her to be more permissive of inequalities. We cannot entirely rule out this possibility in a cross-sectional analysis. However, the timing of responses to the health policy item with respect to both the rest of the survey questions and the development of health policy debates in public discourse helps reduce concerns about endogeneity. The health policy item appeared at the very end of a long survey, after respondents had already been asked to evaluate the fairness of a number of different types of inequalities. Moreover, given the timing of this survey (late summer 2007), before the 2008 presidential race had begun in earnest and health care reform was not (yet) a major issue on the public agenda, it is unlikely that respondents were considering their opinions about health care reform when they responded to items about the fairness of inequalities.
A final potential limitation of the study is that, while we assess the differential impact of beliefs about fairness and self-interest on policy opinions, the study was not designed to evaluate how the public responds in a competitive framing situation (see, e.g., Chong and Druckman 2007b) in which the public is exposed to simultaneous and competing messages about the fairness of inequalities and about protecting individual interests. Within the survey, we observe the results of a one-sided debate, in which inequalities were framed as salient for all respondents, and no respondents received a “non-framed” treatment. Measurement of public opinion over multiple time points in the course of a policy debate would be better suited to evaluating the impact of emergent, competing frames on public opinion. Alternatively, an experimental design that exposed study respondents randomly to either an inequalities frame or an economic frame (i.e., highlighting pocketbook concerns) could detect the influence of frames on public opinion and the interaction of these messages with the public’s predisposing values. Future research should capitalize upon the changing information environment with respect to health care reform to generate new theories about how politicians and other elites use various types of messages to mobilize the public to support policy change.
Implications for Policy
In a dynamic information environment, policy elites and advocates constantly
introduce new and competing concepts into public discourse. These novel frames influence members of the public differently, depending on, inter alia, the strength of the 10 We are agnostic on the psychological process that explains these effects; our study design cannot indicate whether the effects we observed resulted because considerations about fairness and inequalities became more available or accessible or otherwise influential to respondents.
18
frames and the public’s predisposing attitudes, prior values commitments, and political awareness (Chong and Druckman 2007a). In the United States in 2009, the dominant frame regarding the problems with the American health care system is still one that focuses on the costs of health care for the government, for employers, and for individuals. However, researchers, advocacy groups, politicians, and the media increasingly draw attention to health inequalities as one manifestation of the ills that beset our health care system. What is the likely political or policy effect of increasing attention to a variety of health inequalities?
Our results suggest that if the nascent inequalities frame were to become more
dominant, and in particular if it were to focus on inequalities that most people think are unfair, two things would likely happen. First, beliefs about fairness would likely become increasingly important determinants of health policy. Second, public support for a government role in providing health insurance could increase substantially. Major advocacy and research organizations in the U.S. (e.g., the Robert Wood Johnson Foundation, the Kaiser Family Foundation, Families USA, the Institute of Medicine, the U.S. Centers for Disease Control’s Office of Minority Health and Health Disparities) have devoted considerable resources to educating both the public and policy makers about health inequalities.11 If these efforts are successful, they could well lead to public mobilization in support of an expanded governmental role in health insurance.
However, drawing attention to inequalities -- particularly inequalities that disfavor
groups that are viewed by a majority of Americans as “undeserving” or otherwise responsible for their own ill fortune -- could have unintended consequences. Research on emotional responses to injustice and inequality, while still in its infancy (Goodwin and Jasper 2006), suggests that exposure to unfair situations may sometimes depress, rather than mobilize, social action. Furthermore, attention to inequalities that are not uniformly perceived as unfair may undercut support for government action to remediate even those inequalities that the public finds troublesome. Gilens cites just such a pattern of declining support for poverty alleviation programs in the United States following increasing media attention to poverty among African Americans (Gilens 1999). Researchers interested in understanding how perceptions of health inequalities affect policy support should attend to how these inequalities are framed. They should also attend to non-linear relationships between the amount of attention to health inequalities and policy support among particular demographic or political subgroups (see e.g. Gollust, Lantz, and Ubel 2009), which could signal that the inequalities frame in use is triggering a political backlash. Policy advocates, for their part, would be well advised to consider just how much attention to health inequalities, and what kind, will best serve their goals.
11 These efforts are ongoing at the international level as well. See especially the World Health Organization Commission on Social Determinants (Marmot and Bell 2009),

REFERENCES Barabas, Jason. 2009. Not the Next IRA: How Health Savings Accounts Shape Public
Opinion. Journal of Health Politics, Policy and Law 34:181-217. Bernstein, Jill, and Rosemary A. Stevens. 1999. Public Opinion, Knowledge, and
Medicare Reform. Health Affairs 18:180-93. Blendon, Robert J., Drew E. Altman, John M. Benson, Mollyann Brodie, Tami Buhr,
Claudia Deane, and Sasha Buscho. 2008a. Voters and Health Reform in the 2008 Presidential Election. New England Journal of Medicine 359:2050-61.
Blendon, Robert J., Drew E. Altman, Claudia Deane, John M. Benson, Mollyann Brodie,
and Tami Buhr. 2008b. Health Care in the 2008 Presidential Primaries. New England Journal of Medicine 358:414-22.
Bobo, Lawrence and Vincent L. Hutchings. 1996. Perception of Racial Group
Competition: Extending Blumer’s Theory of Group Position to Multiracial Social Context. American Sociological Review 37:951-72.
Braveman, Paula. 2006. Health Disparities and Health Equity: Concepts and
Measurement. Annual Review of Public Health 27:167-94. Brook, Lindsay, Ian Preston, and John Hall. 1998. What Drives Support for Higher
Public Spending? In Choice and Public Policy, ed. P. Taylor-Gooby. Basingstoke: Macmillan.
Callegaro, Mario and Charles DiSogra. 2008. Computing Response Metrics for Online
Panels. Public Opinion Quarterly 72:1008-1032. Campbell, Andrea L. and Kimberly Morgan. 2009. "Policy Feedbacks and the Medicare
Modernization Act of 2003: The Political Ramifications of Policy Change." Unpublished paper, Massachusetts Institute of Technology. Available at. http://web.mit.edu/polisci/research/Campbell/Policy%20Feedbacks%20and%20MMA.pdf (accessed May 26, 2009).
Chong, Dennis, and James N. Druckman. 2007a. Framing Theory. Annual Review of
Political Science 10:103-26. Chong, Dennis, and James N. Druckman. 2007b. A Theory of Framing and Opinion
Formation in Competitive Elite Environments. Journal of Communication 57:99-118.
Cnaan, Ram A., Yeheskel Hasenfeld, Avital Cnaan, and Jane Rafferty. 1993. Cross-
Cultural Comparison of Attitudes Toward Welfare State Programs: Path Analysis with Log-Linear Models. Social Indicators Research 29:123-52.
19

Commission to Build a Healthier America. 2009. Beyond Health Care: New Directions to a Healthier America. Recommendations from the Robert Wood Johnson Foundation Commission to Build a Healthier America. Final report released April 2, 2009.
Corneo, Giacomo, and Hans P. Gruner. 2002. Individual Preferences for Political
Redistribution. Journal of Public Economics 83:83-107. d'Anjou, Leo, Abram Steijn, and Dries Van Aarsen. 1995. Social Position, Ideology and
Distributive Justice. Social Justice Research 8:351-84. Daniels, Norman. 1985. Just Health Care. Cambridge: Cambridge University Press. Daniels, Norman. 2008. Just Health. Cambridge: Cambridge University Press. Daniels, Norman, Bruce Kennedy, Ichiro Kawachi. 2000. Is Inequality Bad For Our
Health? Boston: Beacon Press. Daniels, Norman, Donald Light and Ronald Caplan. 1996. Benchmarks of Fairness for
Health Care Reform. New York: Oxford University Press. Feldman, Stanley and Marco R. Steenbergen. 2001. The Humanitarian Foundation of
Public Support for Social Welfare. American Journal of Political Science. 45:658-77.
Fong, Christina. 2001. Social Preferences, Self-Interest, and the Demand for
Redistribution. Journal of Public Economics 82:225-46. Fleurbaey, Marc and Erik Schokkaert. 2009. Unfair Inequalities in Health and Health
Care. Journal of Health Economics 28:73-90. Gamson, William A. 1992. Talking Politics. Cambridge: Cambridge University Press. Gilens, Martin. 1999. Why Americans Hate Welfare: Race, Media, and the Politics of
Antipoverty Policy. Chicago: University of Chicago Press. Goldsteen, Raymond L., Karen Goldsteen, James H. Swan, and Wendy Clemena. 2001.
Harry and Louise and Health Care Reform: Romancing Public Opinion. Journal of Health Politics, Policy, and Law 26:1325-52.
Gollust, Sarah E., Paula M. Lantz, and Peter A. Ubel. 2009. The Polarizing Effect of
News Media Messages about the Social Determinants of Health. In press at The American Journal of Public Health.
Goodwin, J., and J.M Jasper. 2006. Emotions and Social Movements. In Handbook of the
Sociology of Emotions, ed. J. E. Stets and J. H. Turner. New York: Springer. Hochschild, Jennifer L. 1981. What's Fair? American Beliefs about Distributive Justice.
Cambridge, MA: Harvard University Press.
20

Iyengar, Shanto, and Donald R. Kinder. 1987. News That Matters. Chicago: University of
Chicago Press. Jacobs, Lawrence R. 2001. Manipulators and Manipulation: Public Opinion in a
Representative Democracy. Journal of Health Politics, Policy, and Law 26:1361-74.
Kaplan, George A. 2004. What's Wrong with Social Epidemiology, and How Can We
Make It Better? Epidemiologic Reviews 26:124-35. Kinder, Donald R., and Lynn M. Sanders. 1996. Divided By Color: Racial Politics and
Democratic Ideals. Chicago: University of Chicago Press. Kluegel, James R., and Eliot R. Smith. 1986. Beliefs about Inequality: Americans' Views
of What Is and What Ought to Be. New York: Aldine de Gruyter. Koch, Jeffrey W. 1998. Political Rhetoric and Political Persuasion: The Changing
Structure of Citizens' Preferences on Health Insurance During Policy Debate. Public Opinion Quarterly 62:209-29.
Laugesen, Miriam. 2005. Why Some Market Reforms Lack Legitimacy in Health Care.
Journal of Health Politics, Policy, and Law 30:1065-100. Lipset, Seymour M. 1990. Continental Divide: The Values and Institutions of the United
States and Canada. New York: Routledge. Lynch, Julia. 2007. What’s Fair in Health Care. Survey conducted by Knowledge
Networks for the University of Pennsylvania, August-September 2007. Marmot, M. G., and R. Bell. 2009. Action on Health Disparities in the United States:
Commission on Social Determinants of Health. JAMA 301 (11):1169-71. Markus, Gregory B. 2001. American Individualism Reconsidered. In Citizens and
Politics, ed. James H. Kuklinski. Cambridge: Cambridge University Press. McCormick, Sabrina. 2009 [in press]. Hot or Not?: Obstacles to the Emergence of
Climate-Induced Illness Movements. In Social Movements and Health Care in the United States, ed. Mayer Zald, Jane Banaszak-Holl and Sandra Levitsky. Oxford: Oxford University Press.
McInturff, Bill, Elizabeth Harrington, Anna Greenberg, and David Walker. 2008.
Perceived Health Challenges in the United States. National Survey Results. Survey conducted for the Robert Wood Johnson Foundation’s Commission to Build a Healthier America by Public Opinion Strategies and Greenberg Quinlan Rosner, November 2007 and February 2008.
21

Nelson, Thomas E., and Donald R. Kinder. 1996. Issue Frames and Group-Centrism in
American Public Opinion. The Journal of Politics 58:1055-78. NHIS. 2008. Summary Health Statistics for the U.S. Population: National Health
Interview Survey, 2007. National Center for Health Statistics. Centers for Disease Control and Prevention. U.S. Department of Health and Human Services. Hyattsville, Maryland.
Obama, Barack. 2008. Affordable Health Care for all Americans: The Obama-Biden
Plan. Journal of the American Medical Association 300:1927-8. Osberg, Lars and Timothy Smeeding. 2006. Fair Inequality? Attitudes toward Pay
Differentials: The United States in Comparative Perspective. American Sociological Review 7:450–473.
Rasinski, Kenneth A. 1987. What’s Fair Is Fair - or Is It? Value Differences Underlying
Public Views About Social Justice. Journal of Personality and Social Psychology 53 (1):201-11.
Rasinski, Kenneth A., and Tom R. Tyler. 1986. Social Psychology and Political
Behavior. In Political Behavior Annual, ed. S. Long. Boulder, CO: Westview Press.
———. 1988. Fairness and Vote Choice in the 1984 Presidential-Election. American
Politics Quarterly 16:5-24. Rokeach, Milton. 1968. Role of Values in Public Opinion Research. Public Opinion
Quarterly 32:547-59. Ruger, Jennifer P. 2008a. Ethics in American Health 1: Ethical Approaches to Health
Policy. American Journal of Public Health 98:1751-6. Ruger, Jennifer P. 2008b. Ethics in American Health 2: An Ethical Framework for Health
System Reform. American Journal of Public Health 98:1756-63. Sack, Kevin. 2008. Necessary Medicine? The New York Times, December 14. Schlesinger, Mark. 2002. On Values and Democratic Policy Making: The Deceptively
Fragile Consensus Around Market-oriented Medical Care. Journal of Health Politics, Policy and Law 27:889-925.
Schneider, Anne, and Helen Ingram. 1993. Social Construction of Target Populations:
Implications for Politics and Policy. The American Political Science Review 87:334-47.
22

Sears, David O., Richard R. Lau, Tom R. Tyler, and Harris M. Allen. 1980. Self-interest Versus Symbolic Politics in Policy Attitudes and Presidential Voting. American Political Science Review 74:670-84.
Smedley, Brian D., Arienne Y. Stith, and Alan R. Nelson, eds. 2003. Unequal Treatment: Confronting Racial and Ethnic Disparities in Health Care. Washington: National Academies Press.
Sniderman, Paul M. 1993. The New Look in Public Opinion Research. In The State of the
Discipline II, ed. A. Finifter. Washington, D.C.: American Political Science Association.
Taylor-Clark, Kalahn A., Felicia E. Mebane, Gillian K. Steelfisher, and Robert J.
Blendon. 2007. News of Disparity: Content Analysis of News Coverage of African American Healthcare Inequalities in the USA, 1994-2004. Social Science and Medicine 65:405-17.
Tetlock, Philip E. 1986. A Value Pluralism Model of Ideological Reasoning. Journal of
Personality and Social Psychology 50:819-27. Tocqueville, Alexis de. 1963. Democracy in America. Vol. 1. New York: Alfred A.
Knoft. Tomz, Michael, Jason Wittenberg, and Gary King. 2003. CLARIFY: Software for
Interpreting and Presenting Statistical Results. Version 2.1. Stanford University, University of Wisconsin, and Harvard University. Available at http://gking.harvard.edu/
Valentino, Nicholas A., Vincent L. Hutchings, and Ismail K. White. 2002. Cues that
Matter: How Political Ads Prime Racial Attitudes During Campaigns. American Political Science Review 96:75-90.
Verba, Sidney, and Gary R. Orren. 1985. Equality in America: The View from the Top.
Cambridge: Harvard University Press. Walzer, Michael. 1983. Spheres of Justice: A Defense of Pluralism and Equality. New
York: Basic Books. Whitehead, Margaret. 1992. The Concepts and Principles of Equity and Health.
International Journal of Health Services 22:429-45. Winter, Nicholas J. G. 2005. Framing Gender: Political Rhetoric, Gender Schemas, and
Public Opinion on U.S. Health Care Reform. Politics and Gender 1:453-80.
23
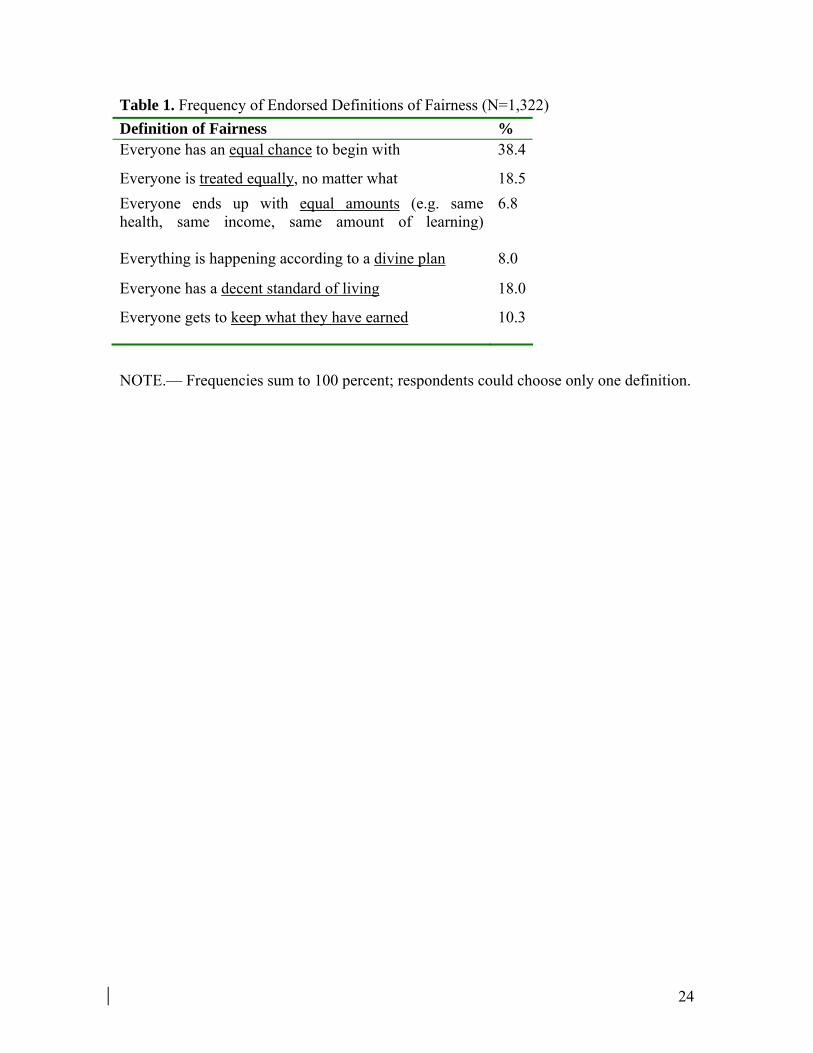
Table 1. Frequency of Endorsed Definitions of Fairness (N=1,322)
Definition of Fairness % Everyone has an equal chance to begin with 38.4
Everyone is treated equally, no matter what 18.5Everyone ends up with equal amounts (e.g. same health, same income, same amount of learning)
6.8
Everything is happening according to a divine plan 8.0
Everyone has a decent standard of living 18.0
Everyone gets to keep what they have earned 10.3
NOTE.— Frequencies sum to 100 percent; respondents could choose only one definition.
24

Table 2. Perceived Fairness of Inequalities in Health and Health Care Inequalities in
Life Expectancya Inequalities in Quality of Care
Inequalities in Access to Health Care
% % % Very fair (1) 2.8 2.8 2.8 Somewhat fair (2) 5.3 3.1 2.2 Neither fair nor unfair (3) 60.7 22.5 23.7 Somewhat unfair (4) 17.6 30.3 33.2 Very unfair (5) 13.6 41.3 38.1 Mean evaluation on 5-point scale (95% CI)
3.34 (3.28-3.40)
4.04 (3.97-4.11)
4.01 (3.94-4.08)
NOTE.—aThere were significant (p<0.05) differences in the perceived fairness of inequalities in life expectancy, depending on which social group (gender, race, income, or education) the inequality concerned. See Appendix Table A. There were no significant (p<0.05) differences in the perceived fairness of health care inequalities depending on which social group (neutral, or by race, income, or education) the inequality concerned.
25

Table 3. Support for Government Provision of Health Insurance Model 1:
Self-interest
Model 2:Symbolic politics
Model 3: Values
Model 4: Fairness
Self-interest variables Self-rated health (scaled 0-1, where 1=poor)
1.06*** (0.29)
0.82** (0.24)
0.63** (0.23)
0.43* (0.21)
Uninsured in last 3 yrs 0.39* (0.15)
0.30* (0.14)
0.33* (0.14)
0.24 (0.13)
Serious medical condition 0.23 (0.14)
0.20 (0.12)
0.17 (0.11)
0.10 (0.10)
Unemployed in last 3 yrs 0.45** (0.16)
0.25 (0.14)
0.26 (0.14)
0.24 (0.12)
Income 2-3x fed. poverty level (working class)
0.02 (0.21)
0.08 (0.18)
0.07 (0.17)
0.01 (0.15)
Income ≤2x fed. poverty level (poor)
0.00 (0.24)
0.06 (0.21)
–0.04 (0.20)
0.02 (0.19)
Group interest variables Member of disadvantaged group viewed in vignette
0.30† (0.16)
0.31* (0.15)
0.20 (0.14)
Party ID (scaled 0-1, where 1=Strong Rep)
–1.43*** (0.18)
–0.98*** (0.17)
–0.81*** (0.16)
Ideological ID (scaled 0-1, where 1=Very Cons)
–2.06*** (0.26)
–1.48*** (0.26)
–1.17*** (0.25)
Values Egalitarian (scaled 0-1, where 1=most egalitarian)
2.68*** (0.34)
1.64*** (0.36)
Humanitarian (scaled 0-1, where 1=most humanitarian)
0.26 (0.36)
–0.25 (0.35)
Fairness of inequalities Life expectancy inequalities are fair (ref=neither fair nor unfair)
–0.03 (0.22)
Life expectancy inequalities are somewhat unfair (ref=neither)
–0.04 (0.12)
Life expectancy inequalities are very unfair (ref=neither)
0.20 (0.17)
Health care inequalities are fair (ref=neither fair nor unfair)
0.01 (0.27)
Health care inequalities are somewhat unfair (ref=neither)
0.63*** (0.15)
Health care inequalities are very unfair (ref=neither)
1.43*** (0.17)
26
Control variables
Age (continuous) 0.00 (0.00)
0.00 (0.00)
0.00 (0.00)
0.00 (0.00)
Female 0.21 (0.13)
0.14 (0.11)
0.08 (0.10)
0.01 (0.09)
Income (19-pt scale) –0.03 (0.03)
–0.01 (0.02)
0.00 (0.02)
–0.01 (0.02)
Educational attainment (9-pt scale) –0.08 (0.04)
–0.12** (0.04)
–0.14*** (0.04)
–0.10** (0.03)
Minority (black, Latino, Asian) 0.38** (0.14)
-0.16 (0.13)
–0.37** (0.13)
–0.23 (0.12)
Vignette treatment
Race (ref=neutral/gender) –0.18 (0.17)
–0.18 (0.16)
–0.16 (0.16)
–0.18 (0.14)
Income (ref=neutral/gender) –0.12 (0.18)
–0.31 (0.17)
–0.28 (0.16)
–0.26 (0.15)
Education (ref=neutral/gender) –0.16 (0.18)
–0.21 (0.16)
–0.18 (0.16)
–0.12 (0.15)
Constant 4.53*** (0.54)
6.41*** (0.49)
4.37*** (0.52)
4.42*** (0.49)
R-squared of model 0.101 0.308 0.378 0.450 N 1,250 1,250 1,250 1,250 NOTE.—Table entries are unstandardized ordinary least squares coefficients and linearized standard errors in parentheses. ***p<0.001; **p<0.01; *p<0.05
27

Figure 1. Changes in the Distribution of Fairness Beliefs Increase Aggregate Support for Government Provision of Health Insurance
NOTE. Predicted support is generated by estimating predicted values from the model in Table 3, Column 4, simulating incremental changes in the sample distribution of fairness beliefs.
28

Appendix A: Detailed Survey Questions and Measures Definitions of Fairness in General People may have different beliefs about what fairness means. Which of the following comes closest to what YOU mean when you say that something is fair? It may be difficult to choose only one, but please try. 1= Everyone has an equal chance to begin with 2= Everyone is treated equally, no matter what 3= Everyone ends up with equal amounts (e.g. same health, same income, same amount of learning) 4= Everything is happening according to a divine plan 5= Everyone has a decent standard of living 6= Everyone gets to keep what they have earned [response options rotated] Opportunity versus Outcomes Which of the following would you say people need most in order to have a good life? 1= Access to a good-quality education 2= Access to a well-paying job 3= Access to affordable health care Some people think that having [R’S MOST IMPORTANT: access to a good-quality education/access to a well-paying job/access to affordable health care] is mainly important because it assures that each person in society has an equal chance to get ahead in life. Other people think that having [R’S MOST IMPORTANT] is mainly important because in a good society everyone has a right to [be decently educated/have a decent income/be in decent health]. Other people’s opinions lie somewhere in between. Where would you place yourself on this scale: Having [R’S MOST IMPORTANT] is mainly important because… [1] it assures equal chance to get ahead to [10] everyone has a right to [be decently educated/have a decent income/be in decent health]
29

Fairness of Inequalities in Health Outcomes: Life Expectancy Vignettes Four different versions of the vignette (gender, race, income, and education) were randomly assigned to respondents. The bracketed text indicates the differences in the vignette wording across the four treatments. “As you might know, the average number of years people can expect to live is different among different groups in society. For example, there is a five-year gap in the life expectancy of [American women versus American men/ white Americans versus African-Americans/wealthy versus low-income Americans/Americans who have attended college versus those with less than a high school education]: on average, [American men /African-Americans/low-income Americans/Americans with less education] live five years less.” Would you say that this difference in life expectancy is: 1= Very fair 2= Somewhat fair 3= Neither fair nor unfair 4= Somewhat unfair 5= Very unfair For the health care access and quality vignettes below, respondents were assigned to the same group treatment as in the life expectancy vignette. The exception is that those previously assigned to the gender vignette instead viewed a null condition for health care access and quality. Fairness of Inequalities in Health Care: Access to Insurance Coverage Vignettes “About 45 million people in the United States do not have health insurance.” This sentence was followed by the following additional content, depending on the vignette. [Null condition]: Above passage, with no additional wording. [Race condition]: “A higher percentage of whites than African-Americans have insurance.” [Income condition]: “A higher percentage of middle-income than low-income Americans have insurance.” [Education condition]: “A higher percentage of college graduates than high school graduates have insurance.”
30

Would you say that the fact that some Americans do not have health insurance is: 1= Very fair 2= Somewhat fair 3= Neither fair nor unfair 4= Somewhat unfair 5= Very unfair Fairness of Inequalities in Health Care: Quality of Care Vignettes “The following information is from the web site of the federal government’s Agency for Healthcare Research and Quality: Many Americans receive excellent health care. But researchers have begun to take note of problems with the quality of health care that some Americans receive. Each year, almost 20,000 people in the United States die unnecessarily because they do not receive needed medical treatments. A recent study of heart attack sufferers found that beta blockers, inexpensive drugs that can dramatically increase the chance of surviving a heart attack, were given to only one in five patients who could have benefited from them. Last year over 7,000 deaths were attributed to medication errors.” This passage was followed by the following additional content, depending on the vignette. [Null treatment: no additional text] [Race, income, education treatments: additional paragraph below, with text as indicated in square brackets] “Although quality problems affect all groups in society, they are particularly severe among [no additional text/ethnic and racial minorities/those with low incomes/ those with low levels of education]. For example, researchers found that life-saving ‘clot buster’ drugs for heart-attack patients were underused for all groups, but [African-American patients/low-income patients/patients with lower levels of education] were less likely than [whites/higher-income patients/better-educated patients] to receive this treatment.” Would you say that the fact that some Americans do not get high quality medical care is: 1= Very fair 2= Somewhat fair 3= Neither fair nor unfair 4= Somewhat unfair 5= Very unfair
31

Self-interest Variables Self-assessed health In general, would you say your physical health is… 1= Excellent 2= Very good 3=Good 4=Fair 5=Poor History of uninsurance Even if you now have health insurance, have you been without any form of health coverage for one month or longer at any time in the past three years? 1=Yes 2=No Serious medical condition Yes to one or both of the following: Please think now about not only yourself, but anyone you might have been caring for: a spouse/partner, parent or child. Have you or any of these people had a medical problem requiring an overnight stay in the hospital at any time during the last three years? 1=Yes 2=No What about a medical problem requiring more than one visit to a medical specialist? 1=Yes 2=No Poverty Household income less than or equal to 200% of 2008 federal poverty level for a household of the same size as that of the respondent. Unemployed Yes to one or both of the following: Has the main income earner living in your household been unemployed (this means without work and looking for a new job) for one month or longer at any time during the past three years? 1=Yes 2=No
32

Have you been unemployed (this means without work and looking for a new job) for one month or longer at any time during the past three years? 1=Yes 2=No Working class Household income between 200-300% of 2008 federal poverty level for a household of the same size as that of the respondent. Group Interest Variables Party identification Standard partisanship questions resulting in 7-point scale, rescaled to 0-1: 1=Strong Democrat 2=Democrat 3=Independent leans Democrat 4=Independent 5=Independent leans Republican 6=Republican 7=Strong Republican Ideology Standard 7-point scale, rescaled to 0-1: In general, do you think of yourself as… 1=Extremely liberal 2=Liberal 3=Slightly liberal 4=Moderate, middle of the road 5=Slightly conservative 6=Conservative 7=Extremely conservative Values Egalitarianism Index constructed as mean of following six items, with scale reversed and converted to 0-1 scale: Please say how much you agree or disagree with each of the following statements:
1. Our society should do whatever is necessary to make sure that everyone has an equal opportunity to succeed.
2. We have gone too far in pushing equal rights in this country. [Item reversed] 3. One of the big problems in this country is that we don’t give everyone an
equal chance.
33
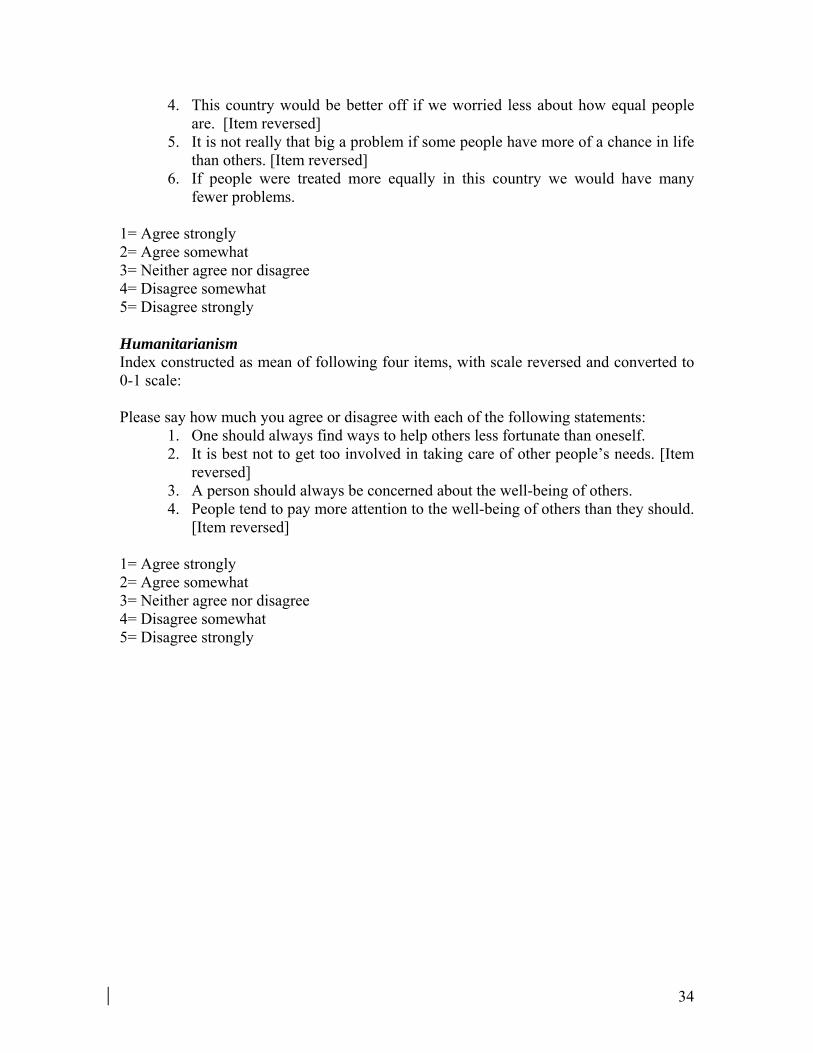
4. This country would be better off if we worried less about how equal people are. [Item reversed]
5. It is not really that big a problem if some people have more of a chance in life than others. [Item reversed]
6. If people were treated more equally in this country we would have many fewer problems.
1= Agree strongly 2= Agree somewhat 3= Neither agree nor disagree 4= Disagree somewhat 5= Disagree strongly Humanitarianism Index constructed as mean of following four items, with scale reversed and converted to 0-1 scale: Please say how much you agree or disagree with each of the following statements:
1. One should always find ways to help others less fortunate than oneself. 2. It is best not to get too involved in taking care of other people’s needs. [Item
reversed] 3. A person should always be concerned about the well-being of others. 4. People tend to pay more attention to the well-being of others than they should.
[Item reversed] 1= Agree strongly 2= Agree somewhat 3= Neither agree nor disagree 4= Disagree somewhat 5= Disagree strongly
34

Appendix B Table A. Perceived Fairness of Inequalities in Life Expectancy Differs by Social Group
to Which Respondents Were Exposed
Type of Inequality Men vs.
women (N=329)
Blacks vs. whites (N=330)
High income vs. low income (N=327)
College education vs. less than high school (N=333)
% % % % Very fair (1) 3.7 3.8 1.3 2.4 Somewhat fair (2) 4.9 4.0 5.2 7.1 Neither fair nor unfair (3) 72.5 59.9 52.0 57.7 Somewhat unfair (4) 9.7 19.7 24.3 17.5 Very unfair (5) 9.2 12.7 17.2 15.4 Mean evaluation (SE) on 5-point scale
3.16 (0.06)
3.34* (.06 )
3.51*** (.06)
3.36* (.07)
NOTE.— ***p<0.001; *p<0.05. Compared to the gender condition, respondents ranked racial inequalities (p=0.036), income inequalities, (p<0.001) and education inequalities (p=0.021) as significantly more unfair (based on two-tailed tests in OLS regression of fairness evaluations on treatment group).
35

36

37
Appendix C – Sampling and response rate calculation Knowledge Networks recruits study participants into an online panel using list-assisted random digit dial on a sampling frame consisting of all US households with telephones. The panel is representative of the entire U.S. population, and because Knowledge Networks provides panel households with free hardware and internet access, is not limited to current Web users or computer owners. Panel participants complete a profile survey containing basic demographic information, and are then required as a term of their participation in the panel to complete a survey weekly. Participants in our survey were selected randomly from among active panel members, and sent an email notification letting them know that Wave 1 of our survey was available for them to take. An additional email reminder and a phone reminder were sent to selected panel members who did not initiate the survey within one week of receiving the initial notification. Respondents who completed Wave 1 of our survey were sent another email two weeks later informing them that Wave 2 was available for them to complete, with subsequent follow-ups for non-responders. It is possible to estimate non-response at various stages of this process, which would not be the case if Knowledge Networks used an opt-in panel design. However, it is not possible to compute AAPOR-standard response rates for surveys conducted using online panels. A “cumulative response rate” that takes into account all sources of non-response, from initial household recruitment into the panel to eventual non-completion of the survey in question, can be constructed. This cumulative response rate is not equivalent to response rates reported for opt-in surveys (Callegaro and DiSogra 2008). Knowledge Networks has provided us with the following quantities, further details of which are available in Callegaro and DiSogra (2008): Recruitment Rate (AAPOR RR3): 31.4% Profile Rate (AAPOR RR6, for the basic profile survey): 57.2% Survey Completion Rate (AAPOR RR6, for the study survey): 72.6% The cumulative response rate that takes into account non-response and attrition at the stages of recruitment, retention, and survey completion, is thus .314*.572*.726 =.130