plastic response of fearful prey to the spatiotemporal ... · plastic response of fearful prey to...
TRANSCRIPT

Ecology, 96(10), 2015, pp. 2622–2631� 2015 by the Ecological Society of America
Plastic response of fearful prey to the spatiotemporal dynamicsof predator distribution
MATHIEU BASILLE,1,2,7 DANIEL FORTIN,1 CHRISTIAN DUSSAULT,3 GUILLAUME BASTILLE-ROUSSEAU,4,5
JEAN-PIERRE OUELLET,6 AND REHAUME COURTOIS3
1NSERC-University Laval Industrial Research Chair in Sylviculture and Wildlife, Biology Department, Laval University,1045 Avenue de la Medecine, pavillon Alexandre-Vachon, Quebec, Quebec G1V0A6 Canada
2University of Florida; Fort Lauderdale Research and Education Center, 3205 College Avenue, Fort Lauderdale, Florida 33314 USA3Ministere des Forets, de la Faune et des Parcs du Quebec, Direction de la faune terrestre et de l’avifaune, 880 chemin Sainte-Foy,
Quebec, Quebec G1X4X4 Canada4Environmental and Life Sciences, Trent University, Peterborough, Ontario K9J 7B8 Canada
5College of Environmental Science and Forestry, State University of New York, Syracuse, New York 13210 USA6Biology, Chemistry and Geography Department, and Centre d’etudes nordiques, Universite du Quebec a Rimouski,
300 Allee des Ursulines, Rimouski, Quebec G5L3A1 Canada
Abstract. Ecological theory predicts that the intensity of antipredator responses isdependent upon the spatiotemporal context of predation risk (the risk allocation hypothesis).However, most studies to date have been conducted over small spatial extents, and did notfully take into account gradual responses to predator proximity. We simultaneously collectedspatially explicit data on predator and prey to investigate acute responses of a threatenedforest ungulate, the boreal caribou (Rangifer tarandus), to the spatiotemporal dynamics ofwolf (Canis lupus) distribution during spring. Movement analysis of GPS-collared individualsfrom both species revealed high plasticity in habitat-selection decisions of caribou. Femalecaribou avoided open areas and deciduous forests and moved relatively fast and towardforaging areas when wolves were closer than 2.5 km. Caribou also avoided food-rich areasonly when wolves were within 1 km. Our results bridge the gap between long-term perceivedrisk and immediate flight responses by revealing dynamic antipredator tactics in response topredator proximity.
Key words: antipredator behavior; boreal woodland caribou; Canis lupus; Cote-Nord region, Quebec,Canada; gray wolf; movement; predation risk; predator–prey relationships; prey cognition; Rangifertarandus; risk effects; step selection functions.
INTRODUCTION
Predation has a profound impact on most ecosystems
(Getz 2011), from both the consumptive and noncon-
sumptive effects on prey populations (Luttbeg and
Kerby 2005, Trussell et al. 2006). There is increasing
evidence that large mammalian prey display specific
antipredator responses to predation risk, as exemplified
by the large body of studies involving gray wolves (Canis
lupus) and their ungulate prey during the past decade
(e.g., Fortin et al. 2005, Creel and Christianson 2009,
Beschta and Ripple 2011, Kuijper et al. 2013). At the
landscape scale, prey generally avoid areas where the
risk is perceived as systematically high, reflecting a
heterogeneous ‘‘landscape of fear’’ that can vary broadly
over space (Searle et al. 2008, Willems and Hill 2009,
Laundre 2010). The ‘‘risky places hypothesis’’ (Creel et
al. 2008) thus corresponds to chronic responses in space,
which do not take into account the immediate presence
of predators. Prey, however, also display acute responsesunder the threat of predators present in their immediate
surroundings, such as increased vigilance (Winnie and
Creel 2007, Middleton et al. 2013), as predicted by the
‘‘risky times hypothesis’’ (Creel et al. 2008). Altogether,
the presence of highly mobile predators leads to highly
dynamic spatial patterns of risk over space and time,
because risk further depends on the predators’ contem-poraneous locations with respect to their prey (Brown et
al. 1999, Ripple and Beschta 2004, Courbin et al. 2013).
The intensity of antipredator responses is thus expected
to be largely dependent upon the spatiotemporal context
of predation risk: the risk allocation hypothesis (Lima
and Bednekoff 1999, Creel et al. 2008) predicts that the
same level of threat, defined as the immediate risk of
predation (Weissburg et al. 2014), in areas with differentlevels of long-term risk, will induce different antipred-
ator responses. Natural selection could therefore favor
prey that react to this spatiotemporal heterogeneity in
risk through not only chronic but also acute responses
(Lima and Bednekoff 1999).
Acute responses, despite their foraging cost (Lima and
Dill 1990, Creel et al. 2014), may be adaptive, when prey
can gain accurate insights about the location of their
Manuscript received 5 September 2014; revised 2 February2015; accepted 27 March 2015. Corresponding Editor: M.Hebblewhite.
7 E-mail: [email protected]
2622
predator that allow them to successfully escape. Prey
usually exhibit routine vigilance as a low-cost option to
acquire indices of predator presence (Fortin et al. 2004,
Pays et al. 2007). As the intensity and number of direct
cues of predation risk increase, the behavioral response
escalates, with induced vigilance (Blanchard and Fritz
2007, Liley and Creel 2008, Periquet et al. 2012)
preceding a flight response (Stankowich and Blumstein
2005). How the increasing perception of risk in turn
affects habitat selection and the balance of the food/
safety trade-off has rarely been assessed, especially on
large mammalian species (Merrill et al. 2010). For
example, in a savannah ecosystem where visibility is vital
for prey, several African herbivores increase their use of
open grassland when lions (Panthera leo) are in their
vicinity (Valeix et al. 2009). In the Greater Yellowstone
Ecosystem (United States), where dense forest cover
provides protection against detection by the predators,
elk (Cervus elaphus) move into heavily wooded areas
when gray wolves are present, and, by doing so, reduce
their use of preferred grassland foraging areas associated
with a higher predation risk (Creel et al. 2005). Recently,
another study in the same area highlighted that elk
increased their rates of movement, displacement, and
vigilance when wolves approached within 1 km (Mid-
dleton et al. 2013). Both chronic and acute responses of
boreal woodland caribou (Rangifer tarandus) and moose
(Alces alces) were also demonstrated in reaction to wolf
presence (Latombe et al. 2014). Once caribou acquired a
signal of predator presence, their movement and habitat
selection was altered over large distances (several
kilometers) and long time scales (several days), accord-
ing to resource availability.
In this study, we demonstrated the behavioral
plasticity in acute antipredator responses exhibited by
woodland caribou, with a cursorial predator, gray
wolves, in their vicinity. To highlight the most contrast-
ed responses to predation risk vs. available resources, we
restricted our study to the period of the year with the
greatest level of risk, together with high-demanding
needs for foraging. During the spring, caribou (most
notably females) increase their movement rate and
spread over the landscape in order to limit their spatial
predictability to predators for the upcoming calving
season (Bergerud et al. 1990). Nonetheless, this behavior
results in temporally higher niche overlap with wolves
(Basille et al. 2013), and makes the spring dispersal a
period of relatively high mortality rates (56% of
mortalities in the study area occur during this season;
Courtois et al. 2007). High-quality forage is relatively
scarce at this time of the year (caribou mostly rely on
ground lichen from autumn to spring; Johnson et al.
2001, Courtois et al. 2007, Leblond et al. 2011), but
energy demands are high, with virtually all females being
pregnant (Courtois et al. 2007).
In situations of risk, the strength of acute antipredator
responses will be a function of the quality and intensity
of information transferred from predators to prey
(Weissburg et al. 2014). There is increasing recognition
that predator detection can be a multimodal processrelying on the integration of multiple cues (visual,
acoustic, mechanical, or chemical) to assess the level ofthreat and respond accordingly (Ferrari et al. 2009,
Weissburg et al. 2014). Movement is the primarybehavioral adaptation by which prey deal with hetero-geneity in the distribution of resources and predators at
multiple scales (Lima 1998, Nathan et al. 2008, Gorini etal. 2012), allowing them to minimize the fitness costs of
predation by balancing resource acquisition and survivalor reproductive output (Stephens and Krebs 1986, Sih
1998, Cresswell 2008). Within the predator’s sphere ofinfluence, i.e., the distance within which prey react to the
predator’s presence, distinct responses can be expectedas the intensity and number of cues increase, and the
prey can better assess not only predator presence, butalso their location and threat level (Weissburg et al.
2014).We thus assessed how caribou responded to increas-
ing levels of threat from a highly mobile predator, bycontinuously monitoring the distance between caribou
and the closest wolves: as proximity to wolves increased,we intended to estimate caribou perceptive range and
antipredator responses. Before caribou are able toprecisely locate the source of the threat, we expectedcaribou to avoid foraging areas associated with a higher
risk of encountering wolves, while seeking alternativecover types that provide refuge from predation (cover
hypothesis; Hc). When the cue information becomesmore accurate, caribou may be able to locate the
predators, and then favor hasty retreating, characterizedby an increased movement rate and a propensity to go in
the opposite direction of the risky area (retreathypothesis; Hr). Due to the multimodal nature of risk
information, synergistic or additive responses areexpected (Weissburg et al. 2014), so caribou may thus
display both types of responses simultaneously andgradually (multimodal hypothesis; Hm), according to
wolf proximity. Finally, as the environmental contextwithin which prey are confronted by predator threat
(e.g., the presence of refuges; Stankowich and Blumstein2005) may also alter antipredator responses, weevaluated how spatiotemporal proximity to wolves
impacted habitat selection of caribou when they weremoving in the most risky areas. Our study revealed the
plasticity in the response of caribou to an acute risk ofpredation, and highlighted how a mobile prey may
balance food and safety at a fine spatiotemporal scale.
MATERIAL AND METHODS
Study area and relocation data
The study was carried out from March 2005 to April
2010 in the boreal forest of the Cote-Nord region,Quebec, Canada (50–528 N, 68–718 W; see Courbin et al.[2014] for a description of the study area). In the study
area (33 900 km2), caribou density was estimated to be2.3 individuals/100 km2, according to an aerial survey
October 2015 2623MOVEMENT RESPONSE TO PREDATOR PROXIMITY

conducted over the study area in March 2007. Nineteen
female caribou and nine wolves from the four different
packs present in the area were fitted with GPS collars
(Lotek Engineering, Newmarket, Ontario, Canada) or
ARGOS/GPS collars (Telonics, Mesa, Arizona, USA).
Female boreal woodland caribou are spatially segregat-
ed from other caribou half of the year, from spring
dispersal in April to rut in September, and live in small
groups with a dynamic composition the rest of the year.
As a consequence, monitored individuals moved over
large ranges and rarely stayed together, and accurately
described caribou behavior in the overall population.
The four wolf packs, each comprised of three to six
individuals, were identified during aerial surveys be-
tween 2005 and 2007, and covered the entire caribou
range in the study area. Particular attention was paid to
finely monitor every individual, with one location every
hour for caribou, and one location every 2–4 h for
wolves.
Based on a clustering analysis, we defined the spring
dispersal as the period from 16 April to 21 May (Basille
et al. 2013) when female caribou spread out from
wintering areas in a spacing tactic aiming at reducing
their detectability for the upcoming calving season
(Bergerud et al. 1990). This season is characterized by
a fast rate of movement, use of relatively low elevations,
and the strongest use of deciduous forests, cuts, and
roads (Basille et al. 2013). The spring dispersal is
temporally distinct from the later calving season (late
May–early August), which is characterized by much
lower mobility (especially during the first days of calves’
life), high elevations, and a sudden drop in the use of
human-disturbed areas (Basille et al. 2013). Note that
bears, which can have a significant impact on neonatal
caribou and moose survival (Ballard 1994, Bastille-
Rousseau et al. 2011) were only present at low densities
in the area (Courtois et al. 2007, Courbin et al. 2009),
and predate ungulate neonates only during a brief
period of ;4–6 weeks after calving. The impact of bear
on caribou antipredator response during the spring
dispersal was thus expected to be minor.
We then selected only caribou locations that could
potentially be associated with an immediate response of
caribou triggered by wolf proximity. Latombe et al.
(2014) identified varying responses of caribou to the
passage of gray wolves in winter and summer, with a
spatial threshold as large as 4.7 km in summer, and a
temporally decaying response decreasing to 5% after 10
d in winter. On this basis, we considered all caribou
locations that occurred within 5 km of where a radio-
collared wolf was located within the past 15 d. Cohesion
within packs is not necessarily assured at all times; this
estimate of risk is thus likely to be conservative, as other
wolves not monitored may be closer to caribou. As a
consequence of using a relatively large spatiotemporal
window, we could include every wolf location (i.e., every
2 and every 4 h) to extract the most precise information.
We ended up with a total of 2087 caribou locations in
the spatiotemporal vicinity of wolves, i.e., 7.74% of the
total number of steps.
Note that it was not our intent to set up the 15-d
window as a standard approach in studies of predation
risk. Rather, we used the best knowledge available
together with the data at hand to define an ad hoc
temporal window for our study. In order to emphasize
the relevance of this window, we contrasted the results
with three alternative temporal windows, using all
caribou locations that occurred within 5 km of where
a radio-collared wolf was located (1) from the beginning
of the previous winter (starting November 28; see Basille
et al. 2013), (2) within a 15-d period a month after each
caribou location, and (3) regardless of time (i.e., the
complete wolf data set). For each alternative, we used
the same approach as detailed in the next section; none
of them returned significant (P , 0.05) effects of wolf
proximity on caribou movement, supporting the use of
the 15-d period preceding each caribou location (see
Appendix for the detailed outputs of this comparison).
Movement responses to predation
We analyzed caribou relocations using step selection
functions (SSF; Fortin et al. 2005). Series of relocations
were first converted into successive steps, which is the
straight line segment connecting the current location to
the next location. Each observed step was associated to
10 random steps, originating from the same location but
with step lengths and turning angles (i.e., the direction of
the current step relative to the direction of the previous
step; Turchin 1998) drawn from empirical distributions
of every step of every individual (n¼ 26 949), excluding
those from the focal individual.
Observed and random steps were then contrasted
using a conditional logistic regression for case-control
data, in which strata were defined by sets of a single
observed step and the 10 corresponding random steps.
We estimated robust variances to insure that inferences
are valid despite the presence of autocorrelation between
successive steps (Fortin et al. 2005). As revealed by an
analysis of autocorrelations and partial autocorrelations
of the deviance residuals of the full model (Fortin et al.
2005), any two steps from two clusters separated by at
least three steps can be considered independent.
Sequences longer than 10 steps associated with risk
were then cut in shorter series, by dropping segments of
three successive steps every other 10 steps, to create 194
independent clusters of successive steps.
Four competingmodels of movements were fitted to the
data. The baseline model (Hb) was used as a basic
movement model that does not take predation risk into
account; this model included the land-cover type at the
end of the step (so as to maximize the contrast from the
beginning of the step, as compared to land-cover
proportions along the step), the average slope along the
step, the movement rate (i.e., distance travelled in 1 h),
and directional persistence. Land-cover types were
identified using Landsat Thematic Mapper images taken
MATHIEU BASILLE ET AL.2624 Ecology, Vol. 96, No. 10

in 2000 with a 25-m resolution grid (Natural Resources
Canada, Canadian Forest Service, Laurentian Forestry
Centre, Quebec, Quebec, Canada). Satellite images were
composed of 48 land-cover classes to which we added
recent (�5 yr) and regenerating (5–20 yr) forest cuts,
together with the road network, based on information
provided annually by local forestry companies. We
reclassified the 48 classes into eight broader classes
relevant to caribou: open areas and bogs, shrubs,
deciduous and mixed forest, open conifer forest, conifer
forest with lichen, dense conifer forest, cut blocks and
roads, andwater bodies. Slope was estimated using a 25-m
resolution digital elevation model at the scale of 1:20 000.
Finally, we computed the directional persistence as the
cosine of the turning angle, which thus ranges from�1 (U-
turn) to 1 (straight-ahead movement). Note that, since
random steps were drawn from all available steps,
irrespective of the proximity to wolves, both speed and
directional persistence within the subset of steps at risk
may be different than the general speed and directional
persistence. Testing both effects is equivalent to testing
speed and directional persistence when in proximity to
wolves as compared to usual movement regardless of
wolves.
All other competing models included a proxy of
predation risk, as given by the spatial proximity to
wolves, i.e., the inverse of the distance between current
caribou location and the closest wolf. Distance to
predators has been previously used as an index of risk
having an impact on antipredator behavior, such as
vigilance, movement, and habitat selection (e.g., Liley
and Creel 2008, Middleton et al. 2013, Creel et al. 2014,
Latombe et al. 2014), within similar ranges of distance
from prey that allow for predator detection (within 1–5
km). Since we were interested in the effect of the level of
threat on habitat selection and movement behaviors, the
proximity to wolves was used in interaction with the
variables of interest of each subsequent model. As
observed and random steps of a stratum share the same
start point, distance to wolves is the same within a
stratum; as a result, there is no main effect of the
distance to wolves, and only the interaction term is
included in the models to evaluate the impact of distance
to wolves on habitat selection of caribou (similar to the
assessment of group size effects in Fortin et al. [2009]).
In order to dismiss a response to habitat structure as
an alternative mechanism, in the form of a behavioral
functional response to the proximity of risky areas
instead of wolves per se (Mysterud and Ims 1998,
Matthiopoulos et al. 2011), we computed the distance to
land-cover types associated to a high predation risk. In
the same study area, Courbin et al. (2009) showed that
wolves selected open areas and bogs, as well as
deciduous and mixed forest during spring. A Pearson
correlation between the distance to the closest wolf and
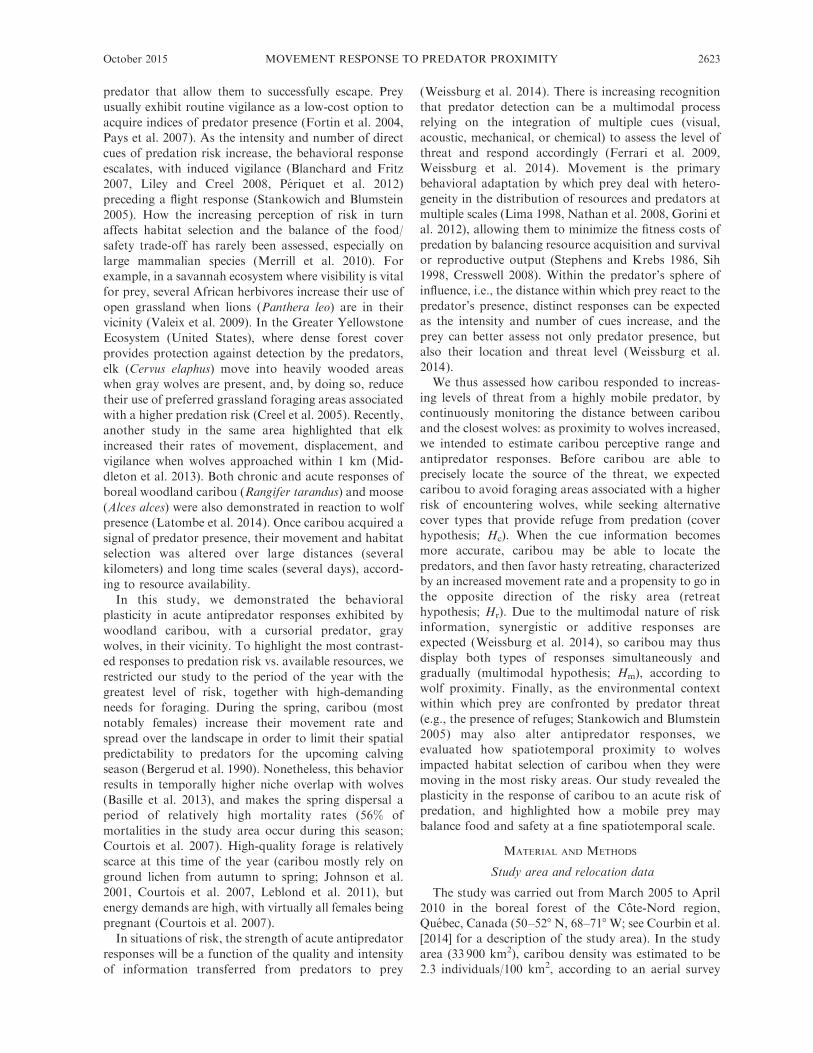
PLATE 1. A group of boreal caribou (Rangifer tarandus) in the Cote-Nord regiou, Quebec, Canada. Caribou avoid open areasand move faster when wolves (Canis lupus) are closer than 2.5 km. Photo credit: N. Courbin.
October 2015 2625MOVEMENT RESPONSE TO PREDATOR PROXIMITY

the distance to these four land-cover types indicated no
relation between the two (r ¼�0.026).The cover model (Hc) considered the selection of
environmental attributes in response to predation risk.
The cover model thus extended the baseline model by
including the spatial proximity to wolves in interaction
with the four land-cover types associated with a high
predation risk, as well as caribou foraging areas (conifer
forests with lichens), and two extremes on a cover
gradient (open areas and bogs again, and dense conifer
forests). The retreat model (Hr) considered caribou
responses to predation by adjusting their movement
behavior. This model thus extended the baseline model
by including change in distance to the closest wolf along
the step (as computed by the difference between
distances to the closest wolf locations at the start and
end points of the step), and the cosine of the direction to
the closest wolf (ranging from�1, when caribou move in
the opposite direction, to 1 when caribou move straight
toward the closest wolf ). We also included spatial
proximity to wolves in interaction with directional
persistence, movement rate, and direction to the closest
wolf. Finally, the multimodal model (Hm) included both
movement responses and environmental responses at the
same time, on top of the baseline model.
SSF models were assessed for multicollinearity using
variance inflation factors (VIF). The proximity to the
closest wolf was mean-centered to reduce multicolli-
nearity. We then used an information theoretic frame-
work to rank all models based on quasi-likelihood
estimation for autocorrelated data using QIC (quasi-
likelihood under independence criterion; Pan 2001). The
lowest QIC indicates the best model, with QIC weights
assessing the weight of evidence for each model being
the best (xi; Burnham and Anderson 2002). Finally, the
robustness of the best model was computed using a k-
fold cross validation for conditional logistic regression,
which evaluates the performance of the model by
comparing the scores of observed steps to random ones
(Fortin et al. 2009).
Movement in potentially high-risk areas
In a second step, we investigated the movement rules
specifically in the areas associated with the highestpotential risk. In the study area, the probability ofencountering a wolf is highest in open areas and
deciduous and mixed forests (Courbin et al. 2009). Wethus selected every step starting in open areas and
deciduous and mixed forests, and split them in twogroups, closer and farther away than 2.5 km from the
closest wolf, i.e., approximately the threshold distancetriggering the avoidance of both cover types, as
identified by the best model (see Results). For eachgroup of proximities, we computed selection ratios
(Manly et al. 2002) to compare the land-cover type atthe end of the step between observed and random steps,
as computed from the SSFs (Fig. 1).Finally, an analysis of variance allowed us to further
distinguish alternative tactics in the vicinity of wolvesfor steps ending up in these risky areas (i.e., deciduous
forests and open areas) vs. areas providing dense cover(i.e., dense conifer forest). We fitted a linear mixed
model on speed, taking temporal autocorrelation intoaccount by adjusting a random effect on clusters ofsteps, with land-cover category (i.e., risky and cover
areas), the two proximity groups (,2.5 km and �2.5km), and their interaction as explanatory variables.
Significance of main effects and the interaction wastested by likelihood ratio tests.
All statistical analyses were conducted using R 3.1.2(R Core Team 2014), and additional R packages
dedicated to the study of animal trajectories (adehabi-tatLT; Calenge 2006) and providing functions dedicated
to SSF (hab; Basille 2015).
RESULTS
Movement models
In the subset of caribou locations that occurred within5 km and 15 d of wolf locations, caribou were located on
average at a distance of 3.15 km to the nearest radio-collared wolf, with a minimum of 44 m. The model
selection revealed that environmental responses wereprimarily at play in the system (Table 1). Indeed, the
cover model received the vast majority of empiricalsupport, with a QIC weight of 95.52%. In second
position, the multimodal model only received limitedsupport (x ¼ 4.13%), while both baseline and retreat
models received virtually no support (x , 1%). Thecover model was fairly robust to the k-fold cross
validation (rS ¼ 0.604 6 0.176), and displayed limitedmulticollinearity: VIF of all variables was �2.13, an
acceptable level for valid inference analyses (O’Brien2007).
Caribou avoided steep slopes and lakes comparedwith open conifer forests, while selectively moving
forward (Table 2). As the distance to wolves progres-
FIG. 1. Movement of boreal woodland caribou (Rangifertarandus) in the riskiest areas: the land cover at the end of stepsstarting in open areas and mixed/deciduous forests (whitepixels) when grey wolves (Canis lupus) are (a) closer than 2.5 kmfrom the path was compared to when wolves are (b) fartheraway than 2.5 km, as represented by the 2.5-km circle centeredaround the current location. Light and dark gray pixels aresymbolic of areas with lichen and conifer forests, respectively.
MATHIEU BASILLE ET AL.2626 Ecology, Vol. 96, No. 10

sively diminished, caribou successively shifted to an
avoidance of deciduous forests, open areas, and conifer
forests with lichen. Indeed, the model predicts a strong
avoidance of deciduous and mixed forests, open areas,
and conifer forests with lichen when wolves are closer
than 2.87 km, 1.67 km, and 0.37 km, respectively (Fig.
2a, b, d). When wolves were closer than 0.74 km,
caribou shifted markedly from an avoidance to a
selection of dense conifer forests (Fig. 2c), although
the model did not report the positive interaction between
the selection for dense conifer forests and the proximity
to wolves as significant. Finally, caribou also increased
their rate of movement and directional persistence in
proximity to wolves (Table 2).
Movement in open areas and mixed/deciduous forest
Caribou moving in risky areas (open areas and
deciduous/mixed forests) targeted open conifer with
lichen, although less so when they were closer to wolves
(Fig. 3). While moving at a short distance from wolves
(,2.5 km), caribou also avoided deciduous forests and
open areas (Fig. 3).
Caribou moved faster in deciduous forests and open
areas than in dense conifer forests (v2¼ 9087.1, df¼ 1, P
� 0.001), which is consistent with the difficulty of
moving in dense cover. However, there was no difference
when closer to wolves, neither as a fixed effect of
distance to wolves (v2¼ 0.003, df¼ 1, P¼ 0.959), nor in
interaction with the cover type (v2 ¼ 0.320, df ¼ 1, P ¼0.572).
DISCUSSION
This study provides one of the few examples of fine-
scale behavioral plasticity in antipredator tactics of large
mammalian prey in the vicinity of its predator. Our
results bridge the gap between behavioral studies
addressing the risky times hypothesis (often without
explicitly accounting for predator proximity in favor of
a binary presence/absence of predators on site) and
ecological studies addressing the risky places hypothesis
(that do not incorporate immediate threats) by detailing
acute antipredator responses in space and time. Using
simultaneous telemetry monitoring of both predators
and prey, movement analyses (based on SSF; Fortin et
TABLE 2. Coefficients and 95% confidence intervals (CI) for the final step selection function (SSF)model for 19 caribou (Rangifer tarandus) in situation of predation risk during dispersal in Cote-Nord, Quebec, Canada, 2005–2010.
Variable b Lower CI Upper CI
Open 0.51 0.13 0.90Conifer with lichen 0.51 0.35 0.66Shrub 0.28 �0.02 0.57Cuts �0.14 �0.48 0.20Deciduous �0.13 �0.35 0.10Conifer �0.23 �0.46 �0.01Water �0.83 �1.32 �0.35Speed 0.49 0.32 0.66DirP 0.09 0.02 0.17Slope �0.02 �0.04 0.00Conifer 3 Wprox 0.28 �0.21 0.77C.Lichen 3 Wprox �0.21 �0.31 �0.11Deciduous 3 Wprox �1.97 �3.52 �0.42Open 3 Wprox �2.66 �4.87 �0.45
Notes: Confidence intervals were computed using robust standard errors. Variables included inthe SSF model are the land-cover type at the end of the step (open for open areas, conifer withlichen [C.Lichen] for open conifer forests with lichen, shrubs, cuts for cut blocks (,20 years),deciduous for deciduous or mixed forests, conifer for dense conifer forests, and water for waterbodies), the speed, the directional persistence (computed as the cosine of the turning angle, DirP),the average slope along the step (slope), and the proximity to wolves (Canis lupus) (computed as theinverse of the distance to the closest wolf, Wprox) as an interaction term.
TABLE 1. Model selection between the baseline model (Base; Hb), the cover model (Cover; Hc), the retreat model (Retreat; Hr),and the multimodal model (Multi; Hm).
Model Quasi-LL K Trace QIC DQIC x
Base �3957.458 10 12.302 7939.520 11.444 0.003Cover �3949.173 14 14.865 7928.076 0 0.955Retreat �3955.621 15 16.239 7943.720 15.643 0.000Multi �3947.932 19 19.247 7934.358 6.282 0.041
Notes: The quasi-likelihood under independence criterion (QIC) penalizes the quasi-likelihood (Quasi-LL) by the matrix tracefunction estimated using robust variances (Trace), which is close, but not exactly equal to K, the number of parameters in the model(for all models, n¼18 358). The best model (Cover) presents the lowest QIC (with the difference of each model to the best shown inDQIC), and is supported by a very high weight of evidence that it is the best (xi ). See Pan (2001) for details about the computationof QIC.
October 2015 2627MOVEMENT RESPONSE TO PREDATOR PROXIMITY

al. 2005) revealed that, when in proximity to their
predator, caribou avoided the most potentially risky
areas, i.e., areas associated with a relatively high
probability of wolf encounter. When risk became more
acute by wolves being closer to their prey, however,
caribou switched to a strong avoidance of preferred
foraging areas in favor of areas providing a denser
cover. In addition, we highlighted that caribou crossed
the most risky areas at relatively high speed, and used
these areas simply as stepping stones to reach limiting
food patches. Altogether, these results illustrate the fine-
scale trade-off between food and safety for a mobile prey
facing a threat from a cursorial predator, and indicate a
gradation of context-dependent responses refining the
risk allocation hypothesis.
Our study clarifies decision-making of caribou in
situations of risk, and illustrates that balancing food and
safety can result in frequent and rapid changes in
movement decisions. Except in very close proximity to
wolves, caribou selected lichen woodlands, which
provide the most abundant source of forage from
autumn to spring (Johnson et al. 2001, Courtois et al.
2007, Leblond et al. 2011). They also sought more for
open areas and stayed on flat terrain, which facilitates
movement between foraging areas; a characteristic most
important at the time of the year when their movement
rate is at its highest (Basille et al. 2013; see Plate 1). On
the one hand, caribou moved faster in open areas and
deciduous forests than in mature conifer forests, where
the dense cover impedes their movements (see, e.g.,
Avgar et al. [2013] and references therein). On the other
FIG. 2. Caribou selection for (a) deciduous and mixed forests, (b) open areas, (c) dense conifer forests, and (d) conifer forestswith lichen, as a function of the distance to the closest wolf. The distance was divided into 10 bins between 0 and 5 km. For eachbin, a selection ratio was computed as the proportion of observed steps in this bin divided by the proportion of random steps. Ahorizontal line at y¼ 1.0 indicates null selection. Negative and positive bars imply that the proportion of observed steps was lessand more, respectively, than random expectation. Hatched bars indicate no observed steps in a bin and were set to 0. All graphs areon the same scale to allow for visual comparison, but note that the y-axis in (c) is broken on its upper limit because of the highselection of dense conifer forests in close proximity to wolves. The predictions of the final step selection function (SSF) model wereadded as black lines, with dashed lines indicating 95% confidence intervals. Caribou avoided deciduous and mixed forests, openareas, and conifer forests with lichen when closer to wolves than 2.87 km, 1.67 km, and 0.37 km, respectively.
MATHIEU BASILLE ET AL.2628 Ecology, Vol. 96, No. 10

hand, snow also starts melting earlier in open areas, at
times where there is still plenty of snow in densely
forested areas (Koskinen et al. 1997), and snow-free
open areas will further improve caribou movements in
the landscape (Avgar et al. 2013).
In a second step, when the predators were in closer
proximity (,2.5 km), caribou moved faster, and avoided
open areas and deciduous forests. These areas are the
most risky areas, where wolves are more likely to be
encountered (Courbin et al. 2009). This avoidance of
areas used more heavily by predators is a behavior
generally found in ungulates (e.g., Creel et al. 2005).
Finally, in situations of most acute risk (wolves closer
than 1 km), caribou strongly avoided their preferred
foraging areas, i.e., conifer forests with lichens, illus-
trating the foraging cost of predation for caribou
(Brown and Kotler 2004), and favored instead dense
forest to seek protective cover from their predator
(Mysterud and Østbye 1999, Fortin et al. 2005). This
behavior may reflect a leapfrog effect (Sih 1998, Laundre
2010), whereby prey avoid food-rich areas while
predators inspect those areas. It should also be noted
that the distance to the closest wolf can be seen as a
conservative estimate of predation risk (Creel et al.
2013): large mammals can travel long distances in a
fairly short time, e.g., between two successive locations,
and wolves could actually be closer to caribou than
measured on a discrete time lag; in addition, not every
wolf within each pack was monitored, and other wolves
(from the same pack or another) may have been closer to
caribou, while remaining undetected. As a consequence,
our results on the influence of wolf proximity are also
likely to be conservative (see, for instance, Creel et al.
[2013] for a demonstration of the impact of data
collection biases in the underestimation of antipredator
responses).
Prey can assess the presence of predators using visual,
acoustic, mechanical, or chemical cues (Weissburg et al.
2014). Vision (e.g., vigilance) is often the most effective
sense for immediate detection of predators or prey
(Cronin 2005). Flight behavior, also often triggered by
visual signals, is typically displayed when a predator is
within a very short range from prey, e.g., flight initiation
distance ,150 m in Columbian black-tailed deer
(Odocoileus hemionus columbianus) (Stankowich and
Coss 2007), or 80 m in Svalbard reindeer (Rangifer
tarandus) (Tyler 1991). Visual cues, however, have
somewhat limited value in forested environments, and
prey might react more often to acoustic and chemical
cues, which can reach long distances and last longer than
visual cues (Kats and Dill 1998, Kuijper et al. 2014).
Many large ungulates have been shown to react to
predator odors, such as Columbian black-tailed deer,
Alpine goat (Capra hircus), wapiti (Cervus elephus
canadiensis), or sheep (Ovis ares) (see Apfelbach et al.
[2005] for a review). Even if predators have already left
the area, chemical cues provide evidence of their recent
presence, and, thus, some indication of the likelihood of
their presence in the area in the near future (Latombe et
al. 2014), which has been termed the ‘‘ghost of predation
future’’ (Kats and Dill 1998). In particular, Kuijper et al.
(2014) highlighted increased vigilance of red deer
(Cervus elephus) within one week of a fresh wolf scat
deposition, while visibility in the forest did not have an
effect on prey behavior. We were able to detect strong
antipredator signals in the range 0.4–2.9 km from the
closest predator, which is consistent with the range of
distance thresholds (0.2–4.7 km) reported by Latombe et
al. (2014). Similarly, Liley and Creel (2008) reported
elevated vigilance in elk induced by the presence of
wolves at distances up to 3 km. Although caribou can
travel long distances during the 1-h relocation interval,
and may thus be able to use direct visual cues to assess
predation risk, their displacement during the relocation
interval, as measured by the Euclidean distance between
successive locations, was extremely low (mean¼ 163 m;
median ¼ 57 m). While this measurement does not
account for potential exploration during the relocation
interval, our results thus seem to support an assessment
of predation in a highly dynamic environment based on
multimodal cues, allowing them to identify a predation
threat at distances potentially larger than the visual
extent in the forest, and gradually producing combined
responses when the risk increases (Weissburg et al.
2014).
In conclusion, we demonstrated strong behavioral
plasticity in the response of a large ungulate to the
spatiotemporal dynamics of predator distribution. We
provided a link between immediate responses in the
situation of encounter with the predator (e.g., flight) and
responses to the perceived risk at the landscape scale
(e.g., distribution; Courbin et al. 2009). Altogether, our
results provided a mechanistic explanation of changes in
FIG. 3. The selection ratios for land-cover types at the endof steps starting in the potentially riskiest areas when the closestwolf is closer than 2.5 km (dark gray) and farther away than 2.5km (light gray) from caribou. The bars are ordered bydecreasing selection when the closest wolf was farther awaythan 2.5 km from caribou. A horizontal line at y ¼ 1 indicatesnull selection.
October 2015 2629MOVEMENT RESPONSE TO PREDATOR PROXIMITY

habitat selection as an antipredator response in the
proximity of the predator (Fortin et al. 2005), and
underline the importance of intensive monitoring data to
reveal fine-scale behaviors.
ACKNOWLEDGMENTS
We are indebted to James Watling and Nicolas Courbin forconstructive comments on the manuscript, and to DavidBucklin for a thorough language check. The Fonds quebeoisde la recherche sur la nature et les technologies (FQRNT), theNSERC—University Laval Industrial Research Chair inSylviculture and Wildlife, the Ministere du Developpementdurable, de l’Environnement, de la Faune et des Parcs, Abitibi-Bowater, Arbec, Canada Economic Development, the Canadi-an Foundation for Innovation, the Cegep de Baie-Comeau, theCentre d’Etude de la Foret, the Fondation de la faune duQuebec, FPInnovations, Kruger, and Natural ResourcesCanada provided financial support. We thank B. Baillargeon,L. Breton, S. Couturier, D. Gay, D. Grenier, J. Y. Lacasse, andB. Rochette for their invaluable help in the field.
LITERATURE CITED
Apfelbach, R., C. D. Blanchard, R. J. Blanchard, R. A. Hayes,and I. S. McGregor. 2005. The effects of predator odors inmammalian prey species: a review of field and laboratorystudies. Neuroscience & Biobehavioral Reviews 29:1123–1144.
Avgar, T., A. Mosser, G. S. Brown, and J. M. Fryxell. 2013.Environmental and individual drivers of animal movementpatterns across a wide geographical gradient. Journal ofAnimal Ecology 82:96–106.
Ballard, W. B. 1994. Effects of black bear predation on caribou:a review. Alces 30:25–35.
Basille, M. 2015. hab: habitat and movement functions. http://ase-research.org/basille/hab
Basille, M., D. Fortin, C. Dussault, J. P. Ouellet, and R.Courtois. 2013. Ecologically based definition of seasonsclarifies predator–prey interactions. Ecography 36:220–229.
Bastille-Rousseau, G., D. Fortin, C. Dussault, R. Courtois, andJ. P. Ouellet. 2011. Foraging strategies by omnivores: Areblack bears actively searching for ungulate neonates or arethey simply opportunistic predators? Ecography 34:588–596.
Bergerud, A., R. Ferguson, and H. Butler. 1990. Springmigration and dispersion of woodland caribou at calving.Animal Behaviour 39:360–368.
Beschta, R. L., and W. J. Ripple. 2011. Are wolves savingYellowstone’s aspen? A landscape-level test of a behaviorallymediated trophic cascade: comment. Ecology 94:1420–1425.
Blanchard, P., and H. Fritz. 2007. Induced or routine vigilancewhile foraging. Oikos 116:1603–1608.
Brown, J. S., and B. P. Kotler. 2004. Hazardous duty pay andthe foraging cost of predation. Ecology Letters 7:999–1014.
Brown, J. S., J. W. Laundre, and M. Gurung. 1999. Theecology of fear: optimal foraging, game theory, and trophicinteractions. Journal of Mammalogy 80:385–399.
Burnham, K. P., and D. R. Anderson. 2002. Model selectionand multi-model inference: a practical information-theoreticapproach. Second edition. Springer-Verlag, Berlin, Germany.
Calenge, C. 2006. The package ‘‘adehabitat’’ for the R software:a tool for the analysis of space and habitat use by animals.Ecological Modelling 197:516–519.
Courbin, N., D. Fortin, C. Dussault, and R. Courtois. 2009.Landscape management for woodland caribou: the protec-tion of forest blocks influences wolf-caribou co-occurrence.Landscape Ecology 24:1375–1388.
Courbin, N., D. Fortin, C. Dussault, and R. Courtois. 2014.Logging-induced changes in habitat network connectivityshape behavioral interactions in the wolf–caribou–moosesystem. Ecological Monographs 84:265–285.
Courbin, N., D. Fortin, C. Dussault, V. Fargeot, and R.Courtois. 2013. Multi-trophic resource selection functionenlightens the behavioural game between wolves and theirprey. Journal of Animal Ecology 82:1062–1071.
Courtois, R., J. P. Ouellet, L. Breton, A. Gingras, and C.Dussault. 2007. Effects of forest disturbance on density,space use, and mortality of woodland caribou. Ecoscience 14:491–498.
Creel, S., and D. Christianson. 2009. Wolf presence andincreased willow consumption by Yellowstone elk: implica-tions for trophic cascades. Ecology 90:2454–2466.
Creel, S., P. Schuette, and D. Christianson. 2014. Effects ofpredation risk on group size, vigilance, and foraging behaviorin an African ungulate community. Behavioral Ecology 25:773–784.
Creel, S., J. A. Winnie, and D. Christianson. 2013. Underes-timating the frequency, strength and cost of antipredatorresponses with data from GPS collars: an example withwolves and elk. Ecology and Evolution 3:5189–5200.
Creel, S., J. A. Winnie, Jr., D. Christianson, and S. Liley. 2008.Time and space in general models of antipredator response:tests with wolves and elk. Animal Behaviour 76:1139–1146.
Creel, S., J. Winnie, B. Maxwell, K. Hamlin, and M. Creel.2005. Elk alter habitat selection as an antipredator responseto wolves. Ecology 86:3387–3397.
Cresswell, W. 2008. Non-lethal effects of predation in birds.Ibis 150:3–17.
Cronin, T. W. 2005. The visual ecology of predator-preyinteractions. Pages 105–138 in P. Barbosa and I. Castellanos,editors. Ecology of predator-prey interactions. OxfordUniversity Press, Oxford, UK.
Ferrari, M. C., A. Sih, and D. P. Chivers. 2009. The paradox ofrisk allocation: a review and prospectus. Animal Behaviour78:579–585.
Fortin, D., H. Beyer, M. Boyce, D. Smith, T. Duchesne, and J.Mao. 2005. Wolves influence elk movements: behaviorshapes a trophic cascade in Yellowstone National Park.Ecology 86:1320–1330.
Fortin, D., M. S. Boyce, E. H. Merrill, and J. M. Fryxell. 2004.Foraging costs of vigilance in large mammalian herbivores.Oikos 107:172–180.
Fortin, D., M. E. Fortin, H. L. Beyer, T. Duchesne, S. Courant,and K. Dancose. 2009. Group-size-mediated habitat selectionand group fusion–fission dynamics of bison under predationrisk. Ecology 90:2480–2490.
Getz, W. M. 2011. Biomass transformation webs provide aunified approach to consumer–resource modelling. EcologyLetters 14:113–124.
Gorini, L., J. D. C. Linnell, R. May, M. Panzacchi, L. Boitani,M. Odden, and E. B. Nilsen. 2012. Habitat heterogeneity andmammalian predator–prey interactions. Mammal Review 42:55–77.
Johnson, C., K. Parker, and D. Heard. 2001. Foraging across avariable landscape: behavioral decisions made by woodlandcaribou at multiple spatial scales. Oecologia 127:590–602.
Kats, L. B., and L. M. Dill. 1998. The scent of death:chemosensory assessment of predation risk by prey animals.Ecoscience 5:361–394.
Koskinen, J., J. Pulliainen, and M. Hallikainen. 1997. The useof ERS-1 SAR data in snow melt monitoring. IEEETransactions on Geoscience and Remote Sensing 35:601–610.
Kuijper, D. P. J., C. de Kleine, M. Churski, P. van Hooft, J.Bubnicki, and B. Jedrzejewska. 2013. Landscape of fear inEurope: wolves affect spatial patterns of ungulate browsingin Bialowieza Primeval Forest, Poland. Ecography 36:1263–1275.
Kuijper, D. P. J., M. Verwijmeren, M. Churski, A. Zbyryt, K.Schmidt, B. Jedrzejewska, and C. Smit. 2014. What cues doungulates use to assess predation risk in dense temperateforests? PLoS ONE 9:e84607.
MATHIEU BASILLE ET AL.2630 Ecology, Vol. 96, No. 10

Latombe, G., D. Fortin, and L. Parrott. 2014. Spatio-temporaldynamics in the response of woodland caribou and moose tothe passage of grey wolf. Journal of Animal Ecology 83:185–198.
Laundre, J. W. 2010. Behavioral response races, predator–preyshell games, ecology of fear, and patch use of pumas andtheir ungulate prey. Ecology 91:2995–3007.
Leblond, M., J. Frair, D. Fortin, C. Dussault, J. P. Ouellet, andR. Courtois. 2011. Assessing the influence of resourcecovariates at multiple spatial scales: an application toforest-dwelling caribou faced with intensive human activity.Landscape Ecology 26:1433–1446.
Liley, S., and S. Creel. 2008. What best explains vigilance in elk:characteristics of prey, predators, or the environment?Behavioral Ecology 19:245–254.
Lima, S. L. 1998. Nonlethal effects in the ecology of predator-prey interactions. BioScience 48:25–34.
Lima, S. L., and P. A. Bednekoff. 1999. Temporal variation indanger drives antipredator behavior: the predation riskallocation hypothesis. American Naturalist 153:649–659.
Lima, S. L., and L. M. Dill. 1990. Behavioral decisions madeunder the risk of predation: a review and prospectus.Canadian Journal of Zoology 68:619–640.
Luttbeg, B., and J. L. Kerby. 2005. Are scared prey as good asdead? Trends in Ecology & Evolution 20:416–418.
Manly, B. F. J., L. L. McDonald, D. L. Thomas, T. L.McDonald, and W. P. Erickson. 2002. Resource selection byanimals: statistical design and analysis for field studies.Second edition. Kluwer Academic, Dordrecht, Netherlands.
Matthiopoulos, J., M. Hebblewhite, G. Aarts, and J. Fieberg.2011. Generalized functional responses for species distribu-tions. Ecology 92:583–589.
Merrill, E., H. Sand, B. Zimmermann, H. McPhee, N. Webb,M. Hebblewhite, P. Wabakken, and J. L. Frair. 2010.Building a mechanistic understanding of predation withGPS-based movement data. Philosophical Transactions ofthe Royal Society B 365:2279–2288.
Middleton, A. D., M. J. Kauffman, D. E. McWhirter, M. D.Jimenez, R. C. Cook, J. G. Cook, S. E. Albeke, H. Sawyer,and P. J. White. 2013. Linking anti-predator behaviour toprey demography reveals limited risk effects of an activelyhunting large carnivore. Ecology Letters 16:1023–1030.
Mysterud, A., and R. A. Ims. 1998. Functional responses inhabitat use: availability influences relative use in trade-offsituations. Ecology 79:1435–1441.
Mysterud, A., and E. Østbye. 1999. Cover as a habitat elementfor temperate ungulates: effects on habitat selection anddemography. Wildlife Society Bulletin 27:385–394.
Nathan, R., W. M. Getz, E. Revilla, M. Holyoak, R. Kadmon,D. Saltz, and P. E. Smouse. 2008. A movement ecologyparadigm for unifying organismal movement research.Proceedings of the National Academy of Sciences USA105:19052–19059.
O’Brien, R. 2007. A caution regarding rules of thumb forvariance inflation factors. Quality & Quantity 41:673–690.
Pan, W. 2001. Akaike’s information criterion in generalizedestimating equations. Biometrics 57:120–125.
Pays, O., P. C. Renaud, P. Loisel, M. Petit, J. F. Gerard, andP. J. Jarman. 2007. Prey synchronize their vigilant behaviourwith other group members. Proceedings of the Royal SocietyB 274:1287–1291.
Periquet, S., et al. 2012. Influence of immediate predation riskby lions on the vigilance of prey of different body size.Behavioral Ecology 23:970–976.
R Core Team. 2014. R: A language and environment forstatistical computing. R Foundation for Statistical Comput-ing, Vienna, Austria. http://www.R-project.org
Ripple, W. J., and R. L. Beschta. 2004. Wolves and the ecologyof fear: Can predation risk structure ecosystems? BioScience54:755–766.
Searle, K. R., C. J. Stokes, and I. J. Gordon. 2008. Whenforaging and fear meet: using foraging hierarchies to informassessments of landscapes of fear. Behavioral Ecology 19:475–482.
Sih, A. 1998. Game theory and predator-prey response races.Pages 221–238 in L. A. Dugatkin and H. K. Reeve, editors.Game theory and animal behavior. Oxford University Press,Oxford, UK.
Stankowich, T., and D. T. Blumstein. 2005. Fear in animals: ameta-analysis and review of risk assessment. Proceedings ofthe Royal Society B 272:2627–2634.
Stankowich, T., and R. G. Coss. 2007. Effects of riskassessment, predator behavior, and habitat on escapebehavior in Columbian black-tailed deer. Behavioral Ecology18:358–367.
Stephens, D., and J. Krebs. 1986. Foraging theory. PrincetonUniversity Press, Princeton, New Jersey, USA.
Trussell, G. C., P. J. Ewanchuk, and C. M. Matassa. 2006.Habitat effects on the relative importance of trait- anddensity-mediated indirect interactions. Ecology Letters 9:1245–1252.
Turchin, P. 1998. Quantitative analysis of movement: measur-ing and modeling population redistribution in animals andplants. Sinauer, Sunderland, Massachusetts, USA.
Tyler, N. 1991. Short-term behavioural responses of Svalbardreindeer Rangifer tarandus platyrhynchus to direct provoca-tion by a snowmobile. Biological Conservation 56:179–194.
Valeix, M., A. J. Loveridge, S. Chamaille-Jammes, Z.Davidson, F. Murindagomo, H. Fritz, and D. W. Macdon-ald. 2009. Behavioral adjustments of African herbivores topredation risk by lions: spatiotemporal variations influencehabitat use. Ecology 90:23–30.
Weissburg, M., D. L. Smee, and M. C. Ferner. 2014. Thesensory ecology of nonconsumptive predator effects. Amer-ican Naturalist 184:141–157.
Willems, E. P., and R. A. Hill. 2009. Predator-specificlandscapes of fear and resource distribution: effects onspatial range use. Ecology 90:546–555.
Winnie, J. J., and S. Creel. 2007. Sex-specific behaviouralresponses of elk to spatial and temporal variation in thethreat of wolf predation. Animal Behaviour 73:215–225.
SUPPLEMENTAL MATERIAL
Ecological Archives
The Appendix is available online: http://dx.doi.org/10.1890/14-1706.1.sm
October 2015 2631MOVEMENT RESPONSE TO PREDATOR PROXIMITY

Plastic response of fearful prey to thespatio-temporal dynamics of predator distribution
—Appendix 1: Choice of the temporal window—
Mathieu Basille, Daniel Fortin, Christian Dussault,Guillaume Bastille-Rousseau, Jean-Pierre Ouellet
& Réhaume Courtois
April 15, 2015
Abstract
In this document, we compare of four temporal windows for the evaluation ofanti-predator responses: 1) 15 days prior to each caribou location, as presentedin the main text; 2) 15 days a month after each caribou location; 3) every wolflocations from the beginning of winter; 4) every wolf locations regardless of time.We show that only the selected 15-day temporal window provided anti-predatorresponses.
The definition of the temporal window to investigate anti-predator responses ofcaribou to the proximity of wolves was based on the best of our knowledge of the dataon hand and previous studies addressing the issue in this study system. However, alack of a strong biological framework for this decision calls for a better justification todecide the temporal window.
In order to better understand the impact of the temporal window, we thus imple-mented the approach detailed in the manuscript using four different temporal windowsto select wolf locations:
1. The preceding 15 days, which is the approach selected in the manuscript [W15];
2. A 15-day period in the future, a month after each caribou location (this is toprevent the 15 days immediately after each caribou location to be too similar tothe 15 days immediately before) [Wfuture];
3. All wolf locations from the beginning of winter, which was defined as November 28for wolves (see Basille et al., 2013, for more details on the delineation of seasons)[Wseason];
4. All wolf locations, regardless of time [Wtotal].
1

Basille et al. Appendix
For all four temporal windows, we use the same analytic protocol as detailed in themanuscript:
• Extracting only caribou steps with wolves closer than 5 km within the temporalwindow;
• Drawing 10 random steps for each observed step, using the complete data set ofcaribou locations;
• Fitting a conditional logistic regression for case-control data (i.e. Step SelectionFunctions, Fortin et al., 2005) to contrast observed and random steps: only the fullmodel (corresponding to Hmulti) was fit, to allow comparison of effects for eachtemporal window. The full model included the land cover type at the end of thestep, the average slope along the step, speed and directional persistence, as wellas the spatial proximity to wolves in interaction with the 4 risky land cover types,with speed, with directional persistence, and with the direction to the closest wolf.Every model took into account the stratified structure of the data (observed vs.random), and estimated robust variances using clusters of independent steps (seeMaterial and Methods for more details).
The results of the full model for the four different temporal windows are shown inTable 1 of this document. Since we were primarily interested in the effect of predationrisk, as given by the proximity to wolves, we focused on the significance of the interactionof this variable with other variables of interest. While the results are qualitativelyconsistent between all four models regarding main effects, we can see that none of theinteractions with wolf proximity (indicated by “var × Wprox” in Table 1) are significantfor other temporal windows than the original 15-day: 95 % confidence intervals for allinteraction terms overlap with 0. The only exception is the effect of wolf proximityon speed using all wolf locations regardless of the time. In other words, none of thealternative temporal windows provided results that highlighted an effect of wolf spatialproximity on caribou movement, which clearly supports the relevance of the original15-day window.
ReferencesBasille, M., Fortin, D., Dussault, C., Ouellet, J.-P., Courtois, R., 2013. Ecologically based
definition of seasons clarifies predator-prey interactions. Ecography 36, 220–229.
Fortin, D., Beyer, H., Boyce, M., Smith, D., Duchesne, T., Mao, J., 2005. Wolves influenceelk movements: Behavior shapes a trophic cascade in Yellowstone National Park. Ecology86, 1320–1330.
2

Basille et al. Appendix
Table 1: Coefficient and 95 % confidence intervals for the full Step Selection Function(SSF) model, using four different temporal windows.
W15 Wfuture
Variable β CI 2.5 CI 97.5 β CI 2.5 CI 97.5Open 0.51 0.12 0.89 -4.92 -12.98 3.15Conifer w. lichen 0.51 0.35 0.66 0.28 0.04 0.53Shrub 0.28 -0.01 0.58 0.35 -0.25 0.94Deciduous -0.13 -0.35 0.10 0.33 0.00 0.67Cuts -0.14 -0.48 0.19 0.01 -0.42 0.44Conifer -0.23 -0.46 -0.01 -0.16 -0.52 0.20Water -0.83 -1.32 -0.34 -1.16 -2.01 -0.31Slope -0.02 -0.04 0.00 -0.04 -0.08 0.00Speed 0.49 0.31 0.67 0.64 0.40 0.88DirP 0.10 0.02 0.14 0.14 0.02 0.26Conifer × Wprox 0.30 -0.24 0.84 -0.06 -0.25 0.13C.Lichen × Wprox -0.22 -0.39 -0.05 0.04 -0.26 0.33Deciduous × Wprox -1.98 -3.55 -0.42 0.14 -0.05 0.34Open × Wprox -2.66 -4.87 -0.45 -10.72 -26.82 5.39DiffProx 0.01 -0.17 0.20 0.74 0.41 1.07Speed × Wprox 0.11 -0.24 0.46 0.11 -0.09 0.30DirP × Wprox 0.08 0.00 0.15 -0.03 -0.15 0.09Wangle 0.00 -0.07 0.06 -0.10 -0.23 0.03Wangle × Wprox 0.08 -0.04 0.20 0.03 -0.13 0.19
Wseason Wtotal
Variable β CI 2.5 CI 97.5 β CI 2.5 CI 97.5Open 0.09 -0.28 0.46 0.36 0.16 0.57Conifer w. lichen 0.24 0.14 0.34 0.32 0.25 0.40Shrub 0.20 0.05 0.36 0.13 0.02 0.25Deciduous -0.06 -0.18 0.06 -0.15 -0.23 -0.06Cuts -0.10 -0.38 0.19 0.16 -0.11 0.43Conifer -0.45 -0.55 -0.34 -0.34 -0.42 -0.26Water -0.79 -1.26 -0.32 -0.84 -1.21 -0.46Slope -0.02 -0.03 0.00 -0.02 -0.03 -0.01Speed 0.43 0.30 0.56 0.42 0.28 0.56DirP 0.07 0.03 0.12 0.09 0.06 0.13Conifer × Wprox 0.01 -0.05 0.07 0.00 -0.01 0.01C.Lichen × Wprox -0.04 -0.12 0.03 -0.02 -0.04 0.00Deciduous × Wprox 0.02 -0.07 0.11 0.00 -0.04 0.05Open × Wprox -0.08 -0.18 0.01 -0.06 -0.13 0.00DiffProx 0.86 0.72 1.00 2.02 1.82 2.22Speed × Wprox 0.04 -0.05 0.14 0.07 0.04 0.11DirP × Wprox -0.01 -0.04 0.01 0.00 0.00 0.01Wangle -0.16 -0.20 -0.11 -0.19 -0.22 -0.16Wangle × Wprox -0.01 -0.03 0.01 0.00 0.00 0.01
3