plaque detection: how can we identify a vulnerable...
TRANSCRIPT

Plaque Detection: How Can We Identify a
Vulnerable Plaque?
Lampros K. Michalis, MRCP, FESC
Professor of Cardiology, University of Ioannina


Fibroatheroma
Acellular necrotic core
Macrophages infiltration
Free cholesterol
Compensatory enlargement
Eccentric morphology
These can lead to TCFA or Plaque erosion – Thrombus formation
Atherosclerosis Pathophysiological Insights
Virmani et al. Atheroscl Thromb Vasc Biol 2000

Atherosclerotic progression –pathophysiological insights
TCFA
Large necrotic core
Thin fibrous cap (cap thickness<65μm)
Macrophage infiltration
Typical precursor lesion
leading to
Acute Coronary Syndromes
Virmani et al. Atheroscl Thromb Vasc Biol 2000

Atherosclerotic progression –pathophysiological insights
Plaque rupture
Disruption of a thin fibrous cap
The necrotic core is in contact with the lumen
Plaque erosion
Thrombus confined to the
lumen wall
The lumen surface beneath the thrombus is devoid from endothelium
Erosion

Plaque Vulnerability
Imaging/Assessment ofPlaque integrity & composition
Inflammatory infiltration
Vulnerable Plaque Detection

Intravascular Imaging
From vulnerable plaque detection to clinical events

Intravascular Ultrasound
The acquired cross-sectional images allow:
Identification of the lumen, stent and vessel wall
Quantification of their dimensions and plaque volume
Classification of the plaque type
Detecting plaque erosion, ruptureand the presence of thrombus
Unable to see microstructures related to increased vulnerability
Mintz et al. J Am Coll Cardiol. 2001
Relatively low resolution - limited
capability in:

IVUS-Virtual Histology
Based on the creation of spectral maps for different tissue types
Classification of obtained spectra in 4 plaque types (necrotic core, fibrofatty, fibrous and calcific tissue)
This approach has been evaluated using histology as gold standard with an accuracyof 93-97% for all tissuecomponents
Mintz et al. J Am Coll Cardiol. 2011
Nair et al. Circulation. 2002Nair et al. EuroIntervention 2007

VH-TCFA: Predictive Value
PROSPECT STUDY – 3yr MACE AtheroREMO – 1yr MACE
Stone GW et al. N Engl J Med 2011Cheng et al. Eur Heart J 2014

Optical Coherence Tomography
The acquired cross-sectional images allow:
Imaging of micro-features related to plaque vulnerability (Cap Thk, Lipid pool, macrophages)
Evaluation of stent endotheliazation
Classification of the plaque type
Identification of plaque rupture/thrombus
Tearney et al. J Am Coll Cardiol. 2012
Poor penetration which often does not allow imaging of the entire vessel wall
Cannot “see” behind lipid tissue
Unable to discriminate deeply embeddedlipid-rich from calcific tissue
Limitations of this modality are:

Plaques that progress have more oftenat baseline
Plaque erosion
Neo-vessels
TCFA phenotype
Macrophages
ThrombusUemura et al. Eur Heart J 2012
OCT
No published study regarding physical history and OCT
IBIS under review

Near InfraRed Spectroscopy
Imaging requires irradiation of the tissue with a NIR light source
Allows identification of lipid component
The chemogram
The block chemogram
The lipid core burden index
Processing of the reflected signal provides:
Provides No information on lumen and plaque anatomy/morphology
Caplan et al. JACC 2006

Jaffer et al. J Am Coll Cardiol 2011
Near Infrared Fluorescence Molecular Imaging
Relies on the use ofactivatable NIRF probesto mark molecules related to inflammation/fibrin
A catheter emits NIR light allowing imaging of thefluorescent molecules
Detection of vessel wall inflammation and fibrin after stent implantation
No info on anatomy/morphology
Νew Invasive Imaging TechniquesPotential Clinical Translation
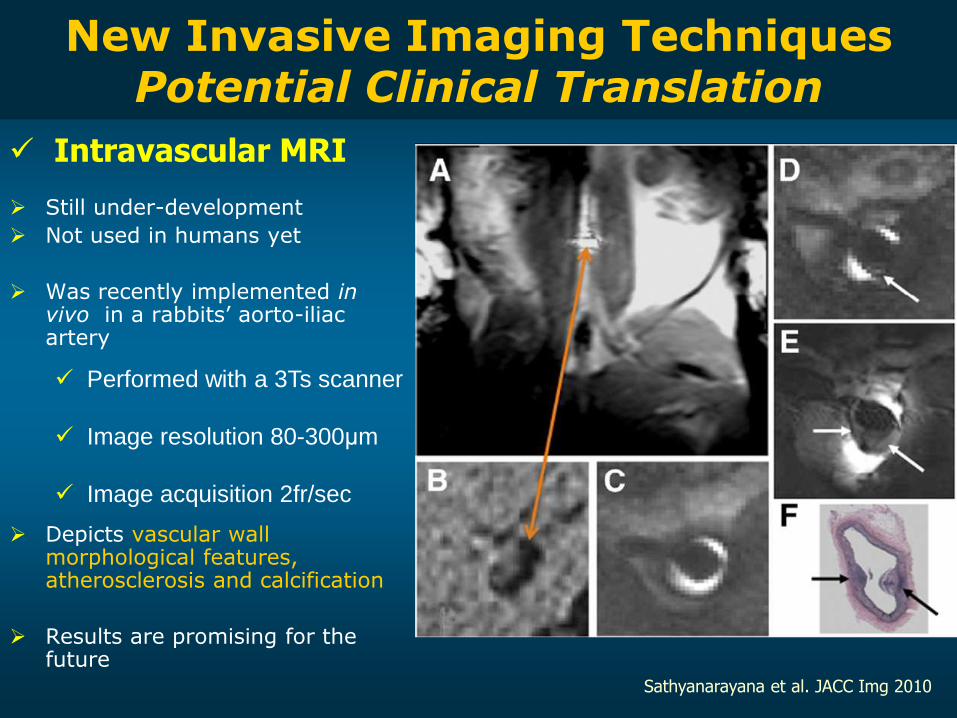
Still under-development
Not used in humans yet
Was recently implemented in vivo in a rabbits’ aorto-iliac artery
Depicts vascular wall morphological features, atherosclerosis and calcification
Results are promising for the future
Performed with a 3Ts scanner
Image resolution 80-300μm
Image acquisition 2fr/sec
Sathyanarayana et al. JACC Img 2010
Intravascular MRI
Νew Invasive Imaging TechniquesPotential Clinical Translation

Is feasible but the catheter has 5.2F diameter
Time consuming process (51 sec for 1 frame)
Differentiates lipid rich, intermediate and fibrotic areas of atherosclerotic plaque
Regar et al. EuroIntervention 2006
Irradiation of the tissues with laser –
spectral analysis of the Raman scattering
Interrogates the vibration of molecular bonds and is capable to identify the chemical composition of the plaque
There is a catheter for intravascular use but this technique is not available in clinical practice
Motz et al. J Biomed Opt 2006Chau et al. J Biomed Opt 2008
Intravascular MR Spectroscopy
Raman Spectroscopy
Νew Invasive Imaging TechniquesPotential Clinical Translation

Tissue autofluorescence is collected after excitation with pulsed laser and analyzed according to different wavelengths
Allows detection of the biochemical makeup of the superficial plaque • Cholesterol, collagen, elastin• Necrotic/lipid core• Inflammatory cells
Low penetration (depth 150-205μm)
Identification of markers of vulnerability
Marcu et al. Atherosclerosis. 2009
Time Resolved Fluorescence Spectroscopy (TRFS)
Νew Invasive Imaging TechniquesPotential Clinical Translation
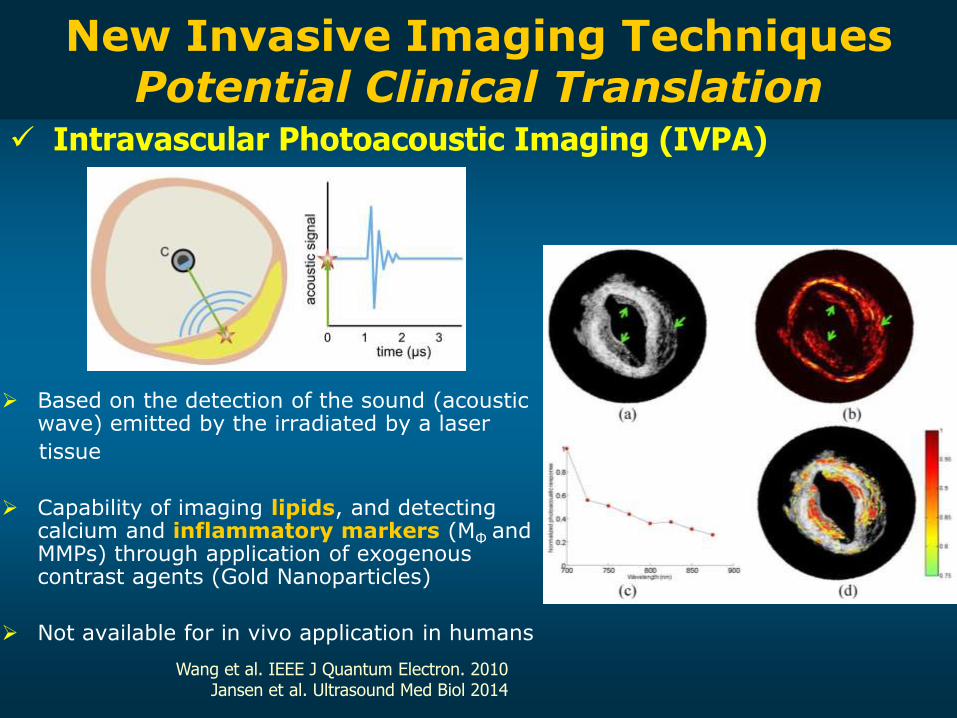
Based on the detection of the sound (acoustic wave) emitted by the irradiated by a laser
tissue
Capability of imaging lipids, and detecting calcium and inflammatory markers (MΦ and MMPs) through application of exogenous contrast agents (Gold Nanoparticles)
Not available for in vivo application in humans
Wang et al. IEEE J Quantum Electron. 2010Jansen et al. Ultrasound Med Biol 2014
Νew Invasive Imaging TechniquesPotential Clinical Translation
Intravascular Photoacoustic Imaging (IVPA)

Hybrid Catheters:Multi-modal
Intravascular Imaging

Hybrid catheter – IVUS and NIRS Imaging is performed with the use of the
TVC catheter that combines a NIRS light
source and an IVUS probe
The catheter allows overlay of the NIRS
estimations onto the IVUS images
Provides plaque anatomy and
lipid probability
Clinically availableGarg et al. EuroIntervention 2010
Schultz et al. JACC 2010

Hybrid catheter – IVUS and OCT Recently developed catheters
that include an OCT and an
IVUS probe
– Not clinically applicable yet
– The size of the probe is too
big
– Increased time for combined
image acquisition
– Electromagnetic shielding is
necessary to eliminate the
noise created by the motor
used for rotational scanning
Li et al. Cathet Cardiovasc Interv 2009 Yin et al. J Biomed Opt 2010

Hybrid Catheter – IVUS and IVPA
There is a catheter for in vivo imaging but it has not been used in clinical practice- its safety needs evaluation - requires time for image acquisition
Identification of plaque/volumeby IVUS and lipids/inflammationby photoacoustic imaging (IVPA)
Plaque characterization Detection of stent morphology
Yeager et al. J Biomed Opt 2012Wang et al. IEEE J Quantum Electron 2010
Su et al. Expert Opin Med Diagn 2010Jansen et al. Ultrasound Med Biol 2014

TRFS-US-PA
There is a catheter but it cannot be used in the clinical setting- TRFS signal has poor penetration - concerns about vessel wall trauma
Identification of plaque morphology by IVUS and wall biochemical properties by TRFS
Assessment of the superficial plaque characteristics
Stephens et al. J Biomed Opt 2009Sun at al. Biomed Express 2011Bec et al. J Biomed Opt 2012
Multi-modal catheter
combining TRFS, Ultrasonic
backscatter microscopy and
Photoacoustic imaging
Hybrid catheter – IVUS and TRFS

Intravascular catheter with a 2.7mm diameter
Able to visualize lumen morphology and inflammation
Can detect the presence of fibrin in stented segments
Hybrid catheter – OCT and NIRF
In vivo coronary imaging in animals is in progress but has not been implemented in humans yet
Yoo et al. Nat Med 2011

Fusion of Imaging Data:3D reconstructionESS assessment

Wahle et al. IEEE Trans Med Imag 1999Slager et al. Circulation 2000Bourantas et al. Cathet Cardiovasc Interv 2008
Complete visualization of 3-dimensionalvessel morphology
Precise evaluation of the plaque volume Accurate orientation of the plaque onto the
artery Coupled with Computational Fluid
Dynamics Enables ESS assessment
Fusion of Angiographic & IVUS data

The largest natural history of atherosclerosis study which investigated the
effect of ESS on plaque progression in 506 pts with an ACS
Low ESS was independently associated with disease progression
Large plaque burdenand low ESS appeared as independent predictors of plaque progression
Large plaque burden and low ESS predicted with 41%accuracy worsening lumen obstruction requiring PCI

Fusion of Angiographic and – OCT
Available system that allows co-registration of 3D-QCA and OCT
Integration of X-ray angiographic and OCT data for ESS assessment: association with high-risk plaque characteristics
Papafaklis et al. ESC 2013
Tu et al. JACC Intv 2012
Fusion of Angiographic & OCT data

Intravascular Coronary Imaging: Applicability for Identifying the Vulnerable Plaque
Reduced clinical application:
Requires cardiac catheterization
Most of the fusion algorithms are time consuming and available in limited centres
Still limited prognostic value - Does not affect the final decision
However, here is only one hybrid catheter that can be used in the clinical setting as the rest are under development

Non-Invasive Imaging:Vulnerable Plaque
Detection

Can be used to assess ESS distribution in the coronary tree including bifurcation and main branches
However CT has low resolution that does not permit assessment of vulnerable plaque characteristics
Coronary Computed Tomography Angiography
Voros et al. JACC Intv 2011
Rybicki et al. Int J Cardiovasc Imag 2009

Non-invasive Molecular ImagingCombination of CT and PET
Rogers et al. JACC Img 2010
Fluorodeoxyglucose
(18F-FDG)
Measure of Glucolysis
Metabolic Activity
Index of Atherosclerotic
Inflammation
Combines coronary anatomy
with functional imaging for
disease assessment

CT and PET: Novel Markers18F-sodium fluoride (18F-NaF)
Surrogate of
Vascular inflammation &
Macrophage burden
More sensitive compared to 18F-FDG
18F-NaF positive plaque
shows high-risk features:
large necrotic core and
microcalcification (IVUS-VH)
Joshi et al. Lancet 2013
18F-NaF 18F-FDG
ACS case
ACS case
Stable case

CONCLUSIONS
Detection of plaque vulnerability requires assessment of:
– Plaque morphology and composition
– Plaque “activity”
– Local hemodynamic milieu
Intravascular Imaging
single-modal / multi-modal (hybrid catheters) / fusion of data
- Enables both anatomical and functional-molecular imaging
- Until now: mediocre predictive value shown in clinical studies
- Limited use of many novel ones: Need for translating experimental modalities in clinical practice
Non-invasive imaging
Potential for population screening: improved risk assessment
SUBSTRATE
STIMULUS

Conclusions
Needs to be defined
• What are the characteristics of the patient, whose plaques should be interrogated?
• Can we predict cardiac events by improving identification of vulnerable plaques?
• Which are the pre-emptive strategies?

Hemodynamic Environment
• Local hemodynamic forces
– Flow-generated endothelial shear stress(frictional force per unit area because of blood’s viscous nature)
– Blood pressure-derived tensile stress
Shear Stress = viscosity × velocity gradient
Nerem RM. J Biomech Eng 1992 Papafaklis MI and Michalis LK. Hellenic J Cardiol 2005
Shear Stress: A critical determinant in the natural history of atherosclerosis

Local Hemodynamics and Vascular Biology
Hahn C. and Schwartz MA. Nature Reviews 2009
Laminar
Flow
Athero-
Resistant
Region
Disturbed
Flow
Athero-
Susceptible
Region
Low
ESS

Background
Pathological, cellular and biochemical characteristics of the vulnerable plaque
In vivo identification of the pathological characteristics
Intravascular imaging:Unimodal cathetersHybrid Catheters (Multi-modal)Fusion of Imaging data and the role of blood flow
Non-invasive Imaging
Conclusions

NIRS: Clinical Correlation
Patients
ACS patient
Stable patientMadder et al. Circ Cardiovasc Intv 2012Madder et al. JACC Intv 2013

Fusion of IVUS-VH & Angiography:ESS Assessment
Samady et al. Circulation 2011
LOW SHEAR STRESS
0.7 Pa
HIGH SHEAR STRESS
5.1 Pa 20pts with CAD
underwent serial VH-IVUS imaging at baseline and 6m FU
Serial study that assessed the effect of ESS on plaque composition in humans
Low ESS was associated with an increase in plaque burden and necrotic corecomponent, intermediate ESS with no changes and high ESS with an increase in Ca and necrotic core component

van der Giessen et al. Int J Cardiovasc Imag 2007
Requires extraction of the luminal centerline from the CT data
Identification of correspondence (using anatomical landmarks) between the IVUS images and the cross sections in the CT data
Allows reconstruction of the coronary
bifurcations
Evaluation of the capabilities of CT in
assessing the extent and the
morphology of the plaque
Fusion of CT and IVUS
ESS
computation

Potential for Primary Prevention of EventsPopulation Screening
Falk et al. Curr Atheroscl Rep 2011Nasir et al. AHA Sessions 2012
BioImage Study
Prevention of atherothrombotic
events in the asymptomatic
population
- Improvement of risk
classification compared to
traditional risk score model

Calvert et al. JACC Img. 2011Stone GW et al. N Engl J Med 2011
VH-TCFA and Clinical Events
PROSPECT STUDY – 3yr MACE VIVA-VH STUDY – 2yr MACE
TCFA

Pathological, biochemical and cellular characteristics of
the vulnerable plaque

Wentzel et al. Circ CV Img 2010
Fusion of CT and IVUS-NIRS
CT data are combined with data using the dual-mode IVUS-NIRS catheter
Allows Assessment of 3D vessel morphology and plaque distribution Identification of lipid-rich regions Coupled with Computational Fluid dynamics: ESS assessment