plant cell cultures for the production of phytochemicals
TRANSCRIPT

PLANT CELL CULTURES FOR THE PRODUCTION OF PHYTOCHEMICALS - ANTHOCYANIN AND CAPSAICIN
IN BIOREACTORS
A Thesis submitted to the
UNIVERSITY OF MYSORE
for the degree of
DOCTOR OF PHILOSOPHY
in
BIOTECHNOLOGY
by
R. MADHUSUDHAN M. Sc, M. Tech.
PLANT CELL BIOTECHNOLOGY DEPARTMENT CENTRAL FOOD TECHNOLOGICAL RESEARCH INSTITUTE
MYSORE-570 013, INDIA
1998

Dedicated to my Parents

DECLARATION
I hereby declare that this thesis, entitled PLANT CELL CULTURES FOR THE PRODUCTION OF PHYTOCHEMICALS -ANTHOCYANIN AND CAPSAICIN IN BIOREACTORS, submitted herewith to the University of Mysore for the award of DOCTOR OF PHILOSOPHY, is the result of work done by me at Plant Cell Biotechnology Department, Central Food Technological Research Institute, Mysore, under the guidance of Dr. G.A. Ravishankar, during the period 1993-1998.
I further declare that the results of this thesis work have not been previously submitted for any degree or fellowship.
(R. Madhusudhan) Date: February 19, 1998

Dr. G.A. RavishankarphD FAFST FNASc FBS
Scientist & Head
Plant Cell Biotechnology Department
CERTIFICATE
I hereby certify that the thesis, entitled PLANT CELL CULTURES FOR THE PRODUCTION OF PHYTOCHEMICALS - ANTHOCYANIN AND CAPSAICIN IN BIOREACTORS, which is submitted by Mr. R. Madhusudhan to the University of Mysore for the award of DOCTOR OF PHILOSOPHY, is the result of work done by him at Plant Cell Biotechnology Department, Central Food Technological Research Institute, Mysore, under my guidance during the period 1993-1998.

ACKNOWLEDGEMENTS
/ am extremely grateful to Dr. G.A. Ravishankar for his constant inspiration and guidance. The long pedagogic discussions I had with him taught me the intricacies of scientific research, and influenced me a lot. I am also grateful to him for the freedom of thought, experimentation, and interaction with other people.
My sincere thanks are due to Dr. L.V. Venkataraman who offered me an opportunity to work on plant cell cultures.
Due to the interdisciplinary nature of my work, I had an opportunity to interact with several people of different departments who spared their valuable time for educative discussions, and extended their instrumental facilities. I wish to record my sincere thanks to all of them. In particular, I thank Mr. N.P. Ghildyal for his valuable suggestions on studies on optimization of process parameters. Dr. S. Bhattacharya helped me greatly in rheological studies. I constantly interacted with Dr. K.S.M.S. Raghava Rao. I thank him for evaluating my research publications critically and offering valuable suggestions.
I acknowledge the help and cooperation received from the staff of Central Instrumentation and Laboratory Services, Library, Administration, and other support services departments.
I am in debt to Dr. N. Bhagyalakshmi for all kinds of helps including the counselling for personal problems. My thanks are due to Dr. G. Suvarnalatha and Dr. L. Rajendran for their help in cell line improvement and characterization of anthocyanins. I thank Dr. M.S. Narayan for his constructive criticisms, and Dr. T. Rajasekaran for his moral support.
I thank Mr. S. Ramachandra Rao for his involvement in the work on different methods for estimation ofbiomass. Without his initiativeness and help, I would have not completed the work. My thanks are due to Mr. Jacob George for going through the manuscript of this Thesis and offering his valuable suggestions.
All the colleagues in the Department always helped me. I express my sincere thanks to all the staff of this Department. In particular, I thank Mr. Harsh Pal Bais, Mr. C. Hemakumar, Mr. V. Ravi, Miss. G. Sudha, and Mr. Md. Yahya Khan for helping in preparation of this thesis.
I would like to place on record my special gratitude to all the members of my family for their love, encouragement and support. I should thank my wife for bearing with all my occupational agonies.
I thank Dr. V. Prakash, the Director, for giving me an opportunity to work in this Institute. I gratefully acknowledge the Council of Scientific and Industrial Research, New Delhi for providing me Junior, and Senior Research Fellowships.
(R. Madhusudhan)

CONTENTS
Page
Declaration i
Certificate ii
Acknowledgements iii
List of abbreviations iv
INTRODUCTION 1 - 27
MATERIALS AND METHODS 28-44
RESULTS 45-118
DISCUSSION 119 - 150
SUMMARY AND CONCLUSION 151 - 155
LITERATURE CITED 156 - 182


INTRODUCTION

1.1 History of plant cell culture technology
1.2 Outlines of the plant cell culture process
1.3 Challenges in plant cell culture technology
1.4 Research on plant cell cultures in India
1.5 Food additives from plant cell cultures
1.6 Aim and objectives of the present study

1
Plants have been the source of many compounds that are indispensable to food,
medicine, and industry. Over 80% of the approximately 30,000 known natural products
are of plant origin (Balandrin and Klocke, 1988). It has been estimated that over 25% of
the drugs prescribed in the USA are either of plant origin or derived from plants (Deus
and Zenk, 1982). The world market for the plant products is very high reaching US $
200 million and the demand is increasing at a greater percentage.
Most of the phytochemicals of commercial importance are the products of
secondary metabolism in plants. These compounds are mainly synthesized as a defense
against pathogens, and ecological variations (Harborne, 1982; Wink, 1988). Most of the
high value phytochemicals have limited taxonomic distribution and the plants grow in
strict agro-climatic conditions. The supply of chemicals from plants is subject to
seasonal variations in the agro-climatic conditions and diseases. Moreover, the
extraction of chemicals from plants is labour intensive.
In spite of the advancements in synthetic organic chemistry, many natural
compounds still could not be synthesized economically because of the complexity of
structures. Synthetic substitutes may not have all the functional attributes comparable to
the natural ones. The consumer preference is increasing for 'natural' products. Genetic
engineering of microorganisms to produce the phytochemicals is currently not feasible
in view of the multi enzyme biosynthetic pathways for these compounds.
Plant cell culture is an attractive alternate technology for the production of high
value phytochemicals (Berlin, 1984; Stafford et ah, 1986; Fowler and Scragg, 1988;
Havkin-Frenkel et al., 1997). Plant cells are biosynthetically totipotent and can produce
the range of chemicals that are found in the whole plant. It should, in principle, be
possible to produce any compound that is found in the intact plant by exploiting the
chemical totipotency of plant cell. Table 1.1 lists some selected examples of secondary
metabolites formed in plant cell cultures in levels comparable or higher than that in the
whole plants. A detailed list of the prospective compounds to be produced by plant cell
cultures is given by Endress (1994).
2
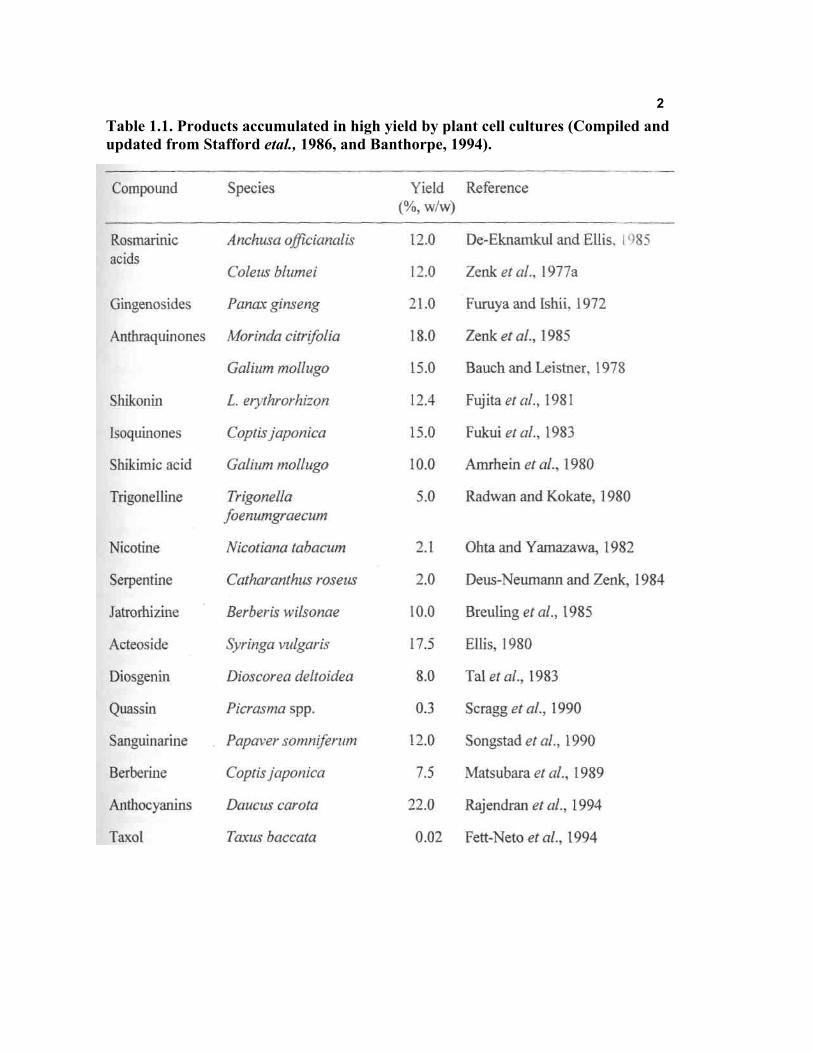
Table 1.1. Products accumulated in high yield by plant cell cultures (Compiled and updated from Stafford etal., 1986, and Banthorpe, 1994).

3
Production of phytochemicals, in vitro, from plant cell cultures offer several
advantages: (a) it is independent from geographical and seasonal constraints, and
various environmental factors such as climate, diseases etc.; (b) it is a defined
production system under controlled conditions which ensures uniform quality and yield,
and constant supply; (c) it is possible to produce novel compounds that are normally not
found in the parent plant (Table 1.2); (d) in addition, plant cells can perform stereo- and
regio- specific bioconversions (Alfermann et ah, 1983); (e) efficient downstream
recovery and product purification.
1.1 History of plant cell culture technology
At the beginning of the century, Haberlandt (1902) attempted to cultivate isolated
plant cells, but cell division was never observed in these cultures. In the 1930s the first
in vitro cultures were established (White, 1934; Gautheret, 1939), and this was followed
by a period of development of culture media and of cultivation methods (Street, 1977).
Twenty five years ago, the prospect of the use of plant cell cultures for the production of
chemicals was not imaginable. The earliest detailed reference to plant cell cultures as an
industrial route to natural product synthesis is probably the patent application of Routier
and Nickell (1956). Zenk et al. (1975) demonstrated, for the first time, that completely
dedifferentiated cell suspensions of a higher plant (Morinda citrifolia) can produce
secondary metabolites (anthraquinones). However, the low yield of secondary
metabolites in suspension cultures clearly was a bottleneck for commercialization. In
those early efforts, plant cells in culture were treated in direct analogy to microbial
systems, with little knowledge of plant cell physiology and biochemistry, or the
influence of bioreactor operation on the physiological state of such systems. In 1982, at
least 30 compounds were known to accumulate in plant culture systems in
concentrations equal to or higher than that in the whole plant (Staba, 1982). A survey of
the historical milestones in plant cell cultures is given by Schmauder and Doebel (1990).

4
Table 1.2. Examples of novel substances reported in plant cell cultures (Compiled from Berlin, 1983; Kreis and Reinhard, 1989; Ruyter and Stockigt, 1989).

5
Strategies to optimize growth and product formation began to develop separately
during the period between 1975 and 1985. A combination of various strategies for yield
improvement resulted in the first commercial plant cell culture process for the
production of shikonin from Lithospermum erythrorhίzon by Mitsui Petrochemical
Industries in Japan (Curtin, 1983) (Fig. 1.1). Shikonin, which is used as a dye and a
medicinal (anti-inflammatory) compound, valued in 1983 at approximately $ 4,000 per
kg. The expectations of this two-stage process were high and inspired the development
of three more large scale plant cell culture processes in Japan, hi the United States the
development of two processes for commercialization was attempted - the production of
vanilla flavour from plant cell cultures by Escagenetics (Knuth and Sahai, 1991) and the
production of sanguinarine by Papaver somniferum (Park et al., 1990). A detailed list of
the prospective compounds identified by Japanese industries for production through
plant cell cultures is given by Komamine et al. (1991). Phyton Gesellschaft fur
Biotechnik mbH began producing taxol, an anticancer drug, using several species of
Taxus cultures, as well as other plant products in facilities with reactor capacities of up
to 75,000 L. Cell cultures of Taxus may represent a viable alternative to extraction from
stem bark for taxol and related taxanes. Presently, the taxol production from plant cell
cultures is the prime target for a large number of centers all over the world. The recent
advances in taxol production from various Taxus spp. have been reviewed by Zhong
(1995).
1.2 Outlines of the plant cell culture processes
The techniques of plant cell culture have been extensively reviewed (Dodds and
Roberts, 1985; Charlwood and Rhodes, 1990; Payne et al,, 1992). Typically, first callus
is raised from an explant of young tissue aseptically. Cell suspensions are initiated by
dispersing friable callus in liquid nutrient medium. The resulting suspension cultures are
maintained by periodic subculturing. Suspensions are usually run as batch cultures but
immobilized cell cultures can be continuously operated over extended periods. Various

Figure 1.1. Outline of the process for production of shikonin from Lίthospermum erythrorhίzon cell culture, developed by Mitsui Petrochemical Industries Ltd., Tokyo. (Curtin, 1983. Reproduced with permission from the Publisher.)
7
culture parameters such as nutritional requirements, temperature, pH, and dissolved
oxygen are studied and optimized. Table 1.3 summarizes the various factors that
influence the secondary metabolite production. Various strategies used for improvement
of secondary metabolite production are reviewed by several authors (Petersen and
Alfermann, 1993; Dornenburg and Knorr, 1995). Figure 1.2 shows the various steps
involved in plant cell culture processes.
1.3 Challenges in plant cell culture technology
In spite of the tremendous scope, the plant cell culture technology could not be
extended to a wider range of chemicals. This is partially due to some inherent limitations
associated with the plant cells. Unlike microbial cultures, plant cells pose several
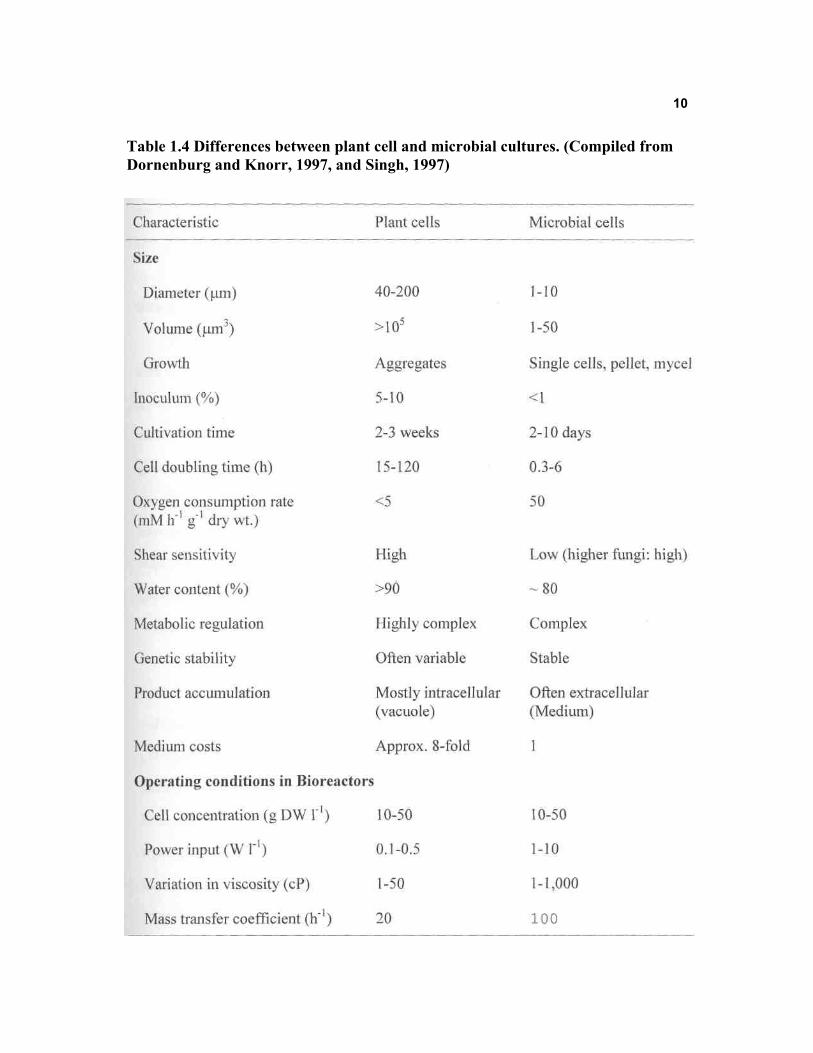
problems in their large scale cultivation. Table 1.4 summarizes the differences between
microbial and plant cell cultures. The present status, and the challenges in this
technology have been recently reviewed by Dornenburg and Knorr (1997).
Size of plant cells
Plant cells are large compared with most microorganisms, being in general 40 -
200 µm long and 10-40 µm in width. Further, the plant cells in suspension cultures
tend to aggregate and form clumps, resulting in a heterogeneous population of cell
clusters, ranging from a few cells to several thousands of cells, often measuring a few
centimetres in diameter. Whether the formation of aggregates is due to non-separation
upon cell division or true aggregation after division is not known. The aggregate
structure can be loose in nature (Scragg, 1990) or may be held together by extracellular
polysaccharides, which plant cells are known to produce in culture (Hale et al, 1987).
The size of cell aggregates has several implications in the design and operation of
bioreactors, and in the downstream processing (Panda et al, 1989; Doran, 1993). While
a smaller size of cell aggregates is preferred from the standpoint of process engineering,
a certain degree of cell-cell contact (Lindsey and Yeoman, 1983) and cell differentiation

Table 1.3 Factors influencing the secondary metabolite production in plant cell cultures. (Dornenburg and Knorr, 1995)
Strain improvement Selection
Screening
Genetic engineering
Medium variation
Nutrients Phytohormones Precursors Antimetabolites
Culture conditions
Inoculum size
pH
Dissolved oxygen level Temperature
Light Agitation
Specialized techniques
Elicitation Immobilization Permeabilization Two-stage culture Three-phase systems Reactor

10
Table 1.4 Differences between plant cell and microbial cultures. (Compiled from Dornenburg and Knorr, 1997, and Singh, 1997)

11
(Steward et al., 1958) is often required for the synthesis of secondary metabolites.
Hoekstra et al. (1988) showed the relationship between the degree of differentiation and
the level of quinoline alkaloid accumulation in Cinchona cultures. Immobilization of
cells and the hairy root cultures provide some solution for this problem.
Shear sensitivity
Plant cells have high tensile strength but low shear tolerance. This is because of
their large size, rigid cell wall and extensive vacuole. It is suspected that the difficulties
faced in the early efforts to cultivate plant cells in large reactors were due to the
sensitivity of plant cells to shear stress (Mandels, 1972; Dalton, 1978). The shear stress
generated by the impeller in the stirred tank bioreactors is thought to be responsible for
the difficulties (Smart, 1984). To reduce these problems, a number of impeller designs
have been studied. Furuya et al. (1984) used three impellers, a disc Rushton turbine, an
anchor and angled disc turbine, and concluded that the angled disc turbine gave the best
growth rate and dry weight increase from Panax ginseng cultures, in a 30 L bioreactor.
A spiral impeller was found to be the most effective for the culture of Coleus cells at
high densities (Ulbrich et al., 1985) when compared with turbine and anchor impellers.
Cultures of Glycine max and Pinus elliottii have been grown in 1.25 and 2.5 L working
volumes in bioreactors with flat bladed, marine, and cell-lift impellers run at 30 - 80 rpm
(Treat et al, 1989). The cell lift impeller yielded a similar biomass as with the flat
bladed impeller, but improved cell viability. However the cell aggregate size increased.
In another study using N. tabacum suspension cultures, a large flat bladed impeller, and
a sail impeller were tried in 5 L bioreactors (Hooker et al., 1990). The large flat bladed
impeller was a considerable improvement over the normal flat bladed impeller in terms
of growth and biomass yield.
Growth rates
Plant cells in suspension have a very slow growth rate with doubling times of 2-6
12
d compared with 2-6 h of microorganisms. The low growth rate appears not to be due to
the low activities of the enzymes present in plant cells, but is rather a reflection of the
cell's growth cycle, where the cytoplasm represents less than 10% of the total cell
volume. The most rapidly growing culture that has been reported is Nicotiana tabacum
(Noguchi et al., 1982) with a doubling time of 18 h, but a typical doubling time would
be 2-3 d. The growth rate is further reduced, in some cases, when the cultures are grown
in large bioreactors. However, there are reports where the growth rate of cells is little
affected in bioreactors. (Scragg et ah, 1987a). The major practical consequence of this
slow growth is that the bioreactor runs are to be of 2-4 weeks. This requires considerable
attention to the maintenance of sterility, and other problems such as water loss also can
occur. The long bioreactor runs also mean that the number of runs that an individual
bioreactor can accommodate in a year is limited to perhaps one per month. On a
production scale, the development of an inoculum will take a considerable time and the
overall productivity per bioreactor will be reduced. As many products of interest are
accumulated after growth has ceased, the possibility of reducing the bioreactor run time
is limited.
Plant cell reactors
The large scale growth of plant cells in bioreactors is required in order to develop
any form of biotechnological process. The first use of a bioreactor was the report of
culture of Daucus carota cells in a 15 L stirred tank reactor (Byrne and Koch, 1962).
The early 1970s saw a number of reports on the cultivation of tobacco cells in stirred
tank bioreactors (Kato et al. 1975) of up to 1500 L volume, culminating in the growth of
tobacco cells at 15,000 L (Noguchi et al., 1977). At this stage, apart from one report by
Hahlbrock et al. (1974) on the growth of Glycine max and Petroselinum, mass
cultivation was restricted to tobacco cells. However, when other cultures were
investigated, it was soon recognized that plant cell suspensions had a number of
problems associated with their cultivation in bioreactors. It had been observed that plant

13
cells are sensitive to shear stress (Mandels, 1972). This led to a general view that the
conventional stirred tank reactors are unsuitable for growth of plant cells because of the
high levels of shear produced from the mechanical agitation. Studies by Wagner and
coworkers (Wagner and Vogelman, 1977) with cells of Morίnda citrίfolia provided
strong support for this view. With this impression, plant cells were grown in a
surprisingly wide variety of bioreactor types and conformations (Spier and Fowler,
1983). Much of the early work on large scale growth was carried out with air driven
reactors, typically of draught tube format (Fig 1.3), which develop comparatively low
levels of shear. A variety of cell cultures have been successfully grown in airlift
bioreactors (Breuling et ah, 1985; Scragg et ah, 1987a). Table 1.5 lists the different
types of bioreactors and volumes used for plant cell cultures.
In recent years, however, there has been a return to stirred tank reactors, and
numerous examples of large scale growth in this type of reactor now exist. Indeed, the
process formats used in those processes which have been commercialized have involved
the use of stirred tank vessels. What has brought about this change? Fowler and Stafford
(1992) remarked that 'no verified explanation exists.' It is possible that during the cell
selection for other criteria, such as improved productivity, unwitting selection has also
been made for cells which exhibit higher and higher levels of shear tolerance (Fowler,
1987). Tanaka (1982) has shown that the airlift bioreactor may have problems at high
cell densities, and it has been shown that plant cells may not be as sensitive to shear
stress as it was first thought (Scragg et al, 1988a).
However, there are still a good number of examples of shear intolerant plant cell
lines (Leckie et al, 1990) and new types of bioreactor are being developed (Bohme et
aί, 1997). Different types of bioreactors and their advantages and disadvantages used
for plant cell cultures have been reviewed exhaustively by several authors (Kargi and
Rosenberg, 1987; Panda et al, 1989; Sing and Curtis, 1994).

Figure 1.3. Designs of basic reactors used for plant cell cultures.
14

Table 1.5. Various types of bioreactors used to cultivate plant cells (updated from Scragg, 1992)
15

16
Scale-up of plant cell cultures in bioreactors
The goal of scale-up is to reproduce on a large scale those conditions observed to
be optimal at the small scale. The reproduction of the chemical environment on various
scales is relatively easy with respect to the soluble macronutrients. The sparingly soluble
gaseous nutrients are more difficult to supply in a reproducible manner on different
scales. This proves to be quite difficult for plant cell cultures because of the potential
requirements for the supply or removal of volatile components in addition to oxygen
(Rajasekhar et al., 1971; Maurel and Pareilleux, 1985). The complexity of fluid flow in
typical bioreactors makes the analysis of the physical environment quite difficult.
Bioreactors for microbial cells are often characterized by the overall oxygen transfer
coefficient, Kιa, and scale-up is often based on achieving the same Kιa on different
scales. Although oxygen is required for plant cells, shear may prove to be the overriding
consideration for large scale reactor design (Payne et al, 1987).
Unlike microbial cultures, plant cell suspensions have some special demands for
their large scale cultivation. Though the oxygen consumption rates of plant cells are low,
they require adequate bulk mixing and at the same time the cells are sensitive to
dissolved oxygen level. Rajasekhar et al. (1971), from a study on the effect of agitation
rate on the growth of Atropa and Acer cultures, concluded that reduced growth at
suboptimal shaking speeds was neither due to oxygen deficiency nor accumulation of
carbon dioxide, but rather due to an unknown volatile toxic factor, or a restricted
nutrient uptake resulting from a stationary liquid-phase boundary surrounding the cells.
Fujino et al. (1992) studied the effect of DO level on cell growth and β-carotene
productivity of carrot cultures by changing the gas flow rate and gas composition under
PID controlled manner. They found that at a DO level of 3.0 ppm the specific growth rate of cells was 0.46 day-1 while the β-carotene content was only 0.47 µg 10-8 cells. On
the other hand, at the DO level of 0.05 ppm the specific growth rate was only 0.09 day-1
while the β-carotene content boosted up to 2.6 µg 10-8 cells. They then tried a two stage
culture with respect to the DO level for carrot cell cultures. In the first stage of

17
logarithmic cell growth, DO level was kept at 2.0 ppm and in the second stage of β-
carotene production the DO level was reduced to 0.15 ppm. This scheme of DO-stat
culture resulted in the maximum productivity of β-carotene. This study illustrates the
complexity in large scale culture of plant cells.
Though the technique animal cell culture is equally young compared to plant cell
culture, the engineering aspects of plant cell cultures received scarce attention while the
same were studied extensively for animal cell cultures (Birch et al, 1987). The high cost
of the mammalian cell products is probably the reason for this unfair treatment.
Immobilized cell cultures
Certain products synthesized inside the cells diffuse out into the surrounding
medium. Physical containment of such cells allows the phase separation resulting in a
continuous production over extended periods. Several secondary metabolites which are
not stored in vacuoles are thus ideal candidates to be produced from immobilized cells.
Parr (1988) gave a comprehensive list of such compounds, which includes several
alkaloids, anthraquinones, phenolics and terpenoids. Interestingly, the microenvironment
of immobilized plant cells has several additional advantages for secondary metabolite
formation. Mainly, the cell-cell contact is enhanced, and, as a consequence of the
physical stress, the primary metabolism is slowed down allowing the diversion of
intermediates into secondary metabolism. Table 1.6 summarizes the advantages of
immobilization of plant cells. Various aspects of immobilized plant cell cultures have
been reviewed elaborately by several authors (Rhodes, 1985; Brodelius, 1988; Hulst and
Tramper, 1989; Williams and Mavituna, 1992).
1.4 Research on plant cell culture in India
Inspired by the success of plant cell culture processes in Japan, Germany, and
U.S.A., a number of Indian companies have now seriously embarked on the research on
production of high value phytochemicals from plant cell and hairy root cultures. India
18
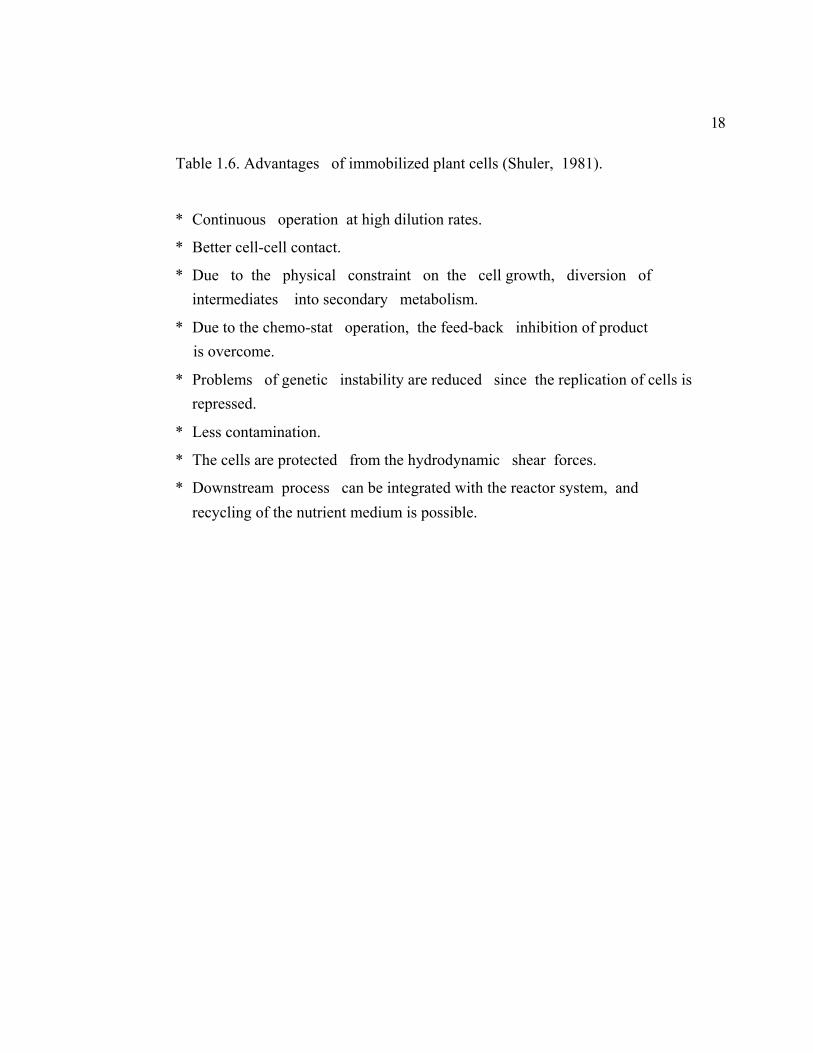
Table 1.6. Advantages of immobilized plant cells (Shuler, 1981).
* Continuous operation at high dilution rates.
* Better cell-cell contact.
* Due to the physical constraint on the cell growth, diversion of intermediates into secondary metabolism.
* Due to the chemo-stat operation, the feed-back inhibition of product is overcome.
* Problems of genetic instability are reduced since the replication of cells is repressed.
* Less contamination.
* The cells are protected from the hydrodynamic shear forces.
* Downstream process can be integrated with the reactor system, and recycling of the nutrient medium is possible.
19
has a vast flora of medicinal and aromatic plants and rich traditions of using herbal
medicines for treatment of various ailments. However, the scarce availability of plant
material made the Ayurvedic practices difficult. Realizing the untapped resource of the
germ plasm, several industrial, R&D and academic institutions in India launched a
number of projects on plant cell cultures. Dabur India Ltd., New Delhi projected the
commencement of a plant for the production of taxol, an anti-cancer drug, from the cell
cultures of Taxus spp. by the year 2000. Cipla Pharmaceuticals Pvt. Ltd., Bangalore is
striving hard to produce diosgenin and other steroids using the plant cell culture
technology. Dr. Reddy's Research Foundation, Hyderabad is similarly interested in taxol
and other medicinal compounds such as camptothesin. Central Institute of Medicinal
and Aromatic Plants, Lucknow has reported the successful culturing of hairy roots for
obtaining commercially important medicinal compounds (Banerjee et al., 1995;
Kukreja, 1996). The group at Regional Research Laboratory, Trivandrum has been
working on development of Catharanthus roseus to obtain anti-cancer drugs. Table 1.7
lists various institutions in India and their activities.
While the private sector mainly concentrated on medicinal compounds, Central
Food Technological Research Institute, Mysore pioneered the research on production of
food value metabolites from plant cell and hairy root cultures (Ravishankar and
Venkataraman, 1990). Saffron ingredients from Crocus sativus cell cultures,
anthocyanin from Daucus carota cell cultures, betalaines from hairy root cultures of
Beta vulgarίs and capsaicin from immobilized Capsicum spp cells are the few processes
at different levels of scale-up.
Plant cell cultures and the micropropagation of economically important plants
assume more importance in the wake of the new intellectual property regime.
1.5 Food additives from plant cell cultures
The technical feasibility of plant cell cultures has been demonstrated up to quite
large scales of operation. However, the focus has been mainly on the production of
20
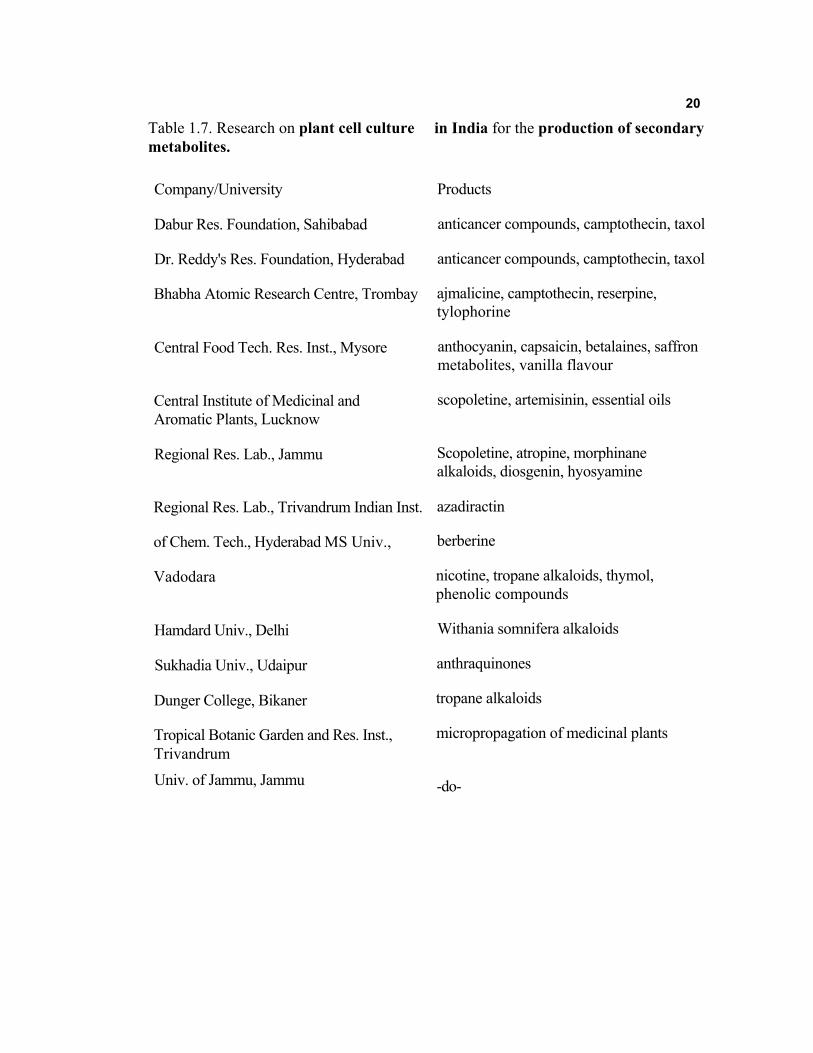
Table 1.7. Research on plant cell culture metabolites.
Company/University
Dabur Res. Foundation, Sahibabad
Dr. Reddy's Res. Foundation, Hyderabad
Bhabha Atomic Research Centre, Trombay
Central Food Tech. Res. Inst., Mysore
Central Institute of Medicinal and Aromatic Plants, Lucknow
Regional Res. Lab., Jammu
Regional Res. Lab., Trivandrum Indian Inst.
of Chem. Tech., Hyderabad MS Univ.,
Vadodara
Hamdard Univ., Delhi
Sukhadia Univ., Udaipur
Dunger College, Bikaner
Tropical Botanic Garden and Res. Inst., Trivandrum
Univ. of Jammu, Jammu
in India for the production of secondary
Products
anticancer compounds, camptothecin, taxol
anticancer compounds, camptothecin, taxol
ajmalicine, camptothecin, reserpine, tylophorine
anthocyanin, capsaicin, betalaines, saffron metabolites, vanilla flavour
scopoletine, artemisinin, essential oils
Scopoletine, atropine, morphinane alkaloids, diosgenin, hyosyamine
azadiractin
berberine
nicotine, tropane alkaloids, thymol, phenolic compounds
Withania somnifera alkaloids
anthraquinones
tropane alkaloids
micropropagation of medicinal plants
-do-

21
medicinal compounds. In view of the recent advancements in the bioreactor design,
bioprocess engineering, and the better understanding of in vitro physiology of plant
secondary metabolism, the cell culture technology can also be extended to compounds
of food applications (Ravishankar and Venkataraman, 1990). Table 1.8 lists some of the
potential food additives which can be produced from plant cell cultures. In vitro
production of food additives has been reviewed by many workers (Stafford, 1991; Knorr
et al., 1993; Singh, 1997). Plant cell cultures for food additives has received greater
attention in the recent years with the increasing concern about the safety of synthetic
food additives. Several synthetic food additives are being phased out. With the growing
population, to meet the demand, foods are processed for convenience into a variety of
products and an increasing number of additives are being used. About 2500 different
additives are added intentionally to foods to produce the desired effect (Branen, 1990).
Food additives produced by fermentation processes are generally considered safe.
Among the natural food colours, anthocyanins are the most extensively studied. In
view of the limited supply of these pigments, cell culture technique has been explored
by several workers for in vitro production (Yamamoto, 1984; Seitz and Hiderer, 1988;
Zhong et al, 1991; Rajendran et al, 1994). Similarly, capsaicin, a food additive for
pungency, is an another food related compound which has been studied extensively,
primarily because of its extracellular nature (Lindsey and Yeoman, 1984; Hau and
Yeoman, 1991; Sudhakar Johnson et al, 1990, 1991; Suvarnalatha et al, 1993;
Sudhakar Johnson and Ravishankar, 1996). A brief account of these two compounds is
given below.
Anthocyanin
After chlorophyll, anthocyanins are the most ubiquitous pigments seen nature.
Widely distributed in the pericarps of several fruits, flowers, and vegetables, these are
glycosylated polyhydroxy and polymethoxy derivatives of flavylium (2-
phenylbenzopyrylium) salts and belong to a group of compounds generically called

22
Table 1.8. Potential food additives for production from plant cell cultures (Updated from Ravishankar and Venkataraman, 1990).

23
flavonoids. Structurally, they are made up of two or three portions, the aglycone base, a
group of sugars, and a group of acyl acids. The aglycone moiety is referred to as
anthocyanindin. There are more than 15 anthocyanidins, (Francis, 1989) of which only 6
are more common (Fig. 1.4). The biosynthesis of anthocyanins follows the general
phenylpropanoid pathway (Ebel et ah, 1974) (Fig. 1.5).
While the anthocyanins are thought to have a limited physiological role in
pollination and seed dispersal, they are commercially very important pigments. They are
used for colouring a variety of food products including beverages. Anthocyanins are
known to have several pharmacological attributes such as anti-inflammatory, anti-ulcer
and wound healing properties (Vega et ah, 1987; Kochi and Hisashi, 1990).
The commercial source of these pigments is the grape peel. In view of the quoted
price of US $ 1200 - 1500 kg-1, and the estimated market of US $ 135 million (Ilker,
1987), plant cell culture as an alternative source of supply of these pigments has been
investigated all over the world.
Capsaicin
Capsaicin is the principle of pungency of the spice Capsicum and is possibly the
earliest food additive used, as reported in the early cultures of Mexico and northern
South America. The alkaloid, C18H29O3N, is the acid amide of vanillylamine and C9 –C11
isotype fatty acids. It is a colourless crystalline substance with severe burning
pungency. The proposed pathway for biosynthesis of capsaicin is by phenylpropanoid
metabolism via various hydroxylated cinnamic acids (Fig. 1.6).
Commercial capsaicin is often a mixture of capsaicin, dihydrocapsaicin and
norhydrocapsaicin. Capsaicin contents of various chilli varieties have been reported to
range from 0.2- 1.0% (Thirumalachar, 1967). Capsaicin, in the form of oleoresin or the
dried powder of red pepper, is used to for its pungency and colour in a variety of fresh
and processed foods. Besides, it is used as a counter irritant in lumbago, neuralgia and
rheumatic disorders. Capsaicin has been reported to have antibacterial (Gal, 1965) and

Figure 1.4. Common anthocyanidins.

Figure 1.5. Cinnamic acid metabolism and flavonoid biosynthesis (Luckner etal. 1977). Phenylpropanoid pathway: (Group I). 1. phenylalanine ammonia lyase 2. cinnamate 4-hydroxylase 3. 4-hydroxycinnamate 3-hydroxylase 4. cίnnamate-CoA ligase. Flavonoid pathway (Group II). 1*. flavanone synthase 2' chalcone-flavanone isomerase 3'. chalcone-flavanone oxidase 4*. glucosyltransferase 5'. apiosyltransferase 6'. UDP-apίose synthetase. Lignin pathway (Group III). 5. cinnamoyl-CoA reductase 6. aromatic aldehyde reductase
25
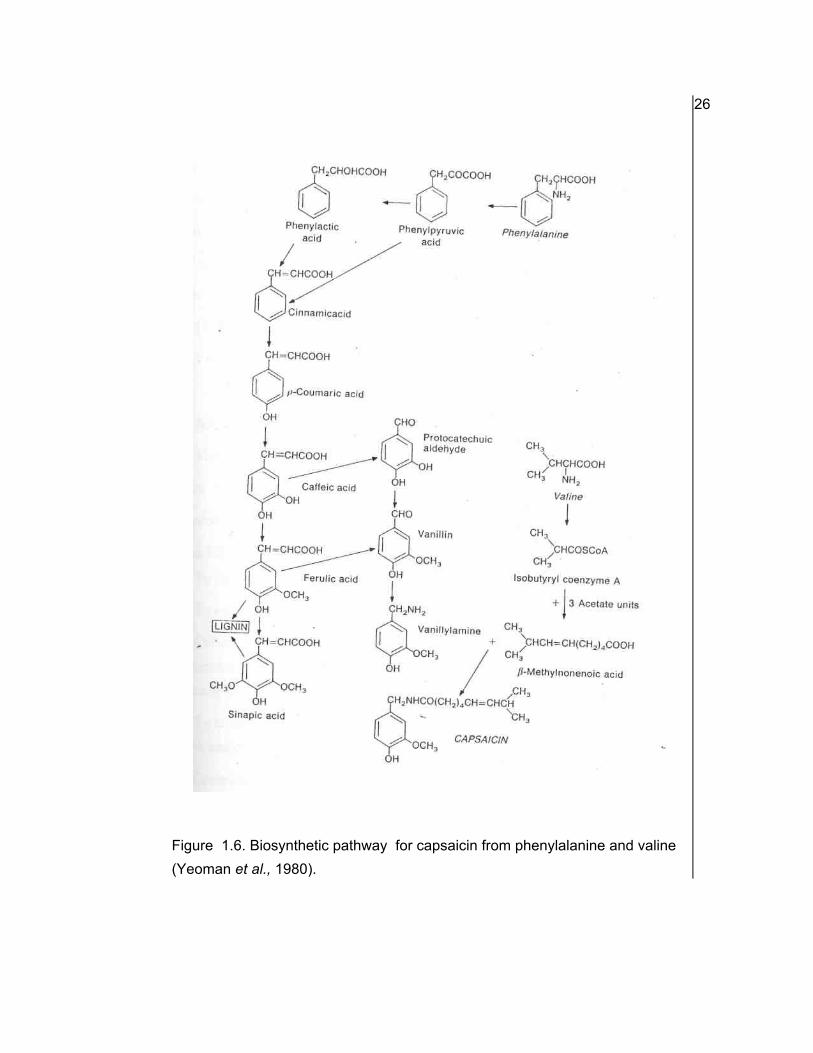
Figure 1.6. Biosynthetic pathway for capsaicin from phenylalanine and valine (Yeoman et al., 1980).
26

27
antifungal (Sim, 1964) activity. Gutsu et al. (1982) suggested that capsaicinoids may
function as immunity factors.
Commercial production of capsaicin by separation from the oleoresin and other
carotenoids involves several steps and the cost of production is high. A few groups in
the U.K. and Mexico have bee working on the possibilities of its production in vitro.
Due to its high demand in food and pharmaceutical industries and high price (approx.
US $ 1000 kg-1 ), the continuous production from immobilized cell cultures has been the
subject of intensive research.
1.6 Aim and objectives of the present study
The present investigation dealt with the studies on production of anthocyanin from
Daucus carota cell cultures, and capsaicin from immobilized cells of Capsicum
frutescens at shake flask, and lab scale reactor level. The specific objectives of the study
were as follows: * To develop a high yielding cell line of Daucus carota.
* To establish and maintain the cell suspension cultures of D. carota.
Optimization of process parameters of the cell culture process for anthocyanin production. The parameters included nutrient medium, hormonal supplementation, temp, pH, light, dissolved oxygen.
To study the kinetics of growth and production of anthocyanin by D. carota cells in suspension cultures.
Comparative evaluation of various methods for estimation of biomass in plant cell suspension cultures.
Growth, and production of anthocyanin from D. carota cells in bioreactor at 2 L level.
* Rheological characterization of the culture broth in bioreactor.
* Immobilization of Capsicum frutescens cells in alginate, and polyurethane foam matrices.
Studies on continuous production of capsaicin from immobilized C. frutescens cells using a suitable column reactor.

MATERIALS & METHODS

2.1 Initiation of callus cultures
2.2 Initiation and maintenance of cell suspension cultures
2.3 Sterility test
2.4 Viability assay
2.5 Few commonly used plant cell culture media
2.6 Estimation of buffer capacity
2.7 Cell aggregate separation
2.8 Estimation of biomass
2.9 Measurement of surface colour intensity
2.10 Estimation of glucose
2.11 Estimation of fructose
2.12 Estimation of sucrose
2.13 Estimation of nitrate
2.14 Estimation of ammonia
2.15 Estimation of phosphate
2.16 Measurement of conductivity
2.17 Measurement of osmolarity
2.18 Measurement of turbidity
2.19 Estimation of extracellular polysaccharides
2.20 Estimation of extracellular proteins
2.21 Assay of phenylalanine ammonia lyase
2.22 Stirred tank bioreactor
2.23 Measurement of oxygen consumption rate
2.24 Rheological studies
2.25 Estimation of anthocyanin
2.26 Identification of anthocyanidins
2.27 Immobilization of cells using alginate
2.28 Solubilization of alginate beads
2.29 Immobilization of cells using polyurethane foam
2.30 Packed-bed column reactor
2.31 Estimation of capsaicin
2.32 Preparation of elicitors

28
2.1 Initiation of callus cultures
Seeds of Daucus carota (carrot) and Capsicum frutescens Mill. IHR 1203 were
obtained from the Indian Institute of Horticultural Research, Bangalore. Selected seeds
were surface sterilized with mercuric chloride solution (0.1%, w/v) for 4 min and
washed several times with sterile distilled water to remove the traces of mercuric
chloride. Seeds were then aseptically transferred to sterile Petri plates containing
moistened Whatman No.l filter paper and allowed to germinate in dark. The one-
week-old seedlings were then transferred aseptically onto semi solid nutrient medium
containing Murashige and Skoog's (1962) salts supplemented with sucrose (3%, w/v),
myo-inositol (100 mg l-1), indole-3-acetic acid (IAA) (2 mg l-1) and kinetin (0.2 mg1-
1 ), in case of D. carota, and 2,4-dichlorophenoxyacetic acid (2,4-D) (2 mg1-1 ) and
kinetin (Kn) (0.5 mg1-1 ), in case of C. frutescens, solidified with agar (1%, w/w). The
pH of the medium was adjusted to 5.8 before autoclaving at 1.3 kg cm-2 for 20 min.
The cultures were incubated at 25 ± 2 °C under continuous light of 3000 lux using
40 W tubular fluorescent lamps (Philips India Ltd., Calcutta) as the source of light.
Callus which appeared after one week of transferring to the above medium was
allowed to grow for 3 weeks. The callus thus obtained was maintained by regular
subculturing at 3-week, and 2-week intervals for D. carota, and C. frutescens,
respectively.
2.2 Initiation and maintenance of cell suspension cultures
Callus tissues (approx. 4 g) were transferred to 40 ml of liquid medium of the
same composition described in section 2.1.1. but without the gelling agent in 150 ml
Erlenmeyer flasks. They were incubated on a rotary shaker (New Brunswick Scientific
Co., Inc., New Jersey) at 90 rpm under continuous light (3000 lux). The cell
suspensions were filtered through appropriate sieves to obtain single cells and few-
celled aggregates which were used as inoculum for subculture. Fine cell suspension
cultures were obtained by repetitive selection for small cell aggregates at

29
every stage of subculturing. The cell suspension cultures were maintained by periodic
subculturing at two-week intervals.
2.3 Sterility test
The sterility of the cell cultures was tested by using the Bacto-Fluid
Thioglycollate Medium (Difco Laboratories Inc., Michigan). The composition of the
medium is given in Table 2.1. The purpose of a small amount of agar in the liquid
medium was to support the growth of both aerobes and anaerobes without any seal or
other special precautions. Bacto-Fluid Thioglycollate Medium was rehydrated by
suspending 29.5 grams in 1 litre of distilled water and heated to boiling to dissolve the
medium completely. 10 ml of medium was distributed into screw cap tubes (20 x 45
mm) and sterilized by autoclaving at 1.3 kg cm-2 for 20 min. Cooled quickly to room
temperature. Culture suspension was inoculated with the help of a loop into the
screw cap tubes and incubated at 37 °C for 48 hours using temperature controlled
shaking water bath. Any turbidity of the medium was indicative of contamination.
Every culture was tested for sterility before subculturing.
2.4 Viability assay
A rapid method developed by Sudhakar et al (1996) was used to assess the
viability of cells. The method uses a mixture of calcofluor white and fluorescene
diacetate (FDA). Calcofluor, commercially available as Ranipal, was dissolved in MS
basal medium to get a concentration of 0.00625% and FDA stock solution was
prepared by dissolving 0.5 g in 100 ml of acetone. This stock solution was stored at -
4 °C. Before use, 0.1 ml of stock was diluted with 5 ml of culture medium and stored
in ice. Best results were obtained when used within an hour. The dye mixture was
prepared by adding one drop of diluted FDA solution to one drop of calcofluor white.
Approximately equal volumes of cell suspension and dye mixture were taken on a
microscope slide and observed after 2 min, under a Leitz Diaplan fluorescence
30
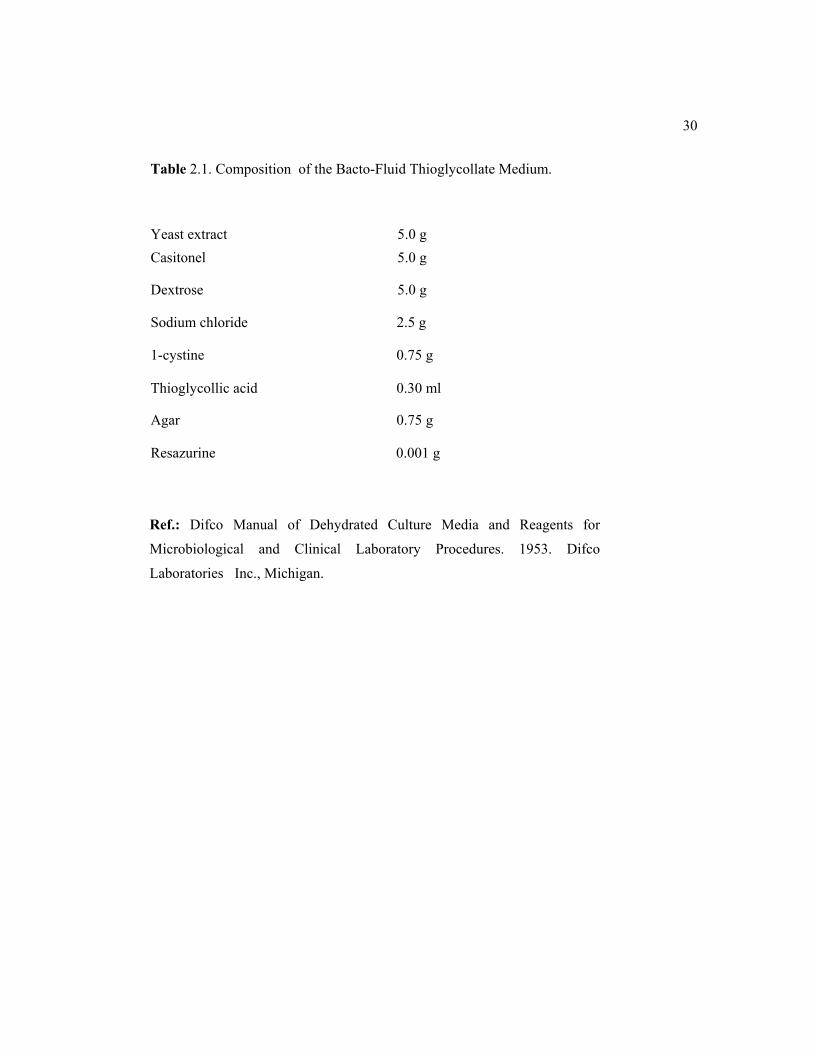
Table 2.1. Composition of the Bacto-Fluid Thioglycollate Medium.
Yeast extract 5.0 g
Casitonel 5.0 g
Dextrose 5.0 g
Sodium chloride 2.5 g
1-cystine 0.75 g
Thioglycollic acid 0.30 ml
Agar 0.75 g
Resazurine 0.001 g
Ref.: Difco Manual of Dehydrated Culture Media and Reagents for
Microbiological and Clinical Laboratory Procedures. 1953. Difco
Laboratories Inc., Michigan.

31
microscope fitted with two exciter filters, BP 340-380 and BP 450-490.
2.5 Few commonly used plant cell culture media
To investigate the physico-chemical properties of plant cell culture media, the
following twelve most commonly used nutrient media were selected for the study:
Hoagland and Arnon (1950) (H&A), Murashige and Skoog (1962) (MS), Eriksson
(1965) (ER), Gamborg et al. (1968) (B5), White (1963) (WS), Nitsch and Nitsch
(1969) (N&N), Schenk and Hildebrandt (1972) (S&H), Gresshoff and Doy (1974)
(DBM2), Hildebrandt (1977) (HTM), Anderson (1978) (A&R), Lloyd and McCown
(1981) (WPM), Litvay et al. (1985) (L&M). Liquid media were prepared as per the
composition given by the authors (Table 2.2). However, no phytohormones were
added. For uniformity sucrose was added at 3% (w/v) as the sole carbon source in all
the media.
2.6 Estimation of buffer capacity
Acid-base titration curves of few commonly used plant cell culture media were
plotted by measuring the changes in pH upon addition of small amount of H+ or OH-.
Buffer capacity was estimated from polynomial regression analysis of pH and H+ data
(Segel, 1976).
2.7 Cell aggregate separation
Cell aggregates were separated into six different size groups using test sieves of
mesh sizes 355, 500, 850, 1000, and 1500 µm.
2.8 Estimation of biomass
Biomass was measured as dry weight, after filtering out the cells from the liquid
medium, and drying at 60 °C for 24 hours in a hot air oven. In all the subsequent
Sections, unless otherwise specifically mentioned, 'biomass' refers to the dry cell


33
weight. The medium filtrate was used for the estimation of glucose, fructose, sucrose,
conductivity, and osmolarity.
2.9 Measurement of surface colour intensity
Surface colour intensity of cell aggregates of D. carota was measured in terms
of the red-green coordinate value of CIELAB Color Space (Nassau, 1993), using a
Shimadzu LISR-2100 Colour Measuring System. Barium sulphate was used a standard
for white.
2.10 Estimation of glucose
Glucose was estimated by the glucose oxidase and peroxidase method (Trinder,
1969). Glucose oxidase converts glucose to gluconic acid and hydrogen peroxide. The
peroxide in the presence of peroxidase forms a coloured complex of hydroxybenzoate
and 4-aminophenazone. The intensity of the colour formed is proportional to the
glucose level.
A kit of the enzymes, reagents, and the glucose standard obtained from Span
Diagnostics Pvt. Ltd., Surat, was used following the procedure prescribed by the
supplier.
2.11 Estimation of fructose
Fructose was estimated by measuring the reducing sugars using dinitrosalicylic
acid reagent (DNS method) (Miller, 1959) and subtracting the amount of glucose. The
DNS reagent contained 3,5-dinitrosalicylic acid (1%, w/v), phenol (0.2%, v/v), sodium
sulphite (1%, v/v), and sodium hydroxide (1%, w/v). The reagent was prepared by
placing all the solid components in a container and dissolving them simultaneously by
stirring with the required volume of sodium hydroxide solution. The reagent was stable
for about two weeks.
The colour tests were made with 3 ml aliquots of the reagent added to 3 ml of

34
appropriately diluted sample in 15 ml test tubes. The reagent blank received 3 ml
distilled water. The mixtures were heated for 5 min in a boiling water bath and then
cooled under running tap water to adjust to ambient temperature. The colour intensity
was measured at 575 nm. Glucose was used as standard for preparing calibration
curve.
2.12 Estimation of sucrose
Unutilized sucrose in the culture media was estimated by using the DNS method
after inversion by overnight incubation with 6N HC1 at room temperature. The
hydrolysed sample was neutralized with cone. NaOH solution and the volume was
made up to a known quantity (Herlich, 1990)
2.13 Estimation of nitrate
The nitrate concentration was determined as described by Greenberg et al.
(1992). 1 ml of NaCl (30%, w/v), and 5 ml of H2S04 (80%, v/v) were added to 5 ml
of appropriately diluted cell-free medium samples. The absorbance at 410 nm was
measured. 0.25 ml of brucine reagent (mixture of 1 g brucine and 0.1 g of sulphanilic
acid in 100 ml of dist. water) was added to this mixture. The resulting solution was
boiled for 20 min and the absorbance at 410 nm was measured again. The difference
in absorbances was used to estimate the concentration of nitrate by comparison with
solutions of known nitrate concentration treated identically. Potassium nitrate was used
as the standard.
2.14 Estimation of ammonia
The ammonia concentration in the liquid nutrient medium was determined using
the phenol-hypochlorite reaction following the method given by Weatherburn (1967).
Two reagents were prepared: A. 5 g of phenol with 25 mg of sodium nitroprusside
(sodium pentacyanonitrosyloferrite III) in 500 ml of dist. water. The reagent was

35
stored in amber bottle in refrigerator. B. 2.5 g of sodium hydroxide, and 4.2 ml of
sodium hypochlorite in 500 ml of dist. water.
5 ml of reagent A was added to 20 µl of appropriately diluted sample solution.
The test tubes were shaken vigorously and allowed to stand for 20 min covered with
parafilm. The absorbance was read at 625 nm against identically treated water blank.
The sensitivity of the method was about 0.5 µg of ammonia nitrogen. Ammonium
sulphate was used as standard.
2.15 Estimation of phosphate
Phosphate was measured as phosphorous by using molybdate reagent according
to the procedure given by Chen et al. (1956). The molybdate reagent was prepared as
follows: One volume of H2S04 (6N) was mixed with two volumes of distilled water
and one volume of ammonium molybdate solution (2.5%, w/v). Then one volume of
ascorbic acid (10%) was added and mixed well. The reagent was prepared fresh every
day.
Procedure: 4 ml of the molybdate reagent was added to 4 ml of appropriately diluted
sample (to contain up to 8 µg of phosphorous). The reagent blank contained 4 ml of
distilled water. The test tubes containing the reaction mixture were capped with
parafilm and incubated at 37 °C in a temperature controlled shaking water bath for 2
hours. After the incubation, the test tubes were allowed to cool and the absorbance
was read at 820 nm against the blank. The amount of phosphate in the sample was
calculated from a calibration graph plotted from the absorbances of solutions of
known phosphorous concentration. Dihydrogen potassium phosphate was used as the
standard.
2.16 Measurement of conductivity
The electrical conductivity was measured using a conductivity cell with cell
constant of 1.0 connected to a direct current conductivity metre model - LF54 (Wiss-
36
Techn-Werstatten, Weilheim). The conductivity was expressed in the units of mS
(milli Siemen).
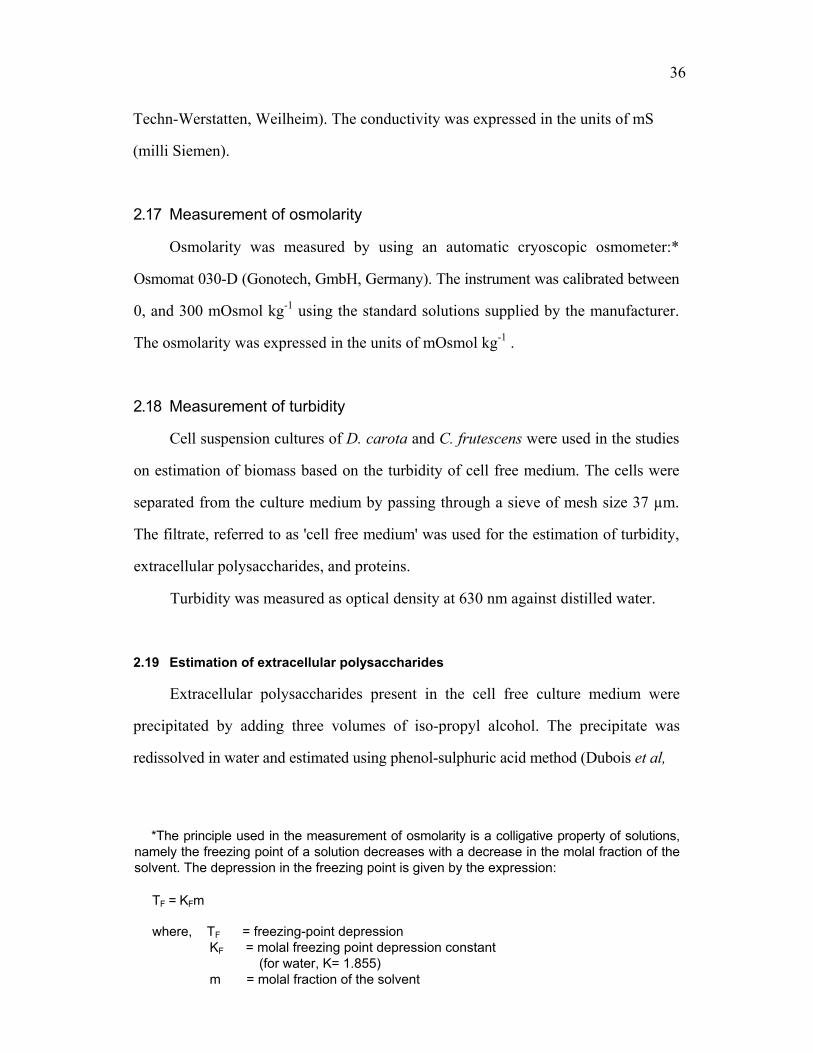
2.17 Measurement of osmolarity
Osmolarity was measured by using an automatic cryoscopic osmometer:*
Osmomat 030-D (Gonotech, GmbH, Germany). The instrument was calibrated between
0, and 300 mOsmol kg-1 using the standard solutions supplied by the manufacturer.
The osmolarity was expressed in the units of mOsmol kg-1 .
2.18 Measurement of turbidity
Cell suspension cultures of D. carota and C. frutescens were used in the studies
on estimation of biomass based on the turbidity of cell free medium. The cells were
separated from the culture medium by passing through a sieve of mesh size 37 µm.
The filtrate, referred to as 'cell free medium' was used for the estimation of turbidity,
extracellular polysaccharides, and proteins.
Turbidity was measured as optical density at 630 nm against distilled water.
2.19 Estimation of extracellular polysaccharides
Extracellular polysaccharides present in the cell free culture medium were
precipitated by adding three volumes of iso-propyl alcohol. The precipitate was
redissolved in water and estimated using phenol-sulphuric acid method (Dubois et al,
*The principle used in the measurement of osmolarity is a colligative property of solutions, namely the freezing point of a solution decreases with a decrease in the molal fraction of the solvent. The depression in the freezing point is given by the expression:
TF = KFm
where, TF = freezing-point depression KF = molal freezing point depression constant
(for water, K= 1.855) m = molal fraction of the solvent
37
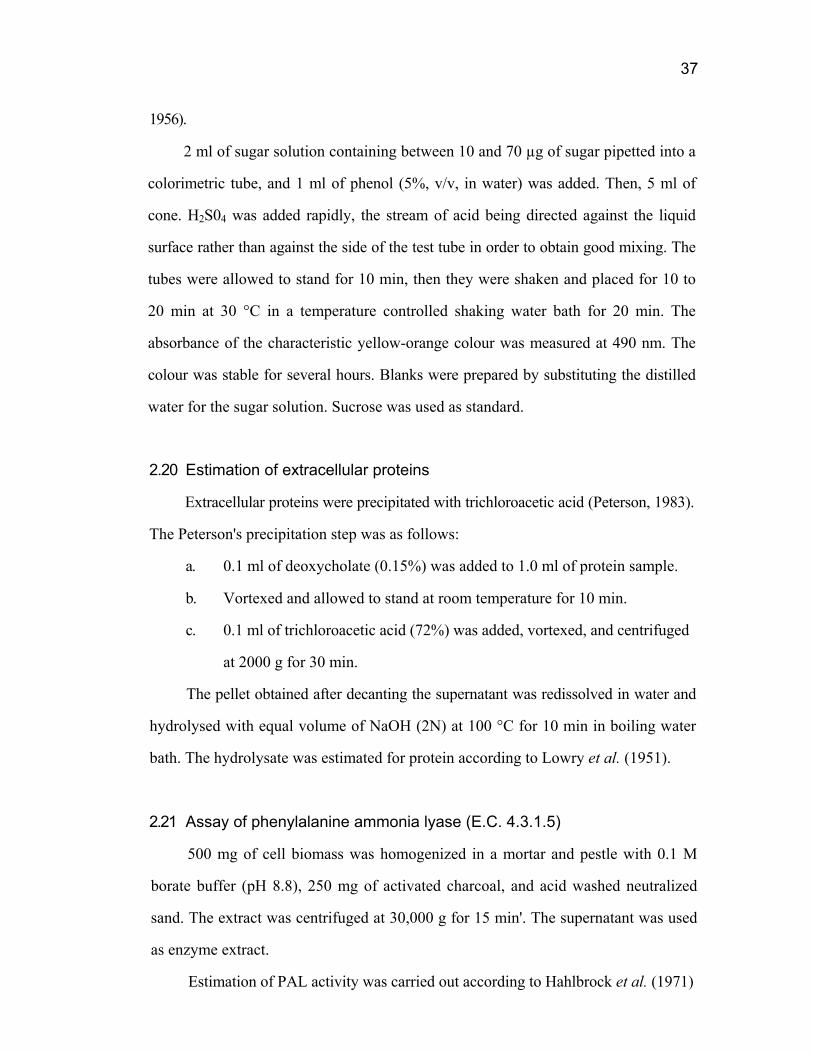
1956).
2 ml of sugar solution containing between 10 and 70 µg of sugar pipetted into a
colorimetric tube, and 1 ml of phenol (5%, v/v, in water) was added. Then, 5 ml of
cone. H2S04 was added rapidly, the stream of acid being directed against the liquid
surface rather than against the side of the test tube in order to obtain good mixing. The
tubes were allowed to stand for 10 min, then they were shaken and placed for 10 to
20 min at 30 °C in a temperature controlled shaking water bath for 20 min. The
absorbance of the characteristic yellow-orange colour was measured at 490 nm. The
colour was stable for several hours. Blanks were prepared by substituting the distilled
water for the sugar solution. Sucrose was used as standard.
2.20 Estimation of extracellular proteins
Extracellular proteins were precipitated with trichloroacetic acid (Peterson, 1983).
The Peterson's precipitation step was as follows:
a. 0.1 ml of deoxycholate (0.15%) was added to 1.0 ml of protein sample.
b. Vortexed and allowed to stand at room temperature for 10 min.
c. 0.1 ml of trichloroacetic acid (72%) was added, vortexed, and centrifuged
at 2000 g for 30 min.
The pellet obtained after decanting the supernatant was redissolved in water and
hydrolysed with equal volume of NaOH (2N) at 100 °C for 10 min in boiling water
bath. The hydrolysate was estimated for protein according to Lowry et al. (1951).
2.21 Assay of phenylalanine ammonia lyase (E.C. 4.3.1.5)
500 mg of cell biomass was homogenized in a mortar and pestle with 0.1 M
borate buffer (pH 8.8), 250 mg of activated charcoal, and acid washed neutralized
sand. The extract was centrifuged at 30,000 g for 15 min'. The supernatant was used
as enzyme extract.
Estimation of PAL activity was carried out according to Hahlbrock et al. (1971)

38
with a slight modification. The assay mixture contained 30 µ mole of borate buffer
(pH 8.8), 30 µ mole of 1-phenylalanine and 1 ml of appropriately diluted enzyme
extract in a total volume of 3 ml. Blank contained 1 ml of borate buffer instead of the
enzyme extract. The reaction mixture was incubated at 37 °C in a temperature
controlled shaking water bath for one hour. The concentration of t-cinnamic acid
formed was measured at 290 nm using a uv-visible spectrophotometer. The amount
of t-cinnamic acid formed was calculated using a standard calibration curve prepared
from the optical densities of different concentrations of t-cinnamic acid in borate
buffer. One unit of the enzyme activity was defined as 1 µg of t-cinnamic acid formed
per hour.
Protein was estimated according to Lowry et al. (1951) using bovine serum
albumin as the reference standard.
2.22 Stirred tank bioreactor
2.5 L stirred tank bioreactor (New Brunswick Scientific Co., Inc., New Jersey)
with flat blade (disc) turbine type impeller was used for culture of high yielding D.
carota cells. The reactor was of the standard configuration with direct coupled top
driven impeller (Fig. 3.31), and equipped with a polarographic dissolved oxygen
probe, pH electrode, and a foam level sensor. Different measurement and control units
of the bioreactor provided accurate control of the various process parameters such as
pH, DO, temp, and the foam level at their set points.
An electrically driven air compressor (Kirloskar Pneumatic Co. Ltd., Poona) with
a tank capacity of 100 L was used to supply air into the bioreactor. The pressure
inside the tank was maintained between a narrow range of 80 - 100 psi to reduce the
cyclic fluctuation in the air flow rate.
Sterile air was provided through polytetraflouroethylene (PTFE) membrane filters
(Sartorius Biotech (India) Pvt. Ltd., Bangalore). The pressure drop across the outlet
filter was negligible at air flow rates employed and consequently the culture broth

39
inside the bioreactor was at the atmospheric pressure.
The bioreactor was operated in batch mode with a culture period of 14 days. 2
1 of medium was inoculated with 35 g of cell from shake flasks. pH was maintained
at 5.5 and the temperature was maintained at 25 ± 2 °C. The dissolved oxygen level
was set at 40% of air saturation with a fixed air flow rate of 0.5 VVM. During the
culture, the foam was controlled by adding silicon anti-foam emulsion.
2.23 Measurement of oxygen consumption rate
The oxygen consumption rate (OCR) was measured as described by Srinivasan
et al. (1995). 500 mg of cells were placed in a 25 ml sample holder with 20 ml of
nutrient medium. The cells were kept in suspension by stirring with a magnetic bar.
Air was fed into the flask through a stainless steel needle until a constant dissolved
oxygen (DO) concentration was measured. The needle was removed and the unit was
quickly closed using a rubber stopper with a polarographic DO electrode (Ingold
Electrodes Inc., Masachussets) inserted through it. This procedure resulted in
displacing any remaining air in the sample holder. The decrease in DO concentration
due to uptake by the cells was monitored using the p02 measurement and control
module of 10 litre bioreactor (Bioengineering AG, Switzerland). The decrease in the
DO concentration was plotted against the time, and the oxygen uptake rate was
calculated from the slope of the curve. The measurement was carried out at room
temperature (22-25 °C).
2.24 Rheological studies
Samples were drawn from the bioreactor at intervals and analyzed for rheological
properties using the methodology followed by Bhattacharya and Bhat (1997).
The coaxial cylinder principle was adopted to obtain shear-rate and shear-stress
data. The ratio of the external diameter of the rotating bob to the internal diameter of
the stationary cylinder was 0.954. A Rheometer (Model No RT10, Haake GmbH,
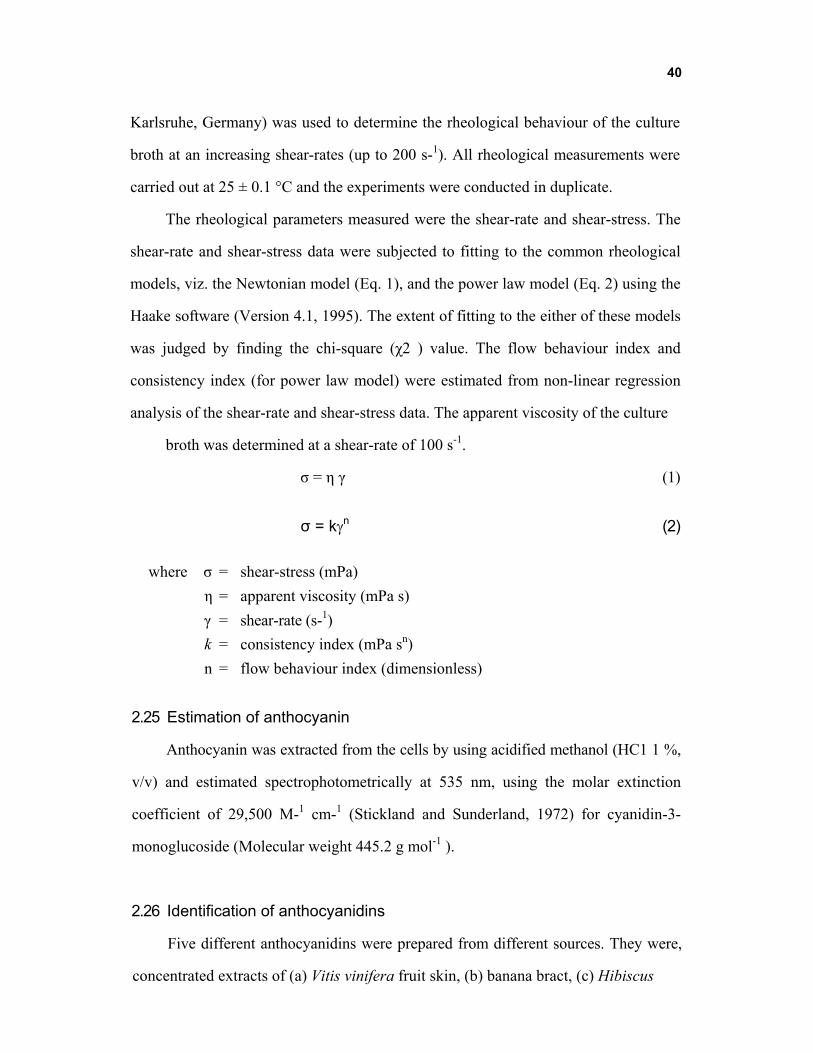
40
Karlsruhe, Germany) was used to determine the rheological behaviour of the culture
broth at an increasing shear-rates (up to 200 s-1). All rheological measurements were
carried out at 25 ± 0.1 °C and the experiments were conducted in duplicate.
The rheological parameters measured were the shear-rate and shear-stress. The
shear-rate and shear-stress data were subjected to fitting to the common rheological
models, viz. the Newtonian model (Eq. 1), and the power law model (Eq. 2) using the
Haake software (Version 4.1, 1995). The extent of fitting to the either of these models
was judged by finding the chi-square (χ2 ) value. The flow behaviour index and
consistency index (for power law model) were estimated from non-linear regression
analysis of the shear-rate and shear-stress data. The apparent viscosity of the culture
broth was determined at a shear-rate of 100 s-1.
σ = η γ (1)
σ = kγn (2)
where σ = shear-stress (mPa)
η = apparent viscosity (mPa s)
γ = shear-rate (s-1)
k = consistency index (mPa sn)
n = flow behaviour index (dimensionless)
2.25 Estimation of anthocyanin
Anthocyanin was extracted from the cells by using acidified methanol (HC1 1 %,
v/v) and estimated spectrophotometrically at 535 nm, using the molar extinction
coefficient of 29,500 M-1 cm-1 (Stickland and Sunderland, 1972) for cyanidin-3-
monoglucoside (Molecular weight 445.2 g mol-1 ).
2.26 Identification of anthocyanidins
Five different anthocyanidins were prepared from different sources. They were,
concentrated extracts of (a) Vitis vinifera fruit skin, (b) banana bract, (c) Hibiscus

41
flowers, (d) Solanum melangena, (e) Ipomea tricolour. The anthocyanidins of these
species are well documented (Ribereau-Gayon, 1959; Simmonds, 1954; Lowry, 1976;
Harborne, 1967a; Asen et al, 1977). Malvidin-3-glucoside, in a partially purified
form, was obtained as a gift sample from Dr. Geza Hrazdina, Cornell University, PA.
The extraction and concentration of pigments from these standards were done as
described for cells.
Sample preparation
The identification of anthocyanidins in cell extract and standards were performed
after acid hydrolysis (Francis, 1982). 4 ml of HC1 (2N) was added to 1 ml of the
above extracts. The mixture was boiled at 100 °C in a water bath for 35 minutes for
complete hydrolysis. After cooling, the mixture was extracted with ether to remove
any carboxylic acids. To the aqueous solution, 2 ml of amyl alcohol was added and
mixed thoroughly to extract the pigment. The upper amyl alcohol layer which
contained the anthocyanidins was removed and dried on a watch glass. One ml of
HPLC grade methanol was added to this and centrifuged at 5000 x g to remove any
undissolved particles. These samples were then used for identification.
Identification
Identification of anthocyanidins was performed based on the retention times in
high performance liquid chromatography (HPLC) adopting the procedure described by
Wilkinson et al. (1977) with a minor modification. Shimadzu high performance liquid
chromatograph (CR-7A) was used with C18 column (3.9 x 300 mm; pore size 10 µ)
(µ-Bondapak, Waters). Methanol-acetic acid-water (70:10:20) was used as the mobile
phase at a flow rate of 1.5 ml min-1. Detection was done using a SPD-10A UV-visible
detector at 530 nm. The peaks were recorded in CR7A chromatopac. Retention times
of anthocyanidins, obtained from various sources as given in Section 2.26, were
compared with those of cell extract.

42
2.27 Immobilization of cells using alginate
Sodium alginate (Sigma Chemical Co., USA) was dissolved in hot distilled water
(1.5%, w/v) and sterilized at 1.3 kg cm-2 for 20 min. The cells at the end of log
growth phase in suspension cultures were separated from the medium by filtration and
suspended in the sterile sodium alginate solution, and mixed well to get a
homogeneous suspension. The suspension was then extruded into CaCl2. 2H20 (1.35 g
in 150 ml water) through sterilized glass tubes of 4 mm diameter. After 30 min of
incubation, the resulting beads were washed thoroughly with sterile distilled water to
remove the traces of calcium chloride before packing into the column reactor.
2.28 Solubilization of alginate beads
The alginate beads immobilizing the cells were solubilized by the method
described by Jones and Veliky (1981). The beads were suspended in a suitable volume
of potassium phosphate buffer (0.1 M; pH 7.5) and agitated at 90 rpm for 1 h on a
rotary shaker. Cells were sedimented by centrifugation for 5 min at 100 rpm. A higher
centrifugation resulted in sedimentation of insoluble calcium phosphate. The cloudy
supernatant was removed with a Pasteur pipette and the cells were recovered for
estimation of dry weight.
2.29 Immobilization of cells in polyurethane foam
Polyurethane foam (PUF) of 2 cm thickness was cut in to discs of 5.5 cm
diameter. The PUF discs were washed thoroughly with Teepol to remove the traces
of monomers. The discs were incubated with the culture medium to load the cells into
the foam. After two weeks of incubation, the PUF discs loaded with the cells were
packed aseptically into the glass column reactor. The cell loading was estimated as
follows:
Few discs loaded with the cells were taken out and the excessive cell biomass
grown on the surface of the PUF disc was scrapped off. The PUF discs along with the

43
cells were dried at 60 °C for 24 hours in a hot air oven. The increase in the weight of
the PUF disc was a measure of the dry weight of the cells loaded into the PUF disc.
Fresh weight of the cells loaded into the PUF disc was calculated using the dry weight
to fresh weight ratio.
2.30 Packed-bed column reactor
PUF discs loaded with C. frutescens cells were aseptically packed into a glass
column reactor of 1 1 volume (Fig. 3.41). The liquid nutrient medium was sprayed
onto the PUF bed through a nozzle at a constant flow rate of 25 ml hour-1 using a
peristaltic pump. Sterile air was bubbled from a port located at the bottom of the glass
column.
The effluent medium was collected at the downstream and analyzed for
capsaicin.
2.31 Estimation of capsaicin
Capsaicin from culture medium was extracted with two volumes of ethylacetate
in a separating funnel and the upper portion was collected and dried using a flash
evaporator. The resultant residue was redissolved in ethylacetate to give an appropriate
concentration for subsequent estimation.
Capsaicin was estimated by paper chromatography as described by Govindarajan
and Anantha Krishna (1974). Extracts were spotted on Whatman No. 1
chromatographic strips (4.5 x 20 cm). The strips were developed by ascending
chromatography in methanol: buffer (60 : 40) solvent system. The buffer solution was
prepared by mixing 3.1 g of boric acid and 3.7 g of potassium chloride in 750 distilled
water and the pH was adjusted to 9.6 using 0.1N NaOH and the final volume was
made up to 1000 ml. After the solvent moved up to 17 cm, the strips were taken out
and allowed to dry at room temperature. The dried strips were passed uniformly and
quickly through 0.1% (w/v) Gibb's reagent (2,6-dichloro-p-benzoquinone-4-

chlorimine) in ethyl acetate. Capsaicin became visible as a blue spot near the solvent
front (Rf 0.8 - 0.9). The colour was further developed by mild spray with buffer on
both sides of the paper. The strips were dried in the dark for 30 min for full colour
development.
The blue spots of were cut and eluted in 10 ml of ethanol in the dark and the
intensity of colour was measured at 615 nm against a reagent blank from the
corresponding area of the strip run simultaneously without sample. The amount of
capsaicin in the sample was calculated from a calibration curve prepared by using the
standard capsaicin (Sigma Chemical Co., USA).
2.32 Preparation of elicϊtors
Aspergillus niger cultures, obtained from the Food Microbiology Department of
C.F.T.R.I., Mysore, were maintained on potato dextrose agar (PDA) medium and were
grown in Bacto Czapek Dox liquid broth (Difco Laboratories, Inc., Michigan). The
PDA medium was prepared by boiling sliced potatoes (200 g) in water till they were
soft. Filtrate was diluted to 1000 ml with water. Dextrose was added (2%, w/v) prior
to the adjustment of pH to 5.5 using tartaric acid.
Ten-day-old cultures of A. niger from the liquid medium were harvested. The
mycelium was separated from the medium. Twenty grams of mycelium was ground
at room temperature and extracted in distilled water. The extract was centrifuged at
400 x g for 15 min. The supernatant fraction was made up to 200 ml and used as the
elicitor. The elicitor concentration was expressed as g equivalent of mycelium. The
extract was stored at 0 °C till use.

RESULTS
3.1 Initiation of cell cultures of Daucus carota and Capsicum frutescens
3.2 Growth profile of the primary cultures of D. carota
3.3 Formation of anthocyanin in the primary cultures
3.4 Some physico-chemical properties of plant cell culture media
3.5 Influence of basal media on growth and formation of anthocyanin
3.6 Influence of hormones on growth and formation of anthocyanin
3.7 Development of a high yielding cell line of D. carota
3.8 Growth profile of the high yielding cell line
3.9 Formation of anthocyanin
3.10 Influence of pH on growth and formation of anthocyanin
3.11 Influence of temperature
3.12 Optimum inoculum density
3.13 Size distribution of cell aggregates of D. carota
3.14 Anthocyanin content in different size cell aggregates
3.15 Surface colour intensity in different size cell aggregates
3.16 PAL activity in different size cell aggregates
3.17 Consumption of sugars in D. carota and C. frutescens cell cultures
3.18 Consumption of ammonia and nitrate
3.19 Consumption of phosphate
3.20 Changes in the medium conductivity
3.21 Changes in osmolarity of the medium
3.22 Estimation of biomass based on osmolarity
3.23 Extracellular polysaccharides and proteins in the culture media
3.24 Estimation of biomass based on the turbidity of cell-free culture medium
3.25 Effect of filter mesh size on the estimation of biomass
3.26 Production of anthocyanin in stirred tank bioreactor
3.27 Oxygen consumption rate of D. carota and C. frutescens cells
3.28 Rheological characteristics of D. carota culture broth
3.29 Characterization of anthocyanins
3.30 Production of capsaicin using bubble column reactor
3.31 Entrapment of C. frutescens cells in polyurethane foam
3.32 Production of capsaicin using packed-bed reactor
3.33 Enhancement of capsaicin production with fungal elicitor
45
3.1 Initiation of cell cultures
Seeds of Daucus carota and Capsicum frutescens germinated within a week upon
implanting on moistened filter paper. The excised seedlings gave rise to callus upon
transferring onto semi-solid medium containing MS salts (Murashige and Skoog, 1969)
with sucrose (3%, w/v) supplemented with indole-3-acetic acid (2 mg 1-1) and kinetin
(0.2 mg 1-1 ) for D. carota; 2,4-dichlorophenoxyacetic acid (2 mg 1-1) and kinetin (0.5
mg 1-1 ) for C. frutescens. Callus of D. carota was friable and green in colour with
zones of pigmented cells, while the callus of C. frutescens was friable and white (Fig.
3.1). Callus cultures of D. carota with intense colour were established by repeated
selection and subculturing of highly pigmented cell clusters (Fig. 3.2).
Suspensions of cells were obtained by transferring the calli of C. frutescens and
D. carota into the liquid medium of the same composition as the semi-solid medium
except the gelling agent. Fine cell suspension cultures were established by repeated
selection and subculturing of small cell aggregates (Fig. 3.3).
3.2 Growth profile of primary cultures of D. carota
A time course study of the accumulation of biomass in primary cell cultures of
D. cαrotα showed a non-sigmoidal growth curve (Fig. 3.4). The growth cycle consisted
of a lag phase of about 3 days followed by a linear increase in the biomass for over
12 days. The biomass remained stationary for the next five days. The increase in the
biomass was about 11.5 fold over the initial inoculum. The average dry weight to
fresh weight ratio was around 0.08 and it decreased slightly with the progress in
culture age. At the end of three weeks, the cell density reached to a maximum of 8.7 g
dry weight 1-1 . Even though the inoculum contained small cell aggregates, the cells
grew into large clumps by the end of the culture period. However, the tendency to
grow into large clumps gradually decreased with the repeated selective subculturing
of small cell clusters.

Figure 3.1a. Primary culture of Daucus carota with pigmented zones of cells.
Figure 3.1b. Callus and cell suspension cultures of
Capsicum frutescens.
46

Figure 3.2. High anthocyanin yielding cell line of Daucus carota.
47
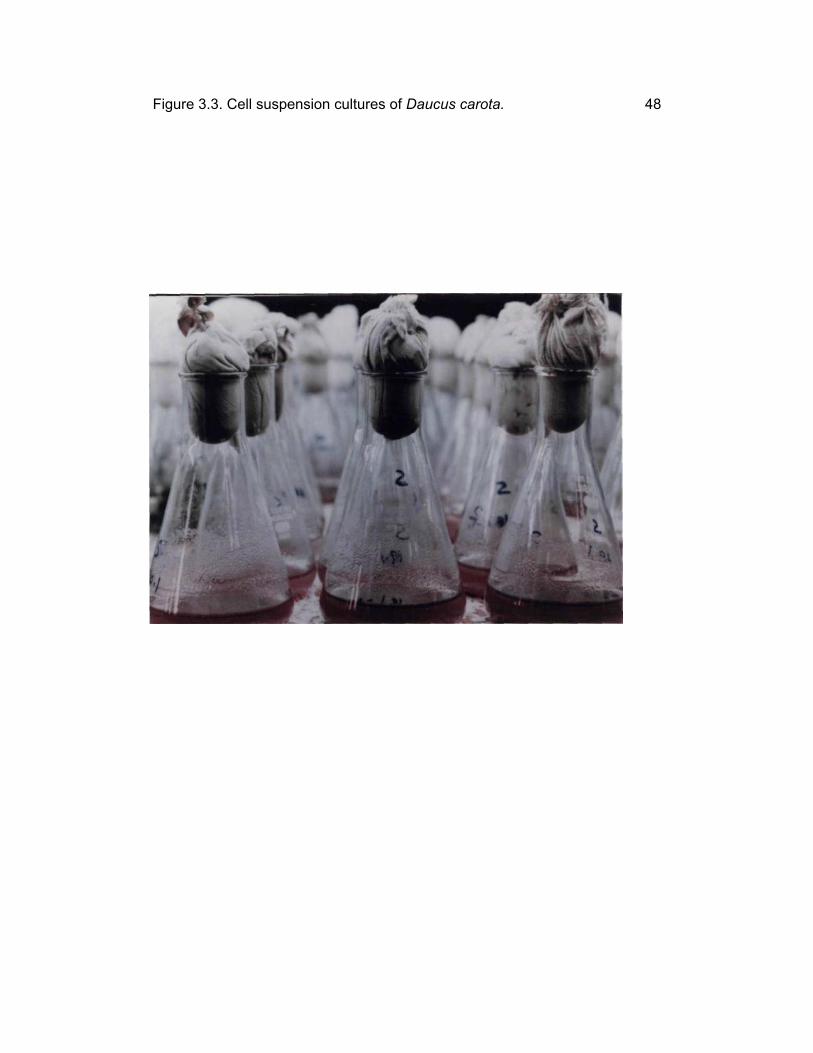
Figure 3.3. Cell suspension cultures of Daucus carota. 48
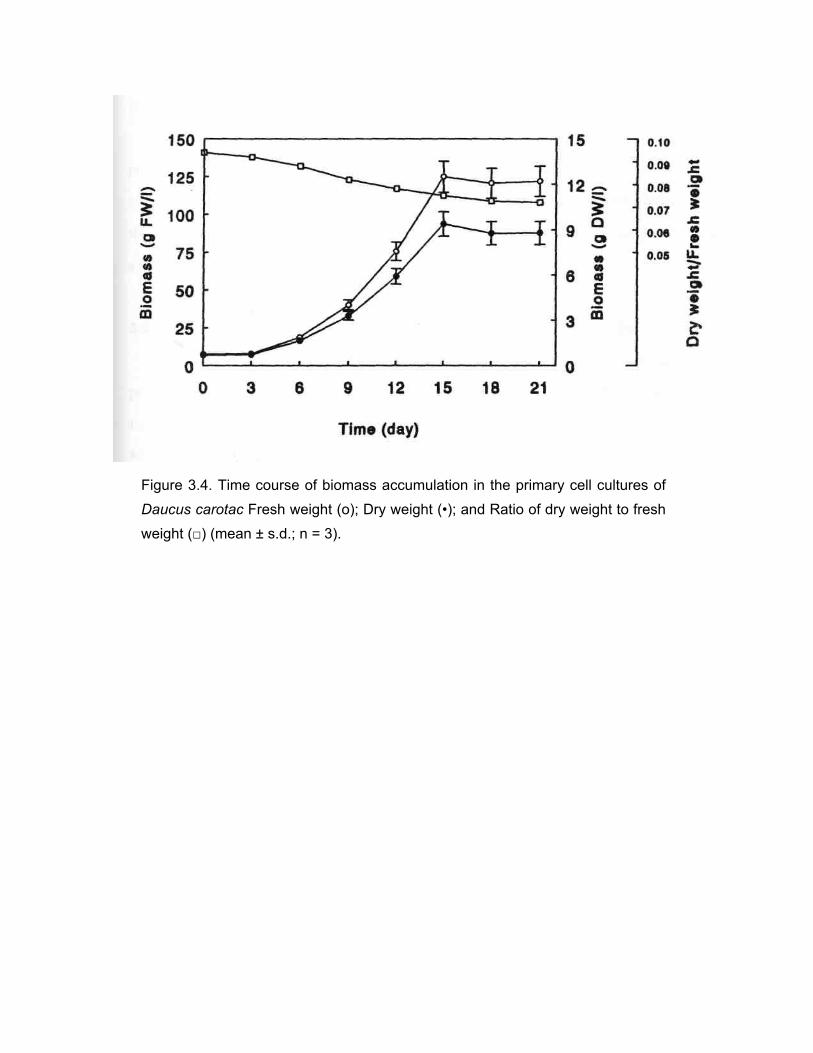
Figure 3.4. Time course of biomass accumulation in the primary cell cultures of Daucus carotac Fresh weight (o); Dry weight (•); and Ratio of dry weight to fresh weight (□) (mean ± s.d.; n = 3).

50
3.3 Formation of anthocyanin in the primary cultures
A time course study of anthocyanin formation showed a non-growth associated
pattern in the primary cell cultures of D. carota (Fig. 3.5). The anthocyanin content
was nearly constant for the initial 15 days and increased rapidly at the onset of
stationary phase. A maximum anthocyanin content of 7.2% (w/w, on dry weight basis)
was observed on day 18.
As a result of the near constant content, the time course of anthocyanin
production paralleled the growth curve for the initial ten days. However, with the
sudden increase in the anthocyanin content before the onset of the stationary phase,
there was a corresponding rapid increase in the productivity of anthocyanin. There was
a total production of 0.6 g 1-1 anthocyanin over a period of 18 days.
3.4 Some physico-chemical properties of plant cell culture media
In order to quantify and understand the biological effects of physico-chemical
properties, osmolarity, conductivity, buffer capacity, and the solubility of oxygen of
twelve commonly used plant cell culture media were investigated. (See section 2.5 of
Materials and Methods for the list of media selected for the study).
Conductivity
Considerable differences were recorded for conductivity of various media studied
(Table 3.1). While a high conductivity, in general, indicates a high ionic strength, it
was not possible to estimate the absolute value of ionic strength because of the
differential equivalent conductances of the compounds. It may be inferred from Table
3.1 that the ionic strength of the different nutrient media studied is as follows: ER >
L&M > MS > B5 > SH > DBM2 > N&N > WPM > HTM > A&R > H&A >WS.
Osmolarity
The osmolarity of different plant cell culture media studied showed considerable

Figure 3.5. Time course of anthocyanin formation in the primary cell cultures of Daucus carota: Biomass (•); Anthocyanin content (o); and Anthocyanin production (□) (mean ± s.d.; n = 3).
51

52
Table 3.1. Some physico-chemical properties of few commonly used plant cell culture media.
"See text for abbreviations. "Buffer capacity is the amount of alkali required to change the pH by one
unit at pH 5.5 (i.e. pH 5.5 to 6.5) at 25 'C.

53
differences as seen with the conductivity values (Table 3.1). The values of the osmotic
strengths of all the plant cell culture media deviated from those of the calculated
values of George et al. (1987).
Buffer capacity
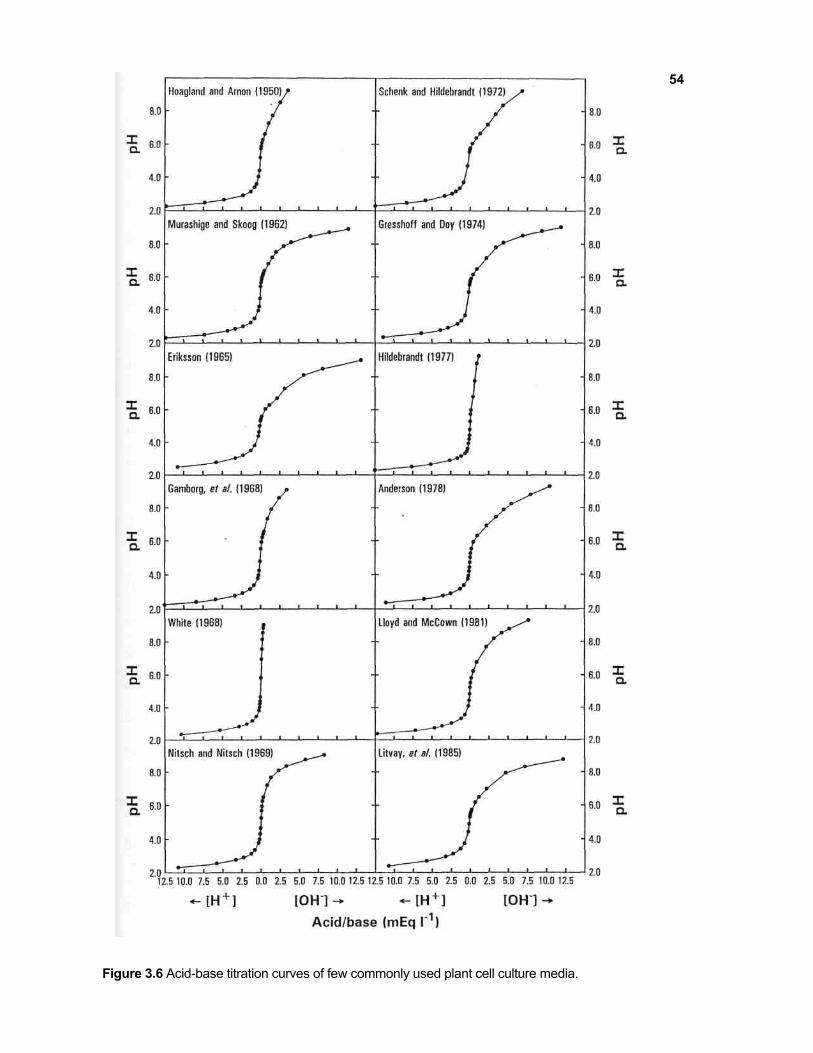
All the nutrient media studied showed a poor buffer capacity. Figure 3.6 shows
the acid-base titration curves of plant cell culture media studied. Eriksson's medium
(1965) exhibited the highest buffer capacity (156 µmole l-1 at pH 5.5) which was
comparable to that of 11.23 mM acetate buffer. On the other hand, the buffer capacity
of White's medium was lowest which was comparable only to that of 0.6 mM acetate
buffer. As can be seen from Table 3.1, the buffer capacities of different media were
as follows: ER > A&R > L&M > SH > DBM2 > MS > WPM > H&A > B5 > HTM >
N&N > WS.
Solubility of oxygen
The solubility of oxygen in the various cell culture media studied ranged
narrowly from 7.01 - 7.79 mg l-1 (Table 3.1), corresponding to 87 - 96% of the
solubility in distilled water. Because of a phenomenon called 'salting out,' slightly less
oxygen dissolved in plant cell culture media than in water due to the presence of salts
and non-electrolytes such as sucrose.
The present study generated data on some physico-chemical properties of few
commonly used plant cell culture media which would be useful in bioprocessing and
in the selection of basal media for plant cell and tissue cultures.
3.5 Influence of basal media on growth and formation of anthocyanin
Four commonly used basal media were tested for their support of biomass
accumulation and anthocyanin production in the cell cultures of D. carota. They were
Murashige and Skoog (1962) (MS), Linsmaier and Skoog (1965) (LS) Gamborg, et
54
Figure 3.6 Acid-base titration curves of few commonly used plant cell culture media.

55
al. (1968) (B5), and Schenk and Hildebrandt (1972) (S&H). Liquid media were
prepared as per the composition given by the authors with IAA (2 mg 1-1 ) and kinetin
(0.2 mg 1-1 ). For uniformity, sucrose was added at 3% (w/v) as the source of carbon
in all the media.
Of the four media studied, MS was found to be the best in terms of both the
growth and anthocyanin content (Fig. 3.7). Fhe biomass accumulation was 20% more
with MS salts compared to that with SH salts, while LS and B5 salts supported still
less growth.
Anthocyanin content was considerably high (7.2%, w/w) in MS medium
compared to that in all the other three media studied which ranged form 5.6 to 6.2%
(w/w).
3.6 Influence of hormones on growth and formation of anthocyanin
Four auxins, viz., 2,4-dichlorophenoxyacetic acid (2,4-D), indole-3-acetic acid
(IAA), α-naphthaleneacetic acid (NAA), and indole-3-butyric acid (IBA), and two
cytokinins, viz., kinetin (6-furfurylaminopurine) and 6-benzylaminopurine (BAP), were
studied to determine the optimum level of hormones for the maximum production of
anthocyanin. Prior to commencement of the experiment, the cells were maintained in
hormone free MS basal medium to minimize the hormonal carry over effect. Each
auxin was used singly at four concentrations: 0.1, 0.5, 1.0, and 2.0 mg 1-1 .
2,4-D showed dose dependant increase in the biomass in the concentration range
studied (Fable 3.2). However, the presence of 2,4-D was inhibitory to anthocyanin
biosynthesis as the content was lower than that in the control cultures.
On the contrary, IAA treated cultures showed increased anthocyanin production.
There was a slight increase in the biomass accumulation with the increase in IAA
concentration.
Both NAA and IBA did not show any significant effect (P>0.05) on growth as
compared to the control cultures. However, the anthocyanin content of the NAA
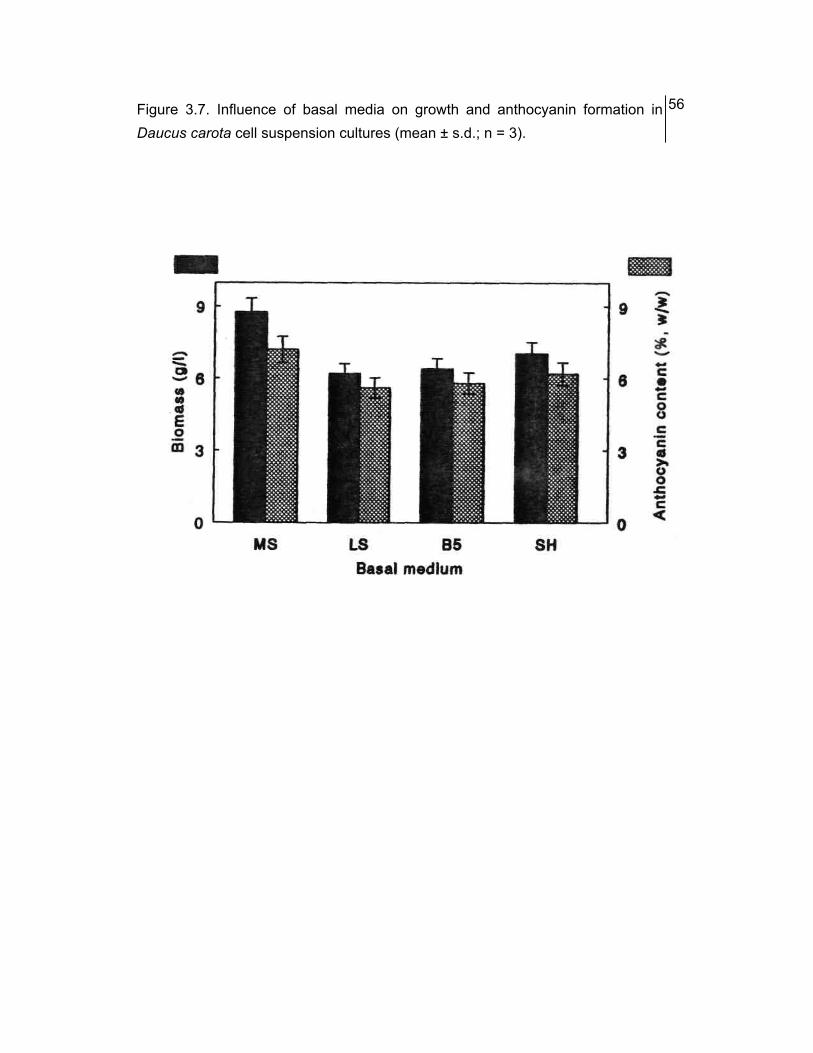
Figure 3.7. Influence of basal media on growth and anthocyanin formation in Daucus carota cell suspension cultures (mean ± s.d.; n = 3).
56

57
Table 3.2. Influence of auxins on growth, and formation of anthocyanin in Daucus carota
cells in suspension cultures.
'Mean ± S.D.; n = 5.
"Control. MS basal medium supplemented with sucrose (3%, w/v).

58
treated cultures was comparable to that of IAA treated ones, while IBA did not show
any significant effect (P>0.05) as compared to the control cultures.
Table 3.3 summarizes the effect of cytokinins, kinetin and BAP, at four
concentrations: 0.1, 0.5, 1.0, and 2.0 mg l-1. Kn at 0.1, 0.5, and 1.0 mg l-1
concentrations resulted in enhanced yield of anthocyanin. However, further high
concentration of kinetin was inhibitory to anthocyanin biosynthesis. Kn did not show
significant effect (P>0.05) on biomass accumulation. Neither biomass accumulation
nor the anthocyanin content was significantly affected by the addition of BAP
(P>0.05).
In another experiment with combined addition of IAA, and Kn, the combination
of IAA at 2.0 mg 1-1 and kinetin at 0.2 mg 1-1 was found to be the optimum hormonal
supplementation required for the maximum anthocyanin production (Fig. 3.8).
3.7 Development of a high yielding cell line of D. carota
A high yielding cell line of D. cαrotα was developed by repetitive selection for
high anthocyanin containing cell clusters (Fig. 3.9). The selection was performed for
over fifty subcultures spanning about two years. The size distribution of the cell
aggregates was controlled by repeated selection for small cell aggregates.
3.8 Growth profile of D. carota cell cultures
A time course study of biomass accumulation in the high yielding D. cαrotα cells
in suspension cultures recorded a typical sigmoidal growth curve (Fig. 3.10). The
growth curve consisted of a lag phase of about 2 days followed by an exponential
increase in the biomass. Log-linear plot of biomass (Fig. 3.10) estimated the specific
growth rate to be 0.217 day which corresponds to a doubling time of 3.2 day.
Accumulation of biomass came to stationary on the 15th day with a maximum cell
density of 18.92 ± 1.17 g dry weight l-1. The growth index was 12.2 which is slightly
higher as compared to that of the primary cultures. The average dry weight to fresh

59
Table 3.3. Influence of cytokinins on growth, and formation of anthocyanin in Daucus
carota cells in suspension cultures.
'Mean ± S.D.; n = 5.
"Control. MS basal medium supplemented with sucrose (3%, w/v).

Figure 3.8. Influence of IAA and Kinetin on growth and anthocyanin formation in Daucus carota cell suspension cultures: Control (0); 1 mg I"1 IAA + 0.1 mg I"1 kn (1); 2 mg I"1 IAA + 0.2 mg I"1 kn (2); and 2 mg I"1 IAA + 0.5 mg I"1 kn (3) (mean ± s.d.; n = 3).

Figure 3.9. Improvement of anthocyanίn content in Daucus carota cell cultures by repetitive selection for high anthocyanin containing cell clusters.
61
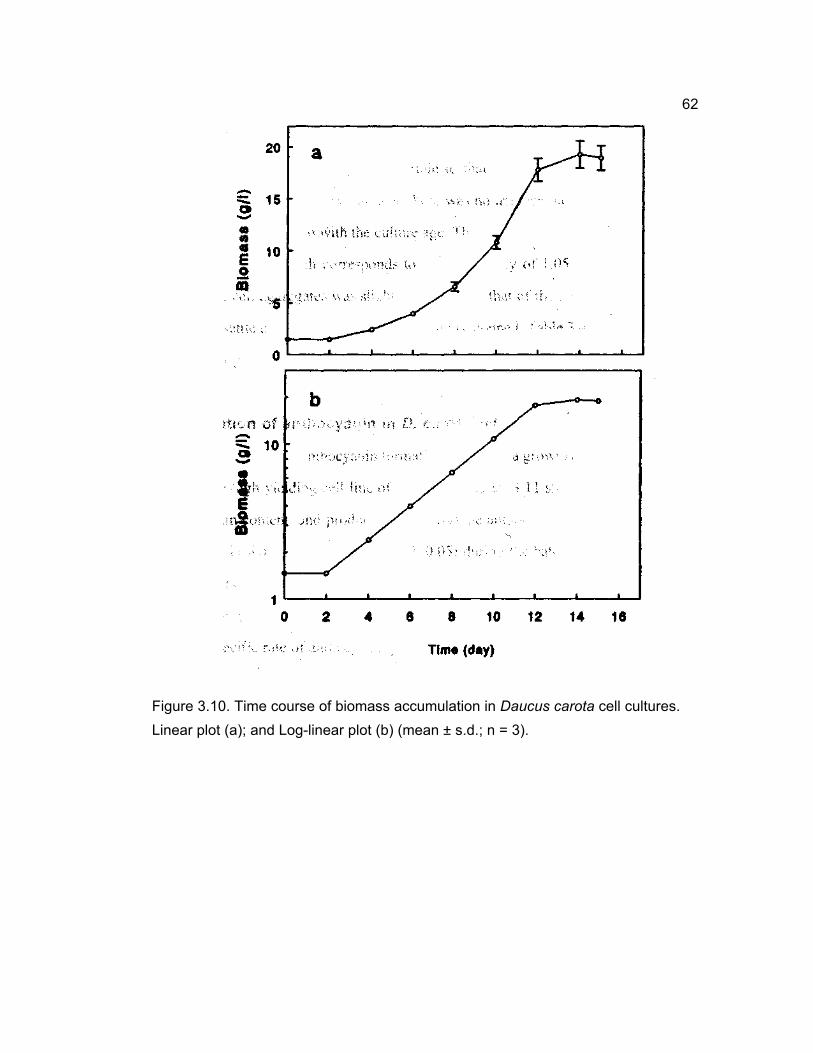
62
Figure 3.10. Time course of biomass accumulation in Daucus carota cell cultures. Linear plot (a); and Log-linear plot (b) (mean ± s.d.; n = 3).

63
weight ratio was 0.85 which was comparable to that in the early primary cultures.
However, unlike in the primary cultures, there was no appreciable change in the dry
weight to fresh weight ratio with the culture age. The packed volume of cells was 0.95
ml g-1 fresh weight, which corresponds to a mass density of 1.05 g ml-1 . Since the
density of the cell aggregates was slightly higher than that of the culture medium, the
cells used to settle down slowly when the mixing is stopped. Table 3.4 lists the kinetic
parameters of growth.
3.9 Formation of anthocyanin in D. carota cell cultures
The time course of anthocyanin formation suggested a growth associated product
pattern in the high yielding cell line of D. cαrotα. Figure 3.11 shows the time course
of anthocyanin content, and production. The average anthocyanin content of 15.88%
(w/w, on dry basis) was nearly constant (P>0.05) during the batch culture period. As
a result of the near constant content, the time course of anthocyanin production
paralleled the growth curve.
The specific rate of anthocyanin production (q ) was 105.2 mg g-1 day-1 . There
was a total production of 3.1 g 1-1 in a period of 15 days which corresponds to an
average productivity of 0.2 g 1-1 day-1 . Even though the anthocyanin content was
nearly constant throughout the batch period, much of the anthocyanin was produced
at the end of the log phase of growth (Fig. 3.12). Over 60% of the total anthocyanin
production occurred between the day 12 and 15. Table 3.4 lists the kinetic parameters
of anthocyanin production.
3.10 Influence of pH on growth and formation of anthocyanin
To determine the optimum pH for maximum production, the growth and
production of anthocyanin in D. cαrotα cells was studied at three different pH (Fig.
3.13). The pH of the liquid nutrient medium tended to shift towards the acidic side by
about 0.5 pH units upon sterilization by autoclaving. Accordingly, the pH of the

64


Figure 3.12. Time course of anthocyanin production in Daucus carota cell suspension cultures: Specific production rate (o); and Normalized production (■) (mean; n = 3).
66

Figure 3.13. Influence of pH on growth and formation of anthocyanin in Daucus carota cell suspension cultures (mean ± s.d.; n = 3).
67

68
medium was so adjusted that the final pH would come to the desired value.
Both the growth and production of anthocyanin were maximum at pH 5.5 while
the same were significantly lower (P<0.05) at the near neutral pH (6.5). Similarly, the
growth was significantly lower (P<0.05) at pH 4.5. However, the acidic pH did not
affect the anthocyanin content (P>0.05).
3.11 Influence of temperature on growth and formation of anthocyanin
The effect of temperature on growth and production of anthocyanin in D. carota
cells in suspension cultures was studied. The temperature was kept constant within ±
2 °C. The anthocyanin content in D. carota cells was found to be sensitive to
temperature, while the growth was relatively unaffected in the temperature range
studied (Fig. 3.14). Both the higher (30 °C) and lower (20 °C) temperatures were
significantly inhibitory to anthocyanin biosynthesis. However, there was no significant
change in growth at all the three temperatures studied.
The evaporational loss of water from the nutrient medium during the period of
culture (15 days) was about 12.5% (v/v). But it did not vary considerably within the
temperature range of 20 - 30 °C.
3.12 Optimum inoculum density
To determine the optimum inoculum density for the maximum production of
anthocyanin, the growth, and the anthocyanin formation was studied at four different
inoculum levels (Table 3.5). The specific growth rate (µ) was maximum at 0.5 g 1-1
inoculum, and dropped appreciably with the increase in the inoculum density.
However, the maximum cell density was almost same at all the four inoculum levels
studied. On the other hand, the culture period required to attain the maximum cell
density was considerably short with high initial inoculum compared to that required
with a lower inoculum density. However, the low inoculum density gave higher folds
of increase in biomass. Neither the anthocyanin content, nor the total production

Figure 3.14. Influence of temperature on growth and formation of anthocyanin in Daucus carota cell suspension cultures (mean ± s.d.; n = 3).
69

Table 3.5. Effect of inoculum density on the growth and production of anthocyanin from
Daucus carota cell cultures.
µ = Specific growth rate

71
appreciably varied with change in the inoculum level. From the trade-off between the
length of culture period, and the fold-wise increase in the biomass, it can be seen that
an inoculum density of 1.5 g l-1 (ca. 17.5 g fresh wt. 1-1) was optimum for the
production of anthocyanin.
Table 3.6 lists the optimum culture conditions for the production of anthocyanin
from D. carota cell cultures.
3.13 Size distribution of cell aggregates
The cells of D. carota in suspension cultures showed a tendency to aggregate
into clumps of different size. The size of the cell aggregates spanned from <355 to
>1500 µm with over 92% of biomass was present in the aggregates of 500 - 1500 µm
in diameter (Fig. 3.15). The profile of biomass distribution in different size groups of
cell aggregates revealed that the biomass distribution was centred at between 500 - 850
µm as the maximum biomass (36%) was present in that narrow size group. The size
distribution of cell aggregates remained unchanged during the culture period.
3.14 Anthocyanin content in different size cell aggregates
The anthocyanin content in different size groups of cell aggregates showed an
interesting profile. The content showed an increase with the increase in cell aggregate
size up to a diameter of 500 - 850 µm (Fig. 3.16) with the peak content of 21.9%
(w/w, on dry weight basis). However, the anthocyanin content decreased sharply, when
the cell aggregate size exceeded 500 - 850 µm. The anthocyanin content in the cell
aggregates of diameter > 1500 µm was only half of that in the aggregates of diameter
< 355 µm.
Consequent to the differential biomass distribution, and anthocyanin content, the
contribution of different size groups of cell aggregates toward the final production of
anthocyanin varied (Fig. 3.17). Nearly 50% of the total production was contributed by
the cell aggregates of 500 - 850 µm in diameter, followed by 24% from the cell

Table 3.6. Optimum culture conditions for the production of anthocyanin from Daucus
carota cell cultures.

Figure 3.15. Biomass distribution in different size groups of cell aggregates of Daucus carota in suspension cultures: 0 day (a); 6th day (b); 12th day (c). (mean ± s.d.; n = 3).
73
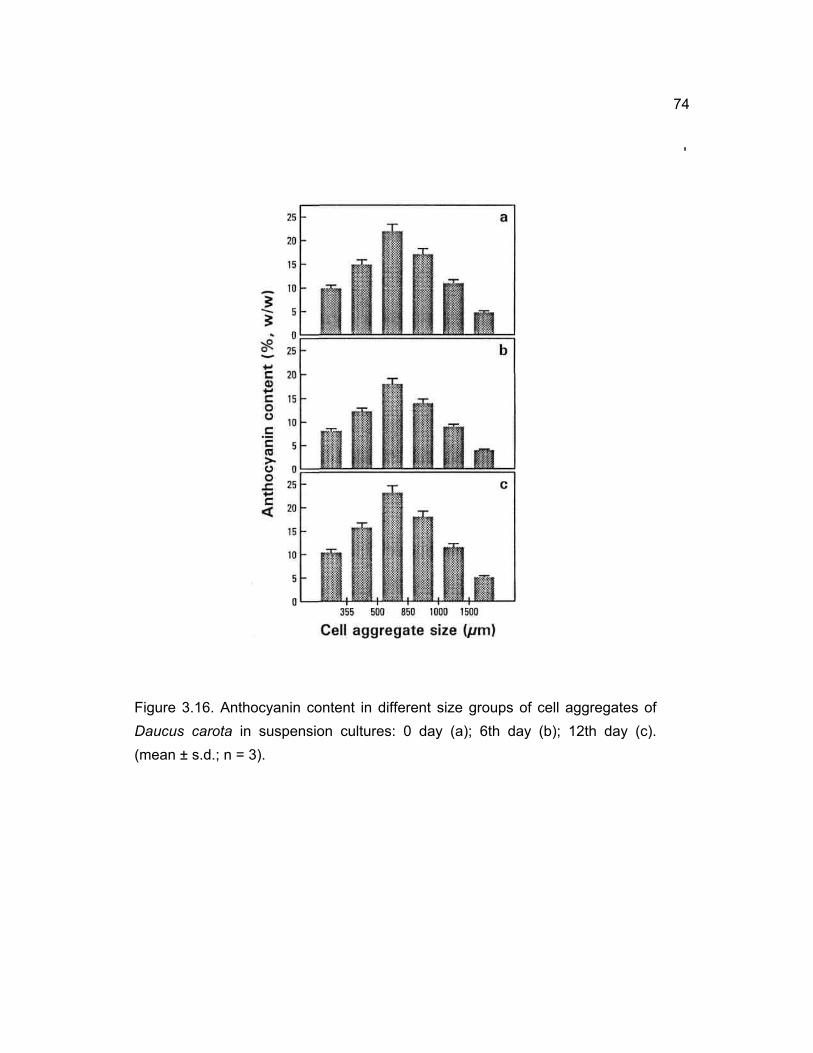
Figure 3.16. Anthocyanin content in different size groups of cell aggregates of Daucus carota in suspension cultures: 0 day (a); 6th day (b); 12th day (c). (mean ± s.d.; n = 3).
74
'

Figure 3.17. Contribution of different size groups of cell aggregates toward the production of anthocyanin in Daucus carota cell suspension cultures (mean ± s.d.; n = 3).
75

76
aggregates of the size of 1000 - 1500 µm. While the cell aggregates of the narrow
range of 850 - 1000 µm contributed a substantial amount of 22% of total production,
the contribution from the cell aggregates of < 355, and > 1500 µm was small.
3.15 Surface colour intensity in different size cell aggregates
In contrast to the profile of anthocyanin content, the surface colour intensity, as
measured in terms of the red-green coordinate value of CIELAB Color Space, showed
a steady increase with the increase in cell aggregate diameter (Fig. 3.18). The cell
aggregates were intense red in colour with the peak surface colour intensity of 2.8
units on the red-green coordinate of the colour space. The high surface colour intensity
and the low anthocyanin content in the larger cell aggregates indicate a steep radial
gradient of anthocyanin content along the radius of the cell aggregates. Figure 3.19
shows the cross-sectional view of a cell aggregate of D. carota in suspension cultures.
3.16 PAL activity in different size cell aggregates
The phenylalanine ammonia lyase (PAL) activity in different size groups of cell
aggregates showed considerable variations. The profile of PAL activity showed a
similar pattern of anthocyanin content in different size cell aggregates. The PAL
activity showed an initial increase with the increase in cell aggregate size with a peak
specific activity of 4.3 unit mg"1 protein in the cell aggregates of diameter of 500 -
850 µm, and decreased with a further increase in the cell aggregate size (Fig. 3.20).
Though the overall pattern of PAL activity was similar to that of anthocyanin content
in different size groups of cell aggregates, the differences in PAL activity were not
that pronounced as that of anthocyanin content in different size cell aggregates.
Further, there was no appreciable change in the PAL activity during the batch culture
of D. carota cells.
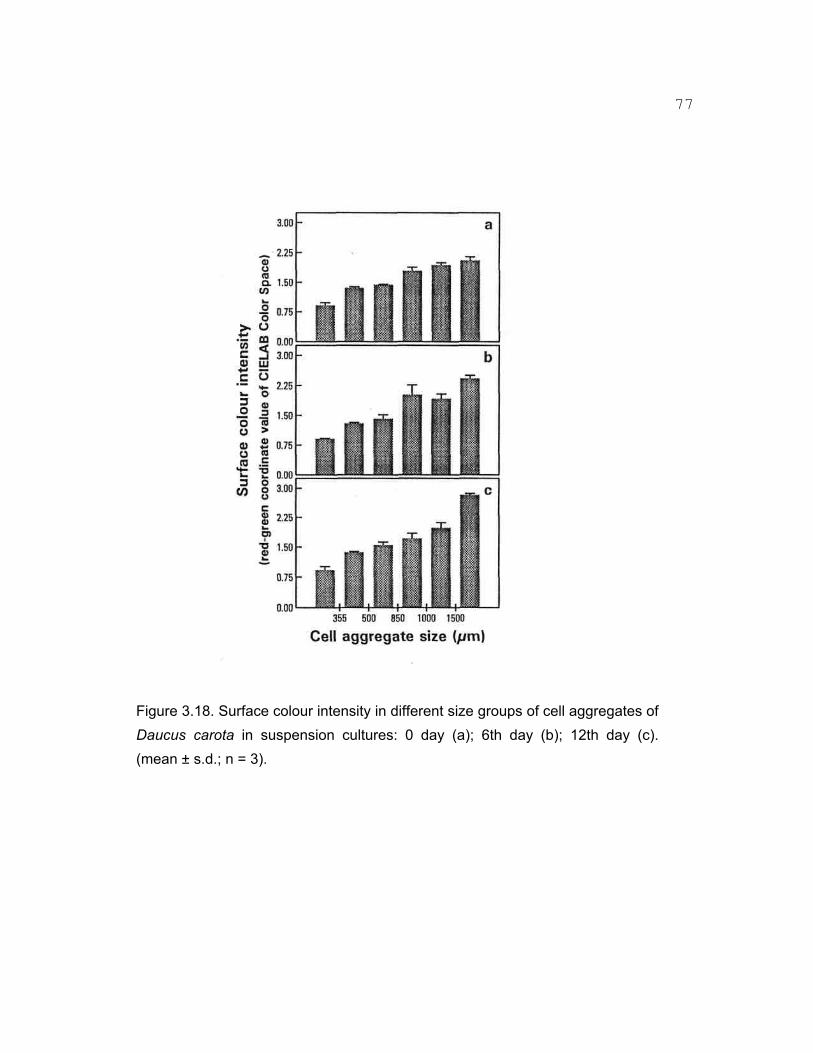
Figure 3.18. Surface colour intensity in different size groups of cell aggregates of Daucus carota in suspension cultures: 0 day (a); 6th day (b); 12th day (c). (mean ± s.d.; n = 3).
77

78
Figure 3.19. Gradient of anthocyanin in cell aggregate of Daucus carota in suspension cultures.

Figure 3.20. Phenylalanine ammonia lyase activity in different size groups of cell aggregates of Daucus carota in suspension cultures (mean ± s.d.; n = 3).
79

80
3.17 Consumption of sugars
Sucrose was the sole source of carbon in D. carota and C. frutescens cell
cultures. The analysis of sucrose, glucose, and fructose levels in the culture medium
indicated a rapid hydrolysis of sucrose during the lag phase in both the culture systems
(Fig. 3.21). Nearly 46 and 48% of the initial sucrose was hydrolysed into glucose and
fructose in two days after inoculation of D. carota and C. frutescens cells,
respectively. The specific rate of sucrose hydrolysis was 4.79, and 5.19 g g-1 day-1 in
D. carota and C. frutescens, respectively, during the lag phase. No sucrose was
detected after 5 days after inoculation in both the culture systems.
Glucose and fructose consumption curves showed that glucose was consumed
more compared to fructose. The overall consumption of glucose was 86.8, and 50.6%
more compared to that of fructose in D. carota and C. frutescens cultures, respectively.
The apparent dry biomass yield coefficient (Yχ/cHO) of carbohydrates was 0.86, and
0.83 g g-1 in D. carota and C. frutescens, respectively.
3.18 Consumption of ammonia and nitrate
An initial nitrogen concentration of 840.7 mg 1-1 in the MS medium was
provided by NH4N03, and KN03. The time-course study of residual ammonia and
nitrate concentrations in the nutrient medium showed the rapid uptake of ammonia and
a slower uptake of nitrate in both D. carota and C. frutescens suspension cultures (Fig.
3.22). There was no appreciable change in the ammonia or nitrate levels during the
lag phase of growth. However, both the nitrogen sources were absorbed rapidly and
continuously during the exponential growth of cells. 54, and 32% of the initial
ammonia, and 42 and 29% of the initial nitrate was taken up by the cells of D. carota
and C. frutescens, respectively, in the first ten days of culture. The consumption of
ammonia, and nitrate continued to progress, and the ammonium was consumed till its
almost complete exhaustion, while about 8% of the initial nitrate was left unutilized.
The apparent yield coefficient of dry biomass on ammonium (Yχ/NH3) was 0.94, and

Figure 3.21. Time course of biomass accumulation, and sugar consumption by the cells of Daucus carota (a), and Capsicum frutescens (b) in suspension cultures: Biomass (o), sucrose (■), glucose (•), and fructose (□) (mean ± s.d.; n = 3).
81
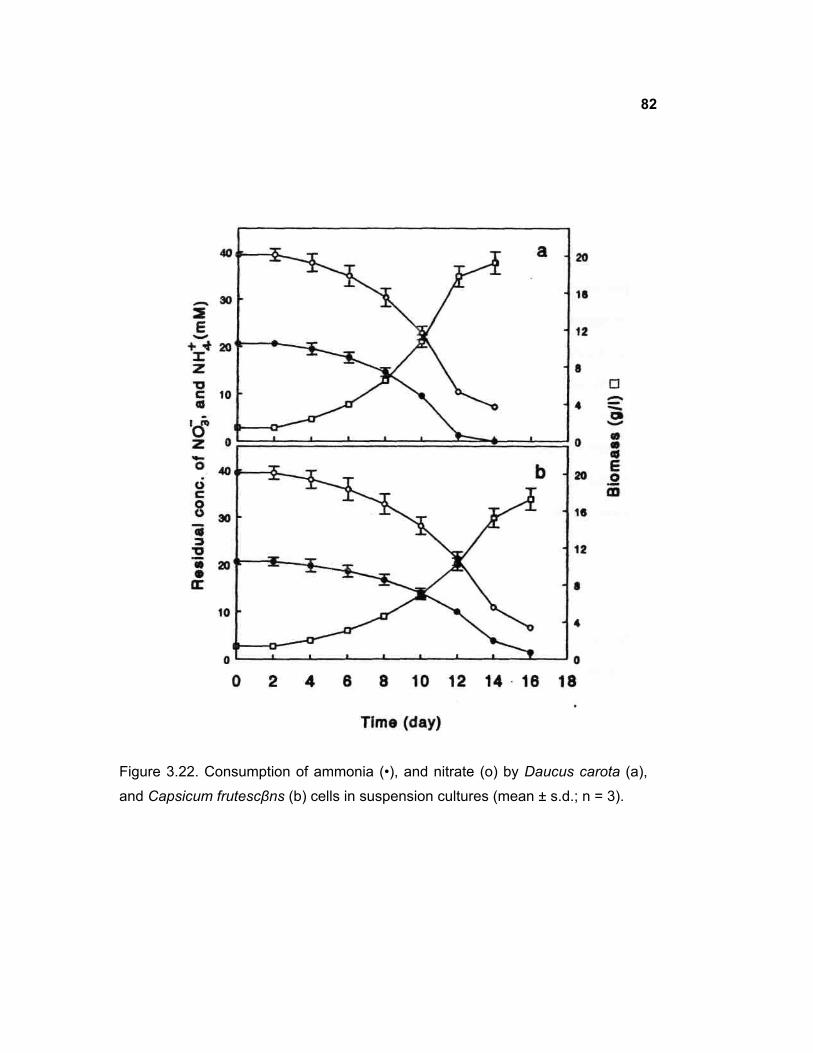
82
Figure 3.22. Consumption of ammonia (•), and nitrate (o) by Daucus carota (a), and Capsicum frutescβns (b) cells in suspension cultures (mean ± s.d.; n = 3).

83
0.89 g mmol-1 , while the corresponding yield coefficient of nitrate (YX/NO3) was 0.58,
and 0.52 g mmol-1 in D. carota and C. frutescens, respectively.
3.19 Consumption of phosphate
An initial phosphate concentration of 118.7 mg 1-1 (1.25 mM) in the MS medium
was provided by KH2P04. The time course of phosphate depletion was similar to that
of ammonia (Fig. 3.23). Although there was no appreciable change in the phosphate
concentration during the lag phase of growth, the utilization of phosphate increased
rapidly and continued till the end of log phase. Only 3, and 6.4% of the initial
phosphate was left unutilized by the cell cultures of D. carota and C. frutescens,
respectively. The yield coefficient of dry biomass on phosphate (Yχ/po4) was 15.95,
and 14.79 g mmol-1 in D. carota and C. frutescens cell suspension cultures,
respectively.
3.20 Changes in medium conductivity
Changes in the electrical conductivity of the nutrient medium in D. carota and
C. frutescens cell suspension cultures were monitored in order to estimate the
relationship between the conductivity and the biomass density (Fig. 3.24). The
conductivity of the culture medium decreased slowly and steadily with the progress
in culture period. The analysis of medium conductivity and the biomass density
showed a linear decrease in the conductivity with the increase in the biomass of
D. carota and C. frutescens cells (Fig. 3.25). The relationship could be represented by
the following equation:
∆X = k ∆C Eq. 3.1
where ∆X is the increase in dry cell biomass, k is an empirical constant, and ∆C
is the nutrient medium conductivity.

Figure 3.23. Consumption of phosphate by Daucus carota (o), and Capsicum frutescens (•) cells in suspension cultures (mean ± s.d.; n = 3).
84

85
Figure 3.24, Progressive decrease in the electrical conductivity of culture media
of Daucus carota (o), and Capsicum frutescens (•) (mean + s.d.; n = 3).

86
Figure 3.25. Relationship between the conductivity of culture medium and cell biomass of Daucus carota (o), and Capsicum frutescens (•) (mean; n = 3).

87
From the linear-regression analysis of the conductivity and biomass density, it
was estimated that the proportionality constant (k) in the above equation was -5.29,
and -5.56 g 1-1 mS-1 for D. carota and C. frutescens cell cultures, respectively. The
coefficient of linearity (r2 ) between the conductivity and the biomass density was
0.997, and 0.998 in D. carota and C. frutescens cell cultures, respectively. An analysis
of the conductivity of individual components in the Murashige and Skoog's medium
with sucrose was carried out (Table 3.7). The medium conductivity was influenced by
nitrates, CaCl2, and minor and major elements. The addition of organic constituents
such as vitamins did not substantially alter the conductivity. The addition of either
sucrose, glucose or fructose resulted in decreased conductivity of the culture medium.
3.21 Changes in osmolarity of the medium
Changes in the osmolarity of the nutrient medium during the culture period of
D. carota and C. frutescens were studied. In both the culture systems osmolarity of the
medium increased sharply as a result of the rapid hydrolysis of sucrose into glucose
and fructose (Fig. 3.26). The osmolarity of the culture medium reached the peak value
of 257, and 260 mOsmol kg"1 in D. carota and C. frutescens cultures, respectively,
and decreased subsequently. An analysis of the contribution of individual components
of Murashige and Skoog's medium was carried out (Table 3.7). In contrast to the
conductivity of the medium, the osmolarity was largely influenced by the
concentration of sucrose, glucose, or fructose. While NH4N03 and KN03 showed
positive influence on the osmolarity of the culture medium, many micronutrients did
not contribute substantially.
3.22 Estimation of biomass based on osmolarity
The suitability of osmolarity as an index for estimation of biomass was
investigated. Figure 3.27 shows the relationship between the osmolarity and the density
of biomass in D. carota and C. frutescens cell cultures. With the exception of the
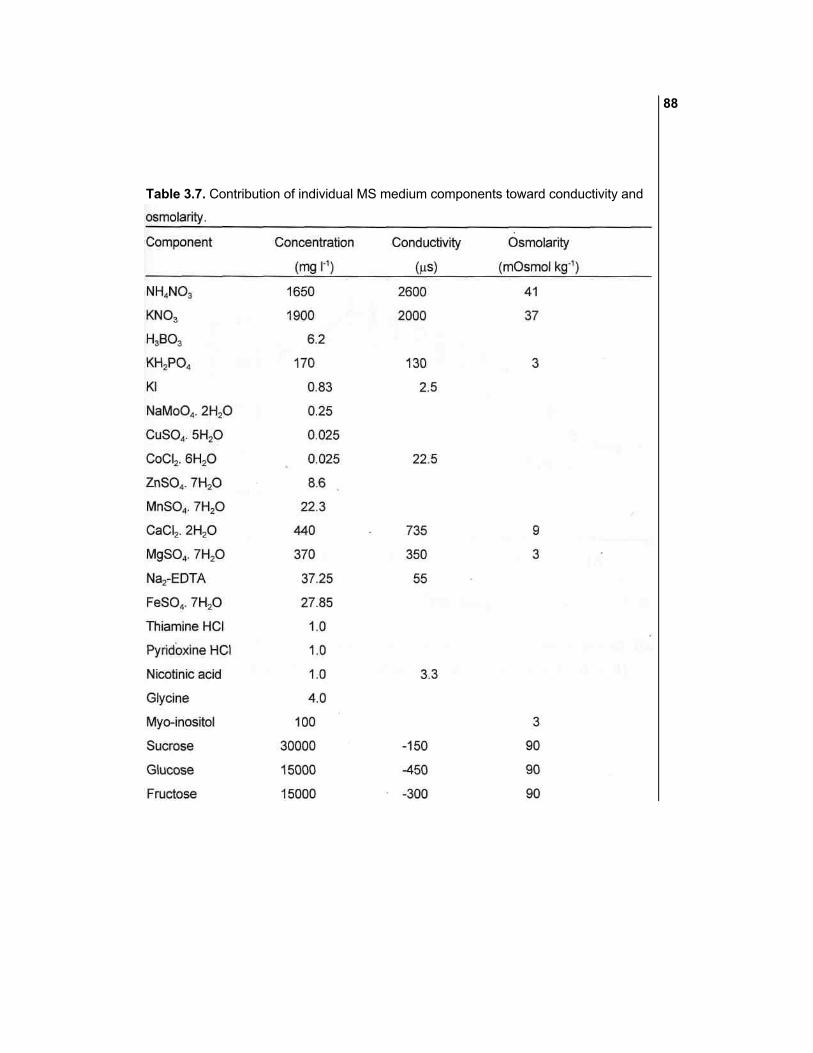
Table 3.7. Contribution of individual MS medium components toward conductivity and
88
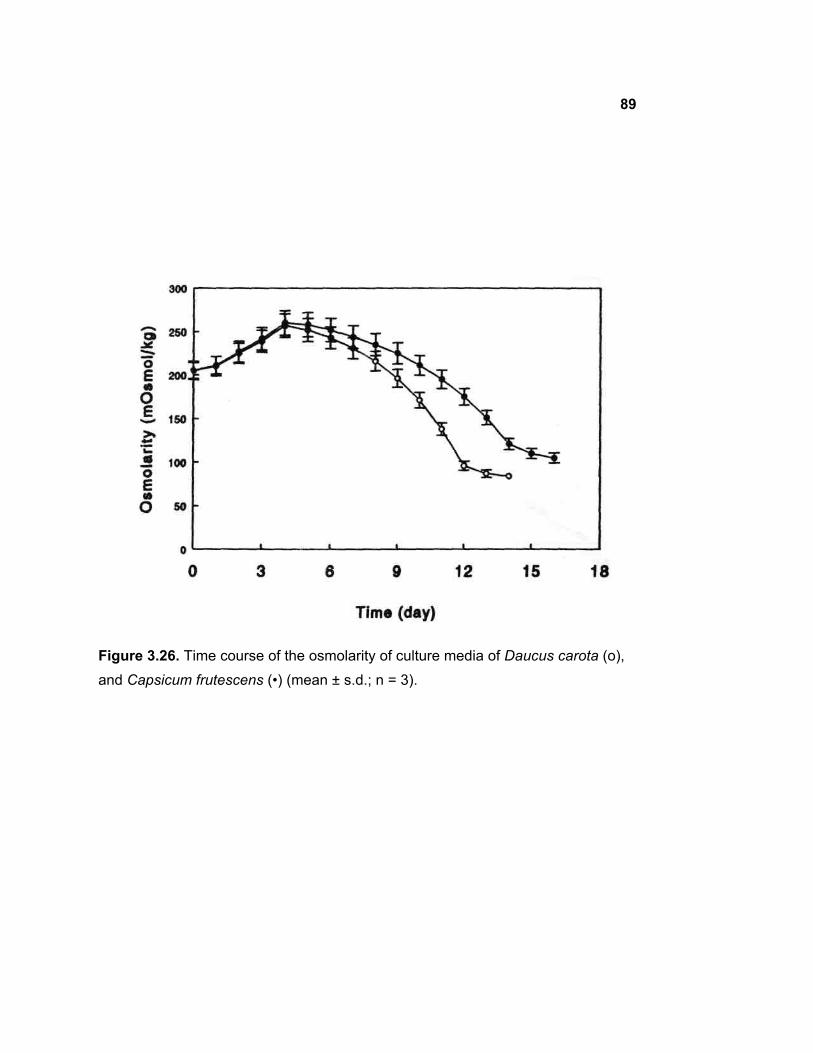
89
Figure 3.26. Time course of the osmolarity of culture media of Daucus carota (o), and Capsicum frutescens (•) (mean ± s.d.; n = 3).
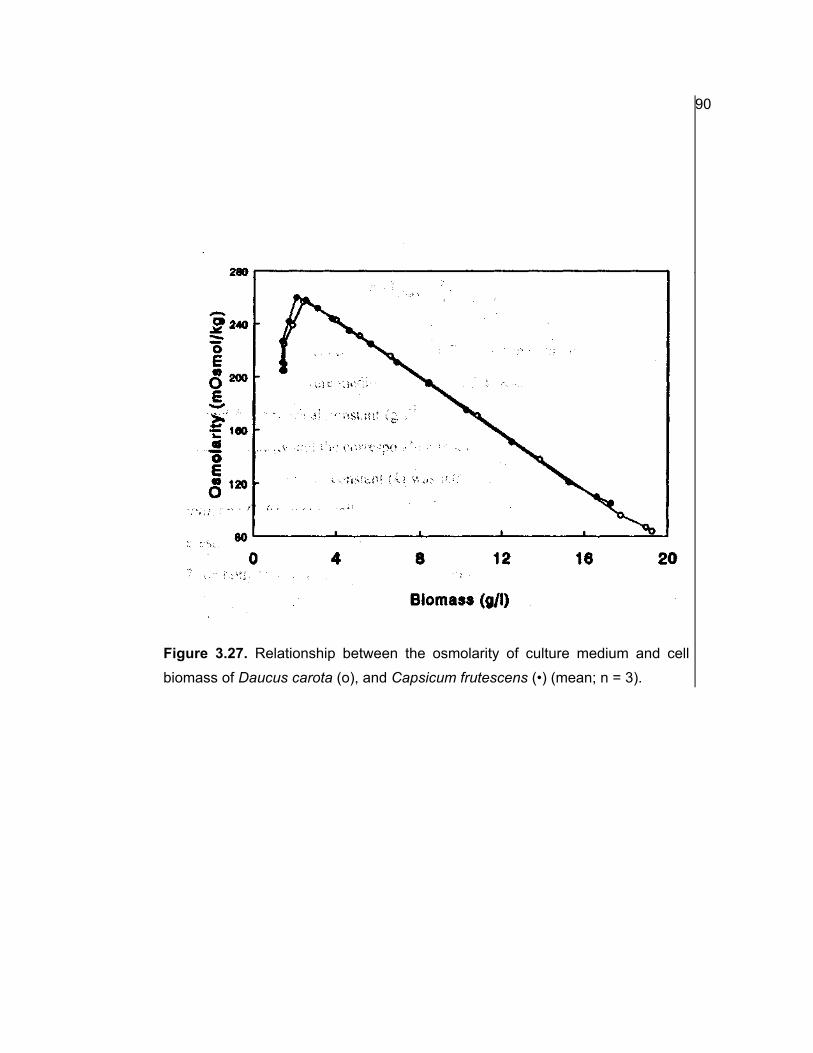
Figure 3.27. Relationship between the osmolarity of culture medium and cell biomass of Daucus carota (o), and Capsicum frutescens (•) (mean; n = 3).
90

91
initial increase, the osmolarity linearly decreased with the increase in the biomass
density in both the cell culture systems. The following equation was formulated to
describe the relationship between the osmolarity and the biomass density.
where X = dry cell concentration (g 1-1 ); Tmaχ = maximum osmolarity reached; T
= osmolarity of the culture medium (mOsmol kg ); XTmax = dry cell concentration
at Tmax; and k = empirical constant (g 1-1 kg mOsmol-1 ). From the linear-regression
analysis of osmolarity and the corresponding biomass density it was estimated that the
value of the proportionality constant (k) was 0.096, and 0.094 g 1-1 kg mOsmol-1 for
D. carota, and C. frutescens cell cultures, respectively. The correlation coefficient (r-2 )
for the estimation of biomass based on the osmolarity of culture medium was over
0.9997 for both D. carota and C. frutescens cell culture systems.
3.23 Extracellular polysaccharides and proteins in culture medium
There was a continuous secretion of polysaccharides and proteins by both D.
carota and C. frutescens cells into the liquid nutrient medium (Fig. 3.28). By the end
of the log phase of growth, there was an accumulation of 1.2, and 1.05 mg ml-1 of
polysaccharides, and 0.78, and 0.71 mg ml of proteins in the cell free media of D.
carota and C. frutescens, respectively. Microscopic observation of the cell free
medium showed the presence of cell debris.
3.24 Estimation of biomass based on the turbidity of cell free medium
As a consequence of the secretion of polysaccharides and proteins by the cells
of D. carota and C. frutescens, the nutrient media gradually became turbid and
viscous. Figure 3.29 shows the relationship between the increase in the turbidity of the
cell free medium and the growth of cell biomass. The relationship was represented by

92
Figure 3.28. Time course of extracellular polysaccharides (•), and proteins (o) in Capsicum frutescens (a), and Daucus carota (b) cell suspension cultures (mean + s.d.; n = 3).

93
Figure 3.29. Relationship between the turbidity of cell-free culture medium and biomass density in Capsicum frutescens (a), and Daucus carota (b) cell suspension cultures (mean; n = 3).

where, ∆A630 is the change in the optical density of the cell free medium per
unit increase in the biomass (∆X). From the linear-regression analysis it was estimated
that the proportionality constant (k) was 24.93, and 21.26 with a correlation coefficient
(r-2 ) of 0.982, and 0.975 for D. carota and C. frutescens, respectively.
3.25 Effect of filter mesh size on estimation of biomass
The effect of filter mesh size on the estimation of biomass based on the turbidity
of cell free medium in D. carota and C. frutescens suspension cultures was studied.
Table 3.8 summarizes the effect of filter mesh size on the sensitivity and accuracy of
the estimation. A fine mesh (37 µm) gave a better correlation but a lower value for
the empirical proportionality constant (k). On the other hand, a wider mesh (88 µm)
gave a higher value for k with a poor correlation. Microscopic examination of the cell
free medium obtained by the filter of mesh size 88 µm showed the presence of single
cells at low density. However, in spite of the presence of cells, there was a moderate
correlation between the turbidity of the cell free medium and the increase in the
biomass in both the culture systems.
Table 3.9 compares the biomass estimation methods based on the conductivity,
osmolarity, and turbidity of cell-free culture medium. It is apparent that the estimation
based on osmolarity of the culture medium had the highest sensitivity, while turbidity
of cell-free culture medium gave a quick rough estimate of biomass.
3.26 Production of anthocyanin in stirred tank bioreactor
The growth of biomass and production of anthocyanin from D. carota cells was
studied at 2 L level using a stirred tank reactor. Figure 3.30 shows the time course of
94
the following equation:
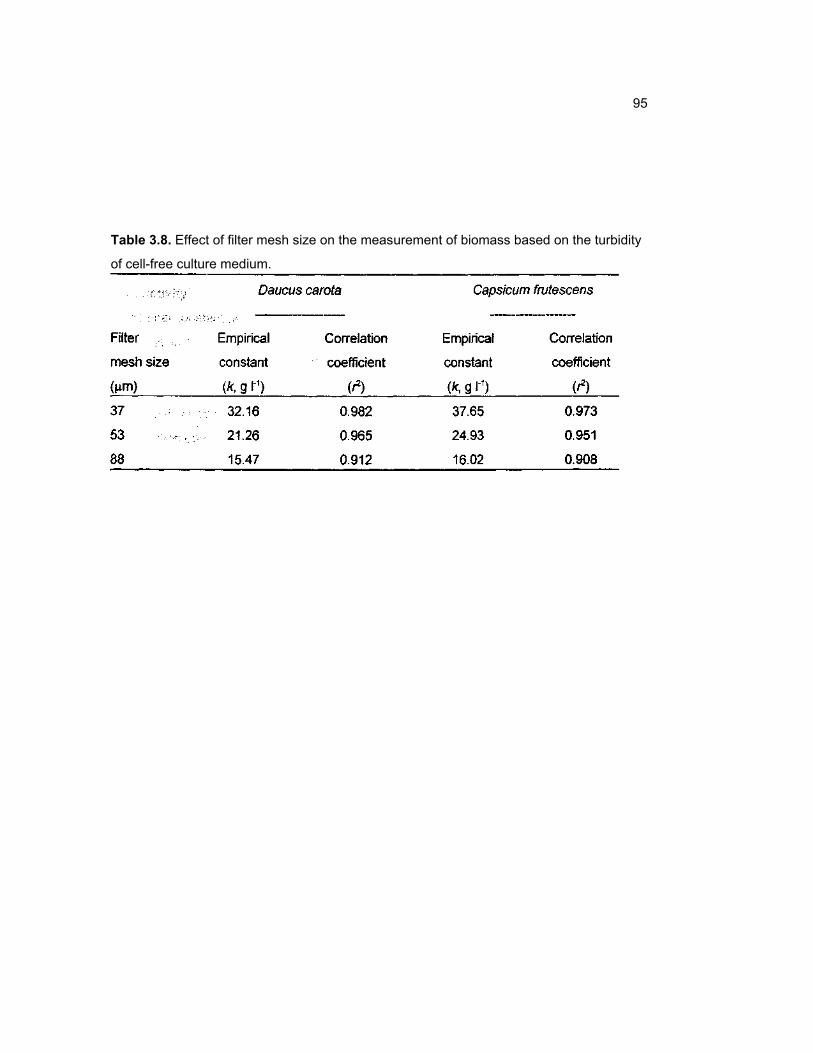
95
Table 3.8. Effect of filter mesh size on the measurement of biomass based on the turbidity
of cell-free culture medium.

96
Table 3.9. Comparison of biomass estimation methods based on conductivity, osmolarity, and
turbidity of cell-free medium.
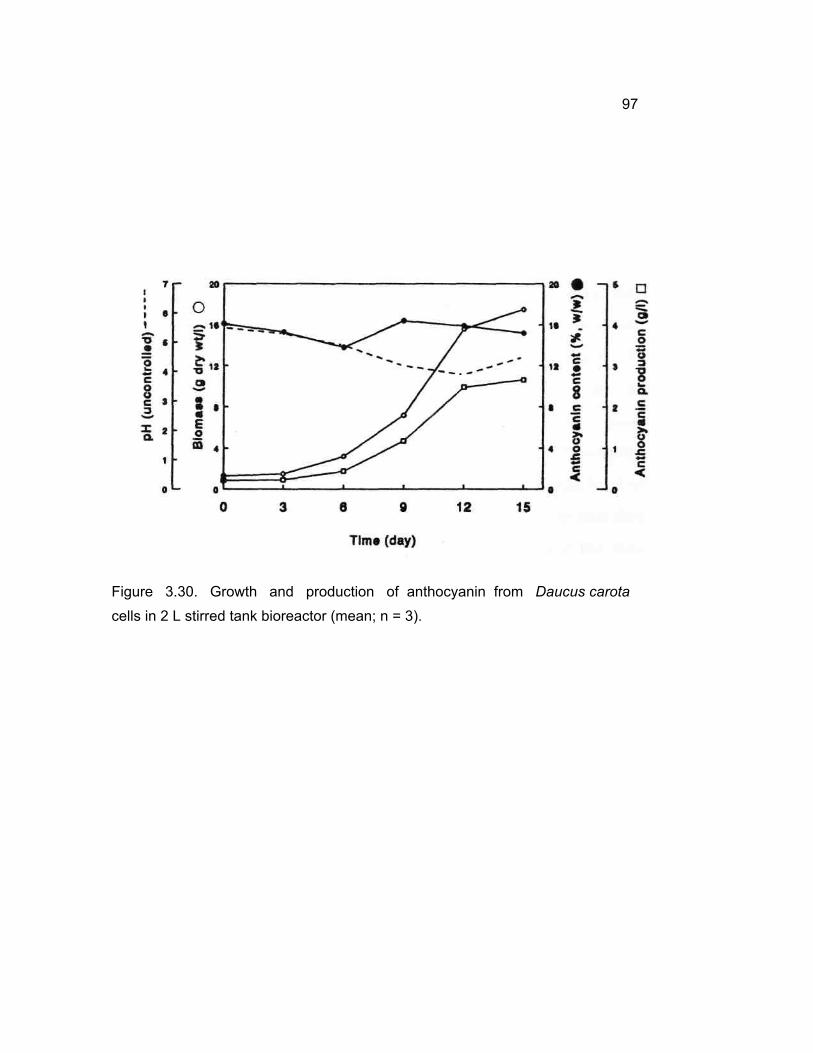
Figure 3.30. Growth and production of anthocyanin from Daucus carota cells in 2 L stirred tank bioreactor (mean; n = 3).
97

98
cell biomass, anthocyanin content and the production. There was about 18 g 1-1 of dry
cell biomass after 14 days of culture. The total anthocyanin production was 2.7 g 1-1 .
The growth and product formation profiles were essentially similar to those observed
in shake flasks. The mean cell viability was over 90% throughout the culture period.
The size distribution of cell aggregates was comparable to that in shake flasks
indicating that the cells had a fair shear tolerance. In spite of the extracellular
polysaccharides and proteins, there was no considerable frothing of the medium. The
foam level controller, set at a height of 3 cm above the level of liquid medium, did
not add any antifoam emulsion. The pH of the culture broth tended to drift towards
acidic, and if not controlled, it dropped to 3.2 by 12th day of culture. The automatic
pH controller added few ml of alkali intermittently. Estimation of biomass based on
the conductivity and osmolarity using the empirical constants obtained with shake flask
cultures, correlated well with the sample analyses, and demonstrated that these
parameters can be used at large-scale cultivation of D. carota cells. Figure 3.31 shows
the bioreactor used for the study.
3.27 Oxygen consumption rate
The oxygen requirement of D. carota and C. frutescens cells was estimated. The
experimental set up used for the measurement of oxygen consumption rate is described
in Section 2.23 of Material and Methods. Figure 3.32 shows the time course of oxygen
depletion from the liquid nutrient medium in the presence of D. carota, and C.
frutescens cells. The overall pattern of oxygen uptake was similar for both the culture
systems studied. There was a steady and linear decrease in the dissolved oxygen up to
a level of 30, and 25% of air saturation (2.4, and 2.0 mg l-1) with D. carota, and C.
frutescens cells, respectively. Below this concentration, the oxygen utilization rate
suddenly dropped.
From the linear-regression analysis of the amount of oxygen consumed during
different time intervals, it was estimated that the specific oxygen uptake rate (q02) of
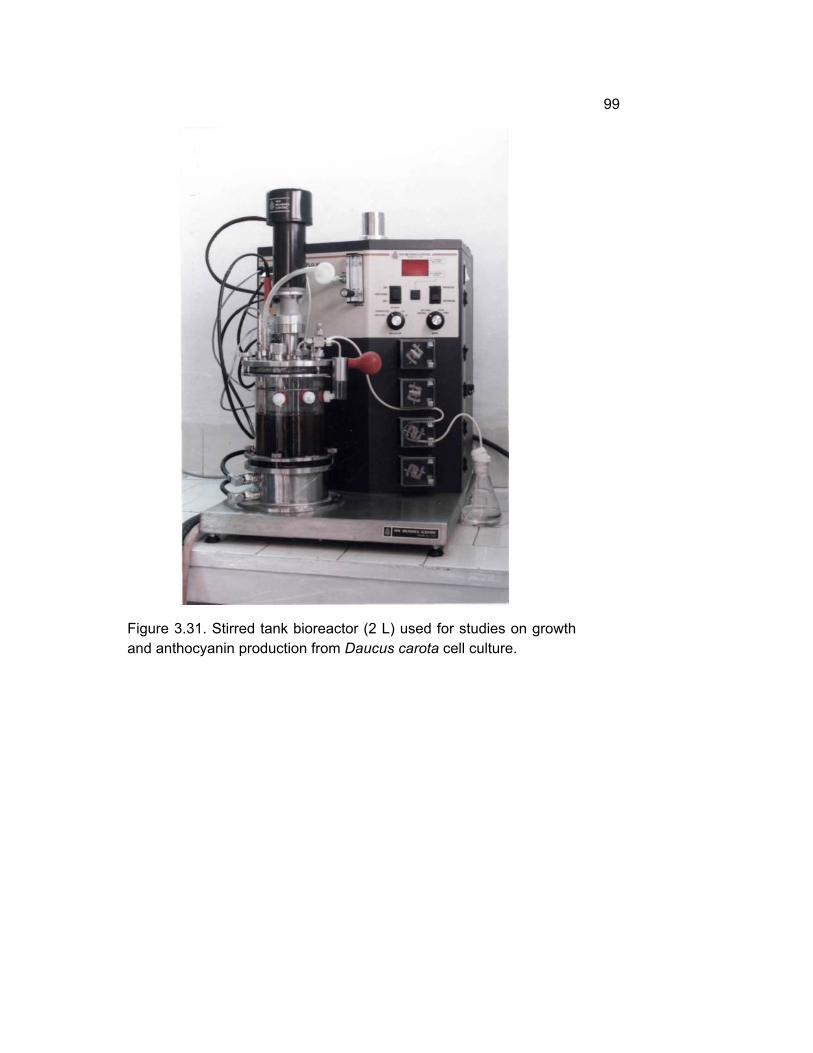
99
Figure 3.31. Stirred tank bioreactor (2 L) used for studies on growth and anthocyanin production from Daucus carota cell culture.

100
Figure 3.32. Oxygen uptake by Daucus carota (a), and Capsicum
frutescens (b) cells (mean; n = 3).
101
D. carota, and C. frutescens cells was 0.75, and 0.57 mmol g h , or 0.58, and 0.44 g
g-1 day-1 , respectively. From the Figure 3.32 it can be seen that the critical oxygen
concentration was 30, and 25% air saturation for D. carota, and C. frutescens cells,
below which the respiratory rate was affected. There was no considerable change in
the specific oxygen consumption rate with culture age in both the culture systems.
3.28 Rheoiogical characteristics of the culture broth
Rheological characteristics of the culture broth of D. carota in the stirred tank
bioreactor were studied. Samples were drawn from the reactor at 3 day intervals. In
view of the practical limitation associated with the instrument used in for study, larger
cell aggregates were removed from the samples by passing the culture broth through
a sieve of mesh size 1500 µm. It is assumed that this would not affect the various
estimations since the fraction of cell aggregates larger than 1500 µm was very small.
The viscosity (η) of the culture broth did not increase appreciably till the 6th day
of culture. Figure 3.33 shows the flow curve (shear stress vs shear rate) of the 3-day
old culture broth. The near linear curve passing through the origin indicates that the
culture broth was Newtonian in rheology with no yield stress. This rheological nature
is the property of most of the common fluids like water. The apparent viscosity of the
culture broth, as estimated from the linear regression analysis of shear stress and shear
rate data, was about 3 cP which is comparable to that of 1 cP for water.
However, viscosity of the culture broth rapidly increased from day 6 onwards
diαe to the exponential growth of biomass. As evident from Figure 3.33, rheology of
the culture broth at late exponential stage is strikingly different from that of the culture
broth of initial stage. The flow curve became curvilinear indicating the non-
Newtonianity. Among the various common flow models applied, the Power-Law
model was the best fit to describe the flow behaviour of the culture broth. As
estimated from non-linear regression analysis, the consistency index (k) was 132 (mPa
s)0.57, and the flow behaviour index (n) was 0.57 for the 12 day old culture broth.

102
Figure 3.33. Flow curve of Daucus carota culture broth in stirred tank bioreactor. 3rd day (a); 12th day (b). culture broth (o); Small size (■); medium size (D); large size (•) cell aggregates (mean; n = 3).

103
The above results suggest that the culture broth slowly turned from Newtonian
to non-Newtonian regime with increase in the cell density. Figure 3.34 shows the time
course of flow behaviour of the culture broth. From the analysis of flow curves of the
culture broth at different time intervals, it was observed that the consistency index
increased from 3.86 to 132 (cP)n, while the flow behaviour index dropped from 0.93
to 0.57. The apparent viscosity of the culture broth increased in proportion of 3rd
power of the biomass density. However, the culture broth did not exhibit any
considerable yield stress throughout the growth period.
To study the influence of cell aggregate size on the flow behaviour of the culture
broth, the culture mixture was resolved into small (< 550 µm), medium (550 - 1000
µm), and large (1000 - 1500 µm) cell aggregates. Cell clusters of each size class were
pooled and resuspended in the nutrient medium to give a known biomass density.
Shear stress-shear rate analyses of these suspensions showed that the cell aggregate
size has no considerable effect on the rheological parameters studied (Fig. 3.33). As
mentioned previously, cell aggregates >1500 µm in diameter were never included in
the study.
The culture broth was further clarified into culture filtrate, by passing through a
sieve of mesh size 35 µm. Flow curve of the culture filtrate thus obtained indicated
that the broth devoid of cells did not contribute much to the viscosity of the total
culture fluid. The culture filtrate of the late log phase was purely Newtonian in flow
behaviour with a viscosity of about 4 cP.
3.29 Characterization of anthocyanins
a) Separation and purification of anthocyanins
The methanolic extract of D. carota cells was separated into three distinct
compounds using paper chromatography. Of the various solvent systems used, n-
butanol-acetic acid-water (4:1:5) gave the best resolution. The three compounds had
Rf values of 0.36, 0.38, and 0.48, which were designated as AN-I, II, and III,

Figure 3.34. Time course of biomass and flow behaviour parameters of Daucus carota culture broth in 2 L stirred tank bioreactor (mean; n = 3).
104

105
respectively.
The spectral data of these separated bands showed the absorption maxima (λmax)
in the range of 525 - 535 nm in the visible region, and 250 - 290 nm in the UV region
(Table 3.10), while the crude extract had λmaχ of 238, and 535 nm (Fig. 3.35).
b) Determination of anthocyanidins
The acid treatment of AN-I, II, and III samples resulted in the hydrolytic
separation of anthcyanidins from the sugar and acyl moieties. Identification of the
anthocyanidin moiety was done based on the retention time (Rt in HPLC with
methanol-acetic acid-water (70:10:20) as the mobile phase. The elution profile of
standard anthocyanidins reflected their polarity i.e. anthocyanidins with more hydroxyl
groups were eluted first followed by the ones with methyl groups. The order of eiution
was delphinidin, cyanidin, petunidin, pelargonidin, peonidin, and malvidin (Table
3.11). Based on the retention time, the anthocyanidins in the internal standards were
identified.
All the three paper chromatographically separated compounds of the cell extract,
AN-I, II, and III, gave a single peak at a retention time in the range of 9.3 - 9.5 min
indicating that the cyanidin was the only anthocyanidin in the high yielding cell line
of D. carota. Figure 3.36 shows the HPLC profile of D. carota cell extract.
c) Identification of sugars
Paper chromatography of the aqueous extracts of acid hydrolysed AN-I, II, and
III indicated the presence of three different sugars, namely glucose, galactose, and
xylose (Table 3.12). AN-I gave two distinct spots with Rf values comparable to those
of galactose (0.29), and xylose (0.47), while AN-II, and AN-III showed a single spot
with Rf value equal to that of glucose, and galactose, respectively. These results
suggest that AN-I is a cyanidin diglucoside, while AN-II, and AN-III are cyanidin
monoglucosides. The relative optical densities of AN-I, II, and III showed that the

106

107
Figure 3.35. UV-Vlsible absorption spectra of Daucus carota cell extract.

108
Table 3.11. Retention times in HPLC of anthocyanidin in Daucus carota cell extract, and
various standards.
Del. = Delphinidin; Cyan. = Cyanidin; Pet. = Petunidin;
Peon. = Peonidin; Mai. = Malvidin.

Table 3.12. Paper chromatographic seperation of glycon moieties of
anthocyanins from Daucus carota cells.
109

110
cyanidin diglucoside was the major anthocyanin in D. carota cells.
No appreciable optical absorbance by AN-I, II, or III in the range of 300 -340
run suggested the absence of acyl groups.
3.30 Production of capsaicin using bubble column reactor
Continuous production of capsaicin from immobilized C. frutescens cells using
alginate matrix was studied in an 1 litre bubble column reactor. The alginate beads
encapsulating the cells were about 5 mm in diameter after hardening in CaCl2 solution
and harboured about 25 mg of cells per bead. About 4000 beads containing
approximately 100 g of fresh cells were loaded into an 1 litre glass column. There was
about 750 ml of void space and the beads were free floating.
Liquid nutrient medium containing the MS salts (Murashige and Skoog, 1962)
and sucrose (3%, w/v) supplemented with 2,4-D (2 mg l-1) and kinetin (0.5 mg 1 )
was passed through the column at a constant volumetric flow rate of 25 ml hour-1 ,
which corresponds to a dilution rate of 0.03 hour-1 . Assuming a perfect mixing, the
mean residence time of the nutrient medium was about 30 hours. The reactor was
aerated through a sparger located at the bottom of the column at a constant flow rate of
250 ml min-1 (0.25 VVM).
The spent medium collected through the outlet the column was analyzed for
capsaicin. Figure 3.37 shows the time course of capsaicin productivity. The
productivity rapidly increased to a maximum of 2.5 mg 1-1 day-1 in the initial four
days and remained stable for the next 10 days. Thereafter the productivity slowly came
down and after three weeks there was no synthesis of capsaicin. The total production
of capsaicin was 35 mg l-1 over a period of three weeks of continuous culture. Figure
3.38 shows the bubble column reactor used for the continuous production of capsaicin.
Gradual softening, and collapse of the alginate beads was observed after three
weeks of continuous operation.

Figure 3.37. Continuous production of capsaicin from bubble column reactor with Capsicum frutescens cells immobilized in alginate matrix (mean; n = 3).
111
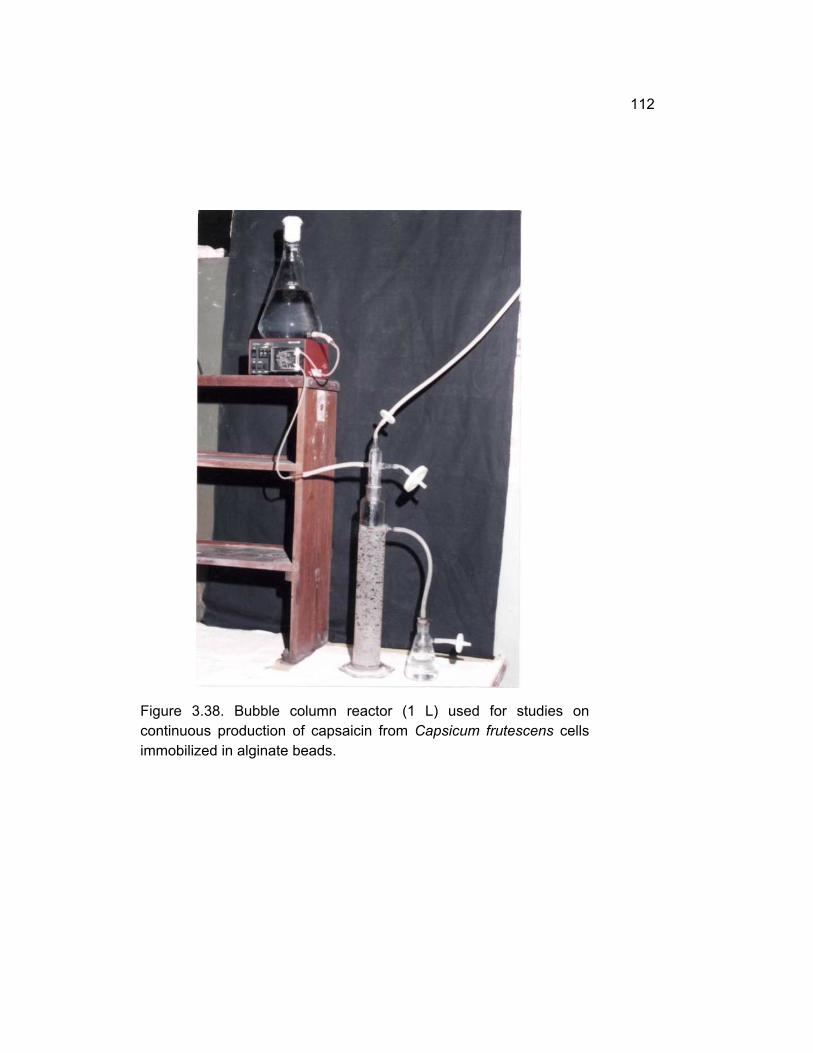
Figure 3.38. Bubble column reactor (1 L) used for studies on continuous production of capsaicin from Capsicum frutescens cells immobilized in alginate beads.
112

113
3.31 Entrapment of C. frutescens cells in polyurethane foam
The suitability of polyurethane foam (PUF) as an immobilization matrix for C.
frutescens cells was studied. The PUF used in the present study was highly reticulate
with over 95% of void space. PUF of 2.0 cm thickness was cut into circular discs of
5.5 cm in diameter and incubated in the cell suspension cultures of C. frutescens.
Figure 3.39 shows the time course of cell loading into PUF. The cells were entrapped
in the foam and with the subsequent growth of cells in side the foam, nearly 40% of
the available space was filled with the cells in 14 days of incubation. This resulted in a
cell loading of 0.37 g fresh cells cm of PUF. Cross sectional view of the PUF discs
under the microscope showed a uniform cell density.
3.32 PRODUCTION OF CAPSAICIN USING PACKED-BED REACTOR
Continuous production of capsaicin from C. frutescens cells packed in
polyurethane foam (PUF) bed was studied. PUF discs loaded with cells were
aseptically packed into a glass column to a bed volume of 1 litre. The total cell
biomass in the packed bed was over 380 g fresh weight. There was about 630 ml of
void space and the nutrient medium could seep through the bed slowly.
Liquid nutrient medium containing the MS salts (Murashige and Skoog, 1962)
and sucrose (3%, w/v) supplemented with 2,4-D (2 mg 1-1 ) and kinetin (0.5 mg l-1)
was trickled through the packed-bed at a constant volumetric flow rate of 25 ml hour-1, which corresponds to a dilution rate of 0.04 hour . Assuming no channelling, the
mean residence time of the nutrient medium was about 25 hours. The feed nutrient
medium saturated with oxygen supplied the required oxygen for the respiration of cells
inside the foam.
The spent medium collected at the downstream of the column was analyzed for
capsaicin production. Figure 3.40 shows the time course of capsaicin productivity. The
profile of capsaicin production from the packed-bed column reactor was similar to that
of bubble column reactor. The productivity rapidly increased to a maximum of about

Figure 3.39. Time course of Capsicum frutescens cell loading into polyurethane foam (PUF) (mean ± s.d.; n = 3).
114

Figure 3.40. Continuous production of capsaicin from packed-bed column reactor of Capsicum frutescens cells immobilized in polyurethane foam bed (mean; n = 3).
115

116
10 mg 1-1 day-1 in the initial four days and remained stable for the next 20 days.
Thereafter the productivity slowly came down and after four weeks there was no
synthesis of capsaicin. The total production of capsaicin was 207 mg 1-1 over a period
of three weeks of continuous culture. Figure 3.41 shows the packed-bed column
reactor used for the continuous production of capsaicin.
Though the volumetric productivity of about 10 mg l-1 day is high as compared
to that in the bubble column reactor, the specific productivity of capsaicin by C.
frutescens cells in both the immobilizing matrices was approximately same which was
about 25 µg g-1 fresh cells day-1 . Thus, due the high cell density, there was about 4
fold increase in the volumetric productivity of packed-bed reactor as compared to that
of the bubble column reactor. Further, the synthesis of capsaicin from the cells
immobilized in PUF sustained for longer time.
No physical deterioration of the foam was observed even after four weeks of
continuous operation.
3.33 Enhancement of capsaicin production with fungal elicitor
In an effort to enhance the production of capsaicin, the application of a fungal
elicitor was studied. Aspergillus niger mat extract was used in the feed nutrient
medium for the packed-bed reactor at a concentration of 10 g equivalent of fresh
mycelium per litre of medium. The elicitor and the concentration were selected based
on the extensive work carried out earlier in our laboratory on elicitation of in vitro
Gapsaicin synthesis (Sudhakar Johnson, 1991).
There was about 60% increase in the total production of capsaicin resulting in a
maximum production of 330 mg 1-1 in a period of four weeks.
Table 3.13 compares the performance of the bubble column reactor, and the
packed-bed reactor.

Figure 3.41. Packed-bed reactor (1 L) used for studies on continuous production of capsaicin from Capsicum frutescens cells immobilized in polyurethane foam.
117

118
Table 3.13. Comparison of continuous production of capsaicin from bubble column, and
packed-bed reactors.

DISCUSSION

4.1 Development of a high yielding cell line of D. carota
4.2 Physico-chemical properties of plant cell culture media
4.3 Optimization of culture conditions for D. carota cells
4.4 Growth of D. carota and production of anthocyanin
4.5 Size distribution of cell aggregates of D. carota
4.6 Nutrient consumption in D. carota and C. frutescens cell cultures
4.7 Measurement of biomass in plant cell cultures
4.8 Growth and production of anthocyanin in bioreactor
4.9 Characterization of anthocyanin
4.10 Studies on continuous production of capsaicin

119
Higher plants produce a great variety of compounds, many of which are
commercially important as pharmaceuticals, food additives, natural flavours, dyes,
pesticides etc. In vitro culture of plant cells has long been recognised as an alternate
source for high value phytochemicals. In the last two decades there have been intense
efforts to develop cell culture processes for a number of compounds of commercial
importance. However, there are only a few processes operative on commercial scale.
These include shikonin production from Lithospermum erythrorhizon cell cultures by
Mitsui Petrochemical Industries Ltd., Tokyo (Curtin, 1983), production of berberine
from Coptis japonica cell cultures, by the same company, and few other compounds
such as digoxin, geraniol, rosmarinic acid etc. (Mor, 1991).
The major limitations in commercial realization of this technology for a wider
range of compounds are the slow growth of plant cells, low yields of the metabolites,
and difficulties in scale-up of the processes. Hence, development of a stable high
yielding cell line, optimization of various culture parameters, detailed studies on
growth and product formation kinetics form the bases for the scale-up and evaluation
of economic feasibility of the cell culture processes.
The present investigation dealt with the studies on production of anthocyanin
from Daucus carota cell cultures, and capsaicin from immobilized cells of Capsicum
frutescens at shake-flask and lab-scale reactor level.
4.1 Development of a high yielding cell line of D. carota
A stable and high yielding cell line is an important component of a fermentation
process. As the secondary metabolites do not add any selective advantage or
disadvantage to the proliferation of plant cells, a number of methods have been
developed for improvement of the desired metabolite content of the cells. Zenk and
co-workers (1977) presented a scheme to establish a high producing cell culture. The
suggested scheme starts with a search for highly productive plants for culture
120
initiation, followed by the development of a special production medium for the highest
formation of the desired compound. Finally, a screening of the heterogenous cell
population for variant clones containing the highest levels of the desired products was
to be employed. Following this procedure, several highly productive cell lines were
established (Constabel et al., 1981; Kurz et al, 1985; Tremouillaux-Guiller et al.,
1987). The screening of coloured compounds by the naked eye assisted by quantitative
spectrophotometric analyses has given the most convincing results (Kinnersley and
Dougall, 1980; Yamamoto et ah, 1982; Nozue et al., 1987). However, automated cell
sorting using flow-cytometer coupled with radio-immuno-assay (RIA), fluorescent-
immuno-assay (FIA), or luminescent-immunosorbent-assay (LIA) were used for high
throughput (Matsumoto et al., 1980).
In the present study a high yielding cell line of D. carota was developed by
repetitive selection for high anthocyanin containing cell clusters (Fig. 3.9).
Interestingly, the growth rate of biomass also increased considerably. The very process
of culture maintenance by periodic subculturing selectively enriches the fraction of fast
growing cells. The cell line exhibited an impressive stability in terms of the
anthocyanin content and growth rate.
4.2 Physico-chemical properties of plant cell culture media
Several hundreds of nutrient media have been formulated for plant cell, tissue,
and organ culture in vitro (George et al, 1987). These media containing macro and
micro nutrients, vitamins, and other organic supplements are used along with a variety
of combinations of phytohormones. Various basal media, which differ in their source
of nitrogen, phosphorous, potassium, and other minerals, were devised primarily for
an optimum biological response viz., growth, regeneration, accumulation of secondary
metabolites, in the target species (Murashige and Skoog, 1962; Schenk and
Hildebrandt, 1972; Litvay et al, 1985). However, the different sources of these

121
nutrients and the minerals have a bearing on the physico-chemical properties of the
culture medium as well which, in turn, influence the biological responses. Osmotic
pressure and ionic strength of culture medium influence the membrane transport (De
Klerk-Keibert and van der Plas, 1985). pH and ionic strength affect the activities of
extracellular enzymes and secretion of secondary metabolites (Zink and Veliky, 1979;
Reid et ah, 1980; Ambid and Fallot, 1987; Husemann et al., 1990). Several workers
have observed that the plant cell culture media, in general, have poor buffer capacity
(Butenko et al., 1984; Skirvin et al., 1986). Attempts were made to improve the buffer
capacity of the medium by incorporating external buffers such as MES, PIPES,
HEPES, and Tris with some success (Parfitt et al., 1988; Benthorpe and Brown, 1990).
However, there are no quantitative data on the buffer capacity of the plant cell culture
media. Viscosity and density determine the buoyancy of cells and cell aggregates in
suspension cultures and influence the solubility of oxygen and mass transfers (Blanch
and Clark, 1996). To our knowledge there is no comprehensive report on the physico-
chemical properties of plant cell culture media. In the present study osmolarity,
conductivity, buffer capacity and the solubility of oxygen of few commonly used plant
cell culture media were studied.
Considerable differences were recorded for both conductivity and osmolarity of
various media studied (Table 3.1). Though a high conductivity, in general, indicates a
high ionic strength, it was not possible to estimate the absolute value of ionic strength
because of the differential equivalent conductances of the compounds. While the
experimentally determined conductivity values are comparable to the calculated ones
of George et al. (1987), the osmolarity strength of various plant cell culture media
determined in the present study deviated from the calculated values. This may be due
to the complete dissociation of all the electrolytes, and the incomplete dissociation of
the non-electrolytes and the partial hydrolysis of sucrose during autoclaving. Osmotic
pressure of the nutrient medium is known to exert a crucial

122
effect on growth (Wiznsama et al, 1986), regeneration (Kavi Kishore, 1987), and
secondary metabolite production (Rajendran et al., 1992). Normally, the osmolarity of
the culture medium is less than that of the cytoplasm to enable water to flow into the
callus (Kirkham and Holder, 1981). The cells of many plants which are native of sea
shores or deserts (for example, many cacti) characteristically have a low water
potential and in consequence may not be cultured in media with a relatively low
osmotic strength. Such plants needed media with high sucrose concentration (4 - 6%)
(Mauseth, 1979; Lassocinski, 1985).
All the nutrient media studied showed a poor buffer capacity (Fig. 3.6). The
differences in the buffer capacities of the various nutrient media studied were due to
the differences in the concentrations of P04 and B03 ions (Table 3.1). It is well
documented that the pH of the culture medium plays an important role in growth,
regeneration, and secondary metabolite production. The success of Lloyd and McCown
(1981) as a woody plant medium may be explained in the light of its moderately high
buffer capacity (576 µmole 1-1 at pH 5.5) which may prevent the woody tissues from
being subjected to extreme acidity from leaching phenolic acids. While the addition
of external buffers such as 2-(N-morpholino)ethanesulphonic acid (MES), tris
(hydroxymethyl)aminomethane (Tris) etc., could enhance the buffer capacity of the
plant tissue culture media (Tiburcio et al., 1989, Koop et al., 1983), these compounds
are reported to have side biological effects which are unrelated to their buffering
capacity (Klein and Manos, 1960). As suggested by Owen et al. (1991), only the
development of plant tissue culture media with increased buffer capacity could
alleviate the effect of pH changes on culturing.
The solubility of oxygen in the various cell culture media studied ranged from
7.01 - 7.79 mg l-1 (Table 3.1), corresponding to 87 - 96% of the solubility in distilled
water. Because of a phenomenon called 'salting out,' slightly less oxygen dissolves in
plant cell culture media than in water due to the presence of salts and non-electrolytes

123
such as sucrose.
There are varied reports on the effect of partial pressure of dissolved oxygen.
Growth rate of Euphorbia pulcherima cells in suspension cultures was maximum when
the partial pressure of oxygen was 60%) of saturation and declined rapidly only when
the P02 dropped below 10%> (Preil et ai, 1988). On the other hand, embryogenic
alfalfa suspensions needed over 70% saturation for maximum growth (Stuart and
Strickland, 1987). DO concentration has a critical effect on the growth and
differentiation of carrot tissue (Kessell and Carr, 1972). However, from the literature,
it appears that the differential biological responses of various plant cell culture media
may not be due to the differences in the solubility of oxygen in view of the close
range of oxygen solubility observed in the present study.
Selection of plant tissue culture media for in vitro studies has been largely
empirical. However, there are fragmentary information on the type of tissues
correlating with their specific requirements for a desired response. In the present study,
it was tried to relate the physico-chemical properties of certain media to their
biological responses based on the literature data. It was beyond the scope of this study
to see the behaviour of various tissue cultures under varied physico-chemical
properties. However, the information obtained from this study may interest some
researchers to look into physico-chemical parameters also in addition to the well
known requirements of phytohormones and other adjuvants for tissue culture.
4.3 Optimization of culture conditions
Influence of basal medium
Macro and micro nutrients have been reported to have considerable influence on
growth and secondary metabolite formation in cultured plant cells (Dougall, 1980).
Generally, increased levels of nitrate, potassium, ammonium, and phosphate tend to
support rapid cell growth while depletion or deficiency of some of these nutrients is

124
associated with growth limitation and a concomitant enhanced secondary metabolism
(Rajendran et al., 1992). B5 medium (Gamborg, 1968) was found to be suitable for
rosmarinic acid production from Anchusa officinalis cultures (DeEknamkul and Ellis,
1985). Fujita et al. (1981) found that the White's (1942) medium supports high
shikonin content in Lithospermum erythrorhizon cell cultures while there was a
reduction in the growth. This led to the development of a two stage culture system,
wherein LS medium was used for biomass accumulation followed by the White's
medium. A similar two-stage strategy was used by Yamamoto and Yamada (1987) for
reserpine production from Rauwolfia serpentina. Zenk et al. (1977) compared the
growth of cell cultures of Catharanthus roseus on seven commonly used culture
media. While cells grew well on all the media tested, alkaloid content varied widely
with the MS medium supporting maximum levels of the indole alkaloid accumulation.
The results obtained in the present study are in contrast to the above findings.
Of the four different basal media studied, MS was found to be optimum in terms of
both the biomass and anthocyanin content (Fig. 3.7). This is obviously due to the
growth-associated nature of the product in the present cell line. The similar response
has been noted in several other culture systems (Takeda, 1988; Hirasuna et al., 1991).
The above findings imply a simple single stage culture format for large scale
cultivation of the D. carota cell line developed in the present study.
Influence of hormones
Hormonal composition is often a critical factor in secondary metabolite
production. The type and concentration of auxin and cytokinin, usually in combination,
have been known to profoundly influence the product formation as well as growth of
plant cells in culture (Gamborg et al., 1971).
Experiments were conducted to find out the hormonal supplementation required
to maximize the production of anthocyanin. 2,4-D showed a dose dependent increase

125
in the biomass, while its presence was inhibitory to anthocyanin biosynthesis. On the
other hand, another auxin, IAA, promoted anthocyanin content as well as biomass
(Table 3.2). While cytokinins, singly, did not influence considerably either the growth
or anthocyanin formation (Table 3.3), a combination of IAA and Kn resulted in the
maximum production of anthocyanin (Fig. 3.8).
Several studies showed that 2,4-D has an inhibitory effect on the synthesis of a
wide range of secondary metabolites (Furuya et al., 1971; Zenk et al., 1975; Mantell
and Smith, 1983). Zenk et al. (1977) observed that indole alkaloid accumulation in
Catharanthus roseus was generally depressed by the addition of 2,4-D to media. The
substitution of 2,4-D by another auxin, IAA, allowed high levels of the indole alkaloid
accumulation in non-dividing cultures, while the inclusion of NAA allowed simultaneous alkaloid accumulation and cell division (Morris, 1986,). In general, the
presence of 2,4-D in the medium causes dedifferentiation of the tissues, and
consequently diminishes the levels of secondary products. However, there are a few
examples where 2,4-D supported the biosynthesis of secondary metabolites. Production
of L-DOPA by Mucuna pruriens (Brain, 1976), formation of ubiquinone in Nicotiana
tabacum cells (Ikeda et al., 1976), and diosgenin in Dioscorea deltoidea tissues (Staba
and Kaul, 1971) was stimulated by high levels of 2,4-D. Incidentally, capsaicin
production from Capsicum frutescens, the another cell line used in the present studies
on continuous production in bioreactors, was optimized using 2,4-D in shake flasks
(Suvarnalatha et al, 1993).
A survey of the plant hormone literature will quickly reveal contradictory results,
and species/tissue differences in response preclude a clear general view of the primary
effects of these substances, and make prediction of likely responses in culture
experiments almost impossible.
The present study found that, from the balance of growth and anthocyanin
content, the combination of IAA and Kn (2 mg l-1, and 0.2 mg l-1, respectively) was
126
optimum for the maximum production of anthocyanin from D. carota cells.
Influence of pH
Little work on the effect of pH on growth and product accumulation in cell
cultures has been published. Koul et al. (1983) showed that the growth and alkaloid
accumulation were affected to different extents by the initial medium pH in cultures
of Hyoscyamus. Mukundan and Hjorsto (1991) reported that the growth and thiophene
accumulation by hairy root cultures of Tagetes patula were maximum at a pH 5.7,
followed by pH 6.0. The yield was lowest at pH 4.0. Optimal growth in plant cell
cultures usually occurs in media with the initial pH values in the range of 5-6. In the
present study, it is observed that both the growth and production of anthocyanin were
maximum at pH 5.5.
Influence of temperature
Temperature is an another culture parameter which needs to be optimized.
Experiments on the effect of temperature on growth and production of anthocyanin
from D. carota cells revealed that 25 °C is the optimum (Fig. 3.14). Both the lower
and higher temperatures than the optimum resulted in a substantial decrease in the
anthocyanin content even though the biomass accumulation was unaffected.
Though there are not many studies, the optimum temperature for growth and
production of secondary metabolites is generally in the range of 20 - 35 °C. Cell
cultures of different species showed varied degree of sensitivity for temperature
(Tulecke and Nickell, 1960; Matsumoto et al, 1972; Rose and Martin, 1975; Kato et
al, 1976; Morris, 1986a). Lockwood (1984) showed that temperature extremes had
little effect on the pattern of alkaloids accumulated by four Papaver species in culture.
Courtois and Guern (1980) have previously studied the effect of temperature on
growth and indole alkaloid accumulation in C. roseus cultures and found a ten fold

127
increase in the cellular alkaloids at 16 °C compared to the accumulation at a
temperature of 27 °C, which, however, gave higher growth rate. However, in terms of
the alkaloid productivity, no net gain was observed at the low temperature. On the
other hand, Morris (1986b) reported that a cell line of the same species, C. roseus, had
a maximum growth rate at 35 °C while the alkaloid content was less, and concluded
that 25 °C is the optimum for the maximum yield of the alkaloid. Hilton and Rhodes
(1990) found that the concentration of hyoscyamine in the cultured hairy roots of
Datura stramonium was only 60% of that found at 30 °C. Hirasuna et al. (1996)
reported that the taxol production from cultured Taxus baccata cells varied seasonally.
They pointed out that the unavoidable fluctuation in temperature is one of the reasons.
They also noted that the growth rate is virtually constant in spite of the temperature
changes.
The optimum temperature of 25 °C observed in the present study is near to the
ambient temperature and, hence, there may not be any difficulty in controlling the
temperature in large scale culture of D. carota cells. Further, the metabolic heat
generation is almost negligible in all plant cell cultures.
Optimum inoculum density
Plant cells are usually cultured at a certain cell density in order to initiate cell
division. This is called the minimum critical inoculum density, below which the cells
cannot start multiplying. Mori et al. (1993) observed that the strawberry cells took
long time to grow when the inoculum was small (1 g fresh cells in 100 ml). It is
believed that there is a conditioning factor which is required at a certain level to
stimulate the cell division (Stuart and Street, 1969). At small initial inoculum density,
concentration of this factor becomes low, and it takes long time for build-up of the
same resulting in a prolonged lag phase. Yamakawa et al. (1985) reported that the
conditioning factor is functional even after autoclaving at 120 °C for 10 min.

128
Inoculum size has been reported to influence secondary metabolite production
(Rokem and Goldberg, 1985; Liang et ah, 1991). Su and Lei (1993) reported that
rosmarinic acid productivity in perfused Anchusa officinalis cultures increased with the
inoculum size, up to 4 g dry cells 1-1 , while the maximum cell concentration was not
affected by inoculum size between 1 and 11 g dry cells 1-1 . Stimulatory effects of
inoculum size on anthocyanin accumulation in a carrot suspension culture (Ozeki and
Komamine, 1985), and shikonin production by Lithospermum erythrorhizon cell
cultures (Fujita and Hara, 1985) were also reported. In suspension cultures of
Holarrhena antidiysenterica, total alkaloid concentration increased with increasing
inoculum level up to 3 g 1-1 , giving a final cell concentration of 15.5 g 1-1 and
alkaloid concentration of 23.5 mg 1-1 at this level (Panda et ah, 1992). In addition,
Matsubara et al (1989) demonstrated that for high density fed-batch cultures of Coptis
japonica, the cell concentration and berberine production increased with the increasing
inoculum size up to 8 g dry cells 1-1. At the highest inoculum concentration, the
biomass obtained was 55 g dry wt. 1-1 with a production of 3.5 g berberine 1-1
medium. Apart from the inoculum size, the age of the inoculum is also influential on
growth and secondary metabolite formation. Stafford et al. (1985) showed that the
young, rapidly multiplying cells of Catharanthus roseus possessed the greatest ability to
form biomass and also to accumulate alkaloids.
The results of the present study on the level of inoculum density indicated (Table
3.5) that the minimum critical inoculum density for the cell line used is rather low,
and suggests an inoculum density of about 20 g fresh cells 1-1 would be optimum for
a batch culture period of 14 days.
4.4 Growth and production of anthocyanin
The growth cycle of a typical plant cell suspension culture is essentially similar
to that of microorganisms, although the time scale is much longer. The lag,
129
exponential, stationary, and death phases can be interpreted as adaption, rapid growth,
nutrient limitation, and cell lysis, respectively (Warren, 1992). The growth profile of
the D. carota cell line employed in the present study showed this typical pattern (Fig.
3.10). The estimated specific growth rate (µ) of 0.22 day-1 , which corresponds to a
doubling time of 3.2 day, is within the range reported for several plant cell cultures.
However, the most rapidly growing plant cell culture that has been reported is
Nicotiana tabacum (Noguchi et al, 1982) which has a doubling time of 18 h.
However, several complex growth profiles have reported for plant cell cultures
(de Gunst et al., 1990). These varied patterns of growth appear to have an underlying
constant somaclonal variations and adaptation of cells to the dynamic environment.
Numerous investigations on the time-course of product accumulation in relation
to the growth of cells have revealed two basically different patterns (Sakuta and
Komamine, 1987). A non-growth associated product formation, in which the product
is formed during the late exponential, or stationary phase. This indicates an inverse
relationship between the growth and product. Anthocyanin formation in Daucus carota
cultures has often been cited as an example for this type of product pattern (Barz et
al., 1990). However, the D. carota cell line used in the present study exhibited the
other type of product formation, namely the growth-associated product formation (Fig.
3.11). Interestingly, the unselected primary cultures of D. carota did show the former
product formation pattern (Fig. 3.5). This reveals that there was a shift in the product
formation pattern with the selection of cells. However, Payne et al. (1987) made a
strong remark that many reports in the plant cell literature have erroneously interpreted
a constant level of product in the cells of a growing culture to mean that product
synthesis was not occurring when in fact the production rate was directly proportional
to the growth rate.
It appears that the so-called growth-, and non-growth associated product patterns
are only idealized situations representing the two extremes. The accumulation of

130
secondary metabolites in cultures is the result of a dynamic balance between
biosynthetic, biotransformational, and biodegradative processes. This situation is
complex and is undoubtedly the reason why mainly empirical approaches have been
adopted so far in studies on cultural factors which influence the accumulation of
secondary metabolites.
4.5 Size distribution of cell aggregates
Plant cells in suspension cultures tend to aggregate and form clumps, resulting
in a heterogeneous population of cell clusters, ranging from a few cells to several
thousands of cells, some times measuring a few centimetres in diameter. The size of
cell aggregates has implications in the design and operation of bioreactors, and in the
downstream processing (Panda et al., 1989; Doran, 1993). Various biochemical
parameters such as cytochrome oxidase, peroxidase, and catalase activities, rate of
protein synthesis, pool size of free amino acids, and secondary metabolite
accumulation and regeneration have been found to depend on cell cluster size (Street,
1977; Gana et al., 1995). The cluster size is presumably governed by the degree of
cohesiveness of the cells which is a function of the composition of cell wall. High
auxin concentrations have been reported to result in fine suspensions. Cell aggregation
can be controlled by culture methods, such as repetitive selection for small cell
aggregates and cell plating (Dixon, 1985). Lowering of Ca2+ (Takayama et al., 1977),
and the addition of sorbitol and cell-wall degrading enzymes, such as pectinase and
cellulase (King et al., 1974), lessen the aggregation of cells in suspension cultures. In
bioreactors, aeration and agitation operations exert hydrodynamic stresses, affecting
the cell aggregation (Tanaka et al., 1988). While a smaller size of cell aggregates is
preferred from the stand-point of process engineering, a certain degree of cell-cell
contact (Lindsey and Yeoman, 1983) and cell differentiation (Steward et ah, 1958) is
often required for the synthesis of secondary metabolites. A detailed knowledge of the

131
biological and engineering aspects of the size of cell aggregates is a prerequisite for
the optimization of process parameters.
In the present investigation, therefore, size distribution of cell aggregates, the
effect of cell aggregate size on anthocyanin content, and the biochemical differences
in various size groups of cell aggregates were studied in detail.
The profile of biomass distribution, in terms of percentage of total dry weight,
remained unchanged during the culture with over 92% of biomass present in the
aggregates of 500 - 1500 µm in diameter (Fig. 3.15). This observation is in agreement
with that of Tanaka et al. (1992), who reported that there was only a slight change in
the size distribution of Catharanthus roseus cell aggregates during the batch culture
in a liquid medium. The cell aggregates of Oryza sativa were, however, smaller in the
stationary phase than in the logarithmic growth phase. Mavituna and Park (1987)
reported that the size distribution of cell aggregates of Capsicum frutescens in
suspension cultures was Gaussian with a mean and standard deviation of 2.29 and
1.21 mm, respectively.
The anthocyanin content showed an increase with the increase in cell aggregate
size up to a diameter of 500 - 850 µm (Fig. 3.16). This can be expected, because a
certain degree of cell aggregation is required for secondary metabolite synthesis.
Buitelaar and Tramper (1992) have reported that the dispersed cells of Tagetes patula
could not synthesize pyrethrins. Gana et al. (1995) have reported that, for regeneration
of Avena spp. cell suspension cultures, the minimum cluster size is 3 mm. However,
the anthocyanin content decreased sharply, when the cell aggregate size exceeded
500 - 850 µm (Fig. 3.16). A similar observation, that a cell aggregate diameter of 12
mm was critical for the maximum production of thiophenes in Tagetes patula cell
cultures has been reported by Hulst et al. (1989). These findings suggest that while the
aggregation of cells into clumps can impart some sort of rudimentary organization,
other factors, such as mass transfer resistances, come into effect. These opposing

132
factors perhaps get balanced at a particular size of cell aggregate for the maximum rate
of secondary metabolism.
In contrast to the profile of anthocyanin content, the surface colour intensity, as
measured in terms of the red-green coordinate value of CIELAB Color Space, showed
a steady increase with the increase in cell aggregate diameter (Fig. 3.18). The high
surface colour intensity and the low anthocyanin content in the larger cell aggregates
indicate a steep radial gradient of anthocyanin content along the radius of the cell
aggregates. Based on the measured respiration, and on an effective diffusion
coefficient of 1.9 x 10⁻⁹ m-2 s-2 of the cell aggregates of Tagetes patula, Hulst et al.
(1989) calculated that the oxygen supply would not be limiting to cell aggregates of
up to 3 mm diameter. The maximum cell aggregate size in the present study was much
less than 3 mm. Spier (1995) has opined that, in view of the slow growth and
metabolic rates, the plant cells do not seem to suffer from any mass transfer
resistances along the radius of the small cell aggregates. One plausible explanation for
the observed gradient of anthocyanin in the cell aggregates is the availability of light,
which is an important factor in the biosynthesis of anthocyanins and flavonoids (Zhong
et al., 1991; 1993a). The intensity of light decreases along the radius of the cell
aggregate, with the result that the cells at the core receive less light compared to those
in the outer layers. A photoprotective role of the anthocyanins, in the sub-epidermal
layer of cotyledons and hypocotyls of tomato seedlings, has been considered recently
as part of a mutual, negative regulation of anthocyanin accumulation at early stages of
chloroplast development (Bowler and Chua, 1994). It has been speculated that
anthocyanins function as green light filters in vegetative tissues (Stafford, 1994).
The present study has shown that there is a positive relationship between the
anthocyanin content and the cell aggregate size, and that there exists a steep radial
gradient of anthocyanin content along the radius of the cell aggregates. Light probably
playing a role, a critical size of cell aggregate is necessary for maximum production

133
of anthocyanin.
4.6 Nutrient uptake
Quantitative information on growth kinetics, sugar utilization, respiratory
requirements, biomass and product yields, yield coefficients of key nutrients is
essential and forms the basis for process optimization, design, monitoring and control,
and scale-up strategies. Further, these are the key parameters which form the basis of
the analysis of process economics. Much can be gained in our understanding of
physiology of growth process by studying the nutrient uptake kinetics.
Yield coefficients are biological variables, which are used to relate the ratio
between various consumption and production rates of mass and energy. They are
typically assumed to be time-independent and are calculated on an overall basis. The
yield coefficients are very useful, particularly in the cases, like the D. carota cell line
used in the present study, where the biomass composition is quite uniform, product
selectively does not change much during the exponential growth (Fig. 3.11), and
growth associated production (Dunn et al., 1992).
Consumption of sugars
Sucrose is the most commonly used carbon source in plant cell culture media.
The first metabolic step in the conversion of this disaccharide into biomass and other
secondary metabolites is its hydrolysis. Majority of the sucrose is extracellularly
hydrolysed into glucose and fructose by the membrane bound invertases. Invertases,
especially, the acid invertases, are ionically bound to the cell wall (Leigh et al., 1979;
Lauriere et al., 1988; Obenland et al., 1993). Some amount of sucrose is also
hydrolysed in the cytoplasm of cells (Ricardo and ap Rees, 1970). In both D. carota
and C. frutescens cultures, the sucrose was rapidly hydrolysed at a rate of about 4.8,
and 5.2 g sucrose g-1 dry wt. day-1, respectively (Fig. 3.21). Vitis vinifera cells

134
hydrolysed the sucrose present in the liquid medium at a higher specific rate of 7.2 g
sucrose g-1 dry wt. day (Pepin et al., 1995). Though the rapid hydrolysis of sucrose is
a commonly reported feature in plant cell cultures (Thorn et al., 1981; Zamski and
Wyse, 1985; Kanabus et al., 1986), there are several cell cultures in which sucrose
was hydrolysed slowly, and a fair amount of unhydrolysed sucrose was detected even
at the end of the culture period (Zhong et al., 1993.).
The overall consumption of glucose was 86.8 and 50.6% more compared to that
of fructose in D. carota and C. frutescens cultures, respectively (Fig. 3.21). The
preferential uptake of glucose is almost always reported in plant cell cultures (Fett-
Neto et al., 1994; Pepin et al, 1995; Pestchanker et al, 1996). However,
Wickremesinhe and Arteca (1994) have reported that the growth of Taxus cell
suspensions was faster during a period of increased fructose availability, and they
suggest that this may be due to an increased entry of fructose into the cells coupled
with increased fructokinase activity.
As the culture period progressed, glucose and fructose gradually and
proportionately decreased. While the glucose exhausted almost completely, a fair
amount of fructose, about 6 g 1-1 , was left unutilized at the end of culture period in
both the cultures of D. carota and C. frutescens cells (Fig. 3.21). While this is the
common pattern of carbohydrate uptake (Panda et al., 1992; van Gulik et al, 1993),
there are cases on both the extremes of this utilization pattern. The sugar uptake of
Taxus baccata cells in suspension cultures was initially slow and limited to only about
2 g l-1 during the first 10 days (Srinivasan et al., 1995). These cells utilized the
intracellularly stored carbohydrate carried over from the previous culture. On the other
hand, substantial amount of carbohydrate was sequestered inside the cells of Taxus
cuspidata in a Wilson-type bioreactor and redistributed through cell division
(Pestchanker et al., 1996).
The yield coefficients of dry biomass on carbohydrate of over 0.8 g g-1 were

135
observed in the present study, which are slightly higher than those generally reported
for batch culture of plant cells for an initial carbohydrate concentration of 30 g l-1
(King, 1977; Dougall et al, 1982; van Gulik et al., 1989). Ducos and Pareilleux
(1986), for instance, have reported cell yields ranging from 0.39 to 0.55 g g-1,
depending on the aeration rate, for Catharanthus roseus cell cultures. On the other
hand, cell yields of 0.77 g g-1 have been reported for Medicago sativa cells grown on
lactose (30 g 1-1 ) as the sole carbon source (Pareilleux and Chaubet, 1981). The
slightly higher values of the apparent yield coefficient mean a low maintenance
coefficient for the culture systems used in the present study. However, measurement
of the actual maintenance coefficient requires mass balance analysis which necessitates
the inlet and outlet gas analysis, and elemental analysis of the biomass. The apparent
yield coefficient estimated over the entire culture period is often used for comparisons.
However, the batch culture period of plant cell and hairy root cultures varies widely
from 7-60 days. In cultures of long period, considerable amount of the carbohydrate
gets converted into energy required to maintain the metabolism, and, hence,
comparisons based on the apparent yield coefficients lead to considerable
discrepancies.
Uptake of ions
The typical uptake pattern of NH4+, N03
-, and P04-3 correlating well with the
accumulation of biomass was observed with dry biomass yield coefficients of 0.94,
0.58, and 15.95 g mmol-1 of NH4+, N03
-, and P04-3, respectively, for D. carota, and
0.89, 0.52, and 14.79 g mmol-1, respectively, for C. frutescens cells in suspension
cultures (Fig. 3.22; Fig. 3.23). The uptake of ammonia was rapid compared to that of
nitrate. Kwok and Doran (1995) observed a linear relationship between biomass
production and consumption of nitrate, and ammonium ions, in Atropa belladonna
hairy root cultures in MS medium. A similar linear relationship between the uptake

136
of N03-1, S04
-2_, K+ , and Ca+2 , and the accumulation of biomass, with the only
exception of P04-3 , which was entirely taken up in the first 24 hours, was reported in
tobacco cell cultures (Kato et al, 1977). This linear relationship appears to be the
general pattern of ion uptake by plant cell cultures. In fact, it is this relationship which
forms the basis of estimation of biomass based on conductivity of the culture media,
which is one of the commonly used method of biomass estimation, especially in
bioreactor cultivation of plant cells.
The present study on carbohydrate, and ion uptake revealed the patterns of their
utilization and generated quantitative kinetic data.
4.7 Measurement of biomass in plant cell cultures
Medium conductivity and estimation of biomass
A linear relationship between the uptake of N03-1, S04
-2_, K+ , and Ca+2, and the
accumulation of biomass is the typical pattern of ion uptake in plant cell cultures
(Kato et al., 1977; Kwok and Doran, 1995). Electrical conductivity of a nutrient
medium gives a measure of the ionic concentration in the medium and forms a
convenient means of biomass estimation without the recourse to direct cell sampling.
Changes in the conductivity of the nutrient medium in D. carota and C.
frutescens cell suspension cultures were monitored in order to estimate the
relationship between the conductivity and the biomass accumulation (fig. 3.24). The
analysis of medium conductivity and the biomass density showed a linear decrease in
conductivity with the increase in the biomass of the both D. carota, and C. frutesences
cells (Fig. 3.25).
In an early study of plant cell suspension cultures, Hahlbrock and Kuhlen (1972)
reported a concomitant decrease in medium conductivity and increase in fresh weight
during the growth of cell of Petroselinum hortense and Glycine max. Though the
pattern of decrease in the conductivity appeared graphically to mirror that of increase

137
in cell concentration, the precise relationship between the two variables was not
quantified. From a comprehensive study, Taya et al. (1989a) reported linear
correlations between increase in cell dry weight and decrease in conductivity for
shake-flask cultures of Coffea arabica, Nicotina tabacum, Withania somnifera, and
Catharanthus roseus. The direct proportionality between changes in dry weight and
conductivity was expressed in the form of the Eq. 3.1 on page 83. The values of the
proportionality constant (k) for the above four species were -3.6, -2.8, -3.2, and -4.1 g
dry wt. 1-1 mS-1 , respectively. D. carota and C. frutescens cell cultures, investigated
in the present study, showed the similar linear relationship with the proportionality
constant of-5.29, -5.56 g 1 mS-1 , respectively. There is a considerable difference in
the values of the proportionality constant from species to species, and the values
observed for the culture systems used in the present study are slightly higher compared
to those reported by Taya et al. (1989a). This is obviously due the differences in the
yield coefficients of biomass on different ionic compounds, and a higher value for the
proportionality constant implies higher yield of biomass on ionic nutrients. While Taya
et al. (1989b), in another study, reported a value of 2.13 g 1-1 mS-1 for Armoracia
rusticana roots, Ryu et al. (1990) reported a proportionality constant of 4.6 g 1-1 mS-1
for suspension cultures of Pyrus communis L.
However, there are several limitations in the use of conductivity for estimation
of biomass. Firstly, it is less sensitive to measure small increases in biomass as it
depends only on the electrolyte concentration of the nutrient medium, and ignores the
sugars which are present in more concentration than all the other nutrients put
together. An investigation on the individual contribution of different media constituents
showed that the sugars did not contribute positively towards the medium conductivity
(Table 3.7). Instead, the presence of sugars slightly reduced the conductivity value due
their characteristic lowering of ionic mobility, which was also observed earlier by
Taya et al. (1989a). This means that the decreasing concentrations of sugar, due to the

138
uptake of cells, would push up the conductivity value. Thus the negative contribution
of sugars towards the conductivity results in its less sensitivity to measure biomass.
Further, the conductivity failed to correlate to growth of Catharanthus roseus hairy
roots (Toivonen et al., 1990), and Medicago sativa cell suspensions (McDonald and
Jackman, 1989). This is possibly due to the non-linear relationship of ionic uptake and
the growth of biomass. Kwok et al. (1992) studied the limitations associated with
conductivity measurement for monitoring the growth in Atropa belladonna cell
cultures and found that it also depends on the inoculum density.
Medium osmolarity as a measure of growth
Having studied the limitations on the sensitivity of conductivity for measurement
of biomass, another similar property of nutrient medium, namely the osmolarity, was
explored for its suitability as an index for estimation of biomass. It was found that
there is a fair linear relationship between the increase in biomass and the decrease in
osmolarity of the culture media of both D. carota and C. frutescens cell culture
systems (Fig. 3.27).
However, there was a sharp increase in osmolarity of the culture media as a
result of the hydrolysis of sucrose into glucose and fructose. The equation 3.2
presented on page 91 could relate all the variables. As all the constituents contributed
towards the osmolarity of the culture medium, its measurement correlated well with
the increase in biomass in both the cultures studied. In culture systems where sucrose
is hydrolysed rapidly before the onset of log phase, the parameter XTmax in the
equation becomes equal to the inoculum density. On the other hand, if sucrose is
hydrolysed slowly, the extent of initial enhancement of osmolarity will be reduced
because of the reduction in formation of glucose and fructose. The concomitant growth
of cells that tend to use glucose and fructose would push down the osmolarity. This
leads to less sensitivity and a more difficult calibration.

139
However, the rapid hydrolysis of sucrose has been reported in several cell culture
systems (Thorn et al., 1981; Zamski et al., 1985; Kanabus et al., 1986), and, hence,
the method of biomass estimation based on the osmolarity of culture medium,
developed from the present study, may be applicable to many plant cell cultures.
Further, osmolarity is an important culture parameter in itself.
Estimation of biomass based on the turbidity of cell-free medium
Turbidimetric measurement of biomass is the most commonly used method in
bacterial cultures. Sung (1976) showed that this method can be used for very fine
suspension cultures of plant cells. However, turbidimetric measurements are
satisfactory only in cases where the suspensions are fine, or have small cell aggregates
with a narrow size distribution (Lescure, 1966; Wilson et al., 1971). In most of the
cases, the plant cells in suspension culture tend to aggregate and form clumps, ranging
from a few cells to aggregates measuring a few centimetres in diameter. Consequently,
the turbidimetric measurement of biomass of plant cells in liquid suspension cultures
has been difficult. Further, since the density of the plant cell aggregates is usually
higher than that of most of the liquid nutrient media, the cell aggregates sediment
immediately after the mixing is stopped. Tanaka et al. (1992) developed a specialized
spectrophotometric system - with a rotating magnetic bar inside the sample cuvette -
to keep the culture fluid homogeneous during the measurement. Aoyagi et al. (1992)
suggested the use of solutions of different densities to prevent the plant cell aggregates
from sedimenting during the measurement of optical density. Kubek and Shuler (1978)
developed a sonication-optical density method for estimation of plant cell biomass.
However, it is very difficult to obtain a representative sample in many plant cell
culture systems. Zhong et al. (1993b) used a laser turbidimeter for on-line
measurement of biomass.
Plant cells of many species in suspension culture are known to secrete a variety
140
of polysaccharides, proteins, peptides, fatty acids, polymers of pectic acids, etc.
(Morvan, 1982; Hale et al, 1987; Otsuji et al., 1994; Wangsamuth and Doran, 1994),
resulting in the culture medium to becoming turbid and viscous. In the present study,
the relationship between the turbidity of cell-free culture medium and the cell biomass
was investigated for its possible use as an index for the estimation of biomass using
Capsicum frutescens and Daucus carota cell cultures.
There was a continuous secretion of polysaccharides and proteins by both the
cultures into the nutrient medium (Fig. 3.28). By the end of the log phase of growth,
there was an accumulation of 1.05 and 1.2 g l-1 of polysaccharides, and 0.71 and 0.78
g 1-1 of proteins in the cell-free media of D. carota and C. frutescens cultures,
respectively. It is well known that the plant cells in liquid medium secrete a variety of
polysaccharides (Becker et al, 1964; Mante and Boll, 1975; Akiyama and Kato,
1982). Otsuji et al. (1994) reported 4.6 g 1-1 of extra cellular polysaccharides in
Polianthus tuberosa cell cultures. Hale et al. (1987) observed that the liquid nutrient
medium became highly viscous with the secretion of polysaccharides from Phleum
pratense cells in suspension cultures. Microscopic observation of the cell-free medium
showed the presence of cell debris. Bruke et al. (1974) found that the composition of
extra cellular polysaccharides in Sycamore cell suspension cultures was very similar
to that of the cell-wall polysaccharides.
As a consequence of the secretion of polysaccharides and proteins by the cells
of C. frutescens and D. carota, the nutrient media gradually became turbid and
viscous. Figure 3.29 shows the relationship between the increase in the turbidity of the
cell-free medium and the growth of cell biomass. Recently, Glicklis et al. (1998)
studied kinetics of extracellular polysaccharides in Symphylium offlcinalis cell cultures.
Though the relationship between the extracellular polysaccharides and biomass is not
linear in this culture system, the predicted values by a non-linear model correlated well
with the experimental values. This definite relationship, linear or non-linear,

141
demonstrates the possibility of using the turbidity of cell-free medium for estimation .
of biomass in plant cell suspension cultures.
The sensitivity of this method depends on the magnitude of the empirical
constant (k) (Eq. 3.3 on page 94). A lower value for k means a large change in the
turbidity of the cell-free medium for a relatively small increase in the biomass. Table
3.8 summarizes the effect of filter mesh size on the estimation of biomass in D. carota
and C. frutescens cell suspension cultures. As it can be seen, a fine mesh (37 µm)
gave a better correlation, but a higher value for the empirical proportionality constant
(k). On the other hand, a wider mesh (88 µm) gave a lower value for k but a poor
degree of correlation. Microscopic examination of the cell-free medium obtained by
the filter of mesh size 88 µm showed the presence of single cells at low density. The
reason for a moderate correlation between the turbidity of the cell-free medium and
the increase in the biomass in spite of the presence of cells may be due to the near
constant size distribution of cell aggregates in both the culture systems (Mavituna and
Park, 1987).
However, in view of the fact that a number of factors such as medium
composition, phytohormones, aeration, and agitation influence the degree of the
secretion of extra cellular compounds (Hale et al, 1987; Otsuji et al, 1994), for a
given culture system an optimum size of the filter needs to be selected for the
estimation of biomass based on the turbidity of cell-free culture medium.
The present study demonstrates a linear relationship between the turbidity of
cell-free medium, and the increase in biomass of D. carota and C. frutescens cells with
a good correlation, and suggests its possible use as an index for estimation of biomass.
4.8 Growth and production of anthocyanin in bioreactor
The mass cultivation of plant cells in bioreactors has been demonstrated long
back (Tulecke and Nickell, 1960). Since then a large number of plant cell cultures

142
were studied using bioreactors for understanding and optimization of process
parameters, and for feasibility studies (Byrne and Koch, 1962; Hahlbrock et al., 1974;
Smart and Fowler, 1984; Srinivasan et al., 1995; Bhqme et al, 1997).
In the present investigation, D. carota cells were cultured in a stirred tank
reactor of 2 L volume. As it is observed in the present study (Fig. 3.30), the growth,
product formation, and nutrient uptake kinetics are usually comparable in shake-flask
cultures and low volume bioreactors (Fowler, 1986). There was a total production of
2.7 g 1-1 of anthocyanin in 14 days of culture. Kobayashi et al. (1993) reported a 1.09
g 1-1 of anthocyanin from Aralia cor data cell cultures in a 500 L fermenter in 16 days
of culture. The special feature of this cell line was that it does not require light
irradiation for growth and anthocyanin formation.
The absence of the breakage of cell aggregates, and the high viability of cells
observed in the present experiments in the bioreactor, demonstrate the shear tolerance
of the D. carota cell line employed in the studies. Though it was thought earlier that
plant cells are sensitive to shear stress (Mandels, 1972), the shear tolerance of plant
cells was subsequently demonstrated for several species (Kato et al., 1975; Noguchi
et al., 1977; Scragg et al., 1988). Catharanthus roseus cell suspensions exposed to
1000 rpm in a 3 L stirred tank bioreactor, showed no loss of viability.
The observations on the yields of biomass and product, and the shear tolerance
of cells in the present study are encouraging and suggest that a stirred tank reactor
system may be employed for large scale cultivation of the D. carota cell line used in
the studies. Stirred tank reactor has several advantages over many other types of
bioreactors. Further, the growth-associated formation of anthocyanin, observed in the
present study, eliminates the need for a two-stage culture.
Oxygen requirement of D. carota and C. frutescens cells
Oxygen is an important nutrient required for the respiration of plant cells, and

143
it is the least soluble among all the other compounds of the nutrient media. Plant cells
require less oxygen than microorganisms because of their slow metabolism. However,
little quantitative work has been published on the effects of gas regime to which the
cells are exposed. Various studies show that plant cells are sensitive to dissolved
oxygen concentration. High oxygen concentrations depress cell growth (Smart and
Fowler, 1981), secondary metabolite accumulation (Yamakawa et al., 1983), and other
metabolic activities (Pareilleux and Chaubet, 1981). Growth and product formation
kinetics were altered by high DO (Zenk et al., 1977). High aeration rates may strip-off
nutrients such as C02 from the culture broth (Maurel and Paeilleux, 1985; Ducos and
Pareilleux, 1986). C02 is often considered as an essential nutrient in the culture of
plant cells and has a positive effect on growth (Gathercole et al., 1976; Maurel and
Pareilleux, 1985). Some workers have used the low agitation and high aeration in
stirred tank reactors to supply oxygen in a reasonable mixing range (Kato et al., 1977;
Drapeu et al., 1986). The rate of oxygen transfer from gas phase to the cell site is
generally expressed in terms of KLa (volumetric mass transfer coefficient of oxygen,
in h"1) (Aiba et al., 1973). The KLa value depends on several factors such as the rate of
agitation, aeration, the nature of the particular plant cell as well as the culture fluid,
dimensions and geometry of the reactor vessel. High KLa means better oxygen transfer,
but reported to cause poor cell growth (Tananka, 1981), and even cell death (Kato et
al., 1975; Pareilleux and Vinas, 1983). On the other hand, low KLa do not support
good growth. Reports suggest that the suspension cultures of Nicotiana tabacum (Kato
et al., 1975), Catharanthus roseus (Smart and Fowler, 1981), and Vitis spp.
(Yamakawa et al., 1983) cells grow better at a restricted range of KLa.
Quantitative data on the exact requirement of oxygen, and profiles of oxygen
consumption rate is essential for designing the reactor vessel, balancing agitation and
aeration rates, and scale-up.
In the present investigation the oxygen requirement of D. carota and

144
C. frutescens cells was estimated (Fig. 3.32). The specific oxygen uptake rate (qo2)
of D. carota was 0.75 mmol g-1 h-1 , while it was 0.57 mmol g h for C. frutescens
cells in suspension cultures. This low oxygen consumption rate is within the range of
0.2 - 1.0 mmol g-1 h-1 reported for various plant cell culture systems (Drapeau et al,
1986; Spear, 1986; van Gulik et al, 1989; Snape et al, 1989; Taticek et al, 1990;
Schlatmann et al, 1994). However, there are varied reports on the changes in oxygen
demand with culture age. Pepin et al (1995) reported that the specific oxygen
consumption rate of about 0.6 mmol g-1 h-1 remained constant, as observed in the
present study, during the exponential growth of Vitis vinifera cells. However, q02 of
Taxus baccata cells in suspension cultures increased from about 0.1 mmol g-1 h-1
after inoculation to 0.28 mmol g-1 h-1 around day 11 and decreased gradually
thereafter (Srinivasan et al, 1995). This fluctuation in the q02 was attributed to the
change in the specific growth rate. However, both the cell culture systems used in the
present study had a fairly constant specific growth rate.
Another finding from the study was that both the cell culture systems showed
the minimum critical DO concentration of about 30% of air saturation below which
the respiratory rate was affected (Fig. 3.32). This is expected because the low
concentration of oxygen in the bulk fluid limits the supply of oxygen to the site of its
utilization. The critical DO concentration for oxygen uptake by suspended plant cells
has been reported to be 16 - 20% of air saturation under average culture conditions
(Kessel and Carr, 1972; Payne et al, 1987). The minimum critical DO concentration
increases with higher aggregation of cells. Yu and Doran (1994) reported that hairy
root cultures of Atropa belladonna needed 100% of air saturation below which the
growth rate was severely affected due to the high root density. Bligny et al (1985)
studied the effect of low oxygen concentration on Sycamore {Acer pseudoplantanus)
in suspension cultures. They observed that at 10 µM 02 (approx. 4% of air saturation),
the molar proportion of fatty acids dramatically changed in all lipid classes of the cell

145
membrane.
The present study quantifies the oxygen requirement of D. carota and
C. frutescens cells in suspension cultures and shows that about 40% of air saturation
would be optimum for these cells for cultivation in bioreactors. Bohme et al. (1997)
used a DO level of 30% of air saturation for culture of Aesculus hippocastanum cells
in a newly designed membrane stirrer reactor.
Rheological studies on D. carota culture broth
The measurement and control of the rheological properties of culture broth are
of importance as they significantly affect heat and mass transfer, mixing behaviour of
the broth, recovery and purification of products and the response of various sensors
used to monitor and control of culture parameters. Hence, rheological considerations
are critical in the interpretation, planning and control of basic experiments, the
development of rational scale-up procedures, design and operation of monitoring and
control systems, control of bioprocesses, operation and design of recovery equipment
and in increasing the yield and productivity of fermentation processes (Charles, 1978).
To generate the data needed for scale-up of anthocyanin production from
D. cαrotα cell cultures, some rheological properties of the culture broth was studied
in 2 L bioreactor.
As indicated by the near linear curve passing through the origin of the flow
diagram (Fig. 3.33), the culture broth of D. cαrotα was initially Newtonian in rheology
with an apparent viscosity of 3 cP without any considerable yield stress. The apparent
viscosity of the culture broth remained low during the first 6 days of culture, and
increased rapidly after thereafter to a maximum of 18 cP on 12 day. A similar pattern
of increase in viscosity was observed by Kato et αl. (1978) for tobacco cell
suspensions. At the beginning, their culture had an apparent viscosity of 1.2 cP and it
rose to 33 cP (at a shear rate of 60 s-1 ) when the biomass reached to the maximum
146
of 13.1 g dry wt. 1-1 . The effect of biomass concentration on viscosity of the culture
broth was investigated by Zhong et al. (1992) using Perilla frutescens cell suspension.
They found that the apparent viscosity of the culture was approximately constant when
the cell concentration was below 5 g 1-1 , but the effect of the cell density on
viscosity of the culture broth was very strong when the biomass concentration
exceeded 13 g 1-1 . The viscosity was roughly proportional to the fourth power of the
cell concentration.
The cell aggregate size in the range of <300 - 1500 µm did not show any
considerable change in the flow behaviour of the culture broth (Fig. 3.33), conforming
the similar observation by Zhong et al. (1992).
The culture broth in the late exponential stage, showed shear-thinning
pseudoplastic flow behaviour with a consistency index (k) of 132 (mPa s) 0.57 , and
the flow behaviour index (n) of 0.57 (Fig. 3.33). This non-Newtonian behaviour was
reported for several other cell cultures, such as Catharanthus tricuspidata Bureu,
Nicotiana tabacum L (Kato et al., 1978; Tanaka, 1982), and Perilla frutescens (Zhong
et al, 1992). The flow behaviour of D. carota cell culture broth observed in the
present study including the absence of yield stress is qualitatively similar to that of
Nicotiana tabacum cell suspensions (Kato et al., 1978). However, the culture broth of
Perilla frutescens exhibited the Bingham plastic flow behaviour with an yield stress
of over 0.3 dyn cm-2 (Zhong et al., 1992). Wagner and Vogelmann (1977) found that
the rheological behaviour of the cell suspension of Morinda citrifolia (after 16 days
cultivation) was rather complicated, and they observed shear thinning and thixotrophic
behaviour in addition to yield stress.
The varied behaviour of culture broths of different species even at a comparable
cell densities may be due to an interaction between cell aggregates at high densities
(Oka, 1974), morphology, and the ratio of cell dry weight to fresh weight (Zhong et
al., 1992). There are only a very few reports on the detailed study of these aspects
147
(Tanaka, 1982), while they are extensively studied for microbial cultures (Sato, 1961;
Ghildyal et al., 1987).
However, the culture broths separated from cells in all the above discussed
species, including D. carota used in the present study, were always purely Newtonian
and the viscosity was not considerably high.
The present study on the rheology of D. carota cell culture broth in 2 L stirred
tank bioreactor reveals that the culture suspension changed from Newtonian to non-
Newtonian regime at high cell density.
4.9 Characterization of anthocyanins produced by D. carota cells
The classical paper chromatography method for separation of anthocyanins,
originally developed by Harborne (1958a), was highly satisfactory and used by several
workers for long time (Feluki and Francis, 1967; Feluki, 1969, Francis, 1982). He
reported Rf values for most of the anthocyanins. These Rf values in combination with
the spectral analysis of the extracts and the separated bands such as UV and visible
absorption, the ratio of absorbance at 440 nm to that of maximum absorption (500 -
550 nm) were used to identify anthocyanins (Harborne, 1958b; 1967).
Of the different solvents used to separate anthocyanins in D. carota cell extract,
n-Butanol-acetic acid-water (4:1:5) gave the best separation. The Rf values and the
spectral data of the extract revealed the presence of at least three types of anthocyanins
in the cultured cells. (Table 3.10).
Further analysis of the acid hydrolysed cell extract, by HPLC, showed a single
peak in all the three paper chromatographically separated bands at the same retention
time comparable to that of cyanidin. This clearly showed that the cultured cells
synthesized only the cyanidin. (Fig. 3.36; Table 3.11). The method could clearly
separate the six major anthocyanidins according to their polarity (in the order of:
delphinidin, cyanidin, petunidin, pelargonidin, peonidin and malvidin). The D. carota

148
cells in culture used by Dougall (1980) also synthesized only the cyanidin glycosides.
Paper chromatographic analysis of the sugar moieties showed the presence of
xylose, glucose and galactose (Table 3.12). Occurrence of these three sugars has been
reported by Harborne (1976) in leaves, flowers, stems of Daucus species, and also in
black carrot. Recent studies on wild carrot clones revealed the occurrence of all these
sugars (Halaweish and Dougall, 1990).
The pigments separated by paper chromatography did not show any considerable
absorption in the UV range of 300 - 330 nm suggesting the absence of acyl groups.
The presence of non-acylated anthocyanins in the culture used in the present study is
in contrast to results obtained with wild carrot, wherein, only acylated anthocyanins
are found to accumulate (Hopp and Seitz, 1987; Dougall, 1989). A rare anthocyanin
was isolated from mutant cells of Daucus carota (Vaush et al., 1980) with an yield of
300 mg of purified anthocyanin per litre of cell suspension.
The above analyses suggest that the cell extract of D. carota contained three
anthocyanins namely, cyanidin xylosyl galactose, cyanidin mono glucose and cyanidin
galactose. The spectrophotometric estimations showed that above three were in the
molar ratio of 5:3:2, respectively.
4.10 Studies on continuous production of capsaicin
In vitro production of capsaicinoids by immobilized cells of Capsicum spp. has
been a subject of intense research (Lindsey et al., 1983; Lindsey and Yeoman, 1984;
Hau and Yeoman, 1991; Sudhakar Johnson and Ravishankar, 1996). Immobilization
of biocatalysts offers several advantages (Table 1.6). Reports from our laboratory have
shown that immobilized cells of Capsicum annum and C. frutescens produce
capsaicinoids that leach out into the medium (Sudhakar Johnson et al., 1990, 1991).
Alginate immobilization is viewed as a mild process involving non-toxic components
and a pH, osmolarity, and temperature suitable for preserving the viability of plant

149
cells. Douglas and Phillips (1997) have developed a method to produce small,
monodispersed alginate beads for cell immobilization. Production of capsaicin from
cells immobilized in alginate beads is governed by several factors, such as the bead
strength, hormones, and elicitors. These factors have been extensively studied and
optimized using a response surface methodology (Suvarnalatha et al., 1993).
In the present study, the volumetric productivity of capsaicin has been studied
using a bubble column reactor of 1 L volume. Under the conditions employed, the
maximum productivity of capsaicin was about 2.5 mg 1 day-1 (Fig. 3.37). The total
capsaicin produced was 35 mg 1-1 over a period of three weeks. The gradual softening
and collapse of alginate beads after three weeks of continuous operation was
inevitable.
In another experiment, the immobilization of cells in polyurethane foam (PUF)
was studied. A high cell loading of 0.37 g fresh cells cm of PUF was achieved with
14 days of incubation (Fig. 3.39). The profile of cell loading into the PUF was
qualitatively similar to the growth of cells in liquid medium (Fig. 3.21). In a similar
study, Mavituna and Park (1985) observed that while the overall cell loading pattern
was similar to that of growth pattern, the specific growth rate of cells inside the foam
was slightly less compared to that in liquid medium. In a detailed study, Rhodes et al.
(1987) investigated the factors affecting the immobilization of plant cells in
polyurethane foam using three plant species. They found that the inoculum size and
the length of the incubation period have a bearing on the loading of cells into the
reticulate foam.
Continuous production of capsaicin from the cells immobilized in PUF was
studied using a packed-bed reactor. Interestingly, the specific productivity of capsaicin
with both the alginate and PUF matrix was same which was about 25 mg g-1 fresh
cells day-1 (Fig. 3.40). However, by virtue of the high cell density, the volumetric
productivity in the packed-bed reactor was about 4 fold high compared to that in the

150
bubble column reactor. Lindsey et al. (1983) found that the capsaicin production was
increased by two fold after the immobilization of C. frutescens cells in the pores of
PUF. In a circulating bed reactor, Mavituna et al. (1987) studied the capsaicin
production from the cells immobilized in PUF. They found that the DO concentration
between 0-20% of saturation level resulted in the appearance of capsaicin in the
medium.
The influence of various fungal and bacterial elicitors on capsaicin production
was extensively studied (Sudhakar Johnson et al., 1991). In the present study,
productivity of capsaicin from the packed-bed reactor under the influence of
Aspergillus niger derived elicitor was studied. There was about 60% increase in the
total production of capsaicin resulting in a maximum production of 330 mg 1-1 in a
period of four weeks (Table 3.13).

SUMMARY & CONCLUSION

151
Plant cell culture is now undoubtedly a mature technology for the production of
high value phytochemicals in vitro. The successful large-scale production of shikonin
with cultured plant cells of Lithospermum erythrorhizon has demonstrated the
technological feasibility of industrial scale culture of dispersed plant cells. This has led
to the exploration of several plant cell culture based production systems. Though over
a dozen of cell culture based processes are on the verge of commercialization,
production of a large number of phytochemicals from plant cell cultures is still
uneconomical. Primarily, low volumetric productivity, and difficulties in scale-up are
the two major bottle necks in industrial application of this technology. However, the
better understanding of in vitro physiology of plant secondary metabolism, and the
recent advancements in bioreactor designs and improved bioprocessing, there have
been augmented efforts to develop plant cell culture based processes.
The present investigation dealt with the studies on production of anthocyanin
from Daucus carota cell cultures, and capsaicin production from immobilized cells of
Capsicum frutescens at shake flask, and lab-scale reactor level. The highlights of the
results are as follows.
Cell cultures of Daucus carota, and Capsicum frutescens were established and
maintained by periodic subculture.
A high yielding cell line of D. carota was developed by repetitive selection for
high anthocyanin containing cell clusters. The cell line had an average anthocyanin
content of 15.88% (w/w, on dry basis) and a specific growth rate is 0.217 day-1 .
In order to quantify and understand the biological effects of physico-chemical
properties, osmolarity, conductivity, buffer capacity, and the solubility of oxygen
of twelve commonly used plant cell culture media have been investigated. While
the solubility of oxygen in the various cell culture media studied varied only
narrowly from 7.01 - 7.79 mg l-1, osmolarity, conductivity, and buffer capacity
showed considerable differences. The data generated would be useful in rational
selection of basal media for plant cell and tissue culture, and in bioprocessing.

152
Nutritional requirements of the D. carota cell line were studied. Murashige and
Skoog's (1962) basal medium with 3% (w/v) sucrose supplemented with indole-3-
acetic acid (2 mg 1-1 ) and kinetin (0.2 mg 1-1 ) was found to be the optimum for
the maximum production of anthocyanin.
Other culture conditions such as pH, temperature, inoculum density, and the
dissolved oxygen concentration were studied. The optimum values of these
parameters for maximum production of anthocyanin were worked out.
The growth and product formation kinetics of the D. carota cell line were studied
in detail. The growth of cell biomass followed a typical sigmoidal curve, with a
maximum cell density of 18.9 g dry weight 1-1. The anthocyanin formation was
associated with the growth of biomass with an average content of 15.9% (w/w, on
dry basis). There was a total production of 3.1 g 1-1 in a period of 15 days of batch
culture under the optimum conditions.
The size distribution of cell aggregates of D. carota in suspension cultures was
studied in detail. The size of the cell aggregates spanned from <355 to >1500 µm
in diameter with biomass distribution centred at between 500-850 µm. The size
distribution of cell aggregates remained unchanged during the culture period.
An interesting profile of anthocyanin content, and the surface colour intensity in
different size groups of cell aggregates revealed that there is a steep radial gradient
of anthocyanin along the radius of the large cell aggregates. The light shielding
effect by the outer layers of cells was implicated to be the plausible reason for the
observed gradient of anthocyanin.
Kinetics of sugar utilization, and ion uptake were studied in detail in both the D.
carota and C. frutescens cell culture systems. The specific rates of sucrose
hydrolysis, consumption rates and biomass yield coefficients of sugars, ammonia,
nitrate, and phosphate were estimated. The quantitative data obtained from the study

153
can form the basis for further studies on reactor design, monitoring and control, and
scale-up strategies.
Estimation of biomass based on the conductivity of nutrient media in D. carota and
C. frutescens was studied in detail. A linear relationship between the decrease in
conductivity and the increase in biomass accumulation was observed. The values
of the empirical constants were estimated.
The suitability of osmolarity as an index for estimation of biomass was shown. A
linear relationship between the decrease in osmolarity and the increase in biomass
of D. carota and C. frutescens has been reported. This established a new sensitive
index for estimation of biomass in plant cell cultures. The detailed analysis of
sensitivity of the method was carried out and a comparison between the
conductivity and osmolarity was drawn.
Both D. carota and C. frutescens cell cultures secreted polysaccharides and proteins
into the culture medium. The time course of extracellular polysaccharides and
proteins was studied. The resulting turbidity was found to be in linear relationship
with biomass. The study suggested that the turbidity of cell-free culture medium
could be an yet another parameter for estimation of cell biomass in plant cell
culture systems in which a considerable amount of polysaccharides and proteins are
secreted.
The production of anthocyanin from D. carota cell cultures was studied at 2 L level
using a stirred tank bioreactor. Growth and production were nearly comparable to
those observed with shake-flask cultures. The total anthocyanin production was 2.7
g 1-1 in 14 days of batch culture. The results obtained in the lab-scale bioreactor
were indicative of the suitability of the conventional stirred tank bioreactor for
large-scale cultivation of this high yielding cell line.
The specific oxygen consumption rates of D. carota and C. frutescens cells were

154
estimated to be 0.75, and 0.57 mmol g-1 h-1 , respectively. The minimum critical
oxygen level for these cell cultures was about 30% of air saturation.
The rheological characteristics of the D. carota culture broth in the stirred tank
bioreactor were studied. It was found that the culture broth changes from
Newtonian to non-Newtonian regime at about 12th day in culture. The culture broth
was found to obey the Power-law flow model. All the parameters of the model
were estimated.
Preliminary studies on the characterization of anthocyanins produced by the cell
culture of D. carota revealed that cyanidin is the major aglycon moiety which is
glycosilated to glucose, and galactose. The results were indicative of the absence
of acyl groups.
Continuous production of capsaicin from Capsicum frutescens cells immobilized in
alginate matrix was studied using 1 litre bubble column reactor. With a biomass
density of 100 g fresh cells l-1 , there was an average volumetric productivity of 1.7
mg 1-1 day-1 . The total capsaicin production was 35 mg 1-1 over a period of 21
days.
The suitability of polyurethane foam (PUF) as an immobilization matrix for C.
frutescens cells was studied. A high cell loading of 0.37 g fresh cells cm-3 of PUF
was achieved.
Continuous production of capsaicin from C. frutescens cells immobilized in PUF
was studied using a 2 litre packed-bed reactor. Though the specific productivity of
capsaicin (25 µg g-1 fresh cells day-1 ) in the packed-bed reactor was comparable to
that in the bubble column reactor, by virtue of the high cell density, there was
about 4 fold increase in the volumetric productivity. Under the influence of a fungal
elicitor, the capsaicin production was increased to a maximum of 330 mg 1-1 in a
period of four weeks.

155
Further work is needed for commercial realization of the above processes. The future
studies may include the following aspects.
- Scale-up of D. carota cell cultures in bioreactors. The conventional stirred tank
bioreactor might be used. A constant DO level may be used as the criterion for
the scale-up, while ensuring the adequate bulk mixing.
- Scale-up of capsaicin production from C. frutescens cells immobilized in
polyurethane foam.
- Downstream processing for food-grade quality of the above products to be
developed. In situ extraction, particularly in the case of capsaicin production,
may be considered using polymeric adsorbents.
As the above aspects are multidisciplinary in nature, interdisciplinary efforts are
needed to develop the commercial-scale processes for the production of anthocyanin
and capsaicin.

LITERATURE CITED
156
Aiba, S., Humphrey, A. E. and Millis,N. F. 1973. Biochemical Engineering Academic
Press: San Diego.
Akiyama, Y. and Kato, K. 1982. Methylation analysis of extracellular polysaccharides
from suspension cultured cells of Nicotiana tabacum. Phytochemistry 21: 1325-1329.
Alfermann, A. W., Bergmann, W., Figur, C., Helmobold, U., Schwantag, D., Schuller, Land
Reinhard, E. 1983. Biotransformation of B-methyldigitoxin to B-methyldigoxin by cell
cultures of Digitalis lanata. In: Plant Biotechnology (S. H. Mantell and Smith, H. Eds.)
Cambridge University Press: Cambridge, pp 67-74.
Ambid, C. and Fallot, J. 1987. Influence of external pH on alkaloid production and excretion by Catharanthus roseus resting cell suspensions. NATO ASI Ser. A. 134:
529-533.
Amrhein, N., Dues, B., Gelirke, P. and Steinrucken, H. C. 1980. The site of the inhibition of the shikimate pathway by glyphosate II. Interference of glyphosate with chansmate formation in vivo and in vitro. Plant Physiol. 61: 830-834.
Anderson, W. C. 1978. Tissue culture propagation of rhododendrons. In vitro 14: 334-335.
Aoyagi, H., Yokoi, H. and Tanaka, H. 1992. Measurement of fresh and dry densities of
suspended plant cells and estimation of their water content. J. Ferment. Bioeng. 73: 490-
496.
Balandrin, M. F. and Klocke, J. A. 1988. Medicinal, aromatic and industrial materials from plants. In: Biotechnology in Agriculture and Forestry (Y. P. S. Bajaj Ed.) Springer-Verlag: Berlin. Vol. 4. pp 3-36.
Banerjee, S., Zehra, M., Kukreja, A. K. and Sushil Kumar 1995. Hairy roots in
medicinal plants. Curr. Res. Med. Aromatic Plants 17: (in press).
Barz, W., Beimen, A.,Drager, B., Jaques, U. Otto, Ch. Super, E. and Upmeier, B. 1990. Turnover and storage of secondary products in cell cultures. In: Secondary Products from Plant Tissue Culture (B. V. Charlwood and M. J. C. Rhodes Eds.) Oxford University Press: New York, pp 79-102.
Bauch, H. J. and Leistner, 1978. Aromatic metabolites in cell suspension cultures of
Galium mullugo L. Planta Med. 33: 105-123.

157
Becker, G. E., Hui, P. A. and Albersheim, P. 1964. Synthesis of extracellular polysaccharide
by suspensions of Acer pseudoplatanus cells. Plant Physiol. 39: 913-920.
Benthorpe, D. and Brown, G. D. 1990. Growth and secondary metabolism in cell cultures of
Tanacetum, Mentha and Anethum species in buffered media. Plant Sci. 67: 107-113.
Berlin, J., Forche, E., Wray, V., Hammer, J. and Hosel, W. 1983. Formation of benzophenanthridine alkaloids by suspension cultures of Eschscholtzia californica. Z. Naturforsch. 38: 346-352.
Berlin, J. 1984. Plant cell cultures - a future source of natural products. Endeavour 8: 5-8.
Bhattacharya, S. and Bhat, K. K. 1997. Steady shear rheology of rice-blackgram
suspensions and suitability of rheological models. J. Food Eng. 32: 241-250.
Birch, J. R., Lambert, K., Thompson, P. W. Kenny, A. C. and Wood, L. A. 1987. Antibody Production with AirliftFermentors. In: Large Scale Cell Culture Technology (B. K. Lydersen Ed.) Hanser Publishers: Munich, pp 1-20.
Blanch, H. W. and Clark, D. S. 1996. Biochemical Engineering. Marcel Dekker Inc.: New
York.
Bligny, R., Rebeille, F. and Douce, R. 1985. 02-triggered changes of membrane fatty acid
composition have no effect on Arrhenius discontinuities of respiration in Sycamore (Acer pseudoplantanus L.) cells. /. Biol. Chem. 260: 9166-9170.
Bohme, C, Schroder, M. B. Jung-Heiliger, H. and Lehmann, J. 1997. Plant cell suspension culture in a bench-scale fermenter with a newly designed membrane stirrer for bubble-free aeration. Appl. Microbiol. Biotechnol. 48: 149-154.
Bowler, C. and Chua, N.M. 1994. Emerging themes of plant signal transduction. Plant Cell
6, 1529-1541.
Brain, K. R. 1976. Accumulation of L-DOPA in cultures from Mucuna pruriens. Plant Sci. Lett. 7: 157-161.
Branen, A. L. 1990. Introduction to food additives. In: Food additives (A. L. Branen, P. M.Davidson and S. Salminen Eds.) Marcel Dekker Inc.: New York, pp 1-8.

158
Breuling, M., Alfermann, A. W. and Reinhard, E. 1985. Cultivation of cell cultures of Berbiris wilsonae in 20 L airlift bioreactors. Plant Cell Rep. 4: 220-223.
Brodelius, P. 1988. Immobilized plant cells as source of biochemicals la: Bioreactor
Immobilized Enzymes and Cells (M. Moo-Young Ed.) Elsevier Essex: pp 167-196.
Bruke, D., Kaufman, P., McNeil, M. and Albersheim, P. 1974. The structure of plant cell
walls. IV. A survey of the walls of suspension-cultured monocots. Plant Physiol. 54: 109-
115.
Buitelaar, R. M. and Tramper, J. 1992. Strategies to improve the production of secondary
metabolites with plant cell cultures. A literature review. J. Biotechnol. 23, 111-141.
Butenko, R. G., Lipsky, A. K., Chernyak, N. D. and Arya H. C. 1984. Changes in culture
medium pH by cell suspension cultures of Dioscorea deltoidea. Plant Sci. Lett. 35: 207-212.
Byrne, A. F. and Koch, M. B. 1962. Food production by submerged cultures plant tissue cells. Science 135: 215-226.
Charles, M. 1978. Technical aspects of the rheological properties of microbial cultures. Adv.
Biochem. Eng. 8: 1-59.
Charlwood, B. V. and Rhodes, M.J. C. 1990. Secondary Products from Plant Tissue Culture
Clarendon: Oxford.
Chen, P. S.,Toribara, T.Y.and Warner, H. 1956. Microdetermination of phosphorous. Anal. Chem. 28: 1756-1758.
Constabel, F., Rambold, S. Chatson, K. B., Kurz, W. G. W. and Kutney, J. P. 1981.
Alkaloid production in Catharanthus roseus (L.) G. Don. VI. Variation in alkaloid spectra
in cell lines derived from one single leaf. Plant Cell Rep. 1: 3-5.
Courtois, D.and Guren, J. 1980. Temperature response of Catharanthus roseus cells
cultivated in liquid medium. Plant Sci. Lett. 17: 473-482.
Curtin, E. 1983. Harvesting profitable products from plant tissue culture. Bio/Technology 1: 649-657.
Dalton, C. C. 1978. The culture of plant cells in fermenters. Heliosynthase of Acquaculture seminar de Martiques. CNRS. pp 1-11.

159
De-Eknamkul, W. and Ellis, B. E. 1985. Effect of auxins and cytokinins on growth and
rosmarinic acid formation in cell suspension cultures of Anchusa officinalis. Plant Cell Rep.
4: 50-53.
de Gunst, M. C. M.,Harkes, P. A. A.,Val, J., van Zwet, W. R. and Libbenga, K. R. 1990.
Modelling the growth of batch culture of plant cells: a corpuscular approach. Enzyme Microbial Technol. 12: 61-71.
De Klerk-Kiebert, Y.H. and Van der Plas, L.H.W. 1985. Relationship of respiratory
pathways in soyabean cell suspensions to growth of the cells at various glucose concentrations. Plant Cell Tiss. Org. Cult. 4: 225-233.
Deus, S. N. B. and Zenk, M. H. 1982. Exploitation of plant cells for the production of
alkaloids in Catharanthus roseus cell suspension cultures. Planta Med. 50:427-431.
Deus-Neumann, B. and Zenk, M. H. 1984. Planta Med. 54: 427-431.
Difco Manual of Dehydrated Culture Media and Reagents for Microbiological and Clinical Laboratory Procedures 1972. Difco Laboratories, Inc.: Michigan.
Dixon, R. A. 1985. Isolation and maintenance of callus and cell suspension cultures. In: Plant Cell Culture (R. A. Dixon Ed.) IRL Press: Oxford, pp 1-20.
Dodds, J. H.and Roberts, L.W. 1985. Plant Cell Culture Cambridge University Press:
Cambridge.
Doran, P. M. 1993. Design of bioreactors for plant cells and organs. Adv. Biochem. Eng.
Biotechnol. 48: 115-168.
Dornenburg, H. and Knorr, D. 1995. Strategies for the improvement of secondary
metabolite production in plant cell cultures. Enzyme Microbial Technol. 17:674-684.
Dornenburg, H. and Knorr, D. 1997. Challenges and opportunities for metabolite production from plant cell and tissue cultures. Food Technol. 51(11): 47-54.
Dougall, D.K. 1980. Nutrition and metabolism. In: Plant tissue culture as a source of
biochemicals (E. J. Staba Ed.) CRC Press: Boca Raton, pp 21-58.
Dougall, D. K.,LaBrake, S. and Whitten, G. H. 1982. Plant cells grown inchemostats. In: Plant Tissue Culture Proceedings of the Fifth International Congress of Plant Tissue and Cell Culture (A. Fujiwara Ed.) Japanese Association for Plant Tissue Culture. Tokyo, pp 51-54.

160
Dougall, D. K. 1989. Sinapic acid stimulation of anthocyanin accumulation in carrot cell
cultures. Plant Sci. 60: 259-262.
Douglas, B. S. and Phillips, J. A. 1997. Production of small, monodispersed alginate beads
for cell immobilization. Biotechnol. Prog. 13: 562-568.
Drapeau, D., Blanch, H. W. and Wilke, C. R. 1986. Growth kinetics of Dioscorea deltoidea
and Catharanthus roseus in batch culture. Biotechnol. Bioeng. 28: 1555-1563.
Dubois, M., Gillies, K. A., Hamilton, J. K., Rebers, P. A. and Smith, F. 1956. Colorimetric
method for determination of sugars and related substances. Anal. Chem. 28: 350-356.
Ducos, J. P. and Pareilleux, A. 1986. Effect of aeration rate and influence pC02 in lage-scale
cultures of Catharanthus roseus cells. Appl. Microbiol. Biotechnol. 25:101-105.
Dunn, I. J., Heinzle, E., Ingham, J. and Prenosil, J. E. 1992. Biological Reaction Engineering VCH Publishers, Inc.: New York, pp 9-50.
Ebel, J., Schaller-Hekeler, B., Knoblock, K. H., Wellmann, E., Grisebach, H. and
Hahlbrock, K. 1974. Coordinated changes in enzyme activities of phenylpropanoid metabolism during the growth of soybean cell suspension cultures. Biochem. Biophys. Ada 362: 417-424.
Ellis, B. E. 1980. Hoppe-Seyler's Z. Physiol. Chem. 361: 242.
Endress, R. 1994. Plant Cell Biotechnology. Springer-Verlag: Berlin, pp 121-255.
Eriksson, T. 1965. Studies on the growth requirements and growth measurements of Happlopapus gracilis. Physiol. Plant. 18: 976-993.
Feluki, T. and Francis, F. J. 1967. A new developing solvent for paper chromatography of
various phenolic compounds, sugars and amino acids. J. Chromatog. 26: 404-411.
Feluki, T. 1969. Anthocyanins of Strawberry, Rhubarb, Radish and Onion. J. Food Sci. 34: 365-369.

161
Fett-Neto, A.G., Zhang, W.Y.DiCosmo, F. 1994. Kinetics of taxol production, growth, and
nutrient uptake in cell suspensions of Taxus cuspίdata. Biotechnol. Bioeng. 44: 205-210.
Fowler, M.W. 1986. In: Plant Cell Culture Technology (M. M. Yeoman Ed.) Blackwell Scientific: Cambridge, pp 202-207.
Fowler, M. W. 1987. Process systems and approaches for large scale plant cell culture. In:
Plant Tissue and Cell Culture (C. E. Green, D. A. Somers, W. P. Hackett and D. D. Biesboer Eds.) Liss: New York, pp 459-471.
Fowler, M. W. and Scragg, A. H. 1988. Natural products from higher plants and plant cell culture. In: Plant Cell Biotechnology (M.S. S. Pais, F. Mavituna and J. M. Novais Eds.) NATO ASI Series. Springer-Verlag: Berlin, vol. 18 pp 165- 177.
Fowler, M. W. and Stafford, A. M. 1992. Plant cell culture, process systems and
product synthesis. In: Plant Biotechnology (M. W. Fowler, G. S. Warren) Pergamon Press:
Oxford, pp 79-98.
Francis, F. J. 1982. Analysis of anthocyanins. In: Anthocyanins as food colours (P. M.
Markakis Ed.) Academic Press: New York, pp 181-207.
Francis, F. J. 1989. Food colorants: Anthocyanins. Crit. Rev. Food Sci. Nutr. 28: 273-314.
Fujino, K. Koga, N. Matsushita, T. and Funatsu, K. 1992. B-carotene production by DO-stat semi-continuous culture of carrot cells in an air-lift column with draft tube. In: Biochemical Engineering for 2001 (S. Furusaki, I. Endo, R. Matsumo Eds.) Springer-Verlag. Hong Kong, pp 274-276.
Fujita, Y.,Hara, Y., Ogino, T., Suga, C. and Morimoto, T. M. 1981. Production of shikonin
derivatives by cell suspension cultures of Lithospermum erythrorhizon. II. A new medium
for the production of shikonin derivatives. Plant Cell Rep. 1: 61-63.
Fujita, Y. and Hara, Y. 1985. The effective production of shikonin by cultures with an
increased cell population. Agric. Biol. Chem. 49: 2071-2075.
Fukui, H.,Nakagawa, K. Tsuda, S. and Tabata, M. 1983. In: Plant Tissue Culture (A. Fujiwara Ed.) Japanese Association for Plant Tissue Culture Association: Tokyo, pp
313-314.

162
Furuya, T.,Kojinma, H. and Syono, K. 1971. Regulation of nicotine biosynthesis by auxins
in tobacco callus tissues. Phytochemistry 10: 1529-1532.
Furuya, T. and Ishii, T. 1972. The manufacturer of Panax plant tissue culture containing crude saponins and crude sapogenins which are identical with those of natural Panax roots. Japanese patent. 48-31917.
Furuya, T. Yoshikawa, T., Orihara, Y. and Oda, H. 1984. Studies on the culture conditions
for Panax ginseng in jar fermenters. /. Nat. Prod. 47: 70-75.
Gabelman, A. 1994. Genetic engineering and other advanced technologies. In:
Bioprocess Production of Flavour, Fragrance and Color Ingredients (A. Gabelman Ed.)
John Wiley & Sons Inc.: New York, pp 227-230.
Gal, I. E. 1965. Neuere angaben uber capsicdin. Experientia 21: 383.
Gamborg, O. L.,Miller,R. A. and Ojima, K. 1968. Nutrient requirements of suspension cultures of soyabean root cells. Exp. Cell Res. 50: 151- 158.
Gamborg, O. L., Constabel, F., La Rue, T. A. G., Miller, R. A. and Steck, W. 1971. The influence of hormones on secondary metabolite formation in plant cell cultures. In: Les cultures de Tissue de Plantes Centre National de La Recherche Scientifique: Paris, pp 335-344.
Gana, J. A.,Sharma, G. C., Zipf, A., Saha, S., Roberts, J. and Wesenburg, D. M. 1995. Genotypic effects on plant regeneration in callus and suspension cultures of Avena. Plant Cell Tiss. Org. Cult. 40: 217-224.
Gathercole, R. W. E., Mansfield, K. J. and Street, H. E. 1976. Carbon dioxide as an essential
requirement for cultured Sycamore cells. Physiol. Plant. 37: 213-217.
Gautheret, R. J. 1939. Sur la possibilite de realiser la culture indefinee de tissus de
tubercules de carotte. C. R. Acad. Sci. 208: 118-130.
George, E. F., Puttock, D.J. M. and George, H.J. 1987. Plant Tissue Culture Media. Exegetics Ltd.: Westbury.
George, P. S. and Ravishankar, G. A. 1995. Induction ofcrocin and crocetins in callus
cultures of Gardenia jasminoides Ellis. Food Biotechnol. 9:29-38.

163
Ghildyal, N. P., Thakur, M. S., Srikanta, S., Jaleel, S. A.,Prapulla, S. G.,Prasad, M. S. Devi, P. N. and Lonsane, B. K. 1987. Rheological studies on Streptomyces fradiae ScF-5 in submerged fermentation. /. Chem. Technol. Biotechnol. 38: 221-234.
Glicklis, R., Mills, D., Sitton, D., Stortelder, W. and Merchuk, J. C. 1998. Polysaccharide production by plant cells in suspension: Experiments and mathematical modelling. Biotechnol. Bioeng. 57: 732-740.
Govindarajan, V. S. and Ananthakrishna, S. M. 1974. Paper chromatographic
determination of capsaicin. The Flavour Ind. 5: 176-178.
Greenberg, A. E., Clesceri, L. S., Eaton, A. D. (Eds.) 1992. In: Standard Methods for the
examination of water and wastewater. American Public Health Association: Washington, DC.
Gresshoff, P. M. and Doy, C. H. 1974. Transgenosis of bacterial genes from E. coli to
cultures of haploid Lycopersion esculentum and haploid Arabidopsis thaliana plant cells. Z. Pflanzenphysiol. 73: 132-138.
Gutsu, E. V.,Baleshova, N. N., Lazur'evskii, G. V. and Timina, O. O. 1982. Izv. Akad. Nauk, Mold. SSR. Ser. Biol. Khim. Nauk. 24.
Haberlandt, G. 1902. Culturversuche mit isolierten Pflanzenzellen. Sitz Akad. Wiss. Wien. Ill: 69-92.
Hahlbrock, K., Sutter, A., Wellmann, E., Ortmann, R. and Grisebach, H. 1971. Relationship
between organ development and activity of enzymes involved in flavone glycoside
biosynthesis in young parsley plants. Phytochemistry 10: 109-116.
Hahlbrock, K.,Kuhlen, E. 1972. Relationship between growth of parsley and soybean cells in suspension cultures and changes in the conductivity of the culture medium. Planta 108: 271-178.
Hahlbrock, K.,Ebel, J. and Oaks, A. 1974. Determination of specific growth stages of plant
cell cultures by monitoring conductivity changes in the medium. Planta 118:
75-84.
Halaweish, F. T. and Dougall, D. K. 1990. Sinapoyl glucose synthesis by extracts of wild carrot cell cultures. Plant Sci. 71: 179-184.

164
Hale, A. D., Pollock, C. J. and Dalton, S. J. 1987. Polysaccharide production in liquid cell suspension cultures of Phleum pratense L. Plant Cell Rep. 6: 435-438.
Hamill, J. D.,Parr, A.J. Rhodes, M.J. C, Robins, R. J. and Walton, N.J. 1987. New routes to plant secondary products. Biotechnol. 5: 800-804.
Harborne, J. B. 1958a. The chromatographic identification of the anthocyanin
pigments. J. chromatog. 1: 473-488.
Harborne, J. B. 1958b. Plant polyphenols. 1. Anthocyanin production in the cultivated
potato. Biochem. J. 74: 262-269.
Harborne, J. B. 1967. Comparative biochemistry of the flavanoids. In: Chemistry and
Biochemistry of Plant Pigments Academic Press: New York.
Harborne, J. B. 1976. In: Chemistry and Biochemistry of Plant Pigments (T. H. Goodwin
Ed.) Academic Press: New York, Vol. I. pp 736-778.
Harborne, J. B. 1982. Introduction to ecological biochemistry Academic Press: New York.
Hau, R. D. and Yeoman, M. M. 1991. The influence of intracellular pools of
phenylalanine derivatives upon the synthesis of capsaicin by immobilized cell cultures of the chilli pepper Capsicum frutescens. Planta 185: 72-80.
Havkin-Frenkel, D., Podstolski, A. and Knorr, D. 1996. Effect of light on vanillin formation by in vitro cultures of Vanilla planifolίa. Plant Cell Tiss. Org. Cult. 45: 133-136.
Herlich, K. 1990. In: Official Methods of Analysis of the Association of Analytical Chemists (Association of Official Analytical Chemists) William Byrd Press, Inc.: Virginia, pp 1014-1015.
Hildebrandt, A.C. 1977. Single cell cultures, protoplasts and plant viruses. In: Plant Cell
Tissue and Organ Culture (J. Reinert and Y. P. S. Bajaj Eds.) Springer Verlag: Berlin, pp
581-597.
Hilton, M. G. and Rhodes, M.J. C. 1990. Growth and hyoscyamine production of hairy root cultures of Datura stramonium in a modified stirred tank reactor. Appl. Microbiol. Biotechnol. 33: 132-138.

165
Hirasuna, T.J.,Shuler, M. L.,Lackney, V.K. and Spanswick, R. M. 1991. Enhanced anthocyanin production in grape cell cultures. Plant Sci. 78: 107-120.
Hirasuna, T. J., Pestchanker, L. J., Srinivasan, V. and Shuler, M. L. 1996. Taxol production
in supension cultures Taxus baccata. Plant Cell Tίss. Org. Cult. 44: 95-102.
Hoagland, D. R. and Arnon, D. I. 1950. Circular 347, California Agr. Exp. Stat. Berkely.
Hoekstra, S. S., Harkes, P. A. A. and Libbenga, K. R. 1988. Screening of calli and compact
globular structures of Cinchona ledgeriana for production of quinone alkaloids. In:
Manipulating Secondary Metabolism in Culture (R. J. Robins and M. J. C. Rhodes Eds.)
University Press: Cambridge, pp 96.
Hooker, B. S., Lee, J. M. and An, G. 1990. Cultivation of plant cells in a stirred vessel:
Effect of impeller design. Biotechnol. Bioeng. 35: 296-304.
Hopp, W. and Seitz, H. U. 1987. The uptake of acylated anthocyanin into isolated vacuoles
from a cell suspension culture of Daucus carota. Planta, 170: 74-78.
Hulst, A. C. and Tramper, J. 1989. Immobilized plant cells: a literature survey. Enzyme Microbial Technol. 11: 546-558.
Hulst, A. C, Meyer, M.M. T.,Breteler, H. and Tramper, J. 1989. Effect of aggregate size in
cell cultures of Tagetes patula on thiophene production and cell growth. Appl. Microbiol. Biotechnol. 30: 18-25.
Husemann, W., Amino, S., Fischer, K., Herzbeck, H. and Callis, R. 1990. Light dependent
growth and differentiation processes in photoautotropic cell culture. In: Progress in plant
cellular and molecular biology (H. J. J. Nijkamp, L. H. W. Van der Plas and Van
AartrijkEds.) Kluwer Academic Publishers: Dortrecht Netherlands, pp 373-378.
Ikeda, T.,Matsumoto, T. and Noguchi, M. 1976. Formation ofubiquinone by tobacco plant
cells in suspension culture. Phy to chemistry 15: 568-569.
Ilker, R. 1987. In vitro pigment production: An alternative to color synthesis. Food Technol.
41: 70-72.

166
Jala, M. A. F. and Collin, H. A. 1979. Secondary metabolism in tissue cultures of Theobroma
cocoa. New Phytol. 83: 343-349.
Jones, A. and Veliky, I. 1981. Effect of medium constituents on the viability of immobilized plant cells. Can. J. Bot. 59: 2095-2101.
Kanabus, J., Bressan, M. R. and Hodges, T. K. 1986. Carbon assimilation in carrot cells in
liquid culture. Plant Physiol. 82: 363-368.
Kargi, F. and Rosenberg, M.Z.1987. Plant cell bioreactors: present status and future trends.
Biotechnol. Prog. 3: 1-8.
Kato, A.,Shimizu, Y.and Nagai, S. 1975. Effect of initial KLa on the growth of tobacco cells
in batch culture. J. Ferment. Technol. 53: 744-751.
Kato, A., Hashimoto, Y.,Soh, Y. 1976. Effect of temperature on the growth of tobacco
cells. J. Ferment. Technol. 54: 754-757.
Kato, A.,Fukasawa, A.,Shimizu, Y.,Soy, Y.and Nagai, S. 1977. Requirements of P043",
N03", S04 ", K+,and Ca + for the growth of tobacco cells in suspension culture. /. Ferment.
Technol. 55: 207-212.
Kato, A.,Kawagoe, S. and Soy, Y. 1978. Viscosity of the broth of tobacco cells in suspension
cultures. /. Ferment. Technol. 56: 224-228.
Kavi Kishore, P. B. 1987. Energy and osmotic requirements for high frequency
regeneration of rice plants from long term cultures. Plant Sci. 48: 189-194.
Kessel, R. H. J. and Carr, A. H. 1972. The effect of dissolved oxygen concentration on
growth and differentiation of carrot (Daucus carota) tissue. J. Exp. Bot. 23: 996-1007.
King, P. J., Cox, B.J., Fowler, M. W. and Street, H. E. 1974. Metabolic events in
synchronized cell cultures of Acer pseudoplantanus. L. Planta 111: 109-122.
King P. J. 1977. Studies on the growth in culture of plant cells XXII. Growth limitation by
nitrate and glucose in chemostat cultures of Acer pseudoplantanus L./. Exp. Bot. 28: 142-
155.
Kinnersley, A. M. and Dougall, D. K. 1980. Increase in anthocyanin yield from wild carrot
cell cultures by a selection based on cell-aggregate size. Planta 149: 200-204.

167
Kirkham, M.B. and Holder, P. L. 1981. Water osmotic and turgor potentials ofkinetin treated callus. Hortic. Sci. 16: 306-307.
Klein, R. M. and Manos, G. E. 1960. Use of metal chelates for plant tissue cultures. Ann.
New York Acad. Sci. 88: 416-425.
Knorr, D., Caster, C, Dornenburg, H., Dorn, R., Graf, S., Havkin-Frankel, D., Podstolski, A.
and Werrman, U. 1993. Biosynthesis and yield improvement of food ingredients from plant
cell and tissue cultures. Food Technol. 47(2): 57-63.
Knuth, M. E. and Sahai, O. P. Flavour Composition and method. US patent no. 5,057,424, Oct. 15, 1991.
Ko, K. S., Noguchi, H.,Ebizyka, Y. and Sanakawa, U. 1989. Oligoside production by hairy
root cultures transformed by Ri plasmid. Chem. Pharm. Bull. 37: 245-248.
Kobayashi, Y., Akita, M., Sakamoto, K, Hongfeng-Liu, Shigeoka, T., Koyano, T.,
Kawamura, M.and Furuya, T. 1993. Large-scale production of anthocyanin by Aralίa cor
data cell suspension cultures. Appl. Microbiol. Biotechnol. 40: 215-218.
Koichi, N. and Hisashi, K. 1990. Pharmacology of anthocyanosides from wild blue berries.
Part 3. Shokuhin. Kogyo-Japan 33: 57-62.
Komamine, A.,Tabata, M.and DiCosmo, F. 1991. Plant Cell Culture in Japan CMC Co.
Ltd.: Tokyo.
Koop, H. U., Weber, G. and Schiweiger, H.G. 1983. Individual culture of selected single cells and protoplasts of higher plants in micro droplets of defined media. Z. Pflanzenphysiol. 112: 21-34.
Koul, S., Ahuja, A. and Grewal, S. 1983. Planta Med. 47: 11-16.
Kreis, W. and Reinhard, E. 1989. The production of secondary metabolites by plant cells
cultivated in bioreactors. Planta Med. 55: 409-416.
Kubek, D.J. and Shuler, M.L. 1978. A rapid quantitation method to measure growth of plant
cell suspension cultures. Can. J. Bot. 56: 2340-2343.
Kukreja, A. K.,Zehra, M., Sultana, A. and Banerjee, S. 1996. Hairy roots of medicinal
plants: Potential and prospects. Oral Presentation: All India Symposium on Recent Advances in Biotechnological Applications of Plant Tissue and Cell Culture & XVIII Meeting of Plant Tissue Culture Association of India. June 22-24, 1995.

168
Kurz, W. G. W., Chatson, R. B. and Constabel, F. 1985. Biosynthesis and accumulation of indole alkaloids in Catharanthus roseus cultivars. In: Primary and Secondary Metabolism of Plant Cell Cultures (K. H. Neumann, W. Barz and E. Reinhard Eds.) Springer-Verlag: Berlin, pp 143-153.
Kwok, K. H., Tsoulpha, P. and Doran, P. M. 1992. Limitations associated with conductivity
measurement for monitoring growth in plant tissue culture. Plant Cell Tiss. Org. Cult. 29: 93-99.
Kwok, K. H. and Doran, P. M. 1995. Kinetic and stoichiometric analysis of hairy roots in a
segmented bubble column reactor. Biotechol. Prog. 11: 429-435.
Lassocinski, W. 1985. Chlorophyll deficient cacti in tissue cultures. Ada Hortic. 167:
287-293.
Lauriere, M.,Lauriere, C.Sturm, A.Faye, L.,Chrispeels, M.J. 1988. Characterization of B-
fructosidase, an extracellular glycoprotein of carrot cells. Biochemie 70: 1483-1491.
Leckie, F., Scragg, A. H. and Cliffe, K. C. 1990. The effect of continuous high shear stress
on plant cell suspension cultures. In: Progress in Plant Cellular and Molecular Biology (H.
J. J. Nijkamp, L. H. W. van der Plas and J. Van Aartrijk Eds.) Kluwer Academic:
Dordrecht, pp 689-693.
Leigh, R. A. ap Rees, T. Fuller, W. A. and Banfield, J. 1979. The location of acid invertase activity and sucrose in the vacuoles of storage roots of beetroot {Beta vulgaris) Biochem. J. 178: 539-547.
Lescure, A.H. 1966. Relationship between the density of plant cells and their growth
kinetics in submerged medium. Exp. Cell. Res. 44: 620-623.
Liang, S. Z., Zhong, J. J. and Yoshida, T. 1991. Review of plant cell culture technology for
production of useful products (part 2) Ch. J. Ind. Microbiol. 21: 28-32.
Lindsey, K. and Yeoman, M. M. 1983. The relationship between growth rate, differentiation
and alkaloid accumulation in cell cultures. J. Exp. Bot. 34: 1055-1065.
Lindsey, K., Yeoman, M. M., Black, G. M. and Mavituna, F. 1983. A novel method for the
immobilization and culture of plant cells. FEBS Lett. 155: 143-149.
169
Lindsey, K. and Yeoman, M. M. 1984. The synthetic potential of immobilized cells of
Capsicum frutescens Mill.cv. annuum. Planta 162: 495-501.
Litvay, J. D., Devi Verma, C. and Johnson, M. A. 1985. Influence of loblolly pine (Pinus taeda L.) culture medium and its components on growth and somatic embryogenesis of wild carrot (Daucus carota L.) Plant Cell Rep. 4: 325-328.
Lloyd, G. and McCown, B. 1981. Commercially feasible micropropagation of Mountain
laurel, Kalmia lalifolia, by use of shoot tip culture. Proc. Int. Plant Proc. Soc. 30: 421-427.
Lockwood, G. B. 1984. Alkaloids of suspensions derived from four Papaver spp. and the
effect of temperature stress. Z. pflanzenphysiol. 114: 361-363.
Lowry, O. H., Rosebrough, N. J., Farr, A. L. and Randall, R. J. 1951. Protein measurement
with the Folin phenol reagent. /. Biol. Chem. 193: 265-275.
Luckner, M., Nover, L. and Bohm, H. 1977. Secondary metabolism and cell differentiation. Mol. Biol. Biochem. Biophys. 23.
Madhavi, D.L.,Prabha, T. N., Singh, N. S. and Patwardhan, M.V. 1991. Biochemical studies with garlic (Allium sativum) cell cultures showing different flavour levels. /. Sci. Food Agric. 56: 15-24.
Mandels, M. 1972. The culture of plant cells. Adv. Biochem. Eng. 2: 201-215.
Mante, S. and Boll, W.G. 1975. Comparison of growth and extracellular polysaccharides of cotyledon cell suspension cultures of bush bean (Phaseolus vulgaris cv. Contender) grown in coconut-milk medium and synthetic medium. Can. J. Bot. 53: 1542-1548.
Mantell, S. H. and Smith, H. 1983. In: Plant Biotechnology (S. H. Mantell and H. Smith
Eds.) Cambridge University Press: Cambridge pp 75-108.
Matsubara, K.,Yamada, Y.,Kitani, S., Yoshioka, T.,Morimoto, T. and Fujita, Y. 1989. High
density culture of Coptis japonica cells increases berberine production. /. Chem. Tech.
Biotechnol. 46: 61-69.
Matsumoto, T., Ohunishi, K.,Nistrida, K. and Noguchi, M. 1972. Agric. Biol. Chem. 36:
2177.

170
Matsumoto, T., Ikeda, T., Okimura, C, Obi, Y.,Kisaki, T. and Noguchi, M. 1982. Production of ubiquinone-10 by highly producing strains selected by a cell cloning technique. In: Plant Tissue Culture (A. Fujiwara Ed.) Maruzen: Tokyo, pp 275-276.
Maurel, B. and Pareilleux. A. 1985. Effect of carbon dioxide on the growth of cell
suspensions of Catharanthus roseus. Biotechnol. Lett. 7: 313-318.
Mauseth, J. D. 1979. Cytokinin elicited formation of pith rib meristem and other effects of growth regulators on the morphogenesis of Echino cereus (Cactaceae) seedling shoot apical meristem. Am. J. Bot. 66: 446-451.
Mavituna, F. and Park, J. 1985. Growth of immobilized plant cells in reticulate polyurethane
foam matrices. Biotechnol. Lett. 7: 637-640.
Mavituna, F. and Park, J.M. 1987. Size distribution of plant cell aggregates in batch culture. Chem. Eng. J. 35: 9-14.
Mavituna, F. Park, J., Williams, P. and Wilkinson, A. 1987. Characteristics of immobilized
plant cell reactors. In: Plant and Animal Cells: Process Possibilities (C. Webb and F. Mavituna Eds.) Horwood: Chichester. pp 92-115.
McDonald, K. A. and Jackman, A. P. 1989. Bioreactor studies of growth and nutrient
utilization in alfalfa suspension cultures. Plant Cell Rep. 8: 455-458.
Miller, G. L. 1959. Use of Dinitrosalicylic acid reagent for determination of reducing sugar.
Anal. Chem. 31: 426-428.
Mor, J. R. 1991. Biotechnology in flavour synthesis. In: Proc. 8th World Congress of Food
Science and Technology Canada.
Mori, T., Skurai, M., Shigeta, J., Yoshida, K. and Kondo, T. 1993. Formation of anthocyanins from cells cultured from different parts of strawberry plants. J. Food Sci. 58: 788-792.
Morris, P. 1986a. Regulation of product synthesis in cell cultures of Catharanthus roseus
II. Comparison of production media. Planta Med. 52: 121-126.
Morris, P. 1986b. Regulation of product synthesis in cell cultures of Catharanthus roseus.
Effect of culture temperature. Plant Cell Rep. 5: 427-429.
Morvan, H. 1982. Release of pectic acid polymers during growth of Silene alba cell suspension cultures. Physiol. Veg. 20: 671-678.

171
Mukundan, U.,Hjortso, M. A. 1991. Growth and thiophene accumulation by hairy root
cultures of Tagetes patula in media of varying initial pH. Plant Cell Rep. 9: 627-630.
Murashige, T. and Skoog, F. 1962. A revised medium for rapid growth and bioassays with tobacco tissue cultures. Physiol. Plant. 15: 473-497.
Nassau, K. 1993. Color. In: Encyclopaedia of Chemical Technology (M.Howe-Grant Ed.) John Wiley & Sons, Inc.: New York. vol. 6. pp 841-876.
Nitsch, J. P. and Nitsch, C. 1969. Haploid plants from pollen grains. Science 163: 85-87.
Noguchi, M., Matsumoto, T., Hirata, Y., Yamamoto, K., Katsuyama, A., Kato, A., Azechi, S. and Katoh, K. 1982. Improvements of growth rates of plant cell cultures. In: Plant Tissue Culture and its Biotechnological Applications (W. Barz, E. Reinhard and M. H. Zenk Eds.) Springer-Verlag: Berlin, pp 85-94.
Nozue, M., Kawai, J. and Yoshitama, K. 1987. Selection of a high anthocyanin
producing cell line of sweet potato cell cultures and identification of pigments. J. Plant Physiol. 129: 81-88.
Obenland, D. M., Simmen, U., Boiler, T. and Wiemken, A. 1993. Purification and characterization of three soluble invertases from barley (Hordeum vulgare L.) leaves. Plant Physiol. 101: 1331-1339.
Ohta, S. and Yamazawa, M. 1982. In: Plant Tissue Culture (A. Fujiwara Ed.) Japanese
Association for Plant Tissue Culture: Tokyo, pp 321-322.
Oka, S. 1974. Rheological - Biotechnology. Syokabo: Tokyo.
Otsuji, K.,Honda, Y.,Sugimura, Y.and Takei, A. 1994. Production ofpolysaccharides in
liquid cultures of Polianthus tuberosa cells. Biotechnol. Lett. 16: 943-948.
Owen, H. R., Wengerd, D. and Miller, A. R. 1991. Culture medium pH influenced basal
medium, carbohydrate source, gelling agent, activated charcoal and medium storage method. Plant Cell Rep. 10: 583-586.
Ozeki, Y. and Komamine, A. 1985. Effects of inoculum density, zeatin and sucrose on anthocyanin accumulation in a carrot suspension culture. Plant Cell Tiss. Org. Cult.
5: 45-53.

172
Panda, A. K.,Mishra, S., Bisaria, V. S. and Bhojwani, S. S. 1989. Plant cell reactors - a perspective. Enzyme Microbial Technol. 11: 386-397.
Panda, A. K., Mishra, S. and Bisaria, V. S. 1992. Alkaloid production by plant cell suspension cultures of Holarrhena antidysenterίca: Effect of major nutrients. Biotechnol. Bioeng. 39: 1043-1051.
Pareilleux, A. and Chaubet, N. 1981. Mass cultivation of Medicago sativa growing on
lactose: Kinetic aspects. Eur. J. Appl. Microbiol. Biotechnol. 11: 222-225.
Pareilleux, A. and Vinas, R. 1983. Influence of the aeration rate on the growth yield in suspension cultures of Catharanthus roseus (L.) G. Don. /. Ferment. Technol. 61:
429-433.
Parfitt, D. E., Almehdi, A. A. and Bloksberg, L.N. 1988. Use of organic buffers in plant
tissue culture systems. Scientia Hortic. 36: 157- 163.
Park, J. M, Giles, K. L. and Songstad, D. D. 1990. Industrial production of sanguinarine from cell suspension cultures of Papaver somniferum. Proc. Asia-Pacific Biochemical Engineering Conference.: Korea April22-25.
Parr, A. J. 1988. Secondary products from plant cell culture. In: Biotechnology in
Agriculture: Advances in Biotechnological Processes (A. Mazrahi and R. Alan Eds.) Liss Inc.: New York, pp 2-34.
Payne, G. F.,Shuler, M. L. and Brodelius, P. 1987. Large scale plant cell culture. In: Large
Scale Cell Culture Technology (B. K. Lyderson Ed.) Hanser, Munich, pp 193-229.
Payne, G., Bringi,V.,Prince, C. and Shuler, M. L. 1992. Plant Cell and Tissue Culture in Liquid Systems Hanser Publishers: Munich.
Pepin, M. F., Archambault, J., Chavarie, C. and Cormier, F. 1995. Growth kinetics of Vitis
vinifera cell suspension cultures: I. Shake flask cultures. Biotechnol. Bioeng. 47: 131-138.
Pestchanker, L.J.,Rodes, S. C. and Shuler, M. L. 1996. Kinetics of taxol production and nutrient use in suspension cultures of Taxus cuspidata in shake flasks and a Wilson-type bioreactor. Enzyme Microbial Technol. 19: 256-260.
Peterson, G.L. 1983. Determination of total protein. Methods Enzymol. 91: 95-121.
173
Peterson, M. and Alfermann, A. W. 1993. Plant Cell Cultures. In: Biotechnology: Biological Fundamentals (H. J. Rehm and G. Reed Eds.) VCH Publishers: Weinheim. Vol. I.,pp 577-614.
Preil, W., Florek, P., Wix, U. and Beck, A. 1988. Towards mass propagation by use of bioreactors. Ada Horήc. 226: 99-106.
Radwan, S. S. and Kokate, C. K. 1980. Production of higher levels of trigonelline by cell cultures of Trigonella foenum-graceum than by the differentiated plant. Planta 147: 340-344.
Rajasekhar, E. W., Edwards, M., Wilson, S. B. and Street, H. E. 1971. J. Exp. Bot. 22: 107.
Rajendran, L.,Prathibha, K. R., Ravishankar, G. A. and Venkataraman, L. V. 1992. Anthocyanin production in callus cultures of Daucus carota as influenced by nutrient stress and osmoticum. Biotechnol. Lett. 14: 707-712.
Rajendran, L.,Suvarnalatha, G., Ravishankar, G. A. and Venkataraman, L. V. 1994. Enhancement of anthocyanin production in callus cultures of Daucus carota L. under the influence of fungal elicitors. Appl. Microbiol. Biotechnol. 42, 227-231.
Ravishankar, G. A. and Venkataraman, L. V. 1990. Food applications of plant cell cultures. Curr. Sci. 59: 914-920.
Reid, M. S., Paul, J. L. and Young, R. E. 1980. The effect of pH and ethephon on betacyanin leakage from beet root discs. Plant. Physiol. 66: 1015-1016.
Rhodes, M. J. C. 1985. Immobilized plant cells. In: Topics in Enzyme and Microbiol Biotechnol (A.Wiseman Ed.) Ellis Horwood: Chichester. pp 51-88.
Rhodes, M. J. C, Smith, J. I. and Robins, R. J. 1987. Factors affecting the immobilization of plant cells on reticulated polyurethane foam particles. Appl. Microbiol. Biotechnol. 26: 28-35.
Ricardo, C. P. P. and ap Rees, T. 1970. Invertase activity during the development of carrot roots. Phytochemistry 9: 239-247.
Rokem, J. S. and Goldberg, I. 1985. Secondary metabolites from plant cell suspension cultures: Methods for yield improvement, la: Advances in Biotechnological Processes (A. Mizrahi and A. L. van Wezel Eds.) Alan R Liss. New York, pp 241-274.

174
Rose, D.and Martin, S. M. 1975. Growth of suspension cultres of plant cells (Ipomea spp.) at various temperatures. Can. J. Bot. 53: 315-320.
Routier, J. B. and Nickell, L. G. 1956. Cultivation of plant tissue. US Patent 2, 747., 334.
Ruyter, C. M. and Stockigt, J. 1989. Novel natural products from plant cell and tissue
culture - an update. GIT Fachz. Lab. 4: 283-293.
Ryu, D. D. Y.,Lee, S. O. and Romani, R. J. 1990. Determination of growth rate for plant cell
cultures: comparative studies. Biotechnol. Bioeng. 35: 305-311.
Sakuta, M. and Komamine, A. 1987. Cell culture in phytochemistry. In: Cell Culture and Somatic Genetics of Plants (F. Constabel and I. K. Vasil Eds.) Academic Press: Sand Diego. Vol 4; pp 97.
Sato. K. 1961. Rheological studies on some fermentation broths I. Rheological analysis of
kanamycine and streptomycine fermentation broths. /. Ferment. Technol. 39: 347-353.
Schenk, R. U. and Hildebrandt, A.C. 1972. Medium and techniques for induction and growth of monocotyledonous and dicotyledonous plant cell cultures. Can. J. Bot. 50: 199-204.
Schlatmann, J. E., Moreno, P. R. H.,Vinke, J. L.,ten Hoopen, H. J. G. Verpoorte, R. and
Heijnen, J. J. 1994. Effect of oxygen and nutrient limitation on ajmalicine production and related enzyme activities in high density cultures of Catharanthus roseus. Biotechnol. Bioeng. 44: 461-468.
Schmauder, H. P. and Doebel, P. 1990. Plant cultivation as a biotechnological method.
Acta Biotechnol. 10: 501-516.
Scragg, A. H., Morris, P., Allan, E. J., Bond, P. and Fowler, M. W. 1987. Effect of scale-up on serpentine formation by Catharanthus roseus suspension cultures. Enzyme Microbial Technol. 9: 619-624.
Scragg, A. H., Allan, E. J. and Leckie, F. 1988. Effect of shear on the viability of plant cell suspensions. Enzyme Microbial Technol. 10: 361-367.

175
Scragg, A. H. and Aston, S., Steward, R. D. and Allan, E. J. 1990. Growth and quassin accumulation by cultures of Quassia amara. Plant Cell Tiss. Org. Cult. 23: 165-169.
Scragg, A. H. 1992. Bioreactors for the mass cultivation of plant cells. In: Plant Biotechnology (M. W. Fowler, G. S. Warren, M. Moo-Young Eds.) Pergamon Press: Oxford, pp 45-62.
Segel, I. H. 1976. Biochemical calculations. John Wiley and Sons, Inc.: London.
Seitz, H. U. and Hiderer, W. 1988. Anthocyanins. In: Cell Culture and Somatic Cell
Genetics of Plants (F. Constabel and I. K. Vasil Eds.) Acad. Press Inc.: San Diego. Vol 5. pp 49-76.
Shuler, M. L. 1981. Production of secondary metabolites from plant tissue culture -problems and prospects. Ann. N.Y. Acad. Sci. 369: 65-79.
Sim, K. S. 1964. Yakhak Hoechi 8: 69.
Singh, G. and Curtis, W. R. 1994. Reactor design for plant cell suspension culture. In:
Biotechnological Applications of Plant Cultures (P. D. Shargool and T. T. Ngo Eds.) CRC Press: Boca Raton, pp 151-183.
Singh, G. 1997. Reactor design for plant cell culture of food ingredients and additives. Food Technol. 51(11): 62-66.
Skirvin, R. M., Chu, M. C, Mann, M. L., Young, H., Sullivan, J. and Fermanian, T. 1986.
Stability of tissue culture medium pH as a function of autoclaving time and cultured plant type. Plant Cell Rep. 5: 292- 294.
Smart, N. J. and Fowler, M. W. 1981. Effect of aeration on large-scale cultures of plant cells.
Biotechnol. Lett. 1: 171-176.
Smart, N. J. 1984. Plant cell technology as route to natural products. Lab. Pract. Jan. 11-35.
Smart, N. J. and Fowler, M. W. 1984. An airlift column bioreactor suitable for large-scale cultivation of plant cell suspensions. J. Exp. Bot. 35: 531-537.
Snape, J. B., Thomas, N. H. and Callow, J. A. 1989. How suspension cultures of Catharanthus roseus respond to oxygen limitation: Small-scale test with applications to large-scale cultures. Biotechnol. Bioeng. 34: 1058-1062.

176
Songstad, D.D., Giles, K. L.,Park, J., Novakovski, D. Epp. D. and Friesen, L. 1990. Use of nurse cultures to select for Papaver somniferum cell lines capable of enhanced sanguinarine production. J. Plant Physiol. 136: 236-239.
Spear, K. 1986. Developments in food colouring: The natural alternatives. Trends Biotechnol. 6: 283-288.
Spier, R. E. and Fowler, M. W. 1983. Animal and plant cell culture. In:
Comprehensive Biotechnology (A. T. Bull and H. Dalton Eds.) Pergamon Press: Oxford, pp 301-330.
Spier, R. E. 1995. Gradients in animal and plant cell technology systems. Enzyme Microbial Technol. 17: 91-92.
Srinivasan, V.,Pestchanker, L.,Moser, S., Hirasuna, T. J., Taticek, R. A. and Shuler, M. L.
1995. Taxol production in bioreactors: Kinetics of Biomass accumulation, nutrient uptake, and taxol production by cell suspensions of Taxus baccata. Biotechnol. Bioeng. 47: 666-676.
Staba, E. J. and Kaul, B. 1971. US Patent 3 628 287.
Staba, E. J. 1982. Production of useful compounds from plant tissue culture. In: Plant Tissue
Culture (A. Fujiwara Ed.) Japanese Association for Plant Tissue Culture: Tokyo, pp 25-30.
Stafford, A., Smith, L. and Fowler, M. W. 1985. Plant Cell Tiss. Org. Cult. 4: 83-.
Stafford, A., Morris, P. and Fowler, M. W. 1986. Plant cell biotechnology - a perspective.
Enzyme Microbial Technol. 8: 578-587.
Stafford, A. 1991. The manufacture of food ingredients using plant cell and tissue cultures. Trends Food Sci. Technol. 2: 116-122.
Stafford, A. 1994. Anthocyanins and betalaines: Evolution of the mutually exclusive
pathways. Plant Sci. 101, 91-98.
Steward, F. C., Mapes, M. O. and Mears, K. 1958. Growth and organized development of cultured cells. II. Organization in cultures grown from freely suspended cells. Amer. J. Bot. 45, 705-708.

177
Stickland, G. G. and Sunderland, N. 1972. Production of anthocyanins, flavonols and chlorogenic acid by cultured callus tissues of Haplopappus gracilίs. Ann. Bot. 36: 443-457.
Street, H. E. 1977. Plant Tissue and Cell Culture Blackwell: Oxford.
Stuart, D. A. and Strickland, G. A. 1987. Bioreactor production of alfalfa somatic embryos. Hortic. Sci. 22: 800-803.
Stuart, R. and Street, H. E. 1969. Studies on the growth in culture of plant cells. /. Exp. Bot. 20: 556-571.
Su, W. W. and Lei, F. 1993. Rosmarinic acid production in perfused Anchusa officinalis
culture: effect of inoculum size. Biotechnol. Lett. 15: 1035-1038.
Sudhakar Johnson, T., Ravishankar, G. A. and Venkataraman, L. V. 1990. In vitro capsaicin production by immobilized cells and placental tissues of Capsicum annuum L. grown in liquid medium. Plant Sci. 70: 223-229.
Sudhakar Johnson, T. Ravishankar, G. A. and Venkataraman, L.V. 1991. Elicitation of
capsaicin production in freely suspended cells and immobilized cell cultures of Capsicum frutescens Mill.Food Biotechnol. 5: 197-205.
Sudhakar Johnson, T. 1993. Studies on production of capsaicin in immobilized cells and
placental tissues of Capsicum annuum and C frutescens. Ph.D. Thesis. University of Mysore: Mysore.
Sudhakar Johnson, T., Priyasethu, K. M. and Ravishankar, G. A. 1996. A rapid method of
determining the viability of plant cells using a mixture of fluorescein diacetate and calcofluor white. J. Med. Aromatic Plant Sci. 18: pp 505-506.
Sudhakar Johnson, T. and Ravishankar, G. A. 1996. Precursor biotransformation in immobilized placental tissues of Capsicum frutescens Mill. I. Influence of feeding intermediate metabolites of the capsaicinoid pathway on capsaicin and dihydrocapsacin accumulation. /. Plant Physίol 147: 481-485.
Sujatha, V., Ravishankar, G. A. and Venkataraman, L. V. 1990. Induction of crocin,
crocetin, picrocrocin and saffranal synthesis in callus cultures of saffron {Crocus sativus L.). Biotechnol. App. Biochem. 12: 336-340.
178
Sung, Z.R. 1976. Turbidimetric measurement of plant cell culture growth. Plant Physiol. 57: 460-462.
Suvarnalatha, G. Nagin Chand, Ravishankar, G. A. and Venkataraman, L. V. 1993.
Computer-aided modeling and optimization for capsaicinoid production by immobilized Capsicum frutescens cells. Enzyme Microbial Technol. 15: 710-715.
Suvarnalatha, G.,Narayan, M.S., Ravishankar, G. A.and Venkataraman, L.V. 1994. Flavour production in plant cell cultures of basmathi rice (Oryza sativa L.). /. Sci. Food. Agric. 66: 439-442.
Swanson, S. M.,Mahady, G. B. and Beecher, C.W.W. 1992. Stevioside biosynthesis by callus, root, shoot and rooted-shoot cultures in vitro. Plant cell Tiss. Org. Cult. 28: 151-157.
Takayama, S., Misawa, M.,Ko, K. and Misato, T. 1977. Effect of cultural conditions on the growth of Agrostemma githago cells in suspension culture and the concomitant production of an anti-plant virus substance. Physiol. Plant. 41: 313-320.
Takeda, J. 1988. Light induced synthesis of anthocyanin in carrot cells in suspension. 1.
The factors affecting anthocyanin production. J. Expt. Bot. 39: 1065-1077.
Tal, B. Rokem, J. S. and Goldberg, I. 1983. Factors affecting growth and product formation
in plant cells grown in continuous culture. Plant Cell Rep. 2: 219-222.
Tanaka, H. 1981, Technological problems in cultivation of plant cells at high density.
Biotechnol. Bioeng. 23: 1203-1218.
Tanaka, H. 1982. Oxygen transfer in broths of plant cells at high densities. Biotechnol.
Bioeng. 24: 425-442.
Tanaka, H., Semba, H., Jitsufuchi, T. and Harada, H. 1988. The effect of physical stress on
plant cells in suspension cultures. Biotechnol. Lett. 10: 485-490.
Tanaka, H., Aoyagi, H. and Jitsufuchi, T. 1992. Turbidimetric measurement of cell biomass of plant cell suspensions. J. Ferment. Bioeng. 73: 130-134.
Taticek, R., Moo-Yong, M.,Legge, R. L. 1990. Effect of bioreactor configuration on substrate uptake by cell suspension cultures of plant Eschscholtzia californica. Appl. Microbiol. Biotechnol. 33: 280-286.

179
Taya, M.,Hegglin, M.,Prenosil, J. E. and Bourne, J. R. 1989a. On-line monitoring of cell growth in plant tissue cultures by conductometry. Enzyme Microbial Technol. 11: 170-176.
Taya, M., Yoyama, A., Kondo, O. Kobayashi, T. and Matsui, C. 1989b. Growth
characteristics of plant hairy roots and their cultures inbioreactors. J. Chem. Eng. 22: 84-89.
Thirumalachar, D. K. 1967. Variability for capsaicin content in chilli. Curr. Sci. 36: 269-270.
Thorn, M., Maretzki, A., Komor, E. and Sakai, W. S. 1981. Nutrient uptake and
accumulation by sugar cane cell cultures in relation to the growth cycle. Plant Cell Tiss. Org. Cult. 1: 3-14.
Tiburcio, A. F., Gendy, C. A. and Tran, T. V. K. 1989. Morphogenesis in tobacco subepidermal cells: Putrescine as a marker of root differentiation. Plant Cell Tiss. Org. Cult. 19: 43-54.
Toivonen, L.,Ojala, M. and Kauppinen, V. 1990. Indole alkaloid production by hairy root cultures of Catharanthus roseus: growth kinetics and fermentation. Bίotechnol. Lett. 12: 519-524.
Treat, W. J., Engler, C. R. and Soltes, E. J. 1989. Culture of photomixotropic soybean and pine in a modified fermentor using a novel impeller. Biotechnol. Bioeng. 34: 1191-1202.
Tremouillaux-Guiller, J.,Andreu, F., Creche, J.,Chenieux, J. C. and Rideau, M. 1987.
Variability in tissue culture of Choisya ternata. Alkaloid accumulation in protoclones and aggregate clones obtained from established lines. Plant Cell Rep. 6: 375- 378.
Trinder, P. 1969. Determination of blood glucose using an oxidase-peroxidase system with a non-carcinogenic chromogen. /. Clin. Pathol. 22: 158-161.
Tulecke, W. and Nickell, L. G. 1960. Methods, problems and results of growing plant cells
under submerged culture. Trans. New York Acad. Sci. 22: 196-204.
Ulbrich, B., Weisner, W. and Arens. H. 1985. Large scale production of rosemarinic acid
from plant cultures of Coleus blumei. In: Secondary Metabolism of Plant Cell Culture (B. Deus- Newmann, W. Barz and E. Reinhard Eds.) Springer-Verlag: Berlin, pp 293-303.

180
van Gulik, W. M., Jeijer, J. J., ten Hoopen, H. J. G., Luyben, K. C. A. M., Libbenga, K. R. 1989. Growth of Catharanthus roseus cell supension culture in a modified chemostat under glucose limiting conditions. Appl. Microbiol. Biotechnol. 30:270-275.
van Gulik, W. M., ten Hoopen, H, J. G., Heijnen, J. J. 1993. A structured model describing
carbon and phosphate limited growth of Catharanthus roseus plant cell suspensions in batch and chemostat culture. Biotechnol. Bioeng. 41: 771-780.
Vaush, R.,Ratilsky, M. B., Keren, Z. M. and Robenfield, B. 1986. In: VIInternational Congress of Plant Tissue and Cell Culture (D. A. Somers, B. G. Gengenbach, D. D. Biesboer, W. P. Hackett and C. E. Green Eds.) IAPTC: USA. pp 116.
Vega, F. A., Ramos, M. F., Fernandez, M., Santesteban, M. and Galar, A. 1987.
Pharmacological activity of anthocyanins. Cienc. Ind. Farm. 6:205-208.
Wagner, F., Vogelmann, H. 1977. Cultivation of plant tissue cultures in bioreactors and
formation of secondary metabolites. In: Plant Tissue Culture and its Biotechnological Applications (W. Barz, E. Reinhard and M.M. Zenk Eds.) Springer-Verlag: New York, pp 245-252.
Wangsamuth, R. and Doran, P.M. 1994. Foaming and cell floatation in suspended plant
cell cultures and the effect of chemical antifoams. Biotechnol. Bioeng. 44: 481-488.
Warren, G. S. 1992. The cell biology of plant culture systems, la: Plant Biotechnology (M.W. Fowler, G. S. Warren and M. Moo- Young Eds.) Pergamon Press: Oxford, pp 1-18.
Weatherburn, M.W. 1967. Phenol-hypochlorite reaction for determination ofammonia. /.
Anal. Chem. 39: 971-974.
White, P. R. 1934. Potentially unlimited growth of excised tomato root tips in a liquid
medium. Plant Physiol. 9: 585-600.
White, P. R. 1963. The Cultivation of Animal and Plant Cells. Ronald Press: New York.
Wickremesinhe, E. R. M. and Arteca, R. N. 1994. Taxus cell suspension cultures: Optimizing growth and production of taxol. J. Plant Physiol. 144: 183-188.

181
Wilkinson, M., Sweeny, J. G. and lacobucci, A. 1977. High pressure liquid chromatography of anthocyanidins. /. Chromatog. 132: 349- 351.
Williams, P. D.and Mavituna, F. 1992. Immobilized plant cells In: Plant Biotechnology (M.
W. Fowler, G. S. Warren and M. Moo- Young Eds.) Pergamon Press: Oxford, pp 63-78.
Wilson, S.B., King, P.J. and Street, M.E. 1971. Studies on the growth in cultured plant cells. XII. A versatile system for the large scale batch or continuous culture of plant cell suspensions. J. Exp. Bot. 21: 460-462.
Wink, M. 1988. Plant breeding: importance of plant secondary metabolites for protection
against pathogens and herbivores. Theor. Appl. Gen. 75: 225-233.
Wiznsama, R., Verpoorte, R., Harkes, P. A. A., Vanvliet, T. B., Tenhoopen, H. J. G. and Baerheim, S. 1986. The influence of initial sucrose and nitrate concentration on the growth of Cinchona ledgeriana cell suspension cultures and the production of alkaloids and anthraquinones. Plant Cell Tiss. Org. Cult. 7: 21-29.
Yamakawa, T.,Kato, S., Ishida, K.,Kodama, T. and Monida, Y. 1983. Production of
anthocyanins by Vitis cells in suspension cultures. Agri. Bίol. Chem. 47: 2185-2191.
Yamakawa, T.,Onomichi, K. Kodama, T. and Minoda, Y. 1985. Application of feeder layer method for improved colony formation of grape cells and protoplasts at low cell density. Agric. Bίol. Chem. 49: 3583-3585.
Yamamoto, Y., Mizuguchi, R. and Yamada, Y. 1982. Selection of a high and stable pigment-
producing strain in cultured Euphorbia mίllii cells. Theoretical Appl. Gen. 61: 113-116.
Yamamoto, Y. 1984. In: A Manual for Plant Cell Culture (Y. Yamada Ed.) Kodansha
Scientific: Tokyo, pp 45.
Yamamoto, A. and Yamada, Y. 1987. Selection of reserpine producing cell strain using UV
light and optimization of reserpine production in the selected cell strain. Plant Cell Tiss.
Org. Cult. 8: 125-133.
Yeoman, M. M.,Midzybrodzka, M. B. Lindsey,K. and Mc Lauchlan, W. R. 1980. The
synthetic potential of cultured plant cells. In: Plant Cell Cultures: Results and Perspectives (F. Sala, B. Parisi, R. Cella and O. CifferiEds.) Elsevier North Holland Pub.: Amsterdam, pp 327-343.

182
Yu, S. and Doran, P. M. 1994. Oxygen requirements and mass transfer in hairy-root culture. Bίotechnol. Bioeng. 44: 880-887.
Zamski, E. and Wyse, R. E. 1985. Stereospecificity of glucose carrier in sugar beet suspension cells. Plant Physiol. 78: 291-295.
Zenk, M. H.,E1-Shagi, H. and Ulbrich, B. 1977a. Production ofrosmarinic acid by cell suspension cultures of Coleus blumeί. Naturwίssenschafteur. 64: 585-586.
Zenk, M. H.,Shagi, H. EL.Arens, H.,Stockigt, J., Weiler, E. W. and Deus, B. 1977b. Formation of indole alkaloids serpentine and ajmalicine in cell suspension cultures of Catharanthus roseus. In: Plant Tissue Culture and its Biotechnological Application (W. Barz, E. Reinhard and M. H. Zenk Eds.) Springer-Verlag: Berlin, pp 27-43.
Zenk, M. H. El-Shagi, H. and Schulte, U. 1985. Anthraquinone production by cell suspension cultures of Morinda citrifolia. Planta Med. Suppl.: 79-101.
Zink, M. W. and Veliky, L A . 1979. Acid phosphotases of Ipomea sp. in vitro: I. Influence of pH and inorganic phosphates on the formation of phosphatases. Can. J. Bot. 57: 739 -753.
Zhong, J. J., Seki, T.,Kinoshita, S. and Yoshida, T. 1991. Effect of light irradiation on anthocyanin production by suspended cultures of Perilla frutescens. Biotechnol. Bioeng. 38: 653-658.
Zhong, J. J., Seki, T.,Kinoshita, S. and Yoshida, T. 1992. Rheological characteristics of cell suspension and cell cultures of Perilla frutescens. Biotechnol. Bioeng. 40: 1256-1262.
Zhong, J. J., Yoshida, M., Fujiyama, K., Seki, T. and Yoshida, T. 1993a. Enhancement of anthocyanin production by Perilla frutescens cells in a stirred bioreactor with internal light irradiation. /. Ferment. Bioeng. 75: 299-303.
Zhong, J.J., Fijiyama, K.,Seki, T. and Yoshida, T. 1993b. On-line monitoring of cell concentration of Perilla frutescens in a bioreactor. Biotechnol. Bioeng. 42:542-546.
Zhong, J. J. 1995. Recent advances in cell cultures of Taxus spp. for production of natural anticancer drug taxol. Plant Tiss. Cult. Biotechnol. 1: 75-80.
Zhong, J. J. and Yoshida, T. 1995. High-density cultivation of Perilla frutescens cell suspensions for anthocyanin production: Effects of sucrose concentration and inoculum size. Enzyme Microbial Technol. 17: 1073-1079.

PUBLICATIONS

R. Madhusudhan, S.Ramachandra Rao and G.A. Ravishankar 1995. Osmolarity as a measure of growth of plant cells in suspension culture. Enzyme and Microbial Technology 17:989-991.
R. Madhusudhan and G.A. Ravishankar 1996. Gradient of aπthocyanin in cell aggregates of Daucus carota in suspension culture. Biotechnology Letters 18: 1253 - 56.