plant and insect-mediated invasiveness of - cornell university
TRANSCRIPT

PLANT AND INSECT-MEDIATED INVASIVENESS OF PHRAGMITES
AUSTRALIS AND THE LITTER DYNAMICS AND BIODIVERSITY OF SIX
FRESHWATER MACROPHYTES
A Thesis
Presented to the Faculty of the Graduate School
of Cornell University
In Partial Fulfillment of the Requirements for the Degree of
Master of Science
by
Mia Genevieve Park
August 2006
© 2006 Mia Genevieve Park
ABSTRACT
My thesis involves two distinct projects related to wetland plants. The first
evaluates plant traits for their contribution to the success of invasive Phragmites
australis in North America and their interaction with herbivores. The second
investigates the relative effects of six plant species, with different growth forms, status
(native v. nonnative) and tissue quality, on litter dynamics and invertebrate diversity in
a New York freshwater wetland.
Prevention is the most cost-effective and successful means of managing
invasive plants. Predicting future invasions depends on identifying plant traits that
facilitate invasive success. We investigated the influence of above-ground growth
phenology and increased stem height on the success of invasive Phragmites australis
in North America, using a phylogenetically-controlled comparison with a native, non-
weedy P. australis subspecies. We also measured the effects of specialist stem-galling
Lipara flies and a generalist aphid (Hyalopterus pruni), both nonnatives to North
America, on these above-ground traits. Comparisons were made in 1) a common
garden at Cornell University, Ithaca, NY, in 2003 and 2004, and 2) a field site at
Montezuma National Wildlife Refuge, Seneca Falls, NY in 2003. In the garden, but
not the field, nonnative P. australis leaves remained green for about a month longer
(native v. nonnative: 2003 = 59.93 v. 85.5 days, P = 0.0002; 2004 = 52.29 v. 87.39
days, P = 0.02). For nonnative P. australis, leaves of the upper canopy consistently
lived longer while leaf lifespan in the lower canopy was shorter or the same. Greater
investment in high canopy leaves may increase carbon gain efficiency of nonnative P.
australis. Nonnative P. australis grew taller in the field but this was mediated by
disproportionate Lipara attack rather than plant status (native or nonnative). Lipara
attack reduced stem height of all stems but only increased the lifespan of nonnative P.
australis’ low canopy leaves. Aphids had no significant effect on measured plant

traits. Through increased carbon gain, leaf phenology may contribute to P. australis’
competitive superiority over its native conspecific. Higher susceptibility of native P.
australis to nonnative herbivores may also facilitate nonnative P. australis’
competitive superiority.
Senesced plant litter from emergent macrophytes fuels freshwater wetland
productivity and nutrient cycling. Litter nitrogen content generally has a direct,
positive effect on quantity and rate of resource availability to wetland biota. Since
plants vary in their nitrogen content, shifts in plant community composition may alter
important wetland functions. To study the consequences of changing plant
dominance, we compared litter mass loss and invertebrate richness and abundance of
six common macrophytes in a central New York freshwater wetland. Plants studied
include Typha latifolia L. (broad leafed cattail, Typhacea), T. angustifolia L. (narrow
leafed cattail), Phragmites australis (cav.) Trin ex. Steudel (common reed, Poaceae),
P. australis subspecies americanus Saltonstall, P.M. Peterson & Soreng, Lythrum
salicaria L. (purple loosestrife, Lythraceae), and Phalaris arundinacea L. (reed
canarygrass, Poaceae). After nine months, mass loss of most plant species diverged
significantly. Plant effect on invertebrate colonization was season and species-
specific, with P. arundinacea almost consistently supporting higher invertebrate
densities. Although %N differed among some plant species, it was not a good
predictor of mass loss or invertebrate abundance and richness. Including plastic
drinking straws as a treatment revealed that several invertebrates used litter for
substrate rather than food. We conclude that shifts in plant dominance among the six
wetland macrophytes investigated could potentially alter wetland function, by
changing decomposition rates and the invertebrate community. Net quality of litter
resources, which depends on the combined influence of morphology, chemical quality
of specific plant organs, and feeding ecology of specific taxa, may be a better
predictor of species effects on decomposition and diversity.
iii
BIOGRAPHICAL SKETCH
Mia Park was born to Noel and Mary in Vancouver, Canada, where she and
her younger siblings, Angela and Derek, spent their early childhood years. Mia
somehow got through her teens while living in Seoul, Korea and then San Jose,
California, which she now calls home. Mia received her Bachelors of Science (Land,
Air and Water Resources) and Arts (French) in 1999 from University of California,
Davis. Attending UC Davis instilled in Mia a love for small towns and field biology.
After graduation, she spent three years working as a field technician on various
research projects, which ranged widely in study organism and location. Through these
diverse experiences, Mia identified three core interests to pursue for graduate study:
wetlands, invasive plants and invertebrates. She found a great match in the Ecology
and Management of Invasive Plants Program (EMIPP) at Cornell University’s
Department of Natural Resources. During her time at Cornell University, Mia’s
passion for invertebrates deepened. While still interested in invasion biology, she now
plans to study invasive ants and their impacts on native endemic ants and frogs in
Madagascar. Ultimately, Mia hopes to increase general interest and support for
invertebrate conservation.

iv
In memory of Joe Stasulat whose encouragement still urges me forward today.

v
ACKNOWLEDGMENTS
I would like to thank Bernd Blossey, my major advisor, for his constant
support, confidence and ready laugh. I appreciate his drive for innovation and the
thick skin I developed under his tutelage. I want to thank my committee member
Mark Bain whose advice and reassurance contributed substantially to my thesis and to
calming my nerves.
I extend great thanks to all members of the Ecology and Management of
Invasives Plants Program (EMIPP)— past and present— for their support, feedback,
enthusiasm, and friendship. Much of what I learned about invasion biology, ecology
and good science comes from my interaction with this group. Needless to say, my
field and lab work would not have been possible without them.
A special thanks to Jim Booth and Francoise Vermeylan whose statistical
expertises were essential to completing this work. I am also grateful to Patrick
Sullivan, Ted Treska and Beth Gardner for their statistical consulting at the early
stages of my thesis.
Several programs provided invaluable financial support for my master’s work
at Cornell University: Sea Grant New York, Cornell University Andrew Mellon
Environmental Award, and the IGERT Environmental Small Grants Award. Thanks
to the US Fish and Wildlife Service, the NY Department of Conservation and the
National Wildlife Refuge System for permission to conduct research on their land.
I am deeply grateful for the community of friends and colleagues I found in the
Department of Natural Resources at Cornell University. No where have I met a group
of people more genuine, intelligent, motivated and kind. Finally, I would like to thank
my parents, Mary and Noel, and my siblings, Angela and Derek, who have supported
me unconditionally in my pursuits to “save the planet”.

vi
TABLE OF CONTENTS Page
BIOGRAPHICAL SKETCH............................................................................... iii
DEDICATION..................................................................................................... iv
ACKNOWLEDGMENTS................................................................................... v
LIST OF FIGURES............................................................................................. vii
LIST OF TABLES............................................................................................... viii
CHAPTER ONE: Influence of stem traits and herbivory on the success of
invasive Phragmites australis.............................................................................. 1
Abstract.................................................................................. 1
Introduction............................................................................ 2
Methods.................................................................................. 4
Results.................................................................................... 10
Discussion.............................................................................. 18
References.............................................................................. 23
CHAPTER TWO: Decomposition dynamics and invertebrate diversity of
six wetland macrophytes in a New York freshwater marsh................................. 28
Abstract.................................................................................. 28
Introduction............................................................................ 29
Methods.................................................................................. 31
Results.................................................................................... 36
Discussion.............................................................................. 46
References.............................................................................. 54
APPENDIX.......................................................................................................... 58

vii
LIST OF FIGURES Page Figure 1.1. Leaf production (open symbols) and senescence (filled 12 symbols) on native (circles) and introduced (triangles) Phragmites australis stems (cumulative proportion, separated by galled and ungalled stems) in the common garden (2003, 2004) and in the field (2003). Figure 1.2. Leaf life span of galled and ungalled stems of native and 13 introduced Phragmites australis at different vertical positions in the common garden (2003, 2004) and at Montezuma NWR (2003). Figure 1.3. Stem growth of native and introduced Phragmites australis 14 haplotypes in the common garden (2003, 2004) and field site (2003). Figure 1.4. Number of leaves (means ± 2SE) on galled and ungalled 16 stems of native and introduced Phragmites australis in the common garden (2003, 2004) and at Montezuma NWR (2003). Figure 1.5. Apical attack (proportion of stems attacked) by Lipara spp. 17 gall flies on stems of native and introduced Phragmites australis haplotypes in the common garden (2003, 2004) and at Montezuma NWR (2003). Figure 1.6. Frequency of aphid densities on leaves of native and 18 introduced Phragmites australis stems in the common garden (2003 and 2004) and in the field (2003). Figure 2.1. Decomposition (litter mass remaining [%] after six and nine 39 months) and C:N over time for Phragmites australis americanus (PAU-A), P. australis (PAU), Typha latifolia (TLA), T. angustifolia (TAN), Lythrum salicara (LSA), Phalaris arundinacea (PAR), and plastic drinking straws (PLASTIC, excluded for C:N). Figure 2.2. Invertebrate density and taxa richness in spring and fall in 41 litter bags filled with seven litter treatments (see Fig. 2.1 caption for acronym definitions). Plant species are ranked by N content. Figure 2.3. Density (log10 transformed) of select invertebrate composite 43 taxa in spring and fall in litter bags filled with seven litter treatments (see Fig. 2.1 caption for acronym definitions). Figure 2.4. Invertebrate communities (proportion composite taxa) 44 collected in litter bags filled with seven litter treatments (see Fig. 2.1 caption for acronym definitions) in spring and fall.

viii
LIST OF TABLES Page Table 1.1. Collection location, state or province, status (N= native, 8 I= introduced), and haplotype of Phragmites australis grown in the common garden. Table 1.2. Effects of status (native or nonnative), aphid herbivory (low 12 v. med to high), vertical position, and stem galling on Phragmites australis leaf life span as tested with mixed linear regression, treating stem as a random variable and position 2nd order. Table 1.3. Results of repeated measures ANOVA testing the effects of 15 status (native or nonnative) and gall formation on Phragmites australis stem height in the common garden and in the field through the growing season. Table 1.4. Results of two-way ANOVA testing the effects of status 16 (native or nonnative) and gall formation on total leaf number per Phragmites australis stem in the common garden and in the field. Table 2.1. Growth form and status (native or introduced) in the Northeast 32 of six wetland plant species studied. Table 2.2. Site characteristics at Deer Creek Marsh during spring (June) 33 and fall (September) collections. Table 2.3. Initial percent nitrogen (%N) in leaf, stem and whole plant 37 (combined stem and leaf) litter; percent carbon (%C) in while plant litter; and leaf to stem mass ratios for Phragmites australis americanus (PAU-A), P. australis (PAU), Typha latifolia (TLA), T. angustifolia (TAN), Lythrum salicaria (LSA), and Phalaris arundinacea (PAR).
Table 2.4. Densities (counts per 100 g) of invertebrate groups in large 45 mesh bags filled with one of six plant litter treatments (see Table 2.3 title for species list) or plastic drinking straws (PLA). Invertebrates were sampled spring and fall 2004. Table 2.5. Composition (%) of top five dominant taxa in mesh bags filled 47 with one of six plant litter treatments (see Table 2.3 title for species list) or plastic drinking straws (PLA). Invertebrates were sampled spring and fall 2004. Table A.1. Complete list of invertebrate taxa collected from litter bags 58 placed in Deer Creek Marsh, NY.

1
CHAPTER ONE
Influence of stem traits and herbivory on the success of invasive
Phragmites australis
Abstract
According to theory, plant community structure results from the combined influence
of inherent plant traits and external forces (e.g. herbivores); however, rarely are the
two explicitly integrated in studies of plant invaders. Here we investigate whether
above-ground growth phenology and increased stem height contribute to success of
invasive Phragmites australis in North America, by using a phylogenetically
controlled comparison with the native, non-invasive Phragmites australis americanus
subspecies. We concurrently recorded the influence of herbivore attack by introduced
specialist, stem-galling Lipara spp. flies and introduced generalist Peach aphid
(Hyalopterus pruni) on plant growth and phenology. We used two different venues, a
common garden and a field site in upstate New York, USA for our study. In the
garden but not the field, nonnative P. australis leaves lived on average a month longer.
Consistent across venue, the vertical age structure of nonnative P. australis
demonstrated a potential for greater resource gain in dense canopy conditions. We
found significant differences in plant height in the field, but height was mediated by
Lipara spp. herbivory rather than native or nonnative status. Lipara spp. attack also
influenced vertical age structure but not overall leaf senescence patterns. Aphids had
no significant effect on traits measured. Differences in leaf phenology between native
and non-native P. australis may contribute to the competitive superiority of nonnative
P. australis. Consistent higher rates of herbivory on native P. australis americanus
indicate that introduced herbivores may also facilitate replacement of this North
American endemic subspecies by nonnative P. australis.

2
Introduction
Successful management of threats posed by plant invasions depends on prevention of
new introductions (Rejmanek 2000). Increasing our ability to predict which plant
species will be invasive in a new environment or have a negative impact on the
invaded environment is, thus, fundamental to invasion ecology.
Leading hypotheses for invasive plant success stem from two general
community ecology perspectives where external (e.g. plant-plant or plant-insect
interactions) or endogenous (genetically-based) forces influence plant competitive
ability. Enemy release (ERH)(Keane and Crawley 2002, Torchin et al. 2003, DeWalt
et al. 2004), evolution of increased competitive ability (EICA)(Blossey and Notzold
1995), and biotic resistance (Case 1990, Kennedy et al. 2002) are largely exogenous in
nature, relying on biotic forces influencing plant success and evolution. Endogenous-
centered explanations of invasive success emphasize the importance of pre-adaptive
traits that allow a plant to out-compete and dominate neighboring (native and
introduced) flora in the introduced range (Sax and Brown 2000). High reproductive
output, broad plasticity, superior levels of productivity and rapid growth are
commonly observed traits of weedy plants (Baker 1965; Noble 1989; Roy 1990).
Nonnative plant possession of novel weapons, the suppression of native flora and/or
pathogens via root exudates, might also fall in this category (Callaway and Ridenour
2004, Prati and Bossdorf 2004).
Despite the importance of these hypotheses for experimental investigations, it
is clear that they each have limitations, considering the fate of a novel plant may
depend on the combined influence of 1) its evolutionary history and traits, 2) plant-
plant interactions, 3) interactions with other trophic levels or the abiotic environment
and climate, and 4) stochasticity (Lortie et al. 2004). While our understanding of the
factors that influence successful invasions has certainly improved over the last few
3
decades (Sax and Brown 2000), lack of integration among different hypotheses may
limit our ability to further improve understanding of invasion success and contribute to
general predictive inability.
In this study, we hypothesized that leaf phenology and plant height contribute
to the invasive success of Phragmites australis (cav.) Trin ex. Steudel in North
America (NA). Phragmites australis (Type M haplotype) was introduced to NA ca.
200 years ago (Saltonstall 2002) and has spread throughout wetlands of the United
States, particularly along the Atlantic Coast and in the Midwest (Marks et al. 1994).
The presence of the native, non-invasive conspecific P. australis subsp. americanus
Saltonstall, P.M. Peterson & Soreng in NA facilitates phylogenetically controlled
comparisons to isolate plant characters that contribute to its invasive success
(Trowbridge 1996, Agrawal and Kotanen 2003, Burns 2004).
In a common garden and a field site, we specifically predicted that 1)
introduced P. australis will have a prolonged period of growth and 2) introduced P.
australis stems will grow taller. Community dominance, linked to superior biomass
production, requires relatively high levels of resource capture. By prolonging
exploitation of resources, early and/or extended growth enables a plant to maximize
productivity (Hulbert 1955, McKell et al. 1962, Fox 1984, Bazzaz 1986, Crawley
1987, Chikoye et al. 1996, Zotz et al. 2000, West et al. 2003). Plants may extend the
duration of photosynthetic activity via early germination and establishment or through
delayed leaf and stem senescence. Such advantages in resource use may determine
plant fitness and, ultimately, the outcome of plant competition (Chikoye et al. 1996).
Increased plant height, shown to be a good predictor of macrophyte invasive success
(Gaudet and Keddy 1988), also facilitates greater access to light resources. Light
limited plants may optimize carbon gain by quickly remobilizing nitrogen from shaded
leaves in the under-story to new leaves of the upper canopy (Mooney et al. 1981).
Since P. australis leaves emerge as the stem grows, increased height may be a product

4
of this tactic. Finally, the dense clonal stature of P. australis can limit light access to
potential competitors (Haslam 1971).
To integrate an external force that may act on plant traits involved in the
success of invasive P. australis, we recorded the influence of herbivory on plant
growth and phenology. Phragmites plants are attacked by two conspicuous
herbivores: specialist gall-forming flies of the genus Lipara and a generalist aphid,
Hyalopterus pruni (Geoffroy), both of which are nonnative and attack the stem apex
and leaves, respectively. Lipara spp. lay their eggs on the upper most leaves of P.
australis stems (Chvala et al. 1974). Once hatched, larvae enter the tip of the stem
and form a gall, which destroys the apical meristem, impeding stem growth
(Tscharntke 1999). Hyalopterus pruni uses P. australis as a secondary host in late
spring and early summer and feeds on phloem from leaf tissue (Mook and Wiegers
1999). Phloem-feeders have been shown to alter leaf phenology, which in turn, can
negatively affect growth (Bazzaz and Hartnett 1984). At least 162 herbivores are
associated with P. australis in Europe; whereas, only 26 species are known in NA, of
which only five are native (Tewksbury et al. 2002). Given nonnative P. australis
evolved under higher herbivore pressure than the native North American subspecies,
we predicted that Lipara spp. and H. pruni would have a stronger influence on native
P. australis stems.
Materials and methods
Study species
Extant populations of Phragmites throughout most of NA consist of the introduced
Type M haplotype and an endemic North American subspecies P. australis
americanus (Saltonstall et al. 2004). Due to the recent discovery of native endemic
5
North American haplotypes, little information on potential differences in ecology,
plant-herbivore interactions and ecosystem function among the different haplotypes is
available; however, in addition to genetic techniques, Type M can be separated from
all endemic haplotypes using morphological traits (Blossey 2003). All Phragmites
haplotypes are tall, clonal grasses growing in freshwater to oligohaline tidal wetlands,
marshes, ditches and along roadsides. After initial establishment, plants produce
annual cane-like 2 – 5 m tall shoots that produce flowers in late summer and disperse
seeds over much of the fall and winter. Seeds are dispersed by wind, water, and
adhesion to waterfowl; reproduction from seed is variable and usually low but
important for colonization of new habitats (Haslam 1972a). Rhizome fragments are
transported with construction equipment, water, or animals; clonal expansion after
establishment occurs through an extensive rhizome system producing up to 200
stems/m2 (Haslam 1958). Approximately two thirds of the biomass is allocated to the
rhizome-system that can reach a depth of 2 m (Szczepansky 1969, Haslam 1972b).
Typically, established P. australis americanus populations are small (<1 ha),
and the species grows in mixed communities of many other wetland plants. In
contrast, Type M P. australis, introduced about 200 years ago from Europe
(Saltonstall 2002), has spread across much of North America effectively replacing
mixed, native wetland plant communities with extensive, dense monocultures
(Saltonstall 2002). By 1960, historic P. australis americanus sites located in
Connecticut, Massachusetts and Rhode Island had been replaced by Type M P.
australis (Saltonstall 2002). The Type M haplotype has also expanded its range into
the Southeast, where Phragmites did not occur previously.

6
Study sites and experimental conditions
In order to compare leaf phenology and growth, we monitored stem and leaf
characteristics of native P. australis americanus and Type M P. australis haplotypes
growing in a common garden at Cornell University’s Resource Ecology and
Management facility (REM) in 2003 and 2004. In 2003, a parallel field study was
conducted at the Montezuma National Wildlife Refuge (MNWR), Seneca Falls, NY,
where Type M and native Type E P. australis populations grew adjacently.
The common garden is a collection of Phragmites haplotypes (multiple
plants/location) from across NA with a focus on temperate populations. All
haplotypes were started from rhizome collections either excavated by us or provided
to us by collaborators from across the continent. Plants were grown in 28 X 27 cm
plastic nursery pots filled with potting soil (Farfard Canadian growing mix No. 1-P,
Agawam, MA) and placed into shallow 4 x 4 m artificial pools (10 cm water depth) to
provide them with sufficient moisture. Each pond contained a mix of native and Type
M P. australis plants grouped according to collection location. Plants were weeded
regularly and fertilized with 20 g Osmocote® slow release fertilizer (N-P-K: 18:6:12;
The Scotts Company, Marysville, Ohio) each spring.
On 26 June 2003, 23 native and 25 Type M P. australis we randomly selected
plants, representing 13 native and 5 introduced populations (Table 1.1) grown for at
least one full growing season in the common garden. One stem per plant was tagged
with flagging tape. Starting at the base of the plant (excluding basal leaves <10cm),
fully expanded leaves were labeled with a unique ID number on the underside of the
leaf using a permanent nursery marker. Leaves that had already emerged by the first
date were not used in phenology comparisons as it was impossible to know their exact
emergence date. We repeated this experiment in 2004 using identical labeling
procedures but with a different set of plants, which were all placed at random in a

7
single pond (50 cm distance between pots). One plant was randomly chosen from each
of 13 native and 11 Type M P. australis populations represented (Table 1.1). In order
to test whether Type M and native haplotypes initiate growth at the same time, we
began monitoring stems earlier, 5 May, in 2004.
At our field site (located 100 km north of the common garden), a Type M
clone (10 x 8 m) grew immediately adjacent to a native Type E clone (7 x 5 m) in a
spring-flooded, shallow depression in a meadow next to the visitor center of the
MNWR. Both stands have existed at this location for at least ten years (Blossey, pers.
obs.). As is typical, Type M grew in a virtual monoculture and continued to expand,
while Type E stems grew interspersed with many other wetland and meadow species.
On 6 June 2004, six stems (three on either side) were selected at 1 m intervals along a
transect that ran through the adjacent native and nonnative clones, perpendicular to the
inter-clone boundary. A total of 53 native and 55 nonnative stems were tagged, and
fully expanded leaves were subsequently labeled as described for stems in the
common garden.
Plant measurements
At the field site and in the common garden (both years), we measured stem height at
least every two weeks from study initiation through December and recorded premature
stem death and breakage. To establish whether Type M has a longer period of
photosynthetic activity, stems in the common garden and field were visited weekly, at
which point newly emerged leaves (fully expanded) were labeled and senescence
(determined when leaf was completely devoid of green) of labeled leaves recorded.
Monitoring in both the garden and the field continued through mid December. For

8
Table 1.1. Collection location, state or province, status (N= native, I= introduced), and Haplotype of Phragmites australis grown in the common garden.
1 genotyped 2 study year 1 and 2 correspond to 2003 and 2004, respectively.
Location State/Province Status Haplotype1 Study Year2
Memramcook New Brunswick N S 1,2 Hillsborough New Brunswick N S 1 Sheppody New Brunswick N E 1 Montezuma NWR New York N E 1,2 Robert Moses State Park New York N E 1,2 Deer Creek Marsh New York N unknown 2 Brandy Brook New York N G 1,2 TNC Choptanc Maryland N AD 2 Drawer’s Creek Delaware N F 1,2 Occupacia Creek Virginia N F 2 Marsh Lake Indiana N E 1,2 Pipewort Pond Indiana N AB 1 Marenisco Michigan N E 1 Seminary Fen Minnesota N S 1 Savage Fen Minnesota N E 1 Medicine Lake NWR, site 1 Montana N E 1,2 Medicine Lake NWR, site 2 Montana N E 1 Sun Lakes Park Washington N D 1,2 Ellensburg Washington N A 1,2 Astoria Oregon N E 1,2 Moncton New Brunswick I M 1,2 New Haven Connecticut I M 1,2 Robert Moses State Park New York I M 1,2 Athens New York I M 2 Galeville New York I M 1,2 Ithaca New York I M 1,2 Deer Creek at Lake Ontario New York I M 2 TNC Choptanc Maryland I M 2 Peoria Illinois I M 2 Novato California I M 1 Fish Access Washington I M 1,2 Moses Lake Washington I M 2

9
every leaf labeled after the initiation of the study, we recorded date of emergence,
date of death, and subsequently calculated life span.
To account for the effects of herbivory on measured plant traits, attack by
specialist gall flies, Lipara spp. and a generalist aphid, Hyalopterus pruni, on each
stem was recorded. Gall fly damage is recognizable by cessation of stem growth and a
thickened and wrapped apex (L. rufitarsis) or wrapped dead apical leaves (L. similis)
but we did not distinguish between the Lipara species. The total number of native and
Type M P. australis stems galled at the end of the growing season was noted. To
quantify the intensity of aphid attack at the leaf level, we recorded aphid densities as
percent cover of leaves, according to six categories: 0 = 0%, 1 < 1%, 2 =1-10%, 3 =
11- 25%, 4 = 26-50%, 5 = 51-75%, and 6 = 76%-100%.
Analyses
Since the experimental design differed between venues and years, all statistical
analyses were performed separately for REM 2003, REM 2004 and MNWR. To
determine if Type M P. australis benefits from early emergence, we compared mean
number of leaves initiated per stem by the first date of monitoring in the garden and
field site in 2003. Because we started earlier in 2004, we were able to compare timing
of first leaf production between native and nonnative stems that year. We also
compared leaf life span to see how long stems remained photosynthetically active. To
test the influence of plant and insect-mediated effects on leaf life span, we employed a
mixed linear model, with stem as our random variable. Specifically, we tested the
main effects of continent of status (native or introduced), leaf position (vertical), stem
galling and aphid attack on leaf life span. Vertical position of the leaf was determined
by numbering leaves starting at the base consecutively up the stem. We included
position of the leaf in the model because vertical age structure in plants whose leaves
10
grow successionally (from base to tip) has been shown to influence carbon gain
(Hirose and Werger 1987). Aphid attack was consolidated into two categories: low (0
- 10%) and higher (10-100%).
The following interaction terms were also included: Aphid X Status, Gall X
Status, Aphid X Gall, Status X Position, Position X Gall, and Status X Position X
Gall. The Aphid X Status and Gall X Status terms allowed us to determine whether
herbivores affected life span of native and introduced leaves equally. We also included
Aphid X Gall to investigate a potential cumulative impact of the herbivores. Visual
inspection of the data revealed a strong interaction between status and position on leaf
life span. The interaction terms Position X Gall and Status X Position X Gall were
included to investigate whether native and/or introduced stems compensate for the
reduced number of leaves that resulted from galling.
A full factorial, repeated measures ANOVA was conducted to test the
influence of status and galling on stem height through the growing season. To
qualitatively compare temporal patterns in leaf phenology, the average cumulative
proportion of leaves emerged and senesced per plant for each monitoring date was
calculated. The frequency and intensity of herbivory by gall flies and aphids on native
and introduced haplotype stems were compared.
Results
Leaf phenology and stem growth
Consistent between years and study sites, temporal patterns of leaf emergence were
similar between native and Type M P. australis stems (Fig. 1.1). Average timing of
leaf initiation, solely measured in the garden in 2004, was significantly earlier (t20 =
2.928, p = 0.0083) for Type M P. australis but only by about three days (mean julian

11
date for nonnative and native, respectively: 127.91 and 131.73). The small
discrepancy in emergence time unlikely imparts a resource advantage; especially since
there was no difference in average number of leaves emerged (Garden: native = 4.86,
Type M = 5.00, t 45 = -0.1525, P = 0.88; Field: native = 2.04, Type M = 2.16, t 89 =
0.5791, P = 0.56). Thereafter, overall leaf production was synchronous through the
growing season, except in the field where Type M haplotype stems continued to
produce leaves after native stems had ceased to do so (Fig. 1.1).
A prolonged period of photosynthetic activity was observed in the garden but not in
the field. In the garden, leaves of Type M P. australis stems lived significantly longer
– over a month – than those growing on native stems (native v. Type M: 2003 = 59.93
v. 85.5 days; 2004 = 52.29 v. 87.39 days, Fig. 1.1; Table 1.2). In contrast, rates of leaf
death in the field for native and Type M P. australis stems were similar (Fig. 1.1).
Since leaf emergence did not differ among experiments, leaf life span paralleled
senescence patterns. The opposite was observed in the field where native leaves lived
on average 9.6 days longer than Type M haplotype leaves and where no significant
effect of status was found on leaf life span (Table 1.2). Irregardless of status, leaf life
span depended on vertical leaf position (Table 1.2). Phragmites leaves positioned
midway on the stem lived longer than those found at the top or base (Fig. 1.2). Across
venue, leaves in the upper canopy of Type M haplotype stems lived significantly
longer than similarly placed leaves on native P. australis stems (significant Position X
Status effect, Table 1.2). Leaves positioned on the lower half of native P. australis
stems lived longer (field site) or as long (common garden) as similarly positioned
leaves on stems of Type M haplotypes (Fig.1.2).

12
0.0
0.2
0.4
0.6
0.8
1.0Garden '03 Garden '04 Field '03
J J A S O N D0.0
0.2
0.4
0.6
0.8
1.0
Galled
M J J A S O N D
Galled
J J A S O N D
Galled
Cum
ulat
ive
Prop
ortio
n
Calendar Months Figure 1.1. Leaf production (open symbols) and senescence (filled symbols) on native (circles) and introduced (triangles) Phragmites australis stems (cumulative proportion, separated by galled and ungalled stems) in the common garden (2003, 2004) and in the field (2003). Data represent means. Standard error bars were excluded for clear display of trends. Table 1.2. Effects of status (native or nonnative), aphid herbivory (low v. med to high), vertical position, and stem galling on Phragmites australis leaf life span as tested with mixed linear regression, treating stem as a random variable and position 2nd order.
Garden 2003 Garden 2004 Field 2003 Parameter F P F P F P Status 16.84 0.0002 6.4912 0.0197 3.43 0.0677 Aphid 0.1994 0.6555 0.0044 0.9474 0.644 0.4223 Position2 29.1688 <0.0001 9.5161 0.0001 20.759 <0.0001 Gall 0.6674 0.4188 0.0001 0.9924 0.000476 0.6372 A x S 5.1768 0.0235 3.2981 0.0704 2.089 0.1486 A x G 0.2076 0.6489 3.8030 0.0521 0.00004 0.9948 S x G 0.0631 0.8030 0.0754 0.7866 0.2389 0.6251 S x P 11.8538 <0.0001 14.0151 <0.0001 4.659 0.0097 G x P 16.2584 <0.0001 22.7782 <0.0001 .1774 0.8375 S x P x G -- 1 -- 1 7.1663 0.0009 1.502 0.2230 A x G x S -- 1 -- 1 0.4929 0.4832 2.556 0.1102
1 3-way interactions were not run in the model due to inadequate sample size for specific combinations.

13
0 25 50 75 100
125
150
3456789
1011121314151617
0 25 50 75 100
125
150
3456789
1011121314151617
0 25 50 75 100
125
150
3456789
1011121314151617
0 25 50 75 100
125
150
3456789
1011121314151617
0 25 50 75 100
125
150
3456789
1011121314151617
0 25 50 75 100
125
150
3456789
1011121314151617
Garden 2004
Garden 2003
Field 2003
Leaf life span (days)
Galled
Galled
Galled
Ver
tical
pos
ition
Figure 1.2. Leaf life span of galled and ungalled stems of native and introduced Phragmites australis at different vertical positions in the common garden (2003, 2004) and at Montezuma NWR (2003). Weighted means +/- 95% confidence interval are provided for leaves positioned from 3 to 17 since small sample size at the extreme positions resulted in extremely high variation at all study sites.

14
Stem heights between haplotypes were similar in the garden but not in the
field, where Type M haplotype grew significantly taller (Fig.1.3). Plants grown in the
common garden were on average shorter than those growing under natural conditions
in the field.
0
50
100
150
200
250
28 A
pr
28 M
ay
27 Ju
n27
Jul
26 A
ug
25 Sep
Stem
ht (
cm)
Figure 1.3. Stem growth (cm) of native (open circles) and introduced (filled triangles) Phragmites australis haplotypes in the common garden (2003 grey solid line, 2004 black solid line) and field site (hatched line). Data are means ± 1SE.
Natural enemies and plant measurements
Herbivory by specialist gall-forming Lipara spp. strongly influenced stem height and
leaf production of both native and Type M haplotypes (significant Gall and non-
significant Gall X Status effects, Tables 1.3, 1.4; Figs. 1.1, 1.4). These effects were
consistent across venue and year except for 2003 stem growth in the garden, where
galling had no main effect on height and reduced leaf production for the Type M
haplotype only (Tables 1.3, 1.4; Fig. 1.4). Reasons for this annual effect in the garden

15
are unknown; however, possible causes include an improved ability to identify gall
formation in the second year, population fluctuations of Lipara spp. within the garden,
as well as within-population variation of response to Lipara spp. attack. While
proportion of galled stems did not differ in the common garden (2003: Fisher’s, p =
0.063; 2004: Fisher’s, p = 1; Fig. 1.5), a significantly greater proportion of native P.
australis stems suffered Lipara spp. damage in the field (Fisher’s, p = 0; Fig. 1.4).
Table 1.3. Results of repeated measures ANOVA testing the effects of status (native or nonnative) and gall formation on Phragmites australis stem height in the common garden and in the field through the growing season.
Garden 2003 Garden 2004 Field 2003
Effect SS df F SS df F SS df F Status 760000 1 3.46 5207 1 0.5 289000 1 2.2 Gall 1836 1 0.08 177000 1 18*** 250000 1 18.9*** S x G 368000 1 1.68 3898 1 0.4 2745 1 0.2 Time 89100 12 53.99*** 325000 19 497.6*** 185000 11 152.0***
T x S 2811 12 1.70 6033 19 9.2*** 4673 11 3.8*** T x G 36900 12 22.36*** 444000 19 68.0*** 339000 11 27.9*** T x S x G 717 12 0.43 7607 19 11.6*** 1852 11 1.5
*, **, ***, Effect significant at P < 0.05, 0.01, and 0.001, respectively.
Galling reduced stem height irrespective of haplotype, and the higher attack of native
stems resulted in the observed height discrepancies between native and nonnative P.
australis stems in the field (no significant Status effects on height, Table 1.3).
Ungalled stems of both haplotyes grew taller than galled stems (significant Gall X
Time effects, Table 1.2). Lipara spp. indirectly altered vertical leaf age structure.
Across venues, Lipara spp. did not change seasonal patterns of leaf emergence nor
senescence (Fig. 1.1). Additionally, this specialist herbivore did not affect overall leaf
life span (significant Gall X Status term, Table 1.2). Although not statistically

16
0
5
10
15
20
25
Garden '03 Garden '04 Field '03
Num
ber l
eave
s pe
r ste
ms
NativeNat & GallIntroducedIntro & Gall
Figure 1.4. Number of leaves (means ± 2SE) on galled and ungalled stems of native and introduced Phragmites australis in the common garden (2003, 2004) and at Montezuma NWR (2003). Table 1.4. Results of two-way ANOVA testing the effects of status (native or nonnative) and gall formation on total leaf number per Phragmites australis stem in the common garden and in the field.
Garden 2003 Garden 2004 Field 2003 Effect SS F SS F SS F
Status 0.14 0.019 20.63 2.70 1.63 0.45 Gall 162.68 22.05*** 131.03 17.17*** 814.81 224.88*** S x G 35.27 4.78* 0.47 0.061 0.66 0.18
*, **, ***, Effect significant at P < 0.05, 0.01, and 0.001, respectively.

17
0.0
0.2
0.4
0.6
0.8
1.0
Garden '03 Garden '04 Field '03
Prop
ortio
n st
ems *
n=22 n=24 n=11 n=11 n=48 n=52
Figure 1.5. Apical attack (proportion of stems attacked) by Lipara spp. gall flies on stems of native (white) and introduced (grey) Phragmites australis haplotypes in the common garden (2003, 2004) and at Montezuma NWR (2003). The * indicates a significant difference in stem galling between haplotypes (Fisher’s, p = 0).
significant in the field, there was a consistent trend for stems stunted by galling to
retain already-emerged leaves longer, causing leaves positioned lower on the stem to
live longer (Fig. 1.2; Table 1.2, significant Gall X Position in garden). This response
was especially pronounced for Type M haplotype stems in 2004 (highly significant
Status X Position X Gall effect, Table 1.2; Fig. 1.2).
Hyalopterus pruni reached higher densities more frequently on leaves of native
haplotypes in both the common garden and field (Garden ‘03: Χ2 = 90.758, df = 6, p =
0; Garden ‘04: X2= 64.77, df = 6, p = 0; Field: X2 = 159.469, df = 6, p = 0; Fig. 1.6).
However, there was no measurable effect of aphid herbivory on leaf life span (Table
1.2). Even though significant Aphid X Status and Aphid X Gall interactions were
found on leaf life span in the garden, we attribute these results to a lack of higher
aphid densities on Type M P. australis leaves and resulting inadequate sample sizes
for higher aphid and Type M combinations.

18
Figure 1.6. Frequency of aphid densities (% leaf cover, in categories) on leaves of native (solid line) and introduced (dashed line) Phragmites australis stems in the common garden (2003 and 2004) and in the field (2003).
Discussion
We found mixed support for prolonged growing period and increased stem height in
nonnative P. australis, with results influenced by interactions with herbivores and
venue. In the common garden, a one month delay in leaf senescence provides strong
evidence that a prolonged period of photosynthetic activity contributes to the invasive
success of Type M P. australis (Fig. 1.1). In their study of invasive Bunias orientalis
L. in central Europe, Zotz et al. (2000) demonstrated empirically that delayed
senescence relative to native plants can result in high carbon gains even late in the
year. Longer leaf life spans can also translate into increased root production and, as a
Field 2003
01020304050
0 <1 1-10 11-25
26-50
56-75
75<
max % leaf area attacked
Garden 2004
0
10
20
30
40
50
Field 2003
01020304050
0 <1 1-10 11-25 26-50 56-75 75<
max % leaf area attacked
% l
eaf c
over

19
result, increased stress tolerance (West et al. 2003). In light of the fact that two thirds
of P. australis biomass resides in rhizomes (Szczepansky 1969, Haslam 1972b), a
period of extended resource capture may be central to supporting extensive below
ground structures, which in turn have been attributed to this invader’s relatively high
tolerance to suboptimal environments (Bart and Hartman 2000) and rapid vegetative
spread (Tewksbury et al. 2002).
Despite the consistent pattern of senescence over two years in the garden, we
did not observe an extended growing season for Type M P. australis in the field.
Although herbivory rates differed between venues, neither H. pruni or Lipara spp.
affected leaf phenology patterns. Latitude of source populations, applicable only to
the common garden, has been shown to affect plant growth, but was also ruled out as a
confounding factor since the phenology patterns were consistent when comparing
populations within states (Park, unpublished). Given that senescence patterns similar
to those in the common garden have been observed in other field populations, we
hypothesize that the discrepancy in venue is a result of natural variation among
populations for leaf longevity. However, these results highlight the need for future
research to include multiple field sites even when combined with a common garden
experiment.
Differences in age structure of leaves at the stem level provides initial evidence
that Type M P. australis may be better equipped to compete in communities with a
dense canopy than native haplotypes. Consistent with models of optimum carbon
gain, leaves of nonnative P. australis were relatively short-lived in the shaded reaches
of the lower canopy and longer-lived in the upper canopy where light resources were
maximal (Mooney et al. 1981, Hirose and Werger 1987). However, whether this
observed pattern increases the rate of photosynthetic activity and Type M’s ability for
greater carbon gain at both the stem and clone level needs experimental confirmation.
By prohibiting stems from reallocating resources upwards, it seems that Lipara spp.

20
would inhibit efficient modes of carbon gain by Type M P. australis. Considering
Lipara spp. caused stems to retain leaves in the lower canopy longer for both native
and nonnative stems, follow up study of P. australis leaf dynamics should account for
the indirect influence of stem-gallers. Similar to a longer period of resource capture,
efficient resource capture would contribute to Type M haplotype’s support of
increased production.
As predicted, Type M P. australis stems grew taller than native stems in the
field; however, the increased height was not a pre-adapted plant trait, but rather
mediated by a specialist gall fly. The lack of height difference in the garden where
galls occurred equally on native and nonnative stems confirms these results. These
findings illustrate that naive conclusion about plant traits may be made if interactions
with important herbivores are not considered. They also provide preliminary evidence
that a top-down control may facilitate displacement of native P. australis haplotypes
by the Type M haplotype.
That stems in general were shorter in the common garden than in the field
illustrate the dependency of plant growth on environmental conditions and resource
availability. As a result, height discrepancies commonly cited in the field may reflect
variation in physiological responses of native and nonnative haplotypes to their
environment (i.e. stressors or resources) or may reflect microhabitat variation within a
site (Vasquez et al. 2005). Such variation would not be expressed in the common
garden nor at our field site, since both were designed/selected to have similar abiotic
conditions. It appears that stem height alone is not an appropriate surrogate of
productivity for a clonal, rhizomatous plant like P. australis, known to suffer from
apical herbivory.
The fact that introduced herbivores were responsible for the increased attack
on native haplotypes is a twist on the enemy release hypothesis (ERH). ERH predicts
that Type M P. australis will host fewer specialist herbivores in its introduced range
21
than in its native range (Keane and Crawley 2002, Mitchell and Power 2003, Torchin
et al. 2003), and suffer less herbivory than the native flora of the invaded community
because specialists of native species will not host-shift in sufficient frequency to make
up for the lost specialists (Schierenbeck et al. 1994, Siemann and Rogers 2003).
Type M P. australis in NA has certainly escaped many of its co-evolved European
herbivores (Tewksbury et al. 2002), but the increased herbivore attack we observed on
native P. australis americanus was caused by two introduced herbivores. Colautti et
al. (2004) coined this inversion of ERH the ‘enemy of my enemy’ hypothesis (EEH).
In this case, native haplotypes “naïve” to introduced herbivores appear to be more
susceptible to the introduced specialists, whereas Type M’s evolutionary history with
introduced Lipara spp. has likely shaped this invader’s ability to tolerate or develop
increased resistance to the specialist gall-makers. Reasons for greater aphid herbivory
on native P. australis leaves are unknown; however, H. pruni is known to respond to
color (Moericke 1969) and plant tissue quality (Minks and Harrewijn 1986).
Irregardless of cause, herbivores may influence competitive interactions between
native and nonnative P. australis haplotypes; however, the advantages gained from
enemy release alone probably do not explain Type M’s general invasive success in NA
(Colautti et al. 2004).
Our study focused on two herbivores and two stem traits, which is by no
means exhaustive in understanding the mechanisms behind P. australis’ competitive
superiority. Considering rhizomes are important in Type M P. australis spread and
establishment into “hostile” environments (Bart and Hartman 2000) and comprise a
large part of this species’ biomass (Szczepansky 1969, Haslam 1972b), future efforts
to better understand what makes P. australis a successful invader should include a
similar comparison of belowground traits, where phylogeny and environmental factors
are also controlled.

22
Plants respond to and shape the biotic community in which they exist.
Significant gall fly effects on both leaf life span and stem height0 reinforce that plant
invaders do not thrive in a vacuum. Their growth and fitness are at once determined
by genetically-based plant traits and exterior forces such as natural enemies. Further,
the dynamic between endogenous and external factors is not unidirectional. For
example, just as Lipara spp. herbivory stunted stem growth, unknown trait-mediated
differences between native and introduced haplotypes resulted in higher rates of gall
formation on native stems. Hypotheses such as enemy release, EICA, novel weapons,
biotic resistance, as well as predictive models of invasion based solely on plant traits,
have provided helpful mechanistic frameworks to address why some plants are
invasive while others are not. However, each hypothesis alone fails to acknowledge
the complex and dynamic interactions that direct the success or failure of plant
introductions. Not until we integrate a holistic perspective on invasive success will
our predictive abilities move beyond the individual case to the general.
23
References
Agrawal, A. A., and P. M. Kotanen. 2003. Herbivores and the success of exotic plants:
a phylogenetically controlled experiment. Ecology Letters 6:712-715.
Bart, D., and J. M. Hartman. 2000. Environmental determinants of Phragmites australis expansion in a New Jersey salt marsh: an experimental approach. Oikos 89:59-69.
Bazzaz, F. A. 1986. Life history of colonizing plants: some demographic, genetic and physiological features. Pages 96-110 in J. A. Drake, editor. Ecology of Biological Invasions of North America and Hawaii. Springer, New York.
Bazzaz, F. A., and D. C. Hartnett. 1984. Leaf demography and plant-insect interactions: Goldenrods and phloem-feeding aphids. The American Naturalist 124:137-142.
Blossey, B. 2003. Morphological differences between native North American Phragmites australis genotypes and introduced invasive European genotypes. in S. Y. Litvin, editor. Phragmites australis: a sheep in wolf's clothing? New Jersey Marine Science Consortium, 6-9 Jan 2002, Vineland, NJ, USA.
Blossey, B., and R. Notzold. 1995. Evolution of increased competitive ability in invasive nonindigenous plants: a hypothesis. Journal of Ecology 83:887-889.
Burns, J. H. 2004. A comparison of invasive and non-invasive dayflowers (Commelinaceae) across experimental nutrient and water gradients. Diversity and Distributions 10:387-397.
Callaway, R. M., and W. M. Ridenour. 2004. Novel weapons: invasive success and the evolution of increased competitive ability. Frontiers in Ecology and the Environment 2:436-443.
Case, T. J. 1990. Invasion resistance arises in strongly interacting species-rich model competition communities. Proceedings of the National Academy of Science 87:9610-9614.

24
Chikoye, D., L. A. Hunt, and C. J. Swanton. 1996. Simulation of competition for photosynthetically active radiation between common ragweed (Ambrosia artemisiifolia) and dry bean (Phaseolus vulgaris). Weed Science 44:545-554.
Chvala, M., J. Doskocil, J. H. Mook, and V. Pokorny. 1974. The genus Lipara meigen (Diptera, Chloropidae) systematica, morphology, behaviour and ecology. Tijdschrift voor Entomologie 117:1-25.
Colautti, R. I., A. Ricciardi, I. A. Grigorovich, and H. J. MacIsaac. 2004. Is invasion success explained by the enemy release hypothesis? Ecology Letters 7:721-733.
Crawley, M. J. 1987. What makes a community invasible? Pages 429-453 in M. J. C. A.J. Gray, P.J. Edwards, editor. Colonization, succession and stability. Blackwell Scientific, Oxford.
DeWalt, S. J., J. S. Denslow, and K. Ickes. 2004. Natural-enemy release facilitates habitat expansion of the invasive tropical shrub Clidemia Hirta. Ecology 85:471-483.
Fox, J. 1984. A comparison of two climbing plant species (one native and one exotic) at Woodman Point, Western Australia. The Western Australian Naturalist 16:11-15.
Gaudet, C. L., and P. A. Keddy. 1988. A comparative approach to predicting competitive ability from plant traits. Nature 334:242-243.
Haslam, S. M. 1958. Biological Flora of the British Isles: Phragmites communis Trin. List Br. Vasc. Pl. 665:585-607.
Haslam, S. M. 1971. Community regulation in Phragmites communis Trin. II. Mixed stands. Journal of Ecology 59:75-88.
Haslam, S. M. 1972a. Biological flora of the British Isles, no.128. Phragmites communis Trin. Journal of Ecology 60:585-610.
Haslam, S. M. 1972b. The Reed ('Norfolk Reed'), Norfolk, UK.

25
Hirose, T., and M. J. A. Werger. 1987. Maximizing daily canopy photosythesis with respect to the leaf nitrogen allocation pattern in the canopy. Oecologia 72:520-526.
Hulbert, L. C. 1955. Ecological studies of Bromus tectorum and other annual bromegrasses. Ecological Monographs 25:181-213.
Keane, R. M., and M. J. Crawley. 2002. Exotic plant invasions and the enemy release hypothesis. Trends in ecology and evolution 17:164-170.
Kennedy, T. A., S. Naeem, K. M. Howe, J. M. H. Knops, D. Tilman, and P. B. Reich. 2002. Biodiversity as a barrier to ecological invasion. Nature 417:636-638.
Lortie, C. J., R. W. Brooker, P. Choler, Z. Kikvidze, R. Michalet, F. I. Pugnaire, and R. M. Callaway. 2004. Rethinking plant community theory. Oikos 107:433-438.
Marks, M., B. Lapin, and J. Randall. 1994. Phragmites australis (P. communis): Threats, management and monitoring. Natural Areas Journal 14:285-294.
McKell, C. M., J. P. Robison, and J. Major. 1962. Ecotypic variation in Medusahead, an introduced annual grass. Ecology 43:686-698.
Minks, A. K., and P. Harrewijn, editors. 1986. Aphids: their biology, natural enemies and control. Elsevier, New York.
Mitchell, C. E., and A. G. Power. 2003. Release of invasive plants from fungal and viral pathogens. Nature 421:625-627.
Moericke, V. 1969. Hostplant specific colour behaviour of Hyalopterus pruni (Aphididae). Entomologia, experimentalis et applicata 12:524-534.
Mook, J. H., and J. Wiegers. 1999. Distribution of the aphid Hyalopterus pruni Geoffr. within and between habitats of common reed Phragmites australis (Cav.) Trin. ex Steudel as a result of migration and population growth. Limnologica 29:64-70.

26
Mooney, H. A., C. Field, S. L. Gulmon, and F. A. Bazzaz. 1981. Photosynthetic capacity in relation to leaf position in desert versus old-field annuals. Oecologia 50:109-112.
Prati, D., and O. Bossdorf. 2004. Allelopathic inhibition of germination by Alliaria petiolata (Brassicaceae). American Journal of Botany 91:285-288.
Rejmanek, M. 2000. Invasive plants: approaches and predictions. Austral Ecology 25:497-506.
Saltonstall, K. 2002. Cryptic invasion by a non-native genotype of the common reed, Phragmites australis, into North America. PNAS 99:2445-2449.
Saltonstall, K., P. M. Peterson, and R. J. Soreng. 2004. Recognition of Phragmites australis subsp. Americanus (Poaceae:Arundinoideae) in North America: evidence from morphological and genetic analyses. SIDA Contributions to Botany 21:683-692.
Sax, D. F., and J. H. Brown. 2000. The paradox of invasion. Global Ecology and Biogeography 9:363-371.
Schierenbeck, K. A., R. N. Mack, and R. R. Sharitz. 1994. Effects of herbivory on growth and biomass allocation in native and introduced species of Lonicera. Ecology 75:1661-1672.
Siemann, E., and W. E. Rogers. 2003. Herbivory, disease, recruitment limitation, and success of alien and native tree species. Ecology 84:1489-1505.
Szczepansky, A. 1969. Biomass of underground parts of the reed Phragmites communis Trin. Bull. Acad. Pol. Sci. Ser. Sci. Biol. 17:245-246.
Tewksbury, L., R. Casagrande, B. Blossey, P. Hafliger, and M. Schwarzlander. 2002. Potential for biological control of Phragmites australis in North America. Biological Control 23:191-212.
Torchin, M. E., K. D. Lafferty, A. P. Dobson, V. J. Mckenzie, and A. M. Kuris. 2003. Introduced species and their missing parasites. Nature 421:628-630.

27
Trowbridge, C. D. 1996. Introduced versus native subspecies of Codium fragile:how distinctive is the invasive subspecies tomentosoides? Marine Biology 126:193-204.
Tscharntke, T. 1999. Insects on common reed (Phragmites australis): community structure and the impact of herbivory on shoot growth. Aquatic Botany 64:399-410.
Vasquez, E. A., E. P. Glenn, J. J. Brown, G. R. Guntenspergen, and S. G. Nelson. 2005. Salt tolerance underlies the cryptic invasion of North American salt marshes by an introduced haplotype of the common reed Phragmites australis (Poaceae). Marine Ecology Progress Series 298:1-8.
West, J. B., J. F. Espeleta, and L. A. Donovan. 2003. Root longevity and phenology differences between two co-occuring savanna bunchgrasses with different leaf habitats. Functional Ecology 17:20-28.
Zotz, G., M. Franke, and M. Woitke. 2000. Leaf phenology and seasonal carbon gain in the invasive plant, Bunias orientalis L. Plant biology 2:653-658.
28
CHAPTER TWO
Decomposition dynamics and invertebrate diversity of six wetland macrophytes
in a New York freshwater marsh
Abstract
As a major source of senesced plant material, emergent macrophytes influence
wetland litter processing and decomposer food webs, both critical factors shaping
nutrient cycling and total energy budgets. The influence of macrophytes on these
wetland functions may be largely determined by the nitrogen content of the plant
tissue, with high nitrogen tissues decomposing more readily due to their high
palatability to decomposer microbes and invertebrates. Since plant species commonly
vary in tissue quality, shifts in plant dominance within a wetland are likely to alter
wetland function. To study the consequences of changing plant dominance, we
compared litter mass loss and litter invertebrate richness and abundance in litter bags
exposed to a central New York wetland. We used six common wetland plant species:
Typha latifolia L. (broad leafed cattail, Typhacea), T. angustifolia L. (narrow leafed
cattail), Phragmites australis (cav.) Trin ex. Steudel (common reed, Poaceae), P.
australis subspecies americanus Saltonstall, P.M. Peterson & Soreng, Lythrum
salicaria L. (purple loosestrife, Lythraceae), and Phalaris arundinacea L. (reed
canarygrass, Poaceae). After nine months, significant species effects on mass loss,
invertebrate richness and total density were observed. Most plant species supported
significantly different rates of decay, while plant species effects on invertebrate
communities were season and species-specific. Plant tissue nitrogen content differed
significantly among plant species but did not predict mass loss patterns or invertebrate
response. A combination of quality and quantity of litter resources, influenced by the
morphology and quality of specific plant organs, may be a better predictor for species

29
effects on wetland biota and mass loss. Potential shifts in plant dominance among the
six wetland macrophytes investigated can alter wetland function, by changing
decomposition rates and the invertebrate community, an important prey-base for
higher trophic levels in wetlands.
Introduction
Primary producers provide the basic “currency” for functioning of ecosystems. In
freshwater wetlands, emergent macrophytes shape the physical environment and fuel
most wetland food webs (Mitsch and Gosselink 1993, Kuehn et al. 2000). A small
fraction of this macrophyte-derived energy enters wetlands through direct
consumption of green leaf material by herbivores and omnivores. Most energy,
rather, is released after plants have senesced through the microbial conditioning of
dead plant tissues during the process of decomposition (Mitsch and Gosselink 1993,
Moore et al. 2005). Microbial decomposers are consumed by invertebrates, which
subsequently form the prey base for higher trophic levels. Decomposition of plant
detritus is also critical for nutrient cycling as decomposers convert organic nutrients
into inorganic forms useable by living plants (Naeem et al. 2000).
Decomposition rates and, thus, rates of nutrient and energy inputs, are largely
controlled by the quality of the plant litter resource (reviews: Swift et al. 1979;
Anderson et al. 1991). Generally, plant tissues with high concentrations of nitrogen
(N) are preferentially colonized by microbes and invertebrate detritivores, resulting in
relatively rapid decay (Melillo et al. 1982). Growth form and the allocation of
nitrogen among plant organs also seems to affect decomposition patterns (Hobbie
1996). Tissue quality and physical structure have been shown to influence
decomposition rates and biotic communities at multiple levels of plant taxonomy:
plant type (Cornellissen 1996, 2004), species (Findlay and Arsuffi 1989, Hobbie 1992,

30
1996, Dudgeon and Wu 1999, Bailey et al. 2001), and even genotype (Driebe and
Whitham 2000, Whitham et al. 2003, Schweitzer et al. 2005). Considering that tissue
quality and physical form vary widely among plant species, shifts in plant community
composition, especially shifts in plant dominance, may produce changes that
reverberate through the entire ecosystem.
Both natural and human-induced environmental changes alter plant
communities within freshwater wetlands; however, little is known about the
consequences of such shifts on wetland function and biota. While litter N content
provides a framework in which to predict directional changes in litter dynamics and
decomposer communities, other factors, such as the physical structural traits of plants,
also will play a role. Consequently, impacts of species-specific shifts in plant
dominance remain unpredictable (Aertz 1997). Additionally, much of what is known
about litter effects on ecosystem function comes from terrestrial and stream studies;
much less is known about litter processing in wetlands.
To better understand the structuring forces of plant species in detrital systems
of freshwater wetlands, we investigated the impacts of a suite of dominant wetland
macrophytes on two ecosystem processes: decomposition and biodiversity. In a
central New York wetland, we tested the following hypotheses: 1) plant species
provide varying litter resources in terms of their tissue quality (i.e. N content), and 2)
litter mass loss as well as invertebrate richness and abundance will increase with
increasing N content. Macrophytes are important drivers of wetland processes, and
shifts in the resident flora are expected to have extended effects on ecosystem
processes.
31
Methods
Study plants
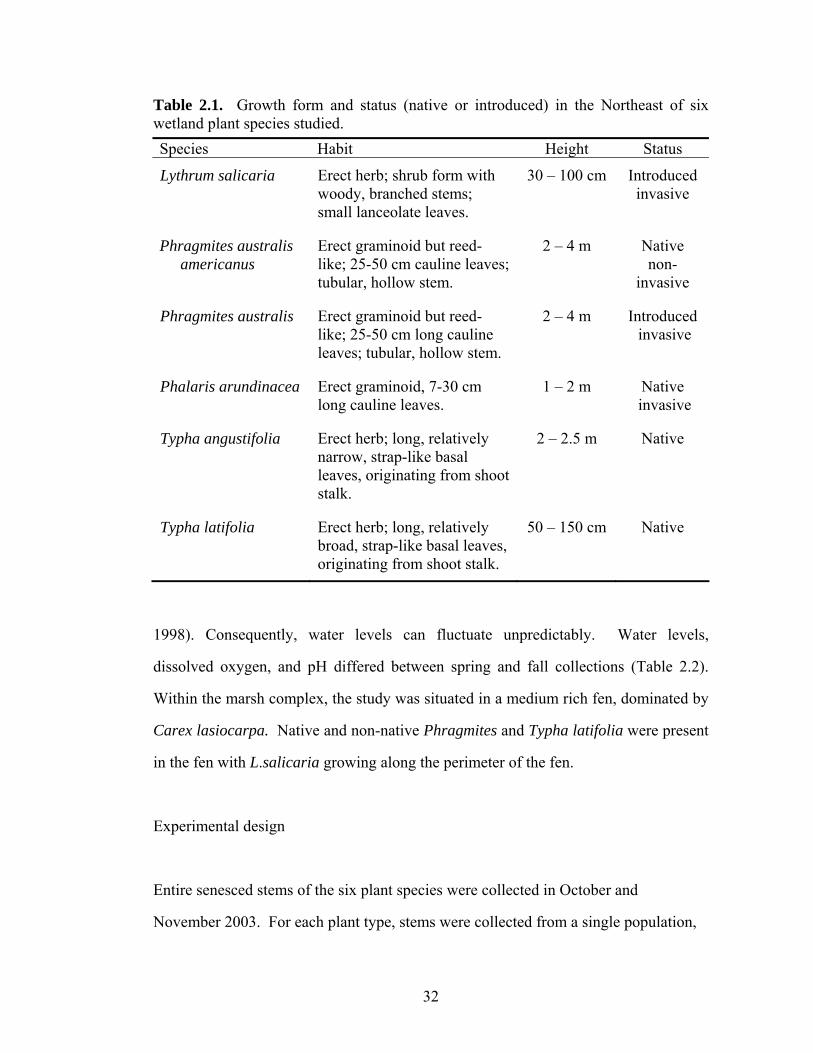
Typha latifolia L. (Broad leafed cattail, Typhacea), T. angustifolia L. (narrow leafed
cattail), Phragmites australis (cav.) Trin ex. Steudel (Common reed, Poaceae),
Lythrum salicaria L. (Purple loosestrife, Lythraceae), and Phalaris arundinacea L.
(Reed canarygrass, Poaceae) are common perennial macrophytes of northeastern
freshwater wetlands. They represent multiple plant forms (herbaceous, graminoid)
with differing leaf and stem morphologies and include both native and nonnative
species (Table 2.1). Typha angustifolia has recently invaded the Midwest and West
Coast; however, its status on the East Coast is less clear. Similarly, P. arundinacea’s
current native status in the Northeast is under question due to its invasive nature,
notably, in wetlands of the Midwest. Phragmites australis and L. salicaria are
established exotic invasive plants that displace native flora, including T. latifolia and
native P. australis subspecies americanus Saltonstall, P.M. Peterson & Soreng.
Although less common than our other study plants, the native Phragmites subspecies
was included as it was once more abundant in the Northeast but has been replaced by
the introduced genotype and continues to be threatened by such replacement
(Saltonstall 2002).
Site
The study site was located at Deer Creek Marsh in Oswego County, NY, a relatively
undisturbed freshwater wetland located on the East Shore of Lake Ontario (N43º 35.
494, W76º 11.787). The hydroperiod of the marsh is regulated by the building and
breaching of a sand barrier where Deer Creek empties into Lake Ontario (Bailey
32
Table 2.1. Growth form and status (native or introduced) in the Northeast of six wetland plant species studied.
1998). Consequently, water levels can fluctuate unpredictably. Water levels,
dissolved oxygen, and pH differed between spring and fall collections (Table 2.2).
Within the marsh complex, the study was situated in a medium rich fen, dominated by
Carex lasiocarpa. Native and non-native Phragmites and Typha latifolia were present
in the fen with L.salicaria growing along the perimeter of the fen.
Experimental design
Entire senesced stems of the six plant species were collected in October and
November 2003. For each plant type, stems were collected from a single population,
Species Habit Height Status
Lythrum salicaria Erect herb; shrub form with woody, branched stems; small lanceolate leaves.
30 – 100 cm Introduced invasive
Phragmites australis americanus
Erect graminoid but reed-like; 25-50 cm cauline leaves; tubular, hollow stem.
2 – 4 m Native non-
invasive
Phragmites australis Erect graminoid but reed-like; 25-50 cm long cauline leaves; tubular, hollow stem.
2 – 4 m Introduced invasive
Phalaris arundinacea Erect graminoid, 7-30 cm long cauline leaves.
1 – 2 m Native invasive
Typha angustifolia Erect herb; long, relatively narrow, strap-like basal leaves, originating from shoot stalk.
2 – 2.5 m Native
Typha latifolia Erect herb; long, relatively broad, strap-like basal leaves, originating from shoot stalk.
50 – 150 cm Native

33
Table 2.2. Site characteristics at Deer Creek Marsh during spring (June) and fall (September) collections.
with L. salicaria, P. arundinacea, both Phragmites and T. angustifolia collected
within the Northern Montezuma Wetlands Complex (NMWC), Seneca Falls, NY.
Typha latifolia was collected at a site near Ithaca, NY, about 83 km away from
NMWC where identification could be confirmed by a regional expert (Robert
Wesley). Stems were air dried at room temperature for a minimum of two weeks.
Twenty-five 30 cm x 30 cm, individually-labeled plastic mesh bags (6 mm openings),
were filled with 100 g of stem and leaf material in their natural ratios. Five additional
100 g samples of each plant type were weighed and oven dried at 65 ºC to calibrate
oven dry mass placed in each bag. Standardized amounts of plant material within
litter bags were used in this study because the focus was on the effect of the plant
tissue character, per se, and not, for example, on a plant’s effect due to increased
relative biomass. Oven drying, however, revealed that both Typha litter bags
contained about 60% plant biomass as other litter types. A control treatment, plastic
drinking straws, was also included to measure invertebrate colonization of substrates
as habitat and not as a food source (Angradi et al. 2001).
To allow for natural conditioning of litter, bags were placed in the field on 15
December 2003. To control for possible bias in invertebrate use of the plant
treatments, the study was situated in a homogenous area of Deer Creek Marsh
dominated by Carex lasiocarpa, where none of the plants included in the litter
treatments were naturally found within the experimental grid. A total of 10 permanent
Measure Spring Fall Water depth (cm) 42.6 9.3 Temp (ºC) 28.3 17.6 pH 6.59 6.09 DO (mg/L) 3.45 1.53

34
stations were created every 5 m along two parallel transects spaced 10 m apart. We
placed two sets of seven litter bags at each station. Each set included one bag of each
litter treatment fanned in a randomized order. To prevent loss of bags, litter bags were
attached to a PVC stake with decoy cord and pinned flush to the marsh surface with
12-gauge galvanized wire. To account for materials that may have been lost in the
initial transport to the field, five additional sets of litter bags were placed in exactly the
same fashion adjacent to the grid but immediately collected the bags. This litter was
oven-dried at 65 ºC for 48 hrs and weighed. On 8 June and 29 September 2004, six
and nine months after placement in the field, we retrieved one of the paired sets of
litter bags from each of the 10 stations, respectively. Litter bags were quickly placed
in Ziploc bags and kept on ice for transport back to the lab.
Mass loss and invertebrate colonization
Within 24 hours of collection, invertebrates were rinsed from plant litter in a tub of
water, which was sieved through a minimum 250 µm screen mesh. Although not an
optimal extraction method, we refrained from using ethanol so that the litter could be
analyzed for %N and %C. Invertebrates that were probably most underestimated
include Nematoda, Acarina, and Collembola. Since we were interested in relative
numbers among litter types this likely did not affect our conclusions. Invertebrates
were stored in 70% ethanol, stained with Rose Bengal and subsequently hand-picked
from detritus, identified and counted, under a dissecting stereoscope at 10X
magnification. Most invertebrates were identified to family with the exception of a
few groups: Ostracoda, Copepoda, Nematoda, Hymenoptera, Lepidoptera, and
Odonata. Due to the time required to process samples, not all litter bags could be
examined for invertebrate colonization. At least 5 out of 10 bags per treatment and
collection time (spring or fall) were examined. These samples were paired by time,
35
meaning a treatment was processed for both spring and fall at a particular station.
After rinsing, remaining plant litter was oven dried at 65 ºC for, at least, 48 hrs,
weighed for mass loss, and subsequently analyzed for tissue quality.
Tissue quality
For all natural plant litter treatments, % N and %C (and C:N) were measured at three
time periods: zero (initial), and after six (spring) and nine (fall) months incubation in
the field. Five litter samples corresponding to bags processed for invertebrates as well
as five samples used to standardize weight lost during transport (initial) were analyzed
for %N and %C at the Cornell University Stable Isotope Lab, using a Carlo Erba
NC2500 elemental analyzer machine.
Analyses
Differences in initial tissue chemical quality (N, C:N) among plant species was tested
using one-way ANOVA. The effects of litter type, time and their interaction on
percentage mass remaining (mass loss) were tested with a mixed general linear model
(GLM) that included station as a random variable. This random term accounted for
spatial variability commonly observed in our field data.
Similar GLM’s were conducted on summary metrics of invertebrate abundance
and diversity: total density (individuals per 100 g) and taxa richness. The use of
density to describe abundance was most appropriate in our analyses due to low initial
oven-dry mass for both Typha species (about 50-60 g oven-dried instead of the
expected 100 g when measured as air-dried mass). To characterize the structure of the
colonizing invertebrate community, principal component analysis, which identifies
correlations among species, was employed. Additionally, individual GLM’s were

36
conducted on composite taxonomic groups of invertebrates to test for differences in
specific invertebrate response to the litter treatments over time; litter type X time
interactions and the random station effect were also included in the model. Models
were reduced to include only main effects if the interaction term was non-significant
with P > 0.1. Total and composite group invertebrate densities were log10 (x+1)
transformed to meet model assumptions of normality and homogeneity of residual
variation. In the event transformation did not work (i.e. Bivalves and Hirudinae),
logistic regression was first used to test for differences in the proportion of samples
where composite taxa were present among litter types. A GLM was then conducted
but only after samples that did not support the taxa in question were eliminated.
Following all regressions described above, all pair-wise comparisons were conducted
between plant species within a collection period and assessed for statistical
significance using Bonferroni-adjusted P values.
To test litter N content’s value as a predictor for mass loss and invertebrate
colonization patterns observed, %N was included in GLM’s used to analyze percent
mass remaining and invertebrate densities (total and composite group). In the event
that litter type was no longer significant with %N in the model, we concluded that
differences in %N drove discrepancies observed among treatments. All analyses were
performed using SAS software (SAS Institute Inc. 2004).
Results
Initial litter characteristics
Initial whole plant, leaf and stem %N and C:N were highly significantly different
between species (ANOVA, P <0.0001). Characteristic of rigid plant tissue, stems of
all species had lower N concentrations than did leaves, resulting in intermediate values
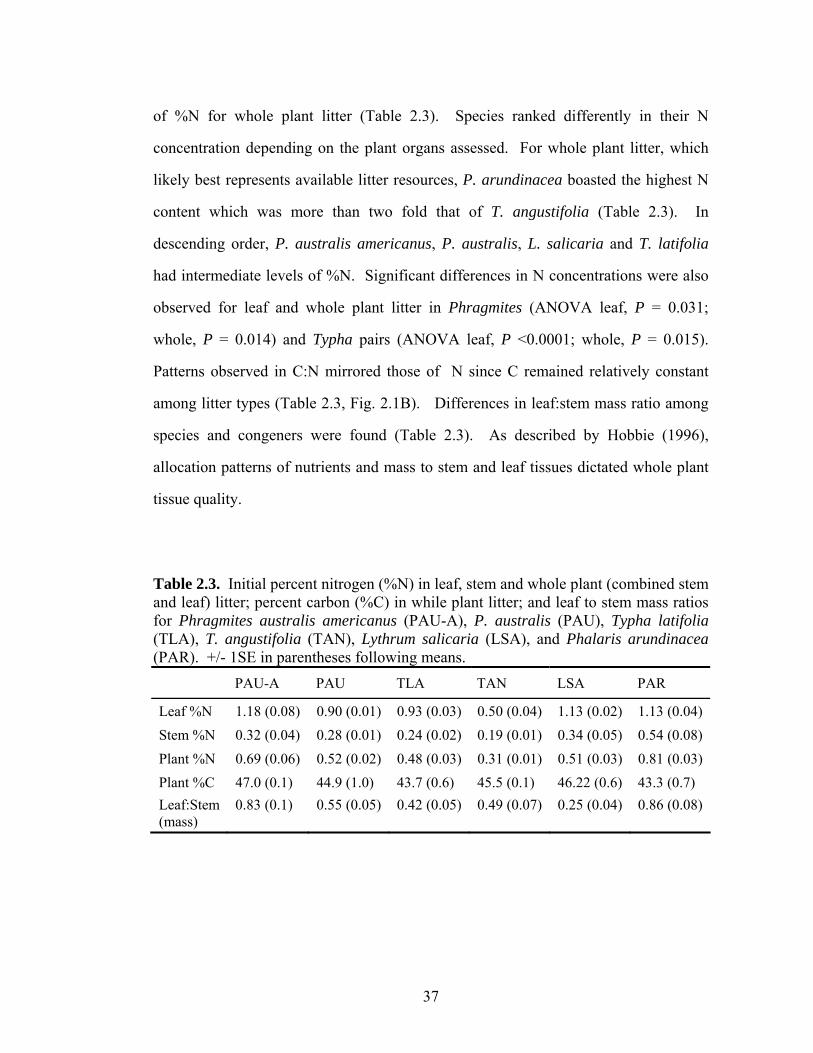
37
of %N for whole plant litter (Table 2.3). Species ranked differently in their N
concentration depending on the plant organs assessed. For whole plant litter, which
likely best represents available litter resources, P. arundinacea boasted the highest N
content which was more than two fold that of T. angustifolia (Table 2.3). In
descending order, P. australis americanus, P. australis, L. salicaria and T. latifolia
had intermediate levels of %N. Significant differences in N concentrations were also
observed for leaf and whole plant litter in Phragmites (ANOVA leaf, P = 0.031;
whole, P = 0.014) and Typha pairs (ANOVA leaf, P <0.0001; whole, P = 0.015).
Patterns observed in C:N mirrored those of N since C remained relatively constant
among litter types (Table 2.3, Fig. 2.1B). Differences in leaf:stem mass ratio among
species and congeners were found (Table 2.3). As described by Hobbie (1996),
allocation patterns of nutrients and mass to stem and leaf tissues dictated whole plant
tissue quality.
Table 2.3. Initial percent nitrogen (%N) in leaf, stem and whole plant (combined stem and leaf) litter; percent carbon (%C) in while plant litter; and leaf to stem mass ratios for Phragmites australis americanus (PAU-A), P. australis (PAU), Typha latifolia (TLA), T. angustifolia (TAN), Lythrum salicaria (LSA), and Phalaris arundinacea (PAR). +/- 1SE in parentheses following means. PAU-A PAU TLA TAN LSA PAR
Leaf %N 1.18 (0.08) 0.90 (0.01) 0.93 (0.03) 0.50 (0.04) 1.13 (0.02) 1.13 (0.04) Stem %N 0.32 (0.04) 0.28 (0.01) 0.24 (0.02) 0.19 (0.01) 0.34 (0.05) 0.54 (0.08) Plant %N 0.69 (0.06) 0.52 (0.02) 0.48 (0.03) 0.31 (0.01) 0.51 (0.03) 0.81 (0.03) Plant %C 47.0 (0.1) 44.9 (1.0) 43.7 (0.6) 45.5 (0.1) 46.22 (0.6) 43.3 (0.7) Leaf:Stem (mass)
0.83 (0.1) 0.55 (0.05) 0.42 (0.05) 0.49 (0.07) 0.25 (0.04) 0.86 (0.08)

38
Mass loss and tissue quality
A highly significant difference in percentage mass loss of plant litter was observed
among species (P < 0.0001). With the exception of Typha species litter, percentage
mass loss diverged increasingly among species with time (Fig. 2.1A). After six
months in the field (spring), mass loss was greatest for L. salicaria (23%), which was
significantly higher than that of T. latifolia (P = 0.01) and both Phragmites species
(both, P < 0.004). Litter with the lowest mass loss was P. australis (10%),
significantly so relative to all but its conspecific (all comparisons, P ≤ 0.004). Mass
loss was intermediate for remaining plant species in the following rank order: P.
arundinacea > T. angustifolia > T. latifolia > P. australis americanus. Of these, P.
arundinacea had significantly higher mass loss both Phragmites species (both, P <
0.004). Plastic straws had gained weight, likely due to the accumulation of
periphyton, resulting in a percent mass remaining that was significantly higher than all
other litter species (all comparisons, P < 0.004).
After nine months incubation in the field, P. arundinacea had the fastest
decomposing litter, losing over 40% of its initial mass (Fig. 2.1) and resulting in a
significantly lower mass remaining than all litter types (all comparisons, P < 0.004).
In contrast, P. australis remained the slowest decomposing plant species, losing less
than 20% of its initial litter mass, which was significantly lower than mass loss of P.
australis americanus, L. salicaria, and P. arundinacea (all comparisons, P < 0.004).
Second to P. arundinacea, L. salicaria had lost significantly more mass than
remaining litter types (all comparisons, P < 0.004) except P. australis americanus. In
turn, P. australis americanus had significantly less mass remaining than both T.
latifolia (P = 0.008), T. angustifolia (P = 0.02), and P. australis (P = 0.004). All plant
treatments had significantly less mass remaining than plastic drinking straws (all
comparisons, P < 0.004).

39
40
50
60
70
80
90
100
110
0 3 6 9
% m
ass
rem
aini
ng PAU-A
PAU
TLA
TAN
LSA
PAR
Plastic
A)
0
20
40
60
80
100
120
140
160
0 3 6 9Months
C:N
B)
Figure 2.1. Decomposition (A, litter mass remaining [%] after six and nine months) and C:N over time (B) for Phragmites australis americanus (PAU-A), P. australis (PAU), Typha latifolia (TLA), T. angustifolia (TAN), Lythrum salicara (LSA), Phalaris arundinacea (PAR) and plastic drinking straws (Plastic, excluded for C:N). Data are means ±1SE for 5 replicates per species per sample time.

40
Constant C:N between initial litter and litter exposed for six months reveal that mass
lost between these time points was mostly attributed to fragmentation, rather than
decomposition, characterized by decreasing C:N. Due to their structure, L. salicaria
and P. arundinacea comprised the smallest fragments of litter within the mesh bags,
which may explain their greater loss by spring relative to other litter types. In
contrast, decreasing C:N in the fall sample indicate divergence in decomposition rates,
reflected by a highly significant litter type X time interaction (P < 0.0001).
Including C:N (P = 0.1251) or %N (P = 0.1211) in the regression model did
not change the highly significant effect of species (P < 0.0001) on percent mass
remaining, indicating that differences in mass loss among species was not explained
by species-level variation in these quality metrics.
Invertebrate colonization
Overall, we observed a strong difference in total invertebrate density (log10
transformed abundance 100g-1) among litter types (P < 0.0001), which persisted
through time (litter species X time: P = 0.58). This effect was driven almost entirely
by statistically higher invertebrate abundance in P. arundinacea litter compared to all
but one litter type (P. arundinacea v. P. australis americanus, P = 0.004 ; v. P.
australis, P < 0.002; v. L. salicaria, P = 0.008 ; v. T. angustifolia, P < 0.002; v.
plastic, P < 0.002 ; and v. T. latifolia, P = 0.8 ; Fig. 2.2B). Besides P. arundinacea, T.
latifolia was the only other litter species that supported significantly more
invertebrates than another litter type (i.e. plastic straws, P = 0.3). No significant
change in invertebrate density was observed over time (P = 0.38).
Consistent through time, mean taxa richness varied significantly among litter
species (P = 0.0028, Fig. 2.2A). This overall significant result was driven by the high
taxa richness found within P. arundinacea packs (20 taxa sample-1, time pooled),

41
relative to the low taxon rich invertebrate community supported by T. angustifolia (18
taxa sample-1; time pooled, t73 = 4.26, P < 0.001). All other plant species shared
equivalent species richness.
Figure 2.2. Taxa richness (A) and invertebrate density (B) in litter bags filled with Phragmites australis americanus (PAU-A), P. australis (PAU), Typha latifolia (TLA), T. angustifolia (TAN), Lythrum salicara (LSA), Phalaris arundinacea (PAR), and plastic drinking straws (PLASTIC). Spring and fall samples pooled. Plant species are ranked from highest (left) to lowest (right) %N. Data are means ±1SE for, at least, 10 replicates per plant species.
00.20.40.60.8
11.21.4
PAR PAU-A PAU LSA TLA TAN PLASTIC
Log
dens
ity (#
per
100
g)
0
5
10
15
20
25
30
PAR PAU-A PAU LSA TLA TAN PLASTIC
Ric
hnes
s (ta
xa p
er b
ag)
B
a ab
ab ab
ab ab
b
A
a
bc bc
bc bc
c
ab
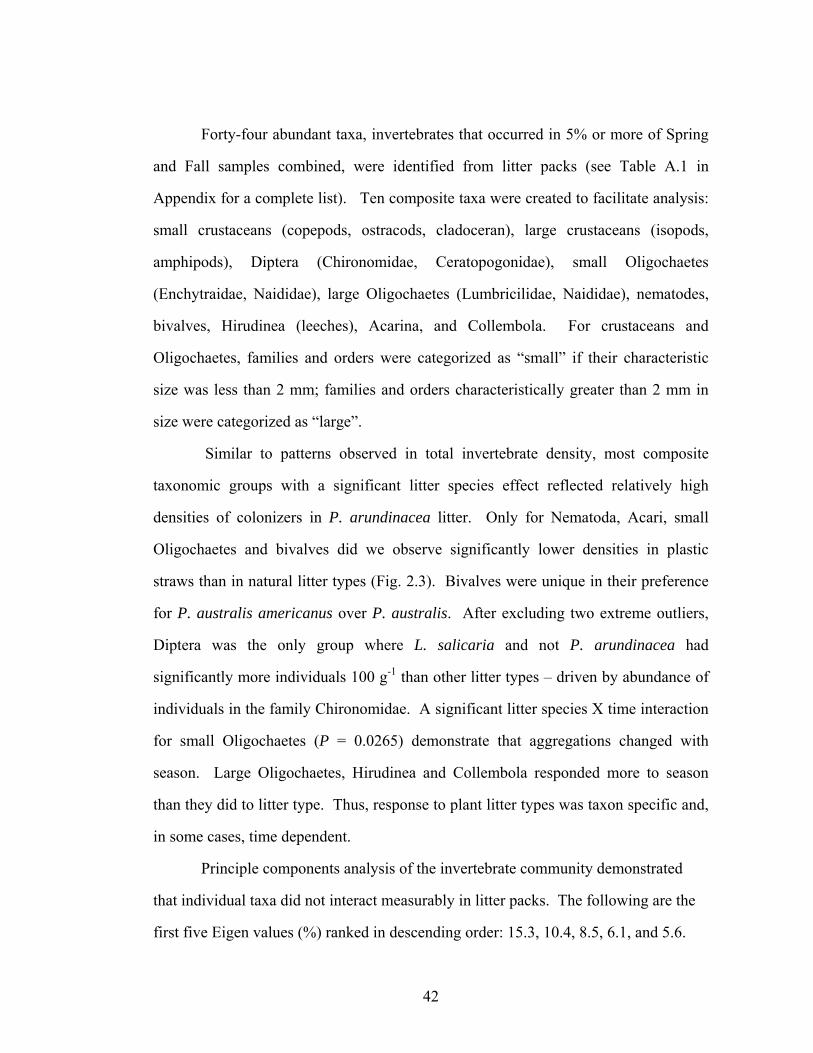
42
Forty-four abundant taxa, invertebrates that occurred in 5% or more of Spring
and Fall samples combined, were identified from litter packs (see Table A.1 in
Appendix for a complete list). Ten composite taxa were created to facilitate analysis:
small crustaceans (copepods, ostracods, cladoceran), large crustaceans (isopods,
amphipods), Diptera (Chironomidae, Ceratopogonidae), small Oligochaetes
(Enchytraidae, Naididae), large Oligochaetes (Lumbricilidae, Naididae), nematodes,
bivalves, Hirudinea (leeches), Acarina, and Collembola. For crustaceans and
Oligochaetes, families and orders were categorized as “small” if their characteristic
size was less than 2 mm; families and orders characteristically greater than 2 mm in
size were categorized as “large”.
Similar to patterns observed in total invertebrate density, most composite
taxonomic groups with a significant litter species effect reflected relatively high
densities of colonizers in P. arundinacea litter. Only for Nematoda, Acari, small
Oligochaetes and bivalves did we observe significantly lower densities in plastic
straws than in natural litter types (Fig. 2.3). Bivalves were unique in their preference
for P. australis americanus over P. australis. After excluding two extreme outliers,
Diptera was the only group where L. salicaria and not P. arundinacea had
significantly more individuals 100 g-1 than other litter types – driven by abundance of
individuals in the family Chironomidae. A significant litter species X time interaction
for small Oligochaetes (P = 0.0265) demonstrate that aggregations changed with
season. Large Oligochaetes, Hirudinea and Collembola responded more to season
than they did to litter type. Thus, response to plant litter types was taxon specific and,
in some cases, time dependent.
Principle components analysis of the invertebrate community demonstrated
that individual taxa did not interact measurably in litter packs. The following are the
first five Eigen values (%) ranked in descending order: 15.3, 10.4, 8.5, 6.1, and 5.6.
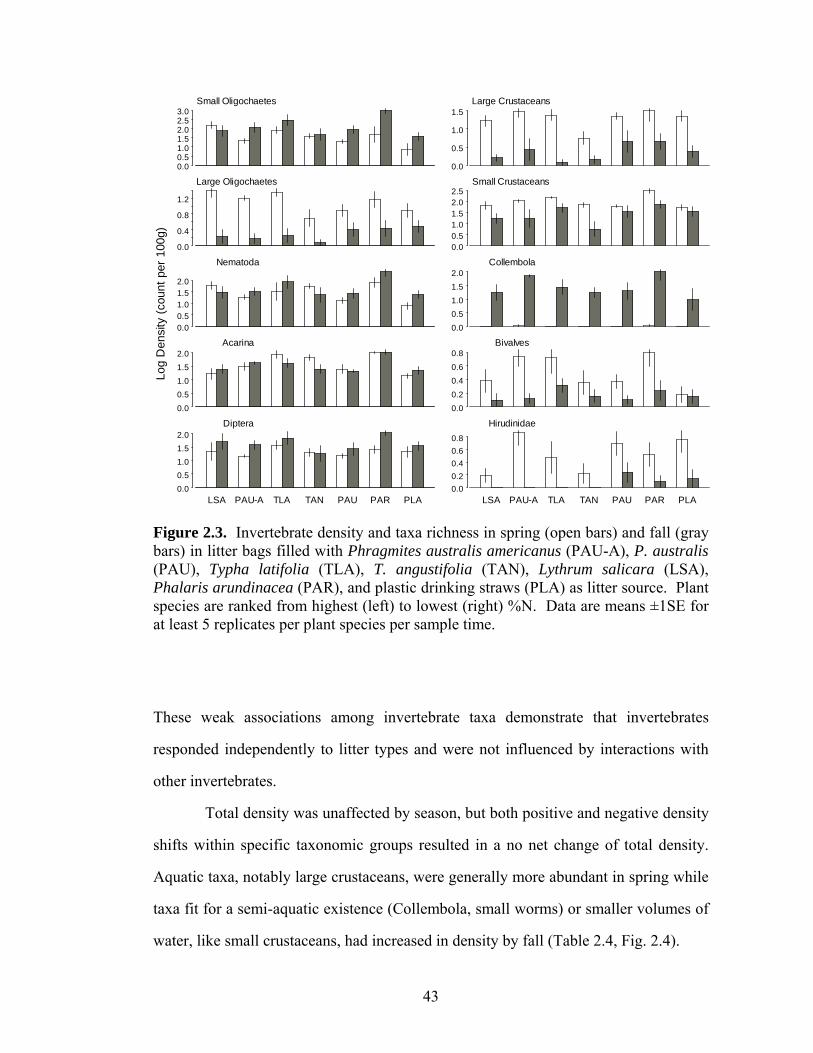
43
0.00.51.01.52.02.53.0
Small Oligochaetes
0.0
0.4
0.8
1.2
Large Oligochaetes
0.00.51.01.52.0
Nematoda
0.00.51.01.52.0
Acarina
0.00.51.01.52.0
LSA PAU-A TLA TAN PAU PAR PLA
Diptera
0.0
0.5
1.0
1.5Large Crustaceans
0.00.51.01.52.02.5
Small Crustaceans
0.00.51.01.52.0
Collembola
0.00.2
0.40.6
0.8Bivalves
0.00.20.40.60.8
LSA PAU-A TLA TAN PAU PAR PLA
Hirudinidae
Log
Den
sity
(cou
nt p
er 1
00g)
Figure 2.3. Invertebrate density and taxa richness in spring (open bars) and fall (gray bars) in litter bags filled with Phragmites australis americanus (PAU-A), P. australis (PAU), Typha latifolia (TLA), T. angustifolia (TAN), Lythrum salicara (LSA), Phalaris arundinacea (PAR), and plastic drinking straws (PLA) as litter source. Plant species are ranked from highest (left) to lowest (right) %N. Data are means ±1SE for at least 5 replicates per plant species per sample time.
These weak associations among invertebrate taxa demonstrate that invertebrates
responded independently to litter types and were not influenced by interactions with
other invertebrates.
Total density was unaffected by season, but both positive and negative density
shifts within specific taxonomic groups resulted in a no net change of total density.
Aquatic taxa, notably large crustaceans, were generally more abundant in spring while
taxa fit for a semi-aquatic existence (Collembola, small worms) or smaller volumes of
water, like small crustaceans, had increased in density by fall (Table 2.4, Fig. 2.4).
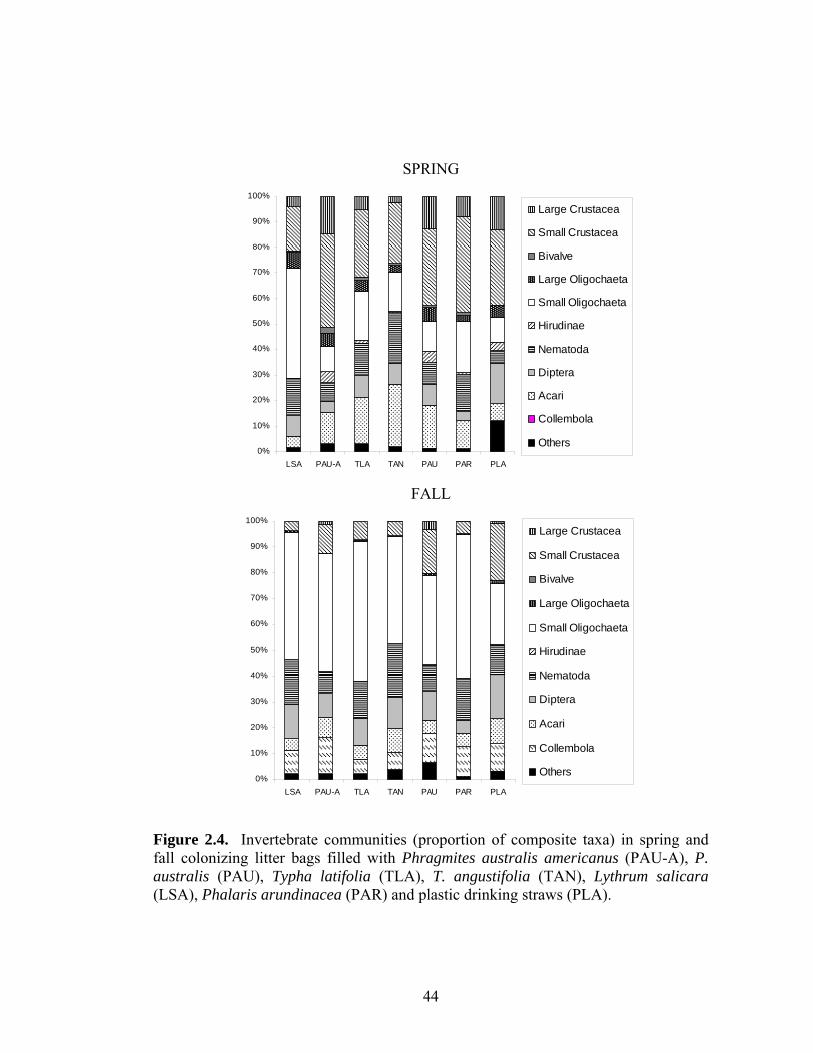
44
SPRING
0%
10%
20%
30%
40%
50%
60%
70%
80%
90%
100%
LSA PAU-A TLA TAN PAU PAR PLA
Large Crustacea
Small Crustacea
Bivalve
Large Oligochaeta
Small Oligochaeta
Hirudinae
Nematoda
Diptera
Acari
Collembola
Others
FALL
0%
10%
20%
30%
40%
50%
60%
70%
80%
90%
100%
LSA PAU-A TLA TAN PAU PAR PLA
Large Crustacea
Small Crustacea
Bivalve
Large Oligochaeta
Small Oligochaeta
Hirudinae
Nematoda
Diptera
Acari
Collembola
Others
Figure 2.4. Invertebrate communities (proportion of composite taxa) in spring and fall colonizing litter bags filled with Phragmites australis americanus (PAU-A), P. australis (PAU), Typha latifolia (TLA), T. angustifolia (TAN), Lythrum salicara (LSA), Phalaris arundinacea (PAR) and plastic drinking straws (PLA).

Table 2.4. Densities (counts per 100 g) of invertebrate groups in large mesh bags filled with one of the following litter types: Phragmites australis (PAU), P. australis americanus (PAU-A), Typha latifolia (TLA), T. angustifolia (TAN), Lythrum salicaria (LSA), Phalaris arundinacea (PAR), and plastic drinking straws (PLA). Invertebrates were sampled spring (S) and fall (F) 2004. +/- 1SE in parentheses.
PAU PAU-A TLA TAN LSA PAR PLA
S n=10 F n=6 S n=10 F n=5 S n=5 F n=6 S n=7 F n=6 S n=5 F n=7 S n=7 F n=5 S n=6 F n=5 Crustacea
Large 27 (5.5)
12.8 (9.0)
46.7 (12.6)
7.4 (6.7)
29.0 (9.5)
0.3 (0.3)
7.3 (2.8)
0.7 (0.4)
20.8 (7.8)
0.9 (0.4)
69.4 (21.9)
6.4 (3.6)
27.0 (6.9)
2.4 (1.7)
Small 64.2 (10.6)
69.0 (33.8)
118.8 (21.7)
57.6 (33.5)
146.2 (12.7)
74.3 (22.4)
77.6 (15.1)
19.2 (10.8)
87.2 (35.6)
25.0 (5.7)
338.8 (73.0)
103.4 (44.6)
62.7 (19.6)
57.4 (26.3)
Oligochaeta
Large 11.8 (3.9)
3.2 (2.1)
16.7 (2.7)
0.8 (0.6)
24.6 (6.5)
2.2 (1.8)
8.4 (4.4)
0.3 (0.3)
31 (10.8)
2.3 (2.0)
21.4 (6.4)
3.2 (1.9)
9.2 (2.3)
2.8 (1.2)
Small 24.5 (6.6)
139.5 (53.0)
31.5 (9.3)
239.4 (133.3)
105.2 (27.6)
551.0 (188.7)
49.7 (14.6)
149.7 (84.9)
216.4 (84.1)
336.9 (266.3)
179.1 (67.3)
1244.6 (369.5)
20.7 (13.4)
61.2 (26.9)
Nematoda 18.6 (6.5)
41.2 (12.5)
23.4 (5.8)
45 (18.8)
71.8 (26.8)
143.7 (48.0)
63.4 (14.5)
73.8 (41.2)
73.2 (23.8)
117.3 (93.7)
130.3 (41.9)
363.8 (135.1)
10 (3.9)
30.6 (9.9)
Hirudinea 9 (3.5)
1.5 (1.0)
14.1 (4.6)
0 (0)
5.8 (4.8)
0 (0)
1.9 (1.5)
0 (0)
0.8 (0.48)
0 (0)
5.1 (2.9)
0.4 (0.4)
7.2 (2.3)
0.8 (0.8)
Diptera 17.0 (3.2)
45.3 (17.1)
14.5 (2.1)
47.7 (13.8)
46.6 (14.8)
105.4 (31.6)
26.6 (8.7)
43.7 (25.2)
39.7 (13.3)
90.3 (20.8)
32.3 (8.8)
117.1 (23.0)
33.6 (15.9)
44.2 (12.6)
Bivalve 2.0 (0.8)
0.3 (0.2)
7 (2.0)
0.4 (0.2)
7.6 (4.1)
1.3 (0.4)
2.7 (1.6)
0.7 (0.4)
2.2 (1.11)
0.6 (0.6)
9 (2.5)
1.2 (0.8)
0.8 (0.5)
0.6 (0.4)
Acarina 35.7 (8.3)
20.2 (2.3) 39 (7.8) 41.2
(5.9) 100.8 (27.3)
54.3 (18.9)
79 (19.0)
32.8 (13.1)
22.8 (9.5)
30.4 (7.0)
98.0 (10.2)
109.2 (22.3)
14.2 (2.3)
25.4 (6.1)
Collembola 0 (0)
46.8 (20.8)
0.1 (0.1)
73.2 (10.2)
0 (0)
59.2 (28.4)
0 (0)
24.2 (9.5)
0 (0)
62.1 (42.0)
0.1 (0.1)
258.8 (135.6)
0 (0)
27.6 (13.5)
Total 213.7 (14.8)
405.5 (109.3)
321.8 (33.6)
524.6 (190.3)
554.2 (78.3)
1013.0 (255.7)
322.9 (40.6)
358.8 (161.1)
502 (118.4)
680.3 (360.0)
894.3 (107.7)
2235.2 (436.3)
210. 8 (56.5)
261.4 (77.8)
Taxa Richness
21.2 (1.5)
21.3 (2.6)
23.4 (1.1)
19.4 (2.5)
22.4 (2.2)
19.5 (2.1)
17.1 (1.5)
13.8 (1.9)
21.4 (2.2)
16.7 (2.4)
24.0 (1.4)
23.2 (1.0)
19.3 (1.6)
20.2 (2.4)
45

46
Additionally, crustaceans and Oligochaetes had swapped dominance status from
spring to fall, which likely reflects increasing food availability for engulfers like small
worms (Table 2.4, Fig 2.4).
Closer comparison of dominant taxa among litter treatments provides further
support for an effect of litter type on community composition (Table 2.5). In spring,
of the five most abundant (dominant) taxa, three were consistent across plant species:
nematodes, Podocopa #1, Harpacticoida. Phragmites species and plastic straws were
unique in that Harpacticoida was the top dominant. In contrast to all other natural
litter types, L. salicaria supported disproportionately more Oligochaetes (~30%) and
Chironomidae (~5%) and fewer Oribatida. By fall, strong distinctions between plant
species had all but disappeared with all natural litter species having been colonized by
proportionately high densities of Oligochaetes and Collembola. Chironomidae and
nematodes continued to rank among the top five most abundant invertebrates. Even
though crustacean numbers generally had declined by fall, plastic and Phragmites
species continued to support relatively more crustaceans; however, Harpacticoida had
seceded to Cyclopoida as the dominant taxon.
Discussion
Mass loss and quality
By the end of the experiment, significant differences among mass loss were observed
as predicted, even between closely related conspecifics. Decomposition rates and N
content of T. angustifolia and P. australis were similar to those found by Findlay et al.
(2002). No comparisons were available for other litter types. Despite a positive
correlation with mass loss, tissue %N (or C:N) alone did not significantly explain litter

Table 2.5. Composition (%) of top five dominant taxa in mesh bags filled with one of six macrophyte species: Phragmites australis (PAU), P. australis americanus (PAU-A), Typha latifolia (TLA), T. angustifolia (TAN), Lythrum salicaria (LSA), Phalaris arundinacea (PAR), or plastic drinking straws (PLA). Invertebrates were sampled spring (S) and fall (F) 2004. +/-1SE in parentheses. OL = Oligochaeta, NEM = Nematoda, PO = Podocopa, DIP = Diptera, HARP = Harpacticoida, ISO = Isopoda, CYCLO = Cyclopoida, AC = Acari, COLL = Collembola. Number represents morphospecies.
SPRING LSA PAU-A TLA TAN PAU PAR PLA rank taxon % taxon % taxon % taxon % taxon % taxon % taxon % 1 OL6 29 HARP 13 NEM 13 NEM 19 HARP 11 NEM 15 HARP 9 2 NEM 14 ISO 10 AC8 11 AC8 19 AC8 10 OL6 12 DIP2 9 3 OL4 8 PO1 9 OL6 11 OL4 9 PO1 9 HARP 10 AMPH 9 4 PO1 6 NEM 7 PO1 10 HARP 9 ISO 9 PO1 10 PO1 9 5 DIP2 5 CYCLO 7 HARP 9 PO1 9 NEM 8 OL4 7 OL6 7 FALL LSA PAU-A TLA TAN PAU PAR PLA rank taxon % taxon % taxon % taxon % taxon % taxon % taxon % 1 OL4 48 OL4 31 OL4 37 OL4 34 OL4 22 OL4 51 OL4 13 2 NEM 17 COLL 14 OL6 17 NEM 20 COLL 11 NEM 16 NEM 11 3 DIP2 12 OL6 14 NEM 14 DIP2 8 NEM 10 COLL 12 DIP2 9 4 COLL 9 NEM 8 DIP2 7 COLL 7 DIP2 9 DIP2 5 COLL 10 5 AC8 3 DIP2 7 COLL 6 OL6 6 OL6 8 OL6 5 OL6 9
47

48
species effects on percent mass remaining, suggesting that plant species differed in
additional ways that drove mass loss patterns (discussed below). The rate at which
plant litter decomposes directly influences rates of nutrient and energy cycling and,
consequently, plays a vital role in food web dynamics (Moore et al. 2005). Therefore,
divergence in decay rates observed among our six plant species suggests that these
plants are not functionally equivalent and that ecosystem-level consequences may be
born due to shifts in plant dominance among these wetland plants. Distinct mass loss
rates between Phragmites species support findings that even genotypes can support
varying ecosystem processes (Driebe and Whitham 2000, Whitham et al. 2003,
Schweitzer et al. 2004).
Invertebrate colonization and quality
We found mixed support for our prediction that invertebrate colonization would differ
among plant litter species. Invertebrates did respond differentially among litter
species; however, litter effects on biota were species specific, varying with the taxa
observed and season. Litter type exerted a strong effect on invertebrate richness,
overall density, and abundance of 7 out of 10 composite taxa. However, these trends
were largely driven by significant density differences between the most preferred and
least preferred litter types or by the overwhelming preference for one litter type.
Where densities diverged among litter types, invertebrates almost exclusively
preferred P. arundinacea litter (i.e. total, large crustaceans (spring), small crustaceans
(spring), nematodes, small Oligochaetes (fall). With the exception of Diptera, small
Oligochaetes (spring), and bivalves, invertebrate abundances on other natural litter
types did not differ significantly despite a wide variety of plant form and tissue
chemistry represented. Only two studies are known to have compared invertebrates
using a subset of our study plants. With litter bags, Fell et al. (2003) did not detect

49
differences in macroinvertebrate richness and abundance between T. angustifolia and
P. australis litter. Similarly, field-sampled macroinvertebrates in T. latifolia and L.
salicaria stands had comparable densities and richness but were found to be smaller in
L. salicaria (Gardner et al. 2001).
Stream studies have shown that tissue palatability is an important factor in
colonization by microbes (Melillo et al. 1982, Findlay and Arsuffi 1989) and
invertebrates (Dudgeon and Wu 1999). Except P. arundinacea (highest N) and plastic
straws (lowest N), ranking of plant species according to invertebrate colonization
(total density) was not as predicted based on N content, indicating that palatability of
our tissues may have been influenced by other factors such as physical leaf toughness
and/or anti-herbivory compounds, such as tannins and phenolics (Campbell and
Fuchshuber 1995, Grime et al. 1996). Consistent with other studies that included
synthetic substrates (Dudgeon and Wu 1999, Angradi et al. 2001), plastic straws
supported, overall, fewer fauna than natural litter types. However, this pattern was not
ubiquitous among composite taxa, suggesting that while some taxa exploit plant
detritus directly for food and substrate, others may use litter for habitat only and/or
consume the periphyton that grows on detrital surfaces (Melillo et al. 1982, Dudgeon
and Wu 1999, Royer et al. 1999, Angradi et al. 2001).
Other factors controlling mass loss and invertebrate abundance
Our results indicate that in addition to N content, plant structure (Bailey et al. 2001,
Varga 2001, Robertson and Weis 2005) and life history of colonizing fauna (Varga
2001) drove mass loss and invertebrate density patterns observed. Plant structure
(morphology and quantity of leaves and stems) determines the quantity of palatable
detrital material (leaf tissue), the accessibility of that material to biota through surface-
to-volume ratios, and ultimately, dictates the phenology of decay (the development of

50
detritus) (Moore et al. 2005). All of these influence the food and habitat resources
available to decomposer fauna. In turn, variable feeding ecologies (e.g. shredder v.
filter feeder) and habitat needs (e.g. refugia) among invertebrates will also direct
invertebrate responses to litter resources.
We argue that invertebrates responded favorably to P. arundinacea for the
same reasons this grass is cultivated for cattle forage in North America (Cherney et al.
2003) and Europe (Sahramaa et al. 2004). Not only does P. arundinacea have
relatively high N concentrations, but it has a very high leaf to stem mass ratio (Table
2.1). As leaves are thin and leaf toughness is low (Park, personal obs.), they break
down relatively quickly. The leaves of L. salicaria are also very thin and even more
fragile than those of P. arundinacea. Despite L. salicaria’s recalcitrant stem, the rapid
decay of leaves by spring resulted in higher rates of mass loss and attracted an
advanced invertebrate community comprised of proportionately more Oligochaetes,
which require particulate matter for food and habitat (Brinkhurst and Gelder 2001).
By fall, other litter types supported equal densities of Oligochaetes probably due to the
fact that 1) leaf litter comprised a small portion of L. salicaria biomass and
disappeared from bags over time, and 2) other litter types had adequately broken down
after 9 months to support Oligochaetes. Persistent through time, hollow-stemmed
Phragmites species and plastic straws supported a higher percentage of Hirudinae and
crustaceans, revealing their potential preference for tubular structures. The
combination of higher %N and leaf:stem mass of native P. australis americanus likely
contributed to its rapid decay relative to introduced P. australis. A lack of
discrepancy in invertebrate abundance between plants as different in form as Typha
and Phragmites but similar in whole plant N content, indicates that a difference in
plant architecture is influential only if quantity and quality of litter resources also
differ.
51
In general, we anticipated stronger species effects between the litter types
tested, especially between natural litter species and plastic drinking straws.
Taxonomic resolution above the species level, a common issue for invertebrate
studies, may have oversimplified invertebrate response to various litter types as
different genus and species are known to exploit resources and habitats with differing
efficiencies (Bjelke and Herrman 2005). Additionally, while litter bags have proven
to be a useful tool for mechanistic understanding of litter dynamics, the small spatial
scale of litter bags does not fully represent conditions produced by an entire shift in
plant dominance. Because we controlled for biomass, our results speak exclusively to
species effects founded in tissue quality and/or structure of that tissue plant. Even
within that context, specific plant species effects may be drowned by the signal of
surrounding field conditions. Indeed, the responses observed may be more akin to
those predicted for plants just initiating community dominance. Given that a plant
effect on ecosystem function is expected to be proportional to its landscape-level
biomass, a plant’s influence at this stage is likely small but predicted to increase as it
becomes increasingly dominant (Grime 1998). Moreover, litter bags cannot imitate
alterations in biomass produced by dominant plant species at the wetland-scale. Given
that changes in litter quality, quantity and timing of litter, as well as environmental
conditions, alter nutrient and energy cycling (Aerts and de Caluwe 1997), our
investigation provides just one part of the story.
Status effects on mass loss and invertebrate colonization
In a review of decomposition rates for native and non-native plants, Ehrenfeld (2003)
found that non-native plants tended to decompose more quickly than native plants.
Ashton et al. (2005) recently confirmed this pattern holds true, using phylogenetically
controlled pairs in an invaded and non-invaded site. We observed no general trend

52
between native and nonnative plant species, as both the highest and lowest values for
mass loss and invertebrate abundance came from invasive plant litter. Opposite to
findings by Agrawal et al. (2005) that invasive plants have lower C:N ratios (higher N
content) than native plants after controlling for phylogeny, native plants in our study
had higher N within congener pairs.
Implications
Species identity of litter entering wetlands influenced decomposition rates and wetland
biota, indicating that shifts in dominance among the six wetland macrophytes tested
could alter wetland function. In our study system, decomposability and palatability of
plants depended on the net effect of plant form/architecture and N content of plant
stems and leaves. In general, fast decomposing litter produces rapid pulses of
nutrients and energy that can quickly support high invertebrate numbers, e.g. P.
arundinacea. In the short-term, this may increase overall productivity of wetland
biota and be seen as beneficial. In the long-term, however, litter with rapid decay
rates provides a relatively ephemeral resource, whereas slower decomposing litter
stabilizes and sustains detritus-based, aquatic ecosystems (Findlay and Arsuffi 1989,
Wetzel 1995). Distinct temporal advantages of slow and fast decomposing litter may
explain why diversity of decomposer communities can increase with detrital diversity
and provide additional support for the value of diversity in ecosystem health and
function (Wetzel 1995).
The effect of changing plant dominance will also depend on the original plant
community composition. The more similar litter dynamics of the new plant dominant
resemble those of the old, the lower the impact may be on wetland food webs. Despite
intermediate N content and tough leaf tissues, T. latifolia attracted relatively high
densities of several invertebrates (i.e. small crustaceans, Nematoda, Acari and small

53
Oligochaetes). This may be associated with the fact that the invertebrates at our study
site have evolved with dominant Carex lasiocarpa, which has been found to have
similar decay rates as T. latifolia (Thormann and Bayley 1997). Thus, the
evolutionary context of a wetland system may be important, where the biota of
historically stable wetlands respond more strongly to changes in plant dominance than
biota adapted to historically dynamic wetlands. Improving our general understanding
of the consequences plant shifts may impose on freshwater wetland systems requires
future studies that investigate litter processing at larger spatial and temporal scales that
include multiple historic contexts.

54
References
Aerts, R., and H. de Caluwe. 1997. Nutritional and plant-mediated controls on leaf
litter decomposition of Carex species. Ecology 78:244-260.
Agrawal, A. A., P. M. Kotanen, C. E. Mitchell, A. G. Power, W. Godsoe, and J. Klironomos. 2005. Enemy Release? An experiment with congeneric plant pairs and diverse above- and below-ground enemies. Ecology 86:2979–2989.
Angradi, T. R., S. M. Hagan, and K. W. Able. 2001. Vegetation type and the intertidal macroinvertebrate fauna of a brackish marsh: Phragmites vs. Spartina. Wetlands 21:75-92.
Ashton, I. W. 2005. Invasive species accelerate decomposition and litter nitrogen loss in a mixed deciduous forest. Ecological Applications 15:1263-1272.
Bailey, J. K., J. A. Schweitzer, and T. G. Whitham. 2001. Salt cedar negatively affects biodiversity of aquatic macroinvertebrates. Wetlands 21:442-447.
Bjelke, U., and J. Herrman. 2005. Processing of two detritus types by lake-dwelling shredders: species-specific impacts and effects of species richness. Journal of Animal Ecology 74:92-98.
Brinkhurst, R. O., and S. R. Gelder. 2001. Annelida: Oligochaeta, including Branchiobdellidae, 2 edition. Academic Press, San Diego, CA.
Campbell, I. C., and L. Fuchshuber. 1995. Polyphenols, condensed tannins, and processing rates of tropical and temperate leaves in and Australian stream. Journal of North American Benthological Society 14:174-182.
Cherney, J. H., D. J. R. Cherney, and M. D. Casler. 2003. Low intensity harvest management of reed canarygrass. Agronomy Journal 95:627-634.
Driebe, E. M., and T. G. Whitham. 2000. Cottonwood hybridization affects tannin and nitrogen content of leaf litter and alters decomposition. Oecologia 123:99-107.
Dudgeon, D., and K. K. Y. Wu. 1999. Leaf litter in a tropical stream: food or substrate for macroinvertebrates? Archiv f. Hydrobiologie 146:65-82.

55
Ehrenfeld, J. G. 2003. Effects of exotic plant invasions on soil nutrient cycling processes. Ecosystems 6:503-523.
Fell, P. E., R. S. Warren, J. K. Light, R. L. Rawson Jr., and S. M. Fairley. 2003. Comparison of fish and macroinvertebrate use of Typha angustifolia, Phragmites australis and treated Phragmites marshes along the lower Connecticut River. Estuaries 26:535-552.
Findlay, S., and T. L. Arsuffi. 1989. Microbial growth and detritus transformations during decomposition of leaf litter in a stream. Freshwater Biology 21:261-269.
Findlay, S. E. G., S. Dye, and K. A. Kuehn. 2002. Microbial growth and nitrogen retention in litter of Phragmites australis compared to Typha angustifolia. Wetlands 22:616-625.
Gardner, S. C., C. E. Grue, W. W. Major III, and L. L. Conquest. 2001. Aquatic invertebrate communities associated with purple loosestrife (Lythrum salicaria), cattail (Typha latifolia), and bulrush (Scirpus acutus) in Central Washington, USA. Wetlands 21:593-601.
Grime, J. P. 1998. Benefits of plant diversity to ecoystems: immediate, filter and founder effects. Journal of Ecology 86:902-910.
Grime, J. P., J. H. C. Cornelissen, K. Thompson, and J. G. Hodgson. 1996. Evidence of a causal connection between anti-herbivore defence and the decomposition rate of leaves. Oikos 77:489-494.
Hobbie, S. E. 1992. Effect of plant species on nutrient cycling. Trends in Ecology and Evolution 7:336-339.
Hobbie, S. E. 1996. Temperature and plant species control over litter decompositioin in Alaskan tundra. Ecological Monographs 66:503-522.
Kuehn, K. A., M. J. Lemke, K. Suberkropp, and R. G. Wetzel. 2000. Microbial biomass and production associated with decaying leaf litter of the emergent macrophyte Juncus effusus. Limnology and Oceanography 45:862-870.

56
Melillo, J. M., J. D. Aber, and J. F. Muratore. 1982. Nitrogen and lignin control of hardwood leaf litter decomposition dynamics. Ecology 63:621-626.
Mitsch, W. J., and J. G. Gosselink. 1993. Wetlands, 2nd edition. Van Nostrand Reinhold, New York.
Moore, J. C., E. L. Berlow, D. C. Coleman, P. C. de Ruiter, Q. Dong, A. Hastings, N. C. Johnson, K. S. McCann, K. Melville, P. J. Morin, K. Nadelhoffer, A. D. Rosemond, D. M. Post, J. L. Sabo, K. M. Scow, M. J. Vanni, and D. H. Wall. 2005. Detritus, trophic dynamics and biodiversity. Ecology Letters 7:584-600.
Naeem, S., D. R. Hahn, and G. Schuurman. 2000. Producer-decomposer co-dependency influences biodiversity effects. Nature 403:762-763.
Robertson, T. L., and J. S. Weis. 2005. A comparison of epifaunal communities associated with the stems of salt marsh grasses Phragmites australis and Spartina alterniflora. Wetlands 25:1-7.
Royer, T., M. T. Monaghan, and G. W. Minshall. 1999. Processing of native and exotic leaf litter in two Idaho (U.S.A) streams. Hydrobiologia 400:123-128.
Sahramaa, M., L. Hommo, and L. Jauhiainen. 2004. Variation in seed production traits of reed canarygrass germplasm. Crop Science 44:988-996.
Schweitzer, J. A., J. K. Bailey, S. C. Hart, and T. G. Whitham. 2005. Nonadditive effects of mixing cottonwood genotypes on litter decomposition and nutrient dynamics. Ecology 86:2834-2840.
Schweitzer, J. A., J. K. Bailey, B. J. Rehill, G. D. Martinsen, S. C. Hart, R. L. Lindroth, P. Keim, and T. G. Whitham. 2004. Genetically based trait in a dominant tree affects ecosystem processes. Ecology Letters 7:127-134.
Thormann, M. N., and S. E. Bayley. 1997. Decomposition along a moderate-rich fen-marsh peatland gradient in boreal Alberta, Canada. Wetlands 17:123-137.
Varga, I. 2001. Macroinvertebrates in reed litter. International Review of Hydrobiology 86:573-583.

57
Wetzel, R. G. 1995. Death, detritus and energy flow in aquatic ecosystems. Freshwater Biology 33:83-89.
Whitham, T. G., W. P. Young, G. D. Martinsen, C. A. Gehring, J. A. Shweitzer, and S. M. Shoster. 2003. Community and ecosystem genetics: a consequence of the extended phenotype. Ecology 80:416-428.

58
APPENDIX
Table A.1. Complete list of invertebrate taxa collected from litter bags placed in Deer Creek Marsh, NY. Common (C), abundant (A) and rare (R) taxa occurred in greater than 10%, between 5% and 9%, and less than 5%, respectively, of pooled samples.
Class/order Family Genus AbundanceIsopoda Caecidotea C Cladocera R Amphipoda Crangonyx C Copepoda Cyclopoida C Harpacticoida C Calanoida C Ostracoda Podocopoda 1 C Podocopoda 2 C Podocopoda 3 C Podocopoda 4 C Podocopoda 5 C Podocopoda 6 A Podocopoda 7 C Podocopoda 8 R Diptera Ceratopogonidae C Chironimidae C Psychodidae R Stratiomyidae R Tabanidae R Tipulidae R Diptera 1 R Diptera 2 R Ephemeroptera Caenidae Caenis C Ephemeroptera 2 R Hymenoptera C Coleoptera larvae Scirtidae Cyphon A Dytiscidae Hydroporus R Gyrinidae R Coleoptera L1 R

59
Table A.1 (Continued).
Class/order Family Genus AbundanceColeoptera larvae (cont’) Coleoptera L2 R
Coleoptera L3 R Coleoptera L4 R Coleoptera L5 R Coleoptera adult Dytiscidae 1 Hydroporus R Dytiscidae 2 Hygrotus R Dytiscidae 3 R Staphylinidae R Carabidae R Odonata R Lepidoptera larva R Oligochaeta Lumbriculidae Lumbriculus variegatus C
Enchytraidae 1 Pristinella C Enchytraidae 2 A Naididae 1 C Naididae 2 C Naididae 3 C Naididae 4 Dero A C Naididae 4 Dero B C Oligocheata 1 A Hirudinea Hirudinidae Helobdella stagnalis C Glossophonidae A Hirudinidae A Nematoda C Collembola Sminthuridae C Hypogasturidae C Isotomidae C Thripsera R Acari Prostigmata unknown R Prostigmata Trombidiidae C Prostigmata Bdellidae C Prostigmata Tydeidae C Mesostigmata unknown C

60
Table A.1 (Continued).
Class/order Family Genus AbundanceAcari (cont’d) Mesostigmata Ascidae C Oribatida Hydrozetidae C Oribatida Oribatulidae A Oribatida Camisiidae A Oribatida Hydrozetidae C Oribatida Malaconothridae C Oribatida unknown C Oribatida Phenopelopidae C Oribatida Mycobatidae C Acari 1 C Acari 2 C Acari 3 A Bivalvia C Gastropoda Snail 1 C
Snail 2 C
Snail 3 C
Snail 4 A
Snail 5 C
Snail 6 A
Snail 7 A
Snail 8 A
Slug 1 C Planaria C