planning for improving high-tech new towns’
TRANSCRIPT

Planning for Improving High-Tech New Towns’
Attraction to Talents
- Case Study of Changsha, China
A Thesis Presented to the Faculty of Architecture and Planning
COLUMBIA UNIVERSITY
In Partial Fulfillment
of the Requirements for the Degree
Master of Science in Urban Planning
by
Lingran Meng
[lm3193]
May, 2018

Lingran Meng lm3193
2
ACKNOWLEDGEMENT
I would like to take this opportunity to express my greatest appreciation towards my thesis advisor,
Prof. Kian Tajbakhsh, and my thesis reader, Prof. Katherine Dunham, for their generous guidance
and inspiration during my research and thesis jury, providing me with precious advice. This
dissertation would not have been completed without their assistance.
I would also like to dedicate my gratefulness to my friends and my family for their endless support
and encouragement. Their support is important for me to have courage and motivation to finish
my thesis.

Lingran Meng lm3193
3
ABSTRACT
In 2015, “The Belt and Road Initiative” proposed by the Chinese government contended the target
of booming up cities in central and western China and relieving the overpopulation of coastal areas.
In this plan, Changsha, a city in the middle part of China is going to play an important role for
innovation and high-tech development. Talents are necessary for this step of development. This
empirical study used the city of Changsha for case study and identified that apart from the
traditional factors like Hukou, job opportunities and salary, talents’ willingness to live and work
in Changsha can also be seriously affected by their satisfaction of cultural and recreational
activities. Therefore, when crafting policies and plans for the development of second-tier cities in
China, local governments and planners could discover and make good use of its own specialties
for talent attraction.

Lingran Meng lm3193
4
LIST OF ILLUSTRATIONS
LIST OF FIGURES PAGE
1.1 Map of The Belt and Road Initiative 6
2.1 Distribution of high-tech regions in China 10
2.2 Future high-speed rail system connecting Changsha with the “Belt and Road” 12
2.3 Political boundary of Changsha and Location of the new town 13
2.4 Yuelu Academy starting from Song Dynasty 14
4.1 Outdoor concert in Austin 20
8.1 Fireworks with digital technology in Changsha 53
LIST OF CHARTS PAGE
2.1 Industrial structure of Changsha 11
2.2 Percentage of people working in different industries 12
6.1 Frequency of age 30
6.2 Frequency of Year of graduation 31
6.3 Frequency of Household size 31
6.4 Distribution of registered permanent residence 32
6.5 Frequency of job area 33
6.6 Frequency of expected lowest salary 33
6.7 Degree of satisfaction with different aspects of Changsha 34
6.8 Opinions about the TOD project in Changsha 36

Lingran Meng lm3193
5
LIST OF TABLES PAGE
5.1 List of variables 27
6.1 Average degrees of satisfaction 35
6.2 Factors that the talents care most about 35
6.3 Multivariate correlation result 37
6.4 Factors with top five high correlation with “Willingness to work in Changsha” 38
6.5 Chi-Squared Test 1: “Registered permanent residence” and “Willingness to
work in Changsha”
40
6.6 Chi-Squared Test 2: “Direct relative outside Hunan” and “Willingness to work
in Changsha”
41
6.7 Chi-Squared Test 3: “Expected lowest salary” and “Willingness to work in
Changsha”
42
6.8 Chi-Squared Test 4: “Cultural and recreational activities” and “Willingness to
work in Changsha”
43
6.9 Chi-Squared Test 5: “Climate” and “Willingness to work in Changsha” 44
6.10 Regression Test: “Lowest salary expected/1000” and “Willingness to work in
Changsha”
45
6.11 Comparison between factors participants with and without Hukou of Hunan
care about
46

Lingran Meng lm3193
6
TABLE OF CONTENTS
1. INTRODUCTION .................................................................................................................7
2. BACKGROUND INFORMATION ....................................................................................10
2.1 High-Tech Region ................................................................................................................10
2.2 The City of Changsha ...........................................................................................................12
3. PROBLEM STATEMENT ..................................................................................................16
3.1 Problems of High-Tech New Town Planning in China .......................................................16
3.2 Questions to be Solved .........................................................................................................17
4. LITERATURE REVIEW ....................................................................................................18
5. METHODOLOGY AND DATA COLLECTION ...............................................................24
5.1 Organization of Research .....................................................................................................24
5.2 Research Methods ................................................................................................................26
6. PRIMARY DATA RESULTS AND DATA ANALYSIS ..................................................30
6.1 Descriptive Statistics ............................................................................................................30
6.2 Further Survey ......................................................................................................................35
6.3 Correlation Analysis .............................................................................................................37
6.4 Cross Tabulation and Chi-Square Test .................................................................................39
6.5 Regression Analysis .............................................................................................................44
6.6 Comparison between Participants with and without the Hukou of Hunan .........................45
7. RESULT DISCUSSION ......................................................................................................47
8. CONCLUSION AND RECOMMENDATIONS ................................................................50
8.1 Suggestions for Changsha ....................................................................................................50
8.2 Limitations and Recommendations ......................................................................................52
REFERENCES ........................................................................................................................54
APPENDIX ..............................................................................................................................56

Lingran Meng lm3193
7
1. INTRODUCTION
In 2015, The Belt and Road Initiative (BRI) was proposed by the Chinese government. BRI is a
development strategy that focuses on connectivity and cooperation between Eurasian countries,
primarily the People’s Republic of China (PRC), the land-based Silk Road Economic Belt (SREB)
and the ocean-going Maritime Silk Road (MSR) (Belt and Road Portal, 2018). Figure 1.1 shows
the map of BRI. The Belt and Road Initiative carried out by the Chinese government also
contended the target of booming up the cities in central and western China. High-speed rail lines
are going to connect these cities with coastal areas while high-tech new towns will be built around
these new high-speed rail stations. One of the functions of these new towns is to lead immigration
of talents and relieve the overpopulation of China’s South-East coastal areas.
Figure 1.1 Map of The Belt and Road Initiative
(Agenda Invest, 2017)

Lingran Meng lm3193
8
Changsha is a second-tier city in the middle part of China. In this paper, I am going to use Changsha
as a case study to find out how the cities in central China could attract relevant talents. Firstly, I
will introduce the background of high-tech regions and the industry structure of Changsha.
Secondly, I am going to look into literature reviews about factors that influence the decision of
knowledge workers in choosing a location to live and work. And then, researches will be generated
on Changsha in order to get the key factors that attract knowledge workers to high-tech regions.
Finally, a series of advice for crafting policies will be provided to Hunan government to achieve
those factors in China.
The research can be divided into eight chapters.
Chapter 1 Introduction: This chapter generally introduced the idea and objective of this research.
Chapter 2 Background Information: This chapter provides the background information about the
development of high-tech regions in China and around the world. It also introduced the city of
Changsha as well as its significant position for the “Belt and Road” plan of China.
Chapter 3 Problem Statement: This chapter is going to mention the problems Chinese government
have when planning for the development of high-tech new towns, especially the difficulties of
attracting local universities graduates to live and work. The research question of this study is stated.
Chapter 4 Literature Review: The proper studies which can be used to form the theoretical basis
of the research is going to be mentioned including the ‘Job versus People’ debate, some previous
studies about “factors that influence the decision of knowledge workers in choosing a location to

Lingran Meng lm3193
9
live and work” and the successful experience of Austin in the United States.
Chapter 5 Methodology and Data Collection: The methodology of the research in this research is
going to be discussed in details in this chapter. In addition, the range and method of data collection
for this study is introduced and the reasons are explained.
Chapter 6 Research Findings and Data analysis: The constitution and categories of participants are
generally mentioned. And then, the result acquired from the Regression Model including
Correlation, Chi2-test, R2, F-test and T-test are presented and the exact relationship between
different variables and knowledge workers’ decisions to work in Changsha is analyzed.
Chapter 7 Result Discussion: The findings from the data analysis, which reflected the situation of
Changsha is compared with that of Austin. The discussions about whether the policies for
attracting creative class in Austin can be useful for the development of Changsha as well as many
other developing cities in China are generated.
Chapter 8 Conclusion and Recommendations: The findings in this research are concluded.
Moreover, limitations and recommendation of the research are provided for further study.

Lingran Meng lm3193
10
2. BACKGROUND INFORMATION
2.1 High-Tech Region
The United Nation categorized industries into three levels, primary industry, secondary industry
and tertiary industry. Primary industry includes agriculture, forestry, animal husbandry and
fishery; secondary industry includes manufacturing, excavation, construction works, energy and
resources, and medical care; tertiary industry includes business, finance, transportation,
communication, education, services and other non-material production sectors.
According to the Ministry of Science and Technology of China (2017), high-tech industry is an
industry based on high and new technology. The enterprises of high-tech industry engage in the
research, development, production and technical services of one or more high and new technology
as well as their product. The dominant technology of the product must belong to the identified high
technology field, and it must include the technological breakthrough in the field of high
technology. High-tech industry is a knowledge-intensive and technology-intensive industry,
different from the traditional labor-intensive industry. It mainly includes three fields: information
technology, biotechnology and new material technology. High-tech industry could largely change
the industrial structure of society. With the development of it, there is going to be more people
working for tertiary industry while less people working for secondary industry.
After the Second World War, countries around the world devoted themselves to industrial
development such as timber and steel manufacturing and processing. Cities and metropolitan
regions were also formed and developed basing on the location of large-scale industries. Until the
1970s, with the structural transformation of the economy, traditional industries were gradually

Lingran Meng lm3193
11
replaced by the high-tech industries. As a result, the development of industrial estate has been
upgraded to the development of high-tech regions.
China National High-tech Industrial Development Zone (China high-tech zone) is the state-level
science and technology industrial park approved by the state council of the People’s Republic of
China. The target is to develop high-tech industry, adjust industrial structure, promote the
transformation of traditional industries and enhance international competitiveness. Starting from
1988, China has gradually set up 157 planned high-tech zones in 22 provinces, 4 autonomous
regions and 3 municipalities (ACHIE, 2017). Figure 2.1 shows the distribution of these high-tech
zones. These 157 high-tech zones are helping regional economic development and cooperate with
each other in large-scale projects.
Figure 2.1 Distribution of high-tech regions in China
(Ministry of Science and Technology, 2017)
Lingran Meng lm3193
12
These high-tech regions are making significant contributions to the GDP of China, especially those
in first-tier cities like Shenzhen and Chongqing. (According to South China Morning Post (2013),
China has 613 cities which are usually divided into four tiers. All first-tier cities have a GDP over
$US300 billion. Most of them are in coastal areas of China. The second tier includes cities with
GDP between US$68 billion and US$299 billion.) In the “Belt and Road” initiative carried out in
2015, the Chinese government emphasized the importance of developing second-tier cities in
central and western China. They hope that high-tech new towns could be built in these cities basing
on high-tech regions and high-speed-rail lines.
2.2 The City of Changsha
One of these target cities is Changsha, the capital of Hunan province. Geographically, Changsha
is located in Central and Southern China. It occupies 12,000km2 and with a population of 7.6
million.
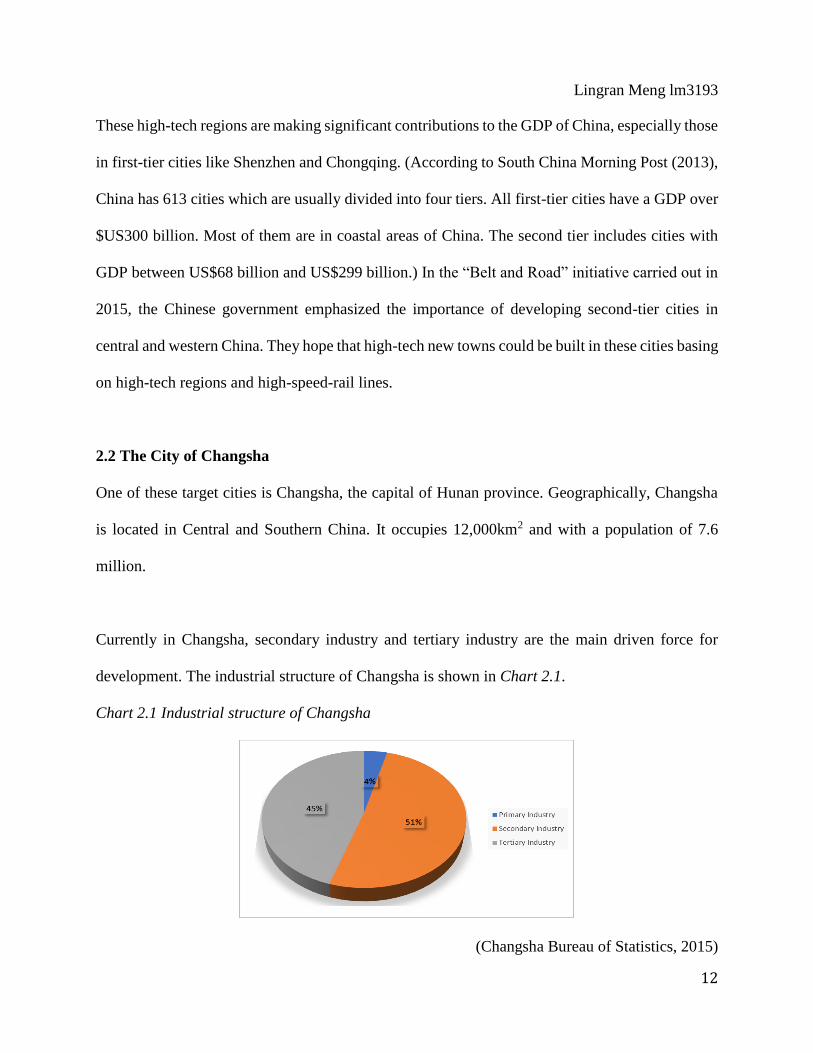
Currently in Changsha, secondary industry and tertiary industry are the main driven force for
development. The industrial structure of Changsha is shown in Chart 2.1.
Chart 2.1 Industrial structure of Changsha
(Changsha Bureau of Statistics, 2015)

Lingran Meng lm3193
13
Until the end of 2015, there are 847,560 people working in Changsha. There average annual
income of them is 71,452 RMB. Percentage of people working for different industries is presented
in Chart 2.2.
Chart 2.2 Percentage of people working in different industries
(Changsha Bureau of Statistics, 2015)
Different from coastal cities, Changsha has no advantages to get access to large-scale import and
export trades. Until in the “Belt and Road” initiative, the central government pointed out the new
role Changsha is going to play. There is going to be a high-speed rail line connecting Changsha
with Chongqing, a significant city of “The Silk Road Economic Belt”, and Xiamen, a harbor of
“21st-Century Maritime Silk Road” (Figure 2.2).
The new high-speed rail station to carry this line is being built in west Changsha and a transit-
oriented new town is going to be developed around this station (Figure 2.3). According to the
General Planning Text of Changsha, Changsha is going to play an important role for innovation
and high-tech development in China. Therefore, the Hunan government plans to make high-tech
and financial industries the main industries to drive the development of this new town and to make
this new town a high-tech region. The development of this region will be based on the high-tech
zone originally set up in Changsha early in the 1990s.

Lingran Meng lm3193
14
Figure 2.2 Future high-speed rail system connecting Changsha with the “Belt and Road”
(CMA CGM LOG, 2017)
Figure 2.3 Political boundary of Changsha (blue) and Location of the new town(yellow)
(REDNET, 2017)
With the up-scaling of high-tech zone, more knowledge workers for tertiary industry will be
required. Therefore, talents will be important for the future economic development of this new
town as well as the whole city. Because of Changsha’s position as a transit hub of central and
western China in the future, the transportation between it and the first-tier cities in China’s South-

Lingran Meng lm3193
15
East coastal areas will be more convenient. As every coin has two sides, there is going to be two
possible results because of the convenient transportation. Either more talents will immigrate to
Changsha, or talents now living in Changsha choose to immigrate to coastal areas for high salary
and better job opportunities. At the same time, many other cities in the middle part of China are
trying to use high-tech industry to attract talents. Changsha has to find its advantage to compete
with these cities.
The Yuelu Academy set up early in Song Dynasty was the earliest public education academy in
the history of China (Figure 2.4). Ever since then, Changsha has been a city famous for higher
education. Currently in Changsha, there are 51 universities with totally 590 thousand students
pursuing their degrees. 55 thousand of these students are graduate students. Every year, students
from different parts of China come to Changsha for education. If some of these students choose to
live and work in Changsha after graduation, they could possibly become a good source of talents
for the development of this city.
Figure 2.4 Yuelu Academy starting from Song Dynasty
(WikiVisually, 2014)
Lingran Meng lm3193
16
3. PROBLEM STATEMENT
3.1 Problems of High-Tech New Town Planning in China
Site selection, related government policies as well as zoning are probably of equal importance as
the high-tech industry itself for the development of these high-tech regions. These factors also
decided whether this region could become attractive to the relevant talents. For example, if there
is no land for the rental housing development around, it will be difficult for most young working
class to afford the living.
Today, the Chinese government and private enterprises are developing a large number of high-
tech new towns. In the process of urban and regional planning in China, the central government is
responsible for carrying out general development strategies while local authorities are responsible
for the implementation of strategies. They cooperate with design institutions and private
contractors to make detailed designs according to the instruction from the central government. The
problem is that the development plans for the high-tech new towns carried out by China’s National
Development and Reform Commission, which is part of the central government, are lack of
assistance studies about detailed strategies from the citizens’ perspectives. Sometimes, the Chinese
government just let the design institutions handle the plans and try to pick the most visually
impressive one.
Therefore, the research question is “What are the key factors that attract knowledge workers to
high-tech regions and the feasibility of crafting policy to use these factors in China?” The
hypothesis is that apart from Hukou, high salary, and good job opportunities, talents also care
about the abundant cultural and recreational activities.

Lingran Meng lm3193
17
In China, Hukou is a household registration record officially identifies a person as a resident of an
area. It is also called registered permanent residence. Only with the Hukou of an area can people
be permitted to get access to local social welfares including education for children, medical
insurance, and public housing, etc. Therefore, it is a factor largely limiting people’s decisions on
where to work and live (Project partner, 2018).
3.2 Questions to be Solved
In order to arrive at a better understanding of what governments need to know when they are
planning for new high-tech regions in second-tier cities and striving to attract talents, this thesis
reached the following questions.
1. Is there any successful case of human resource development in U.S. cities?
2. What policies and plans did this city carry out to attract knowledge workers?
3. Why do knowledge works stay in or leave Changsha?
4. What are the factors knowledge workers care most about Changsha?
5. Are these factors similar to or different from that of the U.S. city?
6. Is it possible for China to learn from the policies and plans helpful for human resource
development in the U.S. city?
7. What policy and plans should the Chinese government craft to help with the human
resource development in Changsha?

Lingran Meng lm3193
18
4. LITERATURE REVIEW
High salary and better job opportunities are probably not always the only factors for cities and
regions to attract high-tech talents. In the United States, Silicon Valley is the largest and the most
well-known high-tech region with the longest history. It has been attracting knowledge workers
and making great contributions to the development of science and technology around the world.
However, recent years, some phenomenon reflected that the development of Silicon Valley is now
facing problems. With the tremendous development in high-tech industries, most of the other
industries are shrinking. Cities like San Francisco is losing artists, teachers, and the energetic
culture. At the same time, due to the crucial increase in property price, a large number of IT talents
are trying to move away from the Bay Area. The rent of a studio in San Francisco can be as high
as 3,500 dollars per month.
Comparing to the Silicon Valley, a number of newly developed high-tech regions are trying to
avoid these problems during its development. According to Forbes (2017), two thirds of the talents
in the Silicon Valley believe that it is not necessary for them to continue to work in the Silicon
Valley and they have the willing to move to other cities. Forbes (2017) also mentioned that five
other cities in the United States are having the tendency to replace the Silicon Valley and become
new high-tech centers. The five cities are Salt Lake City, Denver, Atlanta, Portland and Seattle.
It seems that comparing with Silicon Valley, most of these newly developed high-tech regions
have lower housing price and better cultural environment. At the same time, due to the increasing
job opportunities, important traffic location and pleasant climate, these cities are successfully
attracting high-tech talents.

Lingran Meng lm3193
19
Among these five cities, Salt Lake City was recently ranked by Entrepreneur as the top city to start
up business other than San Francisco or New York City. Vaughn Aust, EVP of marketing and
product at MarketStar, believed that his company’s success should be attributed to its superior
relocation in the suburb of Salt Lake City. Aust also praised the city’s “stable workforce, top-
ranking tech universities, low cost of living, attractive climate, low crime rate, and family-friendly
atmosphere” (Fatemi, 2017).
Drawn by expanding tech workplaces and dozens of growing startups, nearly half of California
high-tech workers planned to immigrate to places like Denver, according to a survey of 100
participants (ABODO, 2016). Scott Heimes, the chief marketing officer of SendGrid in Denver,
hold the opinion that the city’s other unique qualities, including its vivid landscape, activities and
outdoorsy culture also contributed to its attraction.
The phenomenon in Silicon Valley reminded me of the debate on “job versus people”, which is a
question about whether people bring jobs to a city or job opportunities attract people to a city.
Richard Florida (2003) held the opinion that “highly educated individuals were drawn to places
that were inclusive and diverse” and it should be these highly educated individuals that promote
“combinations of resources and ideas” and spur economic growth. Thus, as Florida (2003)
concluded, “Places that are home to large concentrations of the creative class tend to rank highly
as centers of innovation and high-tech industry”.
When Michael Storper et al. (2015) tried to examine how differences in the labor markets of
metropolitan Los Angeles and San Francisco contribute to their wage divergence, he got a different

Lingran Meng lm3193
20
conclusion. He draws on a wide range of hypotheses from urban economics, labor economics,
regional science, and other fields and discovered that more motivated and productive workers are
attracted to the bay area due to the perceived opportunities in the New Economy. Amenities are
probably nowhere strong enough to affect migration patterns. However, he also mentioned that
differences in wages cannot be the only force causing the divergence.
Based on this debate, Mohan Thite (2011) provided a theoretical framework to look for factors
that affect the decision of knowledge workers when choosing a location to live and work. He
identified “Quality of place and life”, “Regional sustainability” and “Learning cities” are main
factors attracting knowledge workers to a place. “Regional sustainability” depends on social and
cultural infrastructure that solve problems and promote the economic and social well-being, which
in China can generally be guaranteed by the government. “Learning cities” means areas in which
firms are clustered together around related products and ideas, which will be achieved within high-
tech new towns. “Quality of place and life” includes community safety, affordable housing, public
transportation and lifestyle amenities etc. Both “on- and off-the-job factors” are influencing talent
attraction. When looking into the reason for those five cities to have the tendency to replace Silicon
Valley, the factors mentioned by Thite can also be identified.
A good example of the booming of high-tech cities is Austin in Texas, the U.S. Similar to
Changsha in China, Austin is the capital of Texas located in the middle part of the United States.
There are also significant transit lines passing through this city connecting the eastern and western
parts of the country. The booming up of this city was quite impressive. Austin successfully
transformed from a manufacture of cotton and livestock to a high-tech-based city and ranked third

Lingran Meng lm3193
21
in the “2002 World Knowledge Competitiveness Index – a study 300 cities around the world”
(Michaud and Tcheremenska, 2003). Its advantages in risk investment and human resource
development made it even more attractive than cities like New York and San Francisco. U.S News
& World Report (2016) mentioned that within the past five years, the population of Austin
increased by about 9%.
As a city whose pillar industry was technology and computer science, the development of Austin
benefited a lot from knowledge workers graduated from University of Texas. Realizing the
importance of the “creative class”, the city carried out the “Austin 2010 Plan” to develop its urban
and cultural life in ways that would attract and retain knowledge workers. It started to consider the
“people climate” and one of its initiatives was the promotion of its legacy of music.
Figure 4.1 Outdoor concert in Austin
(Visit Austin, 2018)
Austin also improved the quality of place in the provision of “stylish built environment(s),
extensive city parklands, conservation of natural surroundings, a rich variety of cultural
institutions, quality affordable housing, hospitals, schools and universities and an efficient traffic
system”. Benefiting from the pleasant climate of the city, Austin also promote human activities
like outdoor recreation opportunities and vibrant nightlife (Figure 4.1). (Yigitcanlar, 2007)

Lingran Meng lm3193
22
The example of Austin can possibly be relevant for China because the economy scales of these
two countries are of similar scale and the population of China and the US are both increasing. A
more important reason is that similar to Austin, most of the development plans for high-tech new
towns in China are at the transportation hubs in the central part of China instead of coastal areas.
The Chinese government expects that the development of these high-tech new towns could drive
immigration to these regions, and thus help with the carrying out of the “Belt and Road” plan.
Moreover, both Changsha and Austin have high-quality universities, students of which are from
all over the country. These universities are the main source of high-tech talents for the city.
I hope that this study could find out the factors knowledge workers currently care about in Chinese
second-tier cities, learn from the high-tech region development in Austin and make improvements
during the planning of these new towns in China, so that these planned high-tech regions could
successfully attract talents and relieve the pressure of those metropolitan areas in Coastal Areas of
China.
On the basis of the data derived from “China's 2005 1% population sample survey”, Liu and Shen
(2014) examines regional and personal factors that shape location choices of China's
“interprovincial skilled migrants”. Their conclusion of China seems to be different from that
concluded from the booming high-tech cities in the United States. The findings suggest that within
the first half of 2000s, China's skilled workers make their immigration decisions based on salary
more than amenity-related issues of the location. At the same time, institutional arrangement
(Hukou) continue to affect interregional movements of skilled labor in China.

Lingran Meng lm3193
23
However, Liu and Shen (2014) also pointed out that China's skilled migrants might place more
importance on amenity-related issues after the 2010s, partly because of the increasingly wealthy
of professional and managerial staff and change in people's values about work-life balance. They
believed that further studies could be carried out to examine whether amenities play an increasing
role in shaping skilled migrants' destination choices by using the upcoming 2010 census data.
Additionally, in their study, “interprovincial skilled migrants” are defined as “those who have a
tertiary education qualification and whose current province of residence is different from 5 years
ago”. These years, China is transforming its pillar industry from manufacturing industry to high-
tech industries. As the idea gradually changed from “made in China” to “created in China”, “high-
tech knowledge workers” are taking the place of “skilled migrants” and becoming the main driving
force for science and economic development. This group of talents are usually even more highly
educated and their requirements could possibly be different.
In this paper, the study bases on the basic theories from the “job versus people” debate and use the
theoretical framework of “factors that influence the decision of knowledge workers in choosing a
location to live and work” provided by Thite. Liu and Shen’s study told us the factors that shape
location choices of China's interprovincial skilled migrants and mentioned the possibility of
change in the following years. They also indicated the requirement of further research to find out
the change in the role of amenities. The cases of Austin in the United States could tell what policies
and plans the United States government have carried out to improve those particular factors and
lead the further analysis on whether similar policies and plans can be effective in the urban
planning in China.

Lingran Meng lm3193
24
5. METHODOLOGY AND DATA COLLECTION
5.1 Organization of Research
After looking into the background information of Changsha and the successful case in Austin in
terms of plans and policies related to housing affordability, amenity related issues and income
level that benefited talent attraction in Austin. I am going to focus on the case of transit oriented
new town development in Changsha, China, to discuss about what policies the Chinese
government should carry out and what planners can do in order to attract talents to help with the
development of this city. I will also discuss whether Changsha could learn something from
examples in the United States when carrying out policies and plans that could be helpful with
knowledge worker attraction.
In order to accomplish such a study, I firstly selected the main factors in high-tech regions that
have impacts on the attraction to knowledge workers. And then I carried out a qualitative research
about Changsha. To achieve the qualitative research, I sent out online questionnaires to ask the
newly graduate students and the students who are going to graduate about what are the factors
attracting them to work in this city and what is not. For example, I asked a final year master’s
degree student learning computer science in Changsha whether he is going to work in Changsha
and the reasons. The sample is going to be a hundred graduate students from two top universities
governed by the Ministry of Education of the People's Republic of China in Changsha. This sample
size could possibly avoid contingency be enough for a correlation test. The sampling method is
stratified sampling, making sure that students from different provinces and different majors are
included.

Lingran Meng lm3193
25
In Liu and Shen’s former study, the variables are in three aspects - income levels, amenity-related
issues and Hukou. The variables used by Liu and Shen (2014) include “Average wage”,
“Unemployment rate”, “Temperature severity index”, “Average annual precipitation”, “Average
relative humidity”, “Number of university students”, “Number of qualified doctors”, “Number of
museums, public libraries, cultural centers, and performance venues”, “Areas of public green
lands”, “Share of state-owned and State-controlled enterprises”, “Foreign direct investment”,
“Share of living expenditure in disposable income” and “Hukou”.
In this study, however, the research method changes from quantitative to qualitative and the
research objects change from the provinces of China to individuals. Therefore, while continue to
focus on the three aspects mentioned by Liu and Shen (2014), the variables are adjusted to Hukou,
Job type, Family reasons, High-tech and financial development, Salary level, Housing
affordability, Daily life affordability, Education for children, Recreational facilities and activities,
Parks and open space, Climate and Air quality. The main factors related to the successful human
resource development of Austin are also included in these variables. In the questionnaires, the
questions are generated in order to get these variables mentioned. Questions are mainly multiple
choices. Participants can make their choice from the scale 1 to 3 to show their evaluation of a
particular factor in Changsha. They also need to tell the area of their majors and information about
their household registration on the questionnaires. Data is collected from their answer to the
questions.

Lingran Meng lm3193
26
5.2 Research Methods
This report aims to observe factors that affect the young talents’ decisions on whether to live and
work in Changsha after graduating from a university in Changsha. The unit of analysis is an
individual. The following variables are chosen to explain their decisions. Besides demographic
variables, ten other variables were chosen as listed in the table below. The research is going to find
out whether the demographic characteristics of age, year of graduation, gender, household size,
registered permanent residence (Hukou), whether have direct relatives outside Hunan province,
expected job area, lowest salary expected, education level and admission status to jobs would
affect the individual’s decision to work in Changsha after graduation.
This study is also going to discover whether a university graduate student with higher degree of
satisfaction of Changsha in terms of “High-tech industries”, “Financial industries”, “Salary level”,
“Housing affordability”, “Daily life affordability”, “Education for children”, “Cultural and
Recreational activities”, “Parks and open space”, “Climate” and “Air quality” may tend to work
there after graduation. These factors could potentially affect their decisions to work in Changsha
because after graduating from a university in Changsha, a person could choose to work and live in
this city if he is satisfied with several particular aspects of the city. The result of research may be
affected by human factors but it would generally reflect the tendency of university students in
Changsha. Their impressions of each of these variables were reflected in the scale of three levels
of satisfaction from dissatisfy to satisfy, which is easier for the participants of the survey to make
their choice.

Lingran Meng lm3193
27
Table 5.1 List of variables
# Variable Name Description Variable
Type
Unit of
Analysis
1 Willingness to Work in
Changsha (dependent)
Yes or no Dichotomous 0 or 1
2 Age Years alive Continuous Years
3 Gender Whether the participant is female Dichotomous 0 or 1
4 Year of Graduation The year in which the participant
graduated or expected to graduate
Continuous Year
5 Household Size Family members Continuous Number
6 Registered Permanent
Residence
The Province where the
participant’s Hukou is
Categorical NA
7 Direct Relative outside
Hunan Province
Direct relatives including parents,
(future) spouse, offspring and
siblings
Dichotomous 0 or 1
8 Education Level Whether the participant has
graduate or professional degree
Dichotomous 0 or 1
9 Job Area (Expected) Job area of the
participant
Categorical NA
10 Lowest Salary Expected Participant’s lowest expected
income per month (thousand
RMB)
Scale Number
11 Admission to a Job Whether the participant has
already been admitted to a job
Dichotomous 0 or 1
12 Target Province for Work The province in which the
participant is willingness to work
and live
Categorical NA

Lingran Meng lm3193
28
13 High-tech industry (A)
Participants rate for these aspects
of Changsha basing on their own
impression of the city.
Scale 1, 2 or 3
14 Financial industry (B)
15 Salary level (C)
16 Housing affordability (D)
17 Daily life affordability (E)
18 Education for children (F)
19 Cultural and recreational
activities (G)
20 Parks and open space (H)
21 Climate (I)
22 Air quality (J)
23 Transformed registered
permanent residence
Whether the Hukou of participant
is within Hunan province
Binary 0 or 1
24 Transformed lowest salary
expected
The lowest monthly salary
expected comparing to 10,000
RMB
Binary < or >=
As the dependent variable is a dichotomous variable, which only has the answer of “Yes” or “No”,
two of the independent variables are transformed into binary type, which only has two types of
response, in order to make data analysis more convenient.
A survey was created to collection primary data. It was issued to individuals who have graduated
in recent years or will graduate in the following years from top universities in Changsha online
through the Tencent Questionnaire Platform on Thursday, January 11, 2018 11am Beijing time.
Lingran Meng lm3193
29
And the collection period was from January 11 to February 20, 2018. Since the target participants
were all Chinese people, a Chinese version of the questionnaire was created. The questionnaire
formats in both languages are shown in Appendix I.
In total, within the period of reclamation, 130 survey samples were collected. This primary data
was then transcribed, and discrepancies and nonresponse errors in the results were cleaned using
the following methodology. Samples in which the participant’s university was not in the city
Changsha (some respondents misunderstood the recruitment statement of the questionnaire, in
which the experience of pursuing a university degree in Changsha is a necessary requirement) were
removed from the sample population. In addition, samples with no response to survey questions
were also excluded. Some respondents, who included answers out of the target range of data
analysis, were also removed from the sample. For example, the age of some respondents was under
sixteen or over thirty. Some of them were graduated before 2014 or after 2023. In these cases, the
exact result of the variable could not be acquired, making it impossible for accurate statistics. After
the data was cleaned, the resulting sample population consisted of 116 surveys. All the variables
can be used in data analysis due to sufficient number of responses. The average time for these 116
questionnaires to be finished was 4 minutes and 25 seconds, which was within the estimation of 5
minutes.

Lingran Meng lm3193
30
6. PRIMARY DATA RESULTS AND DATA ANALYSIS
6.1 Descriptive Statistics
Descriptive statistics were generated to look at the following independent variables: “age”, “year
of graduation”, “household size”, “registered permanent residence”, “direct relative outside Hunan
province”, “education level”, “job area”, “lowest salary expected”, “admission to a job”.
After inputting the data into Excel for preliminary analysis, results were obtained as following.
The sample has an average age of 22.81, an average year of graduation in 2018.24, an average
household size of 3.72, and an average lowest salary expectation of 11.36. 43% of the participants
were male while 57% were female.
Chart 6.1 showed the distribution of “age”, which is between 17 and 29. It is apparent that the
variable of “age” is a normal bell curve skewing slightly to the right. The majority of the
participants were between 21 and 24.
Chart 6.1 Frequency of age
As all the participants have entered universities in Changsha, the education level was only
separated into two groups, undergraduate and graduate. The result showed that 40% of are
pursuing or have obtained graduate degree.

Lingran Meng lm3193
31
The year of graduation varied from 2015 to 2022, and it almost evenly distributed between year
2017 and 2020 (Chart 6.2). This frequency of graduation year reflected the fact that some of the
participants have graduated for less than three years while others will graduate within 4 years.
Participants have not graduated are facing the decision of where to work and live. Participant that
have graduated and worked for less than three years are possibly still changing their decisions.
Chart 6.2 Frequency of Year of graduation
In Chart 6.3 depicting the frequency of household size, the variable varied between 2 and 7. Due
to the “one child policy”, “household size” became the most skewed variable and about half of the
participants have a household size of three. For the families with more than three households, some
of them may have more than one children, some of them are probably living together with
grandparents.
Chart 6.3 Frequency of Household size
Lingran Meng lm3193
32
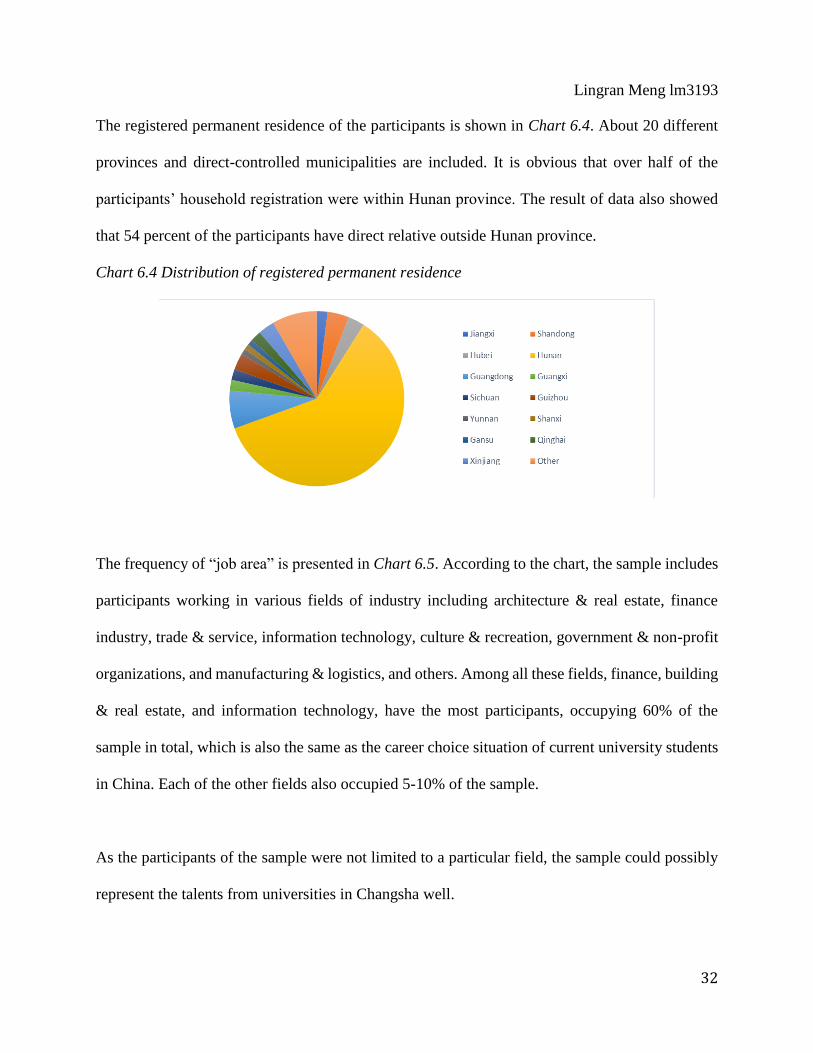
The registered permanent residence of the participants is shown in Chart 6.4. About 20 different
provinces and direct-controlled municipalities are included. It is obvious that over half of the
participants’ household registration were within Hunan province. The result of data also showed
that 54 percent of the participants have direct relative outside Hunan province.
Chart 6.4 Distribution of registered permanent residence
The frequency of “job area” is presented in Chart 6.5. According to the chart, the sample includes
participants working in various fields of industry including architecture & real estate, finance
industry, trade & service, information technology, culture & recreation, government & non-profit
organizations, and manufacturing & logistics, and others. Among all these fields, finance, building
& real estate, and information technology, have the most participants, occupying 60% of the
sample in total, which is also the same as the career choice situation of current university students
in China. Each of the other fields also occupied 5-10% of the sample.
As the participants of the sample were not limited to a particular field, the sample could possibly
represent the talents from universities in Changsha well.

Lingran Meng lm3193
33
Chart 6.5 Frequency of job area
In Chart 6.6 depicting the frequency of lowest salary expected by the participants, there is a curve
skewing to the right. It also indicated a widely varied monthly salary expected varying between as
low as 2.5 thousand RMB and 30 thousand RMB. It is quite interesting that there is an outlier at
30 thousand RMB a month, which might be related to the salary gap between different industries.
Chart 6.6 Frequency of expected lowest salary (RMB/month)
Among the 116 effective surveys, 45 participants have already got their job offers while 71 of
them have not. 46 participants are willingness to work and live in Changsha while the other 70
participants are going to choose other provinces. As this is a case study focusing on Changsha, I
am not going to mention the details of cities participants are going to work in.

Lingran Meng lm3193
34
Participants graded the ten aspects of Changsha with “1, 2, 3”to reflect their level of satisfaction.
“1” means the least satisfied while “3” means the most satisfied. Referring to the following
histogram, talents from universities in Changsha are generally satisfied with “Housing
affordability”, “Daily life affordability”, “Education for children”, “Cultural and recreational
activities”, and “Parks and open space”, while dissatisfied with “High-tech industry”, “Finance
industry”, “Salary level”, “Climate”, and “Air quality”.
Chart 6.7 Degree of satisfaction with different aspects of Changsha
A. High-tech industry
B. Financial industry
C. Salary level
D. Housing affordability
E. Daily life affordability
F. Education for children
G. Cultural and
recreational activities
H. Parks and open space
I. Climate
J. Air quality
According to Chart 6.7, cultural and recreational activities got the most “3” (75%) and the least
“1” (1.7%). Salary level in Changsha got the least “3” (4.3%) while climate got the most “1”
(37.9%).
The average degrees of satisfaction with the ten aspects of Changsha mentioned in the
questionnaire are presented in the Table 6.1. “Cultural and recreational activities” got the highest
grade while “Climate” got the lowest grade.

Lingran Meng lm3193
35
Table 6.1 Average degrees of satisfaction
A B C D E F G H I J
2.08 1.89 2.16 2.15 2.26 2.31 2.59 2.40 1.72 1.78
A. High-tech industry
B. Financial industry
C. Salary level
D. Housing affordability
E. Daily life affordability
F. Education for children
G. Cultural and
recreational activities
H. Parks and open space
I. Climate
J. Air quality
6.2 Further Survey
Some further surveys were carried out to let the participants prioritize the three objective factors
they care most about. The frequency for them to prioritize the factors as first, second, and third
important is listed in Table 6.2.
Table 6.2 Factors that the talents care most about
A B C D E F G H I J
1 24 9 38 16 6 3 4 0 7 9
2 3 9 25 25 17 8 8 1 9 11
3 4 2 11 19 16 21 14 0 11 18
Total 31 20 74 60 39 32 26 1 27 38
A. High-tech industry
B. Financial industry
C. Salary level
D. Housing affordability
E. Daily life affordability
F. Education for children
G. Cultural and
recreational activities
H. Parks and open space
I. Climate
J. Air quality
According to the result, salary level and housing affordability are the factors talents care most
about when choosing a city to work and live. Next to these two factors, daily life affordability, air
quality, education for children and high-tech industry are of similar importance. And it seems that
they do not care much about the access to parks and open spaces in a city at current stage.

Lingran Meng lm3193
36
Participants were also inquired about their opinion about the High-Speed Rail Station in west
Changsha that is going to become the connection point of the Belt and the Road as well as the
transit-oriented project around it. The result (Chart 6.8) shows that 42.2% of the participants have
never heard about the project. Within the 57.8% participants who have already known about the
project, over three quarters showed a positive attitude. They believed that this project could help
attracting more talents to Changsha.
Chart 6.8 Opinions about the TOD project in Changsha
At the end of the survey, there was an open question asking the participants about their personal
advice to the development of Changsha. Thirteen of the participants gave out quite feasible advice.
One participant firstly praised the education of Changsha, and then stated that Changsha does not
have enough job opportunities for talents with university degrees. Three other responses advised
that Changsha should invite more investment for various large-scale industries in order to provide
more job opportunities. Two participants believed that Changsha should put more effort to the
planning of road transportation and sidewalk beautification in order to make the appearance of the
city more attractive. Five of the responses pointed out the importance of stabilizing housing price,
commodity price as well as social welfares. Five other responses mentioned that instead of
following the steps of first-tier cities, as a second-tier city, Changsha should try to be more

Lingran Meng lm3193
37
localization and make art, sports, and entertainment its cultural specialty.
6.3 Correlation Analysis
In order to preliminarily discover the degree of relationship between “Willingness to work in
Changsha” and other variables, correlation analysis is carried out. The larger absolute value
correlation coefficient between two variables has, the higher degree of correlation exists.
Table 6.3 Multivariate correlation result
A. High-tech industry
B. Financial industry
C. Salary level
D. Housing affordability
E. Daily life affordability
F. Education for children
G. Cultural and
recreational activities
H. Parks and open space
I. Climate
J. Air quality

Lingran Meng lm3193
38
According to the multivariate correlation test result (Table 6.3), variable “Willingness to work in
Changsha” had the highest positive correlation coefficient with “Transformed registered
permanent residence”. “Cultural and recreational activities (G)” had the second highest positive
correlation coefficient with “Willingness to work in Changsha” while “Climate (I)” had the third
highest correlation. “Direct relative outside Hunan province”, and “Lowest salary expected” are
ranked after it with negative relationships to “Willingness to work in Changsha”.
“Willingness to work in Changsha” has a low correlation with “Age”, “Gender”, “Household
size”, “Education level”, “Admission to a Job”, “High-tech industry (A)”, “Financial industry (B)”,
“Daily life affordability (E)”, and “Education for children (F)”. Detailed correlation coefficients
are presented in the table below. The low correlation between “Willingness to work in Changsha”
and “Admission to a job” tell us that even if some of the participants had already found a job in
Changsha, they are still changing their decisions and will possibly leave Changsha.
Table 6.4 Factors with top five high correlation with “Willingness to work in Changsha”
1 2 3 4 5
Registered
permanent residence
Cultural and
recreational
activities
Climate Direct relative outside
Hunan province
Lowest salary
expected
However, the correlation coefficient between “Transformed registered permanent residence” and
“Direct relative outside Hunan province”, the correlation coefficient between “Transformed
registered permanent residence” and “Cultural and recreational activities (G)”, the correlation
coefficient between “Transformed registered permanent residence” and “Climate (I)”, and the
Lingran Meng lm3193
39
correlation coefficient between “Cultural and recreational activities (G)” and “Climate (I)” were
also relatively high. Among all these variables, “Age” had the lowest correlation coefficient with
all the other variables.
6.4 Cross Tabulation and Chi-Square Tests
After discovering the independent variables that have the highest correlation with “Willingness to
work in Changsha” through a general comparison, a criterion is required to judge whether it is
statistically significant that there is any association between each pair of variables.
The chi-squared test (Chi2) could determine whether there is a statistical significant difference
between the expected frequencies and the observed frequencies in one or more categories. In this
study, the confidential level is set at 95%. In each chi-squared test, the null hypothesis is that there
is no association between two variables. If the test result shows a “P value” smaller than 0.05 in
this study, they null hypothesis could e rejected and the relationship between two variables could
be proved as statistically significant.
In order to conduct chi-square tests to observe a relationship between variables, continuous
variables which have high correlation coefficients with the dependent variable were transformed
into binary variables for cross-tabulation. The variables transformed were already listed in Table
5.1. The first variable transformed was the registered permanent residence. From the primary data,
we can observe that Hunan is where the city of Changsha is as well as the main registered
permanent residence of the participants, therefore, the sample’s “Registered permanent residence”
can be divided into two categories basing on whether the participant was from Hunan province

Lingran Meng lm3193
40
and transformed into a binary variable.
The second variable “Lowest salary expected” was labeled as “0” for below ten thousand per
month and “1” for at or above ten thousand per month. The variable was then labeled as “Below
10” and “at or above 10”. The reason is that the median of participants’ lowest monthly salary
expected is 7.5 thousand, which is the category just below 10.
Chi-Squared Test 1: “Registered permanent residence” and “Willingness to work in Changsha”
In order to examine the relationship between the willingness to work and live in Changsha and
registered permanent residence, we first converted the category variable (registered permanent
residence) into a binary one and then ran the chi square test with the hypothesis:
H0: There is no association between willingness to work and live in Changsha and registered
permanent residence.
H1: There is an association between willingness to work and live in Changsha and registered
permanent residence.
Table 6.5 Result of Chi-Squared Test 1
According to the result of this Chi2 test, among the 116 participants, 60 of them have the Hukou

Lingran Meng lm3193
41
of Hunan province while 56 of them do not have. Within the 60 participants with the Hukou of
Hunan, 39 of them are willing to work and live in Changsha in the future. In contrast, only 7 of
the participants without the Hukou of Hunan plan to stay in Changsha. The Chi2 statistic value of
this test is equal to 33.36, larger than the critical value of 3.84 (at 𝛂 =0.05, DF=1. P-value = 0.00
< 𝛂 =0.05). Therefore, the null hypothesis could be rejected. It is statistically significant that there
is an association between willingness to work and live in Changsha and registered permanent
residence. A participant is less likely to work in Changsha if his Hukou is outside Hunan.
Chi-Squared Test 2: “Direct relative outside Hunan” and “Willingness to work in Changsha”
Direct relative outside Hunan province is a critical indicator. This variable is divided into two
categories: have direct relative outside Hunan province and have no direct relative outside Hunan
province. The hypothesis is:
H0: There is no association between willingness to work and live in Changsha and direct relative
outside Hunan province.
H1: There is an association between willingness to work and live in Changsha and direct relative
outside Hunan province.
Table 6.6 Result of Chi-Squared Test 2

Lingran Meng lm3193
42
The result shows that the chi square value is 5.20 (larger than the critical value for 0.05 probability
at DF=1). Therefore, the null hypothesis could be rejected. It is statistically significant that there
is an association between willingness to work and live in Changsha and direct relative outside
Hunan province. People prefer to work in the provinces where they have direct relatives.
Chi-Squared Test 3: “Expected lowest salary” and “Willingness to work in Changsha”
To explore the relationship between willingness to work and live in Changsha and lowest salary
expected, hypothesized:
H0: There is no association between willingness to work and live in Changsha and lowest salary
expected.
H1: There is an association between willingness to work and live in Changsha and lowest salary
expected.
Table 6.7 Result of Chi-squared Test 3
The result shows that the chi square value is 6.38 (larger than the critical value for 0.05 probability
at DF=1). Therefore, the null hypothesis could be rejected. It is statistically significant that there
is an association between willingness to work and live in Changsha and lowest salary expected.
As the participants’ degree of satisfaction with the ten aspects of Changsha were reflected in three
Lingran Meng lm3193
43
levels, the relationship between these variables and the willingness to work and live in Changsha
can also be discovered through Chi2 test.
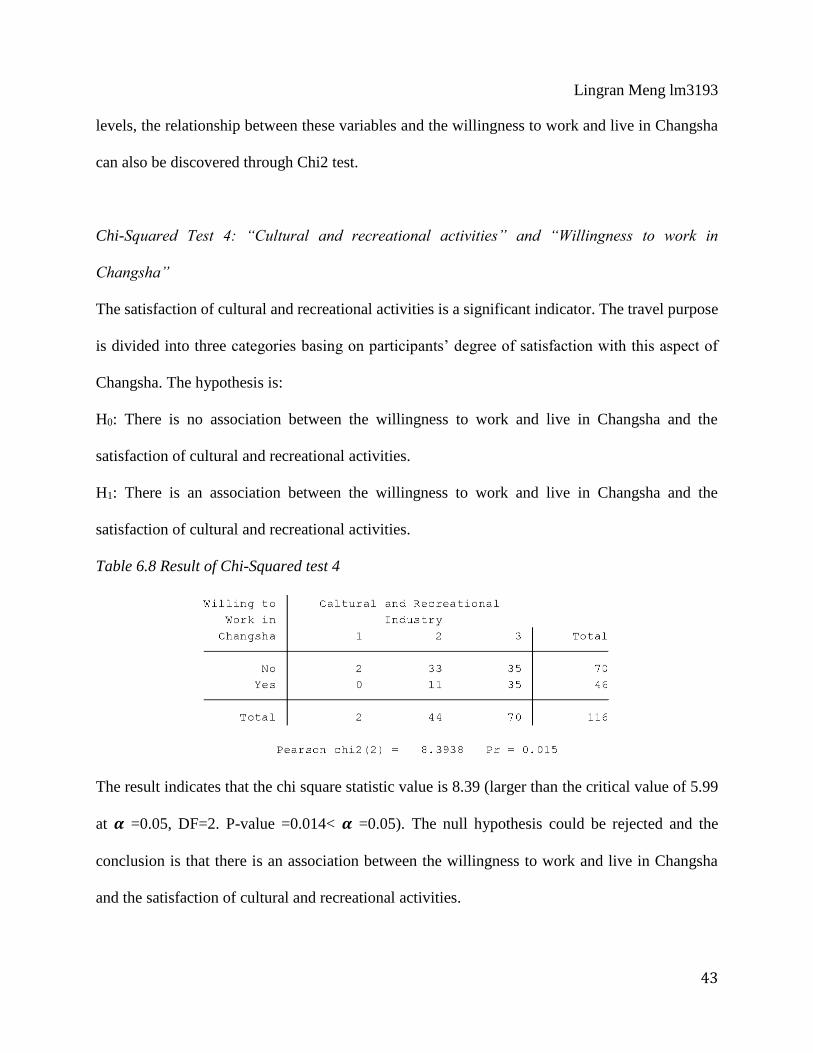
Chi-Squared Test 4: “Cultural and recreational activities” and “Willingness to work in
Changsha”
The satisfaction of cultural and recreational activities is a significant indicator. The travel purpose
is divided into three categories basing on participants’ degree of satisfaction with this aspect of
Changsha. The hypothesis is:
H0: There is no association between the willingness to work and live in Changsha and the
satisfaction of cultural and recreational activities.
H1: There is an association between the willingness to work and live in Changsha and the
satisfaction of cultural and recreational activities.
Table 6.8 Result of Chi-Squared test 4
The result indicates that the chi square statistic value is 8.39 (larger than the critical value of 5.99
at 𝜶 =0.05, DF=2. P-value =0.014< 𝜶 =0.05). The null hypothesis could be rejected and the
conclusion is that there is an association between the willingness to work and live in Changsha
and the satisfaction of cultural and recreational activities.

Lingran Meng lm3193
44
Chi-Squared Test 5: “Climate” and “Willingness to work in Changsha”
The satisfaction of climate is another key factor that should be considered. Samples were divided
into three groups basing on participants’ degree of satisfaction with this aspect of Changsha. The
hypothesis is:
H0: There is no association between willingness to work and live in Changsha and the satisfaction
of climate.
H1: There is an association between willingness to work and live in Changsha and the satisfaction
of climate.
Table 6.9 Result of Chi-Squared Test 5
The result shows that the chi square statistic value is 8.49 (larger than the critical value for 0.05
probability at DF=2). Therefore, the null hypothesis was successfully reject. It is statistically
significant that there is an association between willingness to work in Changsha and the climate.
6.5 Regression Analysis
Regression model could find out the quantitative relationship between continuous dependent
variable (number stands for quantity) and independent variable. As the “Lowest salary expected”
is a continuous variable, in order to find out the accurate quantitative relationship between it and
“Willingness to work in Changsha”, I used STATA to do regression analysis.

Lingran Meng lm3193
45
Regression Test: “Lowest salary expected/1000” and “Willingness to work in Changsha”
Table 6.10 Result of regression test
Based on the output from the bivariate regression model (Table 6.10), the relation between
“Lowest salary expected” and “Willingness to work in Changsha” can be model by the equation:
Willingness to work in Changsha = -0.11(Lowest salary expected/1000) + 0.522. When all other
variables are held constant, if the lowest monthly salary a talent expected increased by 1,000 RMB,
their willingness to work and live in Changsha will decrease by 0.11. This model can account for
4% of the talents from the top universities in Changsha (R-squared = 0.0371).
As P < 𝜶 = 0.05, the coefficient is statistically significant.
6.6 Comparison between Participants with and without the Hukou of Hunan
According to previous analysis result from regression test, the correlation coefficient between
“Registered permanent residence” and “Willingness to work in Changsha” is much higher than the
correlation coefficient between “Willingness to work in Changsha” and other variables. Therefore,
the sample can be separated into two groups for further analysis about the top three factors they
care most about when deciding whether to live and work in Changsha. Participants in Group 1 do
not have the Hukou of Hunan while participants in Group 2 have it.

Lingran Meng lm3193
46
The result (Table 6.11) reflected that both groups care most about salary level and housing
affordability and do not care much about parks and open space. Two groups of participants also
both care about high-tech industry, daily life affordability, cultural and recreational activities,
climate, and air quality while they hold different attitude towards the importance of financial
industry and education for children.
Table 6.11 Comparison between factors participants with and without Hukou of Hunan care about
Group 1:
A B C D E F G H I J
1 12 6 20 9 1 0 2 0 4 2
2 0 6 9 11 12 2 4 1 6 5
3 2 1 5 10 8 7 8 0 6 9
Total 14 13 34 30 21 9 14 1 16 16
Group 2:
A B C D E F G H I J
1 12 3 18 7 5 3 2 0 3 7
2 3 3 16 14 5 6 4 0 3 6
3 2 1 6 9 8 14 6 0 5 9
Total 17 7 40 30 18 23 12 0 11 22
A. High-tech industry
B. Financial industry
C. Salary level
D. Housing affordability
E. Daily life affordability
F. Education for children
G. Cultural and recreational activities
H. Parks and open space
I. Climate
J. Air quality
Lingran Meng lm3193
47
7. RESULT DISCUSSION
The results obtained from the chi-square test and regression analysis were strong enough to
identify the independent variables that have significant impacts on the dependent variable. In other
words, “Registered Permanent Residence”, “Direct Relative outside Hunan Province”, “Lowest
salary expected”, “the satisfaction of Cultural and Recreational activities” and “the satisfaction of
Climate” were found out to have significant impacts on the talents’ willingness to work and live
in Changsha. It was not statistically significant that variables like “Age”, “Gender”, “Household
size”, “Education level” and the satisfaction of other aspects of Changsha had any association with
the talents’ decision to work and live in Changsha. Therefore, these analysis results were not taken
into consideration for the research conclusion.
According to the result of data analysis, there was a positive relationship between “Transformed
registered permanent residence” and “Willingness to work in Changsha”. This could in some
degree indicate that registered permanent residence is still an important factor to decide where a
talent is going to work after graduation. The possible reason is that with the registered permanent
residence of Hunan province, they could enjoy more of the local welfares in terms of housing and
medical care according to the law in China. In order to attract talents from other provinces around
China, one possible suggestion for the local government of Changsha is to consider weakening the
importance of registered permanent residence by providing all university graduates with the same
standard of allowance. For example, university graduates may also be permitted to purchase their
apartments in Changsha without paying extra tax. Alternatively, the local government of Changsha
could also create an easier path for talents to get the Hukou of Changsha. For example, the
government could announce that university graduates could get the Hukou of Changsha as long as

Lingran Meng lm3193
48
they work and pay tax in Changsha for 3 years.
Due to the large correlation coefficient between “Registered permanent residence” and “Direct
relative outside Hunan Province”, the negative relationship between “Direct relative outside
Hunan Province” and “Willingness to work in Changsha” could also be attributed to the effect of
registered permanent residence. Another possible reason is that many people prefer staying closer
to their relatives.
The negative relationship between “Expected lowest salary” and “Willingness to work in
Changsha” showed that high salary is still one of the most important factors potentially attracting
talents to a city. Considering that salary level got the least satisfaction (4.3%) in the survey,
Changsha still has a long way to go for its economic development. With the implementation of
transit-oriented development in this city, the increasing supplements of job opportunities will
possibly lead to an increase in salary level.
In the data analysis result from Stata, the correlation between “Satisfaction of cultural and
recreational activities” and “Willingness to work and live in Changsha” is even stronger than the
correlation between “Lowest salary expected” and “Willingness to work and live in Changsha”.
This result is to some degree contradictory with our common sense, in which young people usually
care more about salary level. The possible reason is that when filling questionnaires, the expected
salary level participants filled in might be a little bit different from what they actually expected.
However, the result could still indicate that “Cultural and recreational activities” is a crucial factor
affecting talents’ decision to work and live in Changsha.

Lingran Meng lm3193
49
The association between “Satisfaction of cultural and recreational activities” and “Willingness to
work and live in Changsha” strongly supported the hypothesis that what the creative class care
about is not only high salary and good job opportunities but also the abundant cultural and
recreation activities. To make it simple, when two cities have similar salary level and job
opportunities, if the talents do not have the Hukou of any of the cities, they can possibly be attracted
to the city with abundant cultural life. Due to the fact that a large portion of talents are currently
quite satisfied with the cultural and recreational life in Changsha, local government could make
good use of this superiority and consolidate its position as a characteristic advanced industry.
Considering that the climate in Changsha is not of great satisfactory and the climate is not a
controllable factor, more indoor activities could be considered instead of outdoor ones.

Lingran Meng lm3193
50
8. CONCLUSION AND RECOMMENDATIONS
8.1 Suggestions for Changsha
In China’s “The Belt and Road” plan, Changsha, a second-tier city in the middle area of China is
going to play an important role for innovation and high-tech development. The attraction for talents
seems quite important for this step of development.
Among the newly developed high-tech city in the United States, the booming history of the city of
Austin set up a good example of benefiting from talents graduated from University of Texas
Austin. These talents chose to live and work in Austin probably due to its cultural activities, urban
environment and social welfare.
After using the variables identified from the case of Austin as well as some previous studies about
factors attracting talents to a city, an online survey was carried out using the Tencent Questionnaire
platform. Questionnaires were issued to several hundreds of people from the top universities in
Changsha in order to find out the exact factors leading to their decision of staying in or leaving
Changsha. Their answers were entered into excel and Stata was used for data analysis.
According to the data analysis result of the survey, apart from the traditional factors like “registered
permanent residence” and “lowest salary expected”, similar to Austin, the participants’ willingness
to live and work in Changsha can also be seriously affected by their satisfaction level of the cultural
and recreational activities of the city as well as the climate. The survey results also indicated that
the cultural and recreational activities in Changsha is currently receiving a high level of
satisfaction, which means that Changsha has its original advantage in cultural life development.

Lingran Meng lm3193
51
The result of survey also reflected that different between talents in Austin, talents in Changsha do
not care much about natural surroundings like parks and open space, which could probably be
attributed to the terrible climate in Changsha.
Therefore, it is possible for Changsha to learn from the development plans and policies in Austin
in terms of urban and cultural life development. Due to the lack of pleasant climate, Changsha
could possible use more indoor cultural activities to replace the outdoor ones. Focusing on steady
economic development and making good use of its own cultural resources at the same time,
Changsha could possibly attract more talents and boom up in high-tech city development.
During Changsha’s three thousand years of history, it has created splendid culture and has been
the hometown of a great number of celebrities. Therefore, local government can make good use of
these resources and put more effort to the publicizing of the historical museums and former
residence of celebrities.
Apart from history and culture, recent years Changsha also has its advantages in media art. After
the UNESCO Creative Cities Network was created in 2004, Changsha was the first city in China
to become the City of Media Art. Media art is a form of contemporary art, which mainly refers to
the artistic works that focus on the use of modern technology, new media forms and new vision
methods to express the theme of the works. For example, digital technology could help fireworks
to become more visually impressive (Figure 8.1). These years, with the development in
information technology, 3d printing, and biological science and technology, there is an increasing

Lingran Meng lm3193
52
space for Changsha to have further development in this area. It would also be possible for local
government to cooperate with high-tech companies and held some interactive activities related to
media art.
Figure 8.1 Fireworks with digital technology in Changsha
(changsha.cn, 2017)
The case study of Changsha also told that what today’s talents in China care about is not only
material life but also spiritual satisfaction and cultural life. When crafting policies and plans for
the development of second-tier cities in China, instead of completely learning from first-tier
developed cities like Beijing, Shanghai and Shenzhen, local city governments and planners should
discover and make good use of its own specialties for talent attraction.
8.2 Limitations and Recommendations
One of the limitations of this study is the size of the sample. As there were only 130 participants
in this survey, with 116 answers possible for data analysis, the sample may not be representative
enough for the talents from universities in Changsha.

Lingran Meng lm3193
53
Another limitation is that as most of the questions in the questionnaire were multiple choice, most
variables acquired from the responses are dummy variables instead of continuous variables. As a
consequence, it is hard to build a multi-regression model for accurate quantitative analysis.
Moreover, this paper did not look deep into the historical and cultural traditions of Austin as well
as the detailed data reflecting the effect of specific methods Austin used to improve its cultural
life. Therefore, it is hard to say how much of the creative environment of Austin was spontaneous
and how much was fostered by policies and strategies.
Last but not least, due to the limitation in access permission, the study only focused on university
students and graduates. There was no interview of officials or planners in this study and the
opinions about the next step development of Changsha from these professionals could not be
acquired.
In order to have a deeper study of factors attracting talents to live and work in the city of Changsha,
it would be better to carry out a more detailed research with the use of a larger sample. Besides, in
order to find out the specific policy and plans that works in attracting talents in Austin, a deeper
research into the development of cultural life in Austin is also required. In addition, the opinions
from experts could be more helpful for the discussion of feasible policies that can possibly be
carried out in terms of these factors.
Lingran Meng lm3193
54
REFERENCES
Academy of China Hi-tech Industry Economy (ACHIE). Retrieved from http://www.achie.org/
Agenda Invest. (2017). China’s New Silk Road. Retrieved from
https://www.agendainvest.com/2017/07/31/chinas-new-silk-road/
Belt and Road Portal. Retrieved from https://www.yidaiyilu.gov.cn/
Changsha Bureau of Statistics. (2016). Changsha Statistical Yearbook 2015. China Statistics
Press.
Changsha Evening Newspaper. (2017). http://www.changsha.cn/
CMA CGM LOG. (2017). Silk Road: A New Asian Transport Dynamic. Retrieved from
http://www.cmacgm-log.com/en/products/silk-road
Florida, R. (2005). Cities and the creative class. Routledge.
Fatemi, F. (2017). 5 U.S. Cities Poised To Become Tomorrow's Tech Meccas. Forbes.
https://www.forbes.com/sites/falonfatemi/2017/03/23/5-u-s-cities-poised-to-become-
tomorrows-tech-meccas/#6a0180d52132
Liu, Y., & Shen, J. (2014). Jobs or amenities? Location choices of interprovincial skilled migrants
in China, 2000–2005. Population, Space and Place, 20(7), 592-605.
Michaud, P. and Tcheremenska, A. (2003). Montreal knowledge city. Montreal Knowledge City
Advisory Committee. November 2003, Montreal.
Ministry of Science and Technology of the People’ Republic of China.
http://www.most.gov.cn/gxjscykfq/index.htm
National Bureau of Statistics of the People’s Republic of China. Retrieved from
http://www.stats.gov.cn/
Project partner. (2018). Hukou System Explained: China’s Internal Passport. Retrieved from

Lingran Meng lm3193
55
https://projectpartner.org/poverty/hukou-system-explained-chinas-internal-passport/
South China Morning Post. (2016). Urban legend: China’s tiered city system explained. Retrieved
from http://multimedia.scmp.com/2016/cities/
Storper, M., Kemeny, T., Makarem, N., & Osman, T. (2015). The rise and fall of urban economies:
Lessons from San Francisco and Los Angeles. Stanford University Press.
Storper, M., & Scott, A. J. (2009). Rethinking human capital, creativity and urban growth. Journal
of economic geography, 9(2), 147-167.
Thite, M. (2011). Smart cities: implications of urban planning for human resource
development. Human Resource Development International, 14(5), 623-631.
Yigitcanlar, T. A. (2007). The making of urban spaces for the knowledge economy: global
practices.

Lingran Meng lm3193
56
APPENDIX
Appendix 1: Questionnaire in English
1. What is your age?
2. What is your gender? M F
3. What is your family size?
4. Where is your Registered Permanent Residence?
5. Do(will) you have direct relative outside Hunan province?
a. Yes b. No
6. What is your highest level of education?
a. Bachelor b. Master or above
7. In which year will(did) you graduate?
a. 2016
b. 2017
c. 2018
d. 2019
e. 2020
f. Others_____
8. What is the area of the job you are going to do?
a. Building & Real Estate
b. Information Technology
c. Trade & Service
d. Government & NPOs
e. Finance
f. Culture & Recreation
g. Manufacturing & Logistics
h. Others
9. What is the lowest monthly salary you expected?
a. 2,500 b. 5,000 c. 7,500 d. 10,000
e. 15,000 d. 20,000 e. 30,000
10. Have you already been admitted to a job?
a. Yes b. No

Lingran Meng lm3193
57
11. Where are you going to work after graduation?
12. Could you please rate the following perspectives of Changsha?
a. High-tech industry 1 2 3
b. Financial industry 1 2 3
c. Salary level 1 2 3
d. Housing affordability 1 2 3
e. Daily life affordability 1 2 3
f. Education for children 1 2 3
g. Recreational facilities and activities 1 2 3
h. Parks and open space 1 2 3
i. Climate 1 2 3
j. Air quality 1 2 3
13. Which three of the factors above do you care most? (Prioritize them)
1 2 3
14. A new High-Speed Rail Station in west Changsha is going to connect the Belt and Road.
What do you think about the impact of it?
a. Drive people away b. Bring people in
c. I have never heard about this project
15. Any advice to the development of Changsha? (Optional)
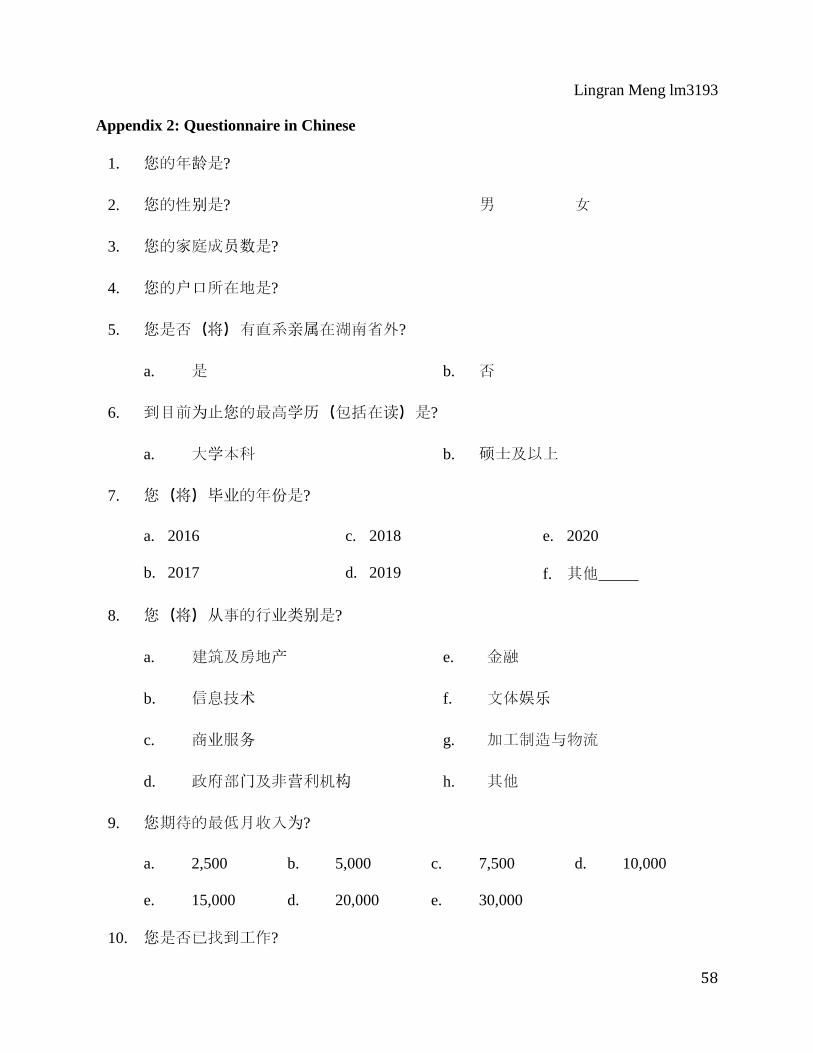
Lingran Meng lm3193
58
Appendix 2: Questionnaire in Chinese
1. 您的年龄是?
2. 您的性别是? 男 女
3. 您的家庭成员数是?
4. 您的户口所在地是?
5. 您是否(将)有直系亲属在湖南省外?
a. 是 b. 否
6. 到目前为止您的最高学历(包括在读)是?
a. 大学本科 b. 硕士及以上
7. 您(将)毕业的年份是?
a. 2016
b. 2017
c. 2018
d. 2019
e. 2020
f. 其他_____
8. 您(将)从事的行业类别是?
a. 建筑及房地产
b. 信息技术
c. 商业服务
d. 政府部门及非营利机构
e. 金融
f. 文体娱乐
g. 加工制造与物流
h. 其他
9. 您期待的最低月收入为?
a. 2,500 b. 5,000 c. 7,500 d. 10,000
e. 15,000 d. 20,000 e. 30,000
10. 您是否已找到工作?

Lingran Meng lm3193
59
a. 是 b. 否
11. 您毕业后(打算)在哪里工作?
12. 请您为长沙市发展建设以下方面打分:
a. 高新技术产业 1 2 3
b. 金融产业 1 2 3
c. 工资水平 1 2 3
d. 房价 1 2 3
e. 日常生活物价 1 2 3
f. 青少年教育 1 2 3
g. 文化娱乐活动 1 2 3
h. 公园休憩场所 1 2 3
i. 气候 1 2 3
j. 空气质量 1 2 3
13. 请排列出上一题中您认为最重要的三项:
1 2 3
14. 长沙金桥枢纽建成后,渝长夏高铁通过长沙向西连接陆上丝绸之路重要城市重庆,
向东连接海上丝绸之路重要城市厦门,您认为这一项目将产生怎样的影响?
a. 吸引更多人才来长沙工作 b. 加剧长沙人才流失
c. 从未听说这一项目
15. 您对长沙未来发展建设有何看法和建议? (可选)