planning and operational energy optimization solutions for
TRANSCRIPT
Planning and Operational energy optimization solutions for Smart Buildings
David Sembroiza, Davide Careglioa, Sergio Ricciardia, Ugo Fioreb
aDepartment of Computer Architecture, Technical University of Catalonia - BarcelonaTech (UPC), SpainbDepartment of Management and Quantitative Studies, Parthenope University, Italy
Abstract
The incremented popularity of Internet of Things (IoT), thanks to improvements both in hardware and softwareof sensors over the last years, enables the possibility to monitor and gather any kind of data. Additionally, the ar-rangement of heterogeneous sensors, capable of perceiving information about their surroundings, into a rich WirelessSensor Network (WSN), allows the appearance of complex systems in which resources are managed more efficiently.Smart cities, buildings, parkings, emergency services are appearing, where control over energy consumption and bet-ter sustainability are coupled with an improvement of the comfort of occupants. In this paper, we address the problemof energy optimization in smart buildings, considering both the planning and operational aspects. Specifically, thefirst aim is to propose an optimal deployment of the WSN inside a building. For this, we present a model able toidentify the optimal locations for different types of sensors and gateways, by optimizing energy consumption whilefulfilling connectivity, resource, protection, and clustering coverage constraints. Once the IoT system is deployed, weaddress the problem of how the building actually functions, according to the behaviour of the occupants. In particular,we propose a Building Management System (BMS) capable of efficiently and automatically manage the building el-ements using human behavioural models, thus lowering the overall building energy consumption whilst maintainingacceptable levels of comfort.
Keywords: Internet of Things, Smart buildings, optimization, energy, comfort, Wireless Sensor Network, ILP,simulation
1. Introduction
Internet of Things (IoT) is increasingly gaining popularity, due to technology improvements both in hardware andsoftware, such as miniaturization, energy efficient sensors, lightweight communication protocols, which enable newpossibilities for measuring, monitoring and interacting with the environment. IoT is commonly defined as a systemof interconnected elements or things that are provided with unique identifiers and the ability to gather and transmitinformation about – and exercise control over – any kind of element without necessity of human intervention. The listof elements is wide and can range from devices, machines or objects to animals or people. Thereby, a thing can be aperson with a heart-rate monitor, an animal with a tracking system, a vehicle with sensors to alert the driver when tirepressure is low.
The aforementioned examples make use of individual sensors to achieve their goal. However, IoT also enables thepossibility to interconnect multiple sensors to create a Wireless Sensor Network (WSN), which serves as the basis formore complex systems such as smart cities, buildings, parkings, emergency services, etc. [15].
Sensors are small pieces of hardware with constrained resources in terms of transmission range and, most im-portantly, battery life. Optimization of WSN deployment is key to achieve a network capable of delivering all thedata whilst utilizing the least possible amount of resources. This optimization may follow different directions. Forinstance, in a factory where sensors are placed in locations with hard or limited reachability (for example locationswith critical temperature conditions or high-rise places) energy efficiency is key. On the other hand, in a more easy-to-deploy environment where full availability is a strict requirement, sensors might consume more energy to enablemultiple transmission routes in the event of an unexpected partial network failure.
Furthermore, optimization of resources in a complex system can be extended beyond the WSN itself. Sensorscan gather information about the status of different elements of the environment, and create smarter action policies
Preprint submitted to Information Sciences May 15, 2018
*Manuscript (including abstract)Click here to view linked References
© 2018 Elsevier. This manuscript version is made available under the CC-BY-NC-ND 4.0 license http://creativecommons.org/licenses/by-nc-nd/4.0/

capable of utilizing available resources more efficiently while preserving the desired behaviour. For instance, ina smart building, by monitoring elements such as air conditioners, lights, computers, windows, doors, etc. it ispossible to automatically configure the environment according to the human behaviour and efficiently manage energyconsumption. However, such optimization may come with a cost, as there is usually a clear trade-off between energyefficiency and human comfort: the higher the energy savings, the lower the comfort.
In this work, we focus on these aspects and study the energy optimization of a smart building. First, we addressthe optimal deployment of a WSN inside a building. For this, we present a model able to identify the optimal locationsfor different types of sensors and gateways, by optimizing energy consumption while fulfilling connectivity, resource,protection, and clustering coverage constraints. Second, we address the problem of the actual functioning of thebuilding according to the behaviour of its occupants. In particular, we aim at developing a Building ManagementSystem (BMS) capable of efficiently and automatically manage building elements using human behavioural models,and, thus, try to lower the overall building energy consumption whilst maintaining acceptable levels of comfort. Thiscan be achieved, for instance, by avoiding wasteful scenarios such as leaving lights on when rooms are empty, orby managing heating, ventilation and air conditioning (HVAC) systems more efficiently in order to offer a thermalcomfort adequate to the actual occupation of the building.
The rest of the paper is organized as follows. Section 2 reviews the published related work for the sensor andgateway optimization problem and, then, we focus on reviewing the work done in the field of smart building simulationand occupant comfort calculation. Section 3 initially states the WSN optimization problem and subsequently definesthe formulation of such model. Likewise, Section 4 firstly describes the smart building resource management problemand closes with an explanation of the smart building system. Results in Section 5 initially present the optimized WSNobtained and the energy impact induced by adding protection to the network. Then, results are shown about energyconsumption and occupant comfort for the smart building, comparing them with the current scenario to decide, inSection 6, whether the enhancement of a building with smart features is beneficial for occupants. Section 6 alsooutlines future research aimed at improving the smart building features with superior prediction techniques.
2. Related Work
The problem of optimizing a WSN can be tackled from many different perspectives, depending on the objectives tooptimize and the requirements, such as, e.g., topological restrictions, battery constraints, QoS requirements, and levelsof resilience and security. Regarding the optimization objectives, some problems are related to reducing the initialWSN deployment cost by minimizing the number of nodes to install, while others focus more on WSN performance,by trying to minimize the overall network latency, maximize network connectivity to increase resilience in the event ofunexpected failures, or minimize network energy consumption (especially in scenarios with constrained devices) [2].
With the appearance of IoT, WSNs have gained popularity due to the necessity to monitor every physical devicein a given environment. Such requirement has brought WSNs into a more heterogeneous perspective, since thecharacteristics of sensors may vary depending on the features being monitored.
Additionally, new scenarios are no longer restricted to floors or 2D locations. Instead, IoT enables the possibilityto monitor 3D environments such as office buildings, hospitals, cities, etc. Even though our research can handle both2D/3D scenarios due to the chosen modelling and transmission assumptions, a more accurate 3D model which alsotakes into account line of sight would as in [14] would be necessary.
The utilization of heterogeneous sensors enriches the optimization problem by requiring proper positioning ofeach type of sensor in a specific region, instead of only choosing the positions in which sensors must be placed. Thisproblem can be seen as a clustering problem in which every cluster region must contain a predefined set of sensors.Authors in [3] present an initial approach to such problem, restricting the positioning of every type of sensor into asubsection of the overall layout. However, the authors do not consider the possibility to overlap clusters of differentsizes and thus the possibility to reduce the number of required set of sensors.
In addition to sensor placement, beacon or gateway placement is also another important factor in WSN optimiza-tion. The position in which gateways are deployed is crucial for connecting the overall network. Authors in [19]present an ILP model capable of locating the optimal beacon positions given a set of already selected sensor locations.Similarly, given a set of sensors, it is possible to determine the best gateway locations depending on the objective tooptimize [4, 7]. However, the lack of clustering and sensor differentiation makes the model incomplete for IoT. In [8],
2
a gateway placement with QoS constraints is presented in which clusters are created around the deployed gateways,which differs from our definition of cluster. In [6], authors show a model capable of selecting, from a given WirelessMesh Network, the nodes that should act as gateways, instead of placing additional specific nodes.
Many research papers are also focused in the optimization of building operational energy consumption by meansof smart systems (e.g., [10, 20]). Additionally, some authors introduce the comfort of the occupants to check whethera trade-off between those two metrics exists [21, 17, 11, 16, 24]). These studies are the starting point of present work.For solving the operational problem of improving energy efficiency in a building while maintaining acceptable levelsof comfort of the occupants, it is needed to quantify such comfort first. To this aim, several equations are presented inthe literature [18, 5]. Authors in [21] propose the usage of an aggregated equation that weighs and combines severalindependent comfort values, such as thermal, light, air quality and acoustic comforts. This is utilized as the basis forour work, even though we require the insertion of additional comfort values. In the specific case of the temperature, thecomfort is usually calculated following the ANSI/ASHRAE Standard 55 [1] Predicted Mean Vote (PMV) equation,that can also be extended to introduce air quality aspects [12, 17, 11]. Recommended light levels of the NationalOptical Astronomy Observatory are shown in [13]; such recommendations have been utilized in many works as thecomfort values to aim for [24, 16].
Our work utilizes and extends the aforementioned literature by means of an initial planning model capable of cal-culating the optimal sensor and gateway positions for a given building layout. Even though this topic has been widelystudied, our model introduces the concept of protection level to enable the possibility of equipping the network withbackup paths in the event of a network failure. Furthermore, it also introduces overlapping clustering to determinenot only the best sensor positions, but also the best type of sensor for each selected location. The concept of cluster-ing already appears in many research articles regarding optimization problems, but we present the novel possibilityto overlap positions into different clusters which is necessary for modelling efficient and complex IoT systems. Re-garding the operational phase, we also extend the current comfort equations of the operational problem by insertingadditional values, and, thus, show how comfort equations can be modelled and adjusted to fulfill different scenarios.
3. WSN deployment optimization
This section presents the placement optimization problem for sensors and gateways in a smart building. Firstly, inSection 3.1, we formulate the problem, identifying the constraints we are considering in this scenario and presentingthe objective function, which entails the minimization of energy consumption. Furthermore, in Section 3.2, we pro-gressively introduce all parameters and design assumptions considered in this specific placement problem and, finally,we present the model using a Mixed Integer Programming (MIP) formulation.
3.1. Problem statement
Given a building layout with known possible physical positions for placing either sensors or gateways, the problemresides in selecting the optimal locations for their deployment, minimizing the energy consumption of the wholesystem while fulfilling connectivity, resource, protection, and clustering coverage constraints. As the transmissionrange of a sensor is limited to few meters, the connectivity constraint ensures that a sensor is able to reach at leastone gateway. The resource constraint refers to the maximum bandwidth of the gateway, i.e., the number of concurrenttransmissions a gateway can receive from sensors. The protection constraint is related to unexpected gateway failures,meaning that if a gateway fails, the sensors transmitting to it need to be able to reach another gateway nearby. Finally,a cluster is defined as an area of the building where sensors from a given set of types are compulsorily required. Itis worth mentioning that the size of clusters and the sensors required inside each cluster vary depending on the zoneunder representation. For instance, just a single alarm is placed in each floor of the building, so then, in this case, thecluster represents a floor; temperature, presence, and luminosity sensors are placed in each room, which form roomclusters; a single humidity sensor is installed every four rooms to create clusters of room groups, etc. Besides, thepossible sensor positions are not exclusively attached to a single cluster; instead, they can be shared in order to create acluster hierarchy, which specifies different cluster sizes that cover different building zones with different sensor types.
Given such constraints, the objective of the placement optimization problem is to decide which locations to selectin order to minimize energy consumption, given by the energy consumed by the sensors to communicate with thegateway plus the energy required by the gateways to collect data and forward them to the building manager.
3
3.2. Model formulation
This section presents the WSN model that determines sensor and gateway positions inside a building aiming atminimizing the overall energy consumed.
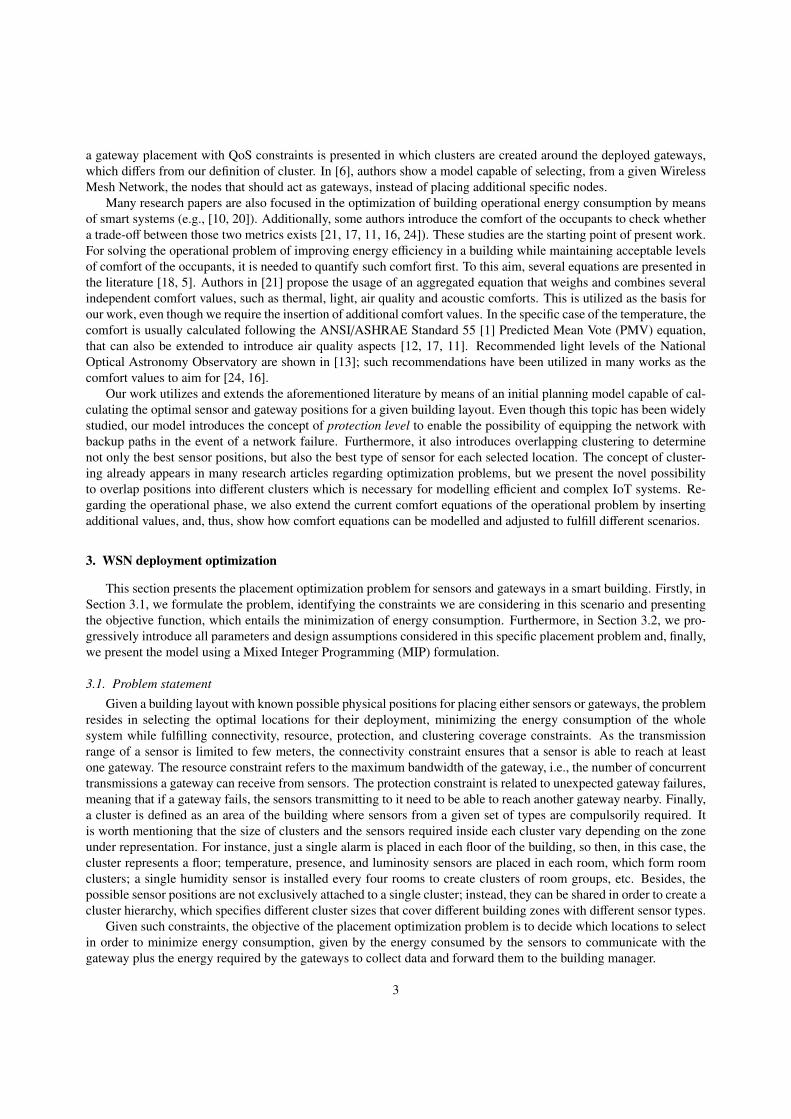
We represent a building scenario as a set of potential sensor positions S and a set of potential gateway positions G,each of which may correspond to a 2D or 3D point. Once the coordinates are marked, the variable dist of size |S | × |G|defines, for each element disti j, the Euclidean distance between positions S i and G j. Figure 1 shows an example of abuilding layout where blue dots represent possible sensor positions and red dots indicate possible gateway positions.
Figure 1: Layout of the building with the sensor and gateway available positions defined.
The locations where sensors and gateway should be initially placed depend on the energy consumption model. Thecalculation of the sensors’ energy consumption is directly related to the distance between sensors and their assignedgateway. We employ Mica2 motes[23] due to their flexibility to alter their transmission range in order to efficientlymanage energy consumption, as shown in Table 1. Specifically, transmissionCosti stores the energy needed forsending data using power level i. To simplify further calculations, it is assumed that the energy of each level of thetable corresponds to the transmission of a single data packet.
l Etx(l) R(l) l Etx(l) R(l)
1 (lmin) 671.88 19.3 14 843.75 41.192 687.50 20.46 15 867.19 43.673 703.13 21.69 16 1078.13 46.294 705.73 22.69 17 1132.81 49.075 710.94 24.38 18 1135.42 52.016 723.96 25.84 19 1179.69 55.137 726.56 27.39 20 1234.38 58.448 742.19 29.03 21 1312.50 61.959 757.81 30.78 22 1343.75 65.67
10 773.44 32.62 23 1445.31 69.6111 789.06 34.58 24 1500.01 73.7912 812.50 36.66 25 1664.06 78.2213 828.13 38.86 26 (lmax) 1984.38 82.92
Table 1: Transmission energy consumption (Etx(l) in nJ/bit) and transmission range (R(l) in m) at each power level (l) for the Mica2 motes as afunction of power level [23]. Energy dissipation for reception of data is constant (Erx = 922nJ/bit).
For the energy consumption of the gateway, we consider the parameter CostG j. This cost is assigned to eachgateway inside the range [400, 1000], utilizing the same consumption units as the sensor transmissions.
Another important aspect that should be taken into account is the variety of sensors to deploy. IoT appeared thanksto improvements in sensor technology, which opened the possibility to gather any kind of data, e.g., temperature,humidity, luminosity, air quality, and fire alarm . Our model handles T distinct types of sensors, each of which isresponsible for gathering different environmental data. Even though their characteristics may vary, in the interests ofsimplicity we consider that transmission range and energy consumption are equal for all sensors and correspond to thevalues shown in the aforementioned Table 1. For transmission, the maximum reachable range is limited to R(lmax). In
4
the final model, the adjacency matrix InRange is defined:
InRangei jk =
1 if i ∈ S , j ∈ G, k ∈ T, dist(i, j) ≤ R(lmax)0 otherwise
(1)
This adjacency matrix allows to readily find the possible connections that can be established between a sensor oftype k placed in position S i with a gateway placed in position G j.
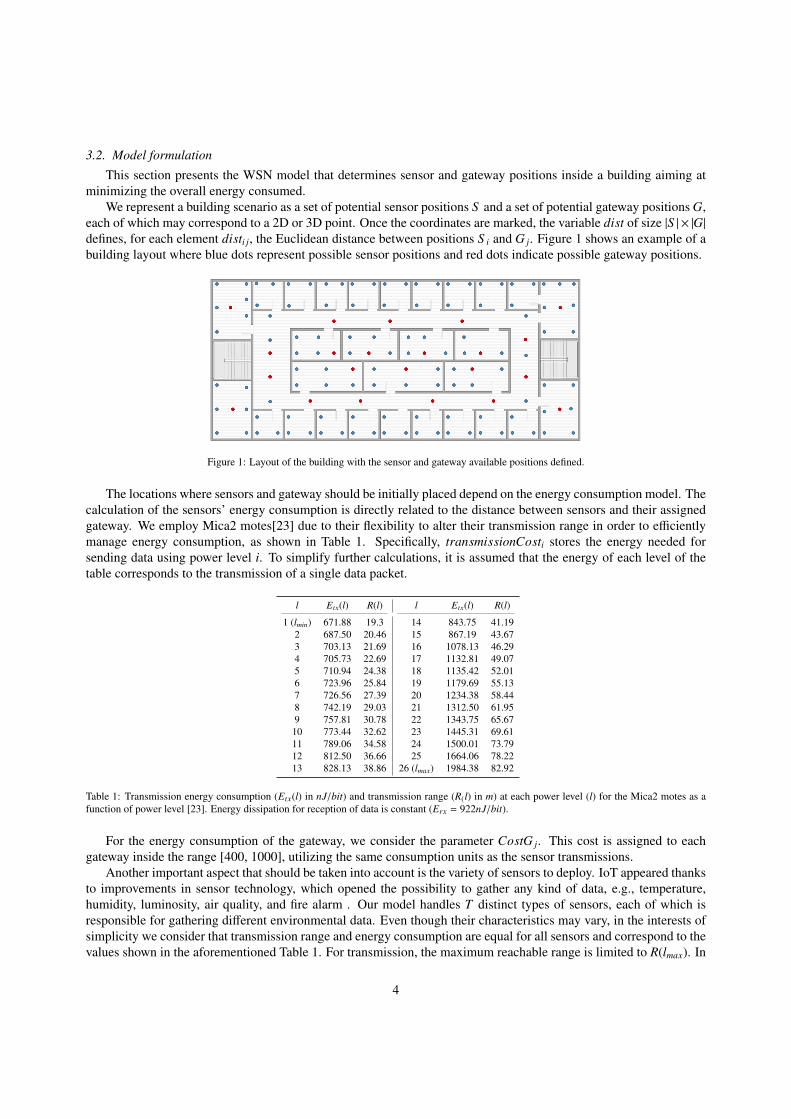
A novelty introduced in our WSN modelling is the utilization of clusters. Clusters are usually defined as a groupof the same or similar elements gathered closely. Here, a cluster is defined as a set of sensor positions in which agroup of sensor types needs to be exhaustively represented. This addition allows the creation of flexible solutions.The model considers Nc clusters, and the variable clusterPositions stores, for each sensor position i, a list of thecluster identifiers j to which position i belongs. This definition enables the possibility to define regions that belong tomore than one cluster, in order to describe more complex scenarios.
Figure 2 shows an example of cluster definition. As it can be seen, the model permits the definition of smallclusters inside bigger ones. In this particular example, the entire floor belongs to the blue cluster, accommodated forsensor types that only need to be placed once per floor, such as a fire alarm. The green cluster consists of all roomsfacing the top side of the building. Sensors placed in that area will gather information that does not significantly varyfrom one room to the contiguous ones, like air quality, humidity and gases detection. The red cluster represents asingle room, where sensors like temperature, presence, luminosity, smart plugs, etc. have to be installed.
Figure 2: Example of three clusters of different size defined in a building floor.
Since the number of positions inside each cluster may vary, the final model uses an auxiliary adjacency matrix clu,whose entry clui j determines whether position S i is inside the cluster with id = j.
clui j =
1 if i ∈ S , 1 ≤ j ≤ Nc, j ∈ clusterPositionsi
0 otherwise(2)
In order to handle heterogeneous scenarios, another variable is needed to indicate the set of sensor types that eachcluster must contain. To this aim, the variable clusterTypes is defined, and stores, for each cluster i, a list of sensortypes k that must be present. As before, since the number of sensor types needed per cluster may vary, an auxiliaryadjacency matrix is used for the final model:
cluTypesi j =
1 if 1 ≤ i ≤ Nc, j ∈ T, j ∈ clusterTypesi
0 otherwise(3)
A final valid deployment is represented by a set of sensor locations PS = 1, . . . ,Ns and a set of gateway locationsPG = 1, . . . ,Ng. To this aim, the following set of boolean decision variables is defined to describe the selected
5

gateway and sensor positions with their corresponding type, as well as the link between them.
xi j =
1 if a sensor of type j is installed at position S i
0 otherwise(4)
yi =
1 if a gateway is installed at position Gi
0 otherwise(5)
ai jk =
1 if sensor i of type k is attached to gateway j0 otherwise
(6)
Equation 4 shows the boolean variable that indicates whether position S i contains a sensor of type j. Similarly,Eq. 5 defines the analogous variable for the gateways; a vector suffices in this case since there is only one type ofgateway. The last variable is presented in Eq. 6, and indicates the wireless link connections between sensors andgateways. Specifically, it determines whether a sensor of type k in position S i is attached to a gateway positioned inG j.
With all the decision variables defined, it is possible to clearly state the cost of deploying a sensor in terms of itsassociated gateway and the distance between them. To do so, we firstly calculate the index used for acquiring theproper transmission level as shown in Table 1. For the sake of simplicity, we assume that distances are rounded to thenext unit.
index =⌈ai jk ∗ dist(i, j)
⌉(7)
As it can be seen in Eq. 7, index calculation is controlled by the decision variable ai jk, in order to only count thetransmissions in which sensor i of type k is attached to gateway j. It is worth mentioning that the index is alwaysinside the range [0, dR(lmax)e]. For index = 0, nothing is found in Table 1. However, this value is only obtained whenaik j = 0. Thus, it is safe to define transmissionCost[0] = 0. Once the index is defined, transmissionCost[index]returns the energy consumed for such transmission.
With all the required parameters and the variables defined, the proposed Mixed Integer Programming (MIP) modelfor solving the problem is as follows:
min∑i∈S
∑k∈T
xik ∗∑j∈G
transmissionCost[dai jk ∗ dist(i, j)e] +∑j∈G
CostG j ∗ y j (8)
s. t.2 ∗ ai jk ≤ xik + y j ∀i ∈ S , j ∈ G, k ∈ T (9)
∑j∈T
xi j ≤ 1 ∀i ∈ S (10)
ai jk ≤ InRangei jk ∀i ∈ S , j ∈ G, k ∈ T (11)
∑j∈G
ai jk ≥ xik ∗ protectionLevel ∀i ∈ S , k ∈ T (12)
∑i∈S
∑k∈T
ai jk ≤ GatewayBw ∀ j ∈ G (13)
∑k∈S
cluki ∗ xk j ≥ cluTypesi j ∀i ∈ C, j ∈ T (14)
The objective function (8) minimizes the whole installation cost by minimizing the consumed energy for everysensor-to-gateway single packet transmission, as previously indicated, and the cost of deploying each gateway. Theconstraint (9) ensures that, if sensor position S i is associated with gateway location G j, then, a sensor must exist at
6

position S i and a gateway must be placed at position G j. The constraint (10) ensures that each position S i holds oneand only one type of sensor, since the same physical position cannot be used by two separate elements. The rangeconstraint (11) checks that all sensor-to-gateway links created are in the transmission range of the sensor.
The protection level is defined to introduce resilience in the network. This level indicates the number of gatewayswithin the range of which each sensor must be, in such a way that, if a gateway fails, the sensor can be connected toan alternative one. To do so, constraint (12) forces a sensor of type k at position S i to be connected to at least pro-tectionLevel gateways. The bandwidth constraint (13) ensures that all gateways handle no more than their maximumbandwidth. For the sake of simplicity, we define the maximum bandwidth of a gateway as the maximum number ofsensors connected to it. In case a given protection level is applied, the backup connections are also considered sincethey need to be available in the event of a gateway failure. Finally, the clustering constraint (14) forces each cluster tocontain all sensor types required by the problem definition.
4. Smart building resource management
In the previous section, we solve the planning problem determining the optimal placement of sensors and gateways.Upon such an optimal topology, we now focus on the operational phase. In particular, we propose a BMS capable ofautomatically modify its state in order to adapt to the environmental conditions and the behaviour of occupants. Firstly,in Section 4.1, we introduce the scenario and formulate the problem and its objective. Then, in Section 4.2, we describethe models designed to mimic the environmental conditions, such as temperature, the different possible actions of theoccupants during a normal working day, and the transition states of the building actuators. Finally, Section 4.3 definesthe two metrics considered of interest to evaluate the performance of the proposed resource manager.
4.1. Problem statement
In the operational phase, we aim at developing a BMS capable of efficiently and automatically manage buildingelements and, thus, try to lower the overall building energy consumption whilst maintaining acceptable levels ofcomfort for occupants.
Indeed, besides energy consumption, another important metric to take into account in the operational phase ofbuilding automation is the comfort of occupants. In other terms, the environmental conditions in the building shouldbe comfortable and pleasant for all occupants, matching as much as possible their desires. It is clear that pursuingboth maximum comfort and minimum energy consumption may lead to contradictory actuations. For this very reason,we take into account both metrics in the design of our BMS and its decision-making process. It is worth mentioningthat we are not focussing on any specific architecture or protocol implementation. Examples of architectures that canbe adopted to avoid scalability issues can be found in [20, 22].
The proposed BMS receives two different inputs: i) the environmental conditions such as temperature, luminosity,air quality, etc. and ii) the movements and behaviours of the occupants of the building. With the latter, the BMSsets up and maintains occupants behavioural models. These models contain a set of actions that occupants are likelyto perform during the day. For instance, one action included in a model could be that a specific occupant is usuallyentering in a given room between 7.30 and 8.30 am with a 90% probability. Movements and actions of the occupantscan be tracked using both indoor and outdoor location services like in [9]. In any case, the construction of thesemodels is out of the scope of this paper and will be addressed in future works. On the contrary, we consider that thesemodels are already available and are inputs of our solution.
Using these models, the BMS monitors the status of the different rooms and, according to the expected movementsof occupants, operates the actuators in order to minimize the energy consumption while maintaining acceptable levelsof comfort. In order to provide to the system the time to take such decisions, we introduce a prediction threshold inSection 4.2.3, so that the BMS can act in advance with respect to actual occupant actions. For instance, the BMS canturn the HVAC on in a given room so that the desired temperature is reached just before the expected arrival of theoccupant. Or, if the occupants of a room are expected to go for lunch at 12.30 am for an hour, the BMS automaticallyturns off the lights in the room, places smart plugs in sleep mode, reduces the HVAC use, etc. just after the expectedaction is performed, without the need of human intervention.
7
4.2. System definition
This section presents the different models developed for environmental conditions, occupant movements and ac-tions, and actuators. Since many features depend on the type of the building (residential or commercial), this sectionalso makes reference to the specific building used for the performance evaluation in Section 5. Specifically, we con-sider an office building where occupants can be employees sharing rooms, area directors with their own offices, andexternal personnel like visitors, building caretakers, and janitors. Clusters of three different levels are considered:room, zone (a given set of rooms), and floor. Regarding the type of sensors that can be placed in a room, we consider(i) a single sensor able to gauge temperature and luminosity and to detect whether the room is empty and (ii) a sensorthat detects the status of a computer. In zone clusters, humidity and gas detection sensors can be installed. Only onealarm sensor is placed in the floor cluster. Concerning the actuators, each room is supposed to contain HVAC, smartplugs, and actuators for windows and doors.
4.2.1. EnvironmentEnvironmental conditions have an important impact on the energy consumption of a building. In this work, we
consider temperature, humidity, and luminosity. A model is provided for each of them. Table 2 shows the aver-age, minimum and maximum values considered for these three parameters, empirically collected on a winter day inBarcelona. The difference between these values and the desired conditions by building occupants mandates the use ofindoor HVAC and lights.
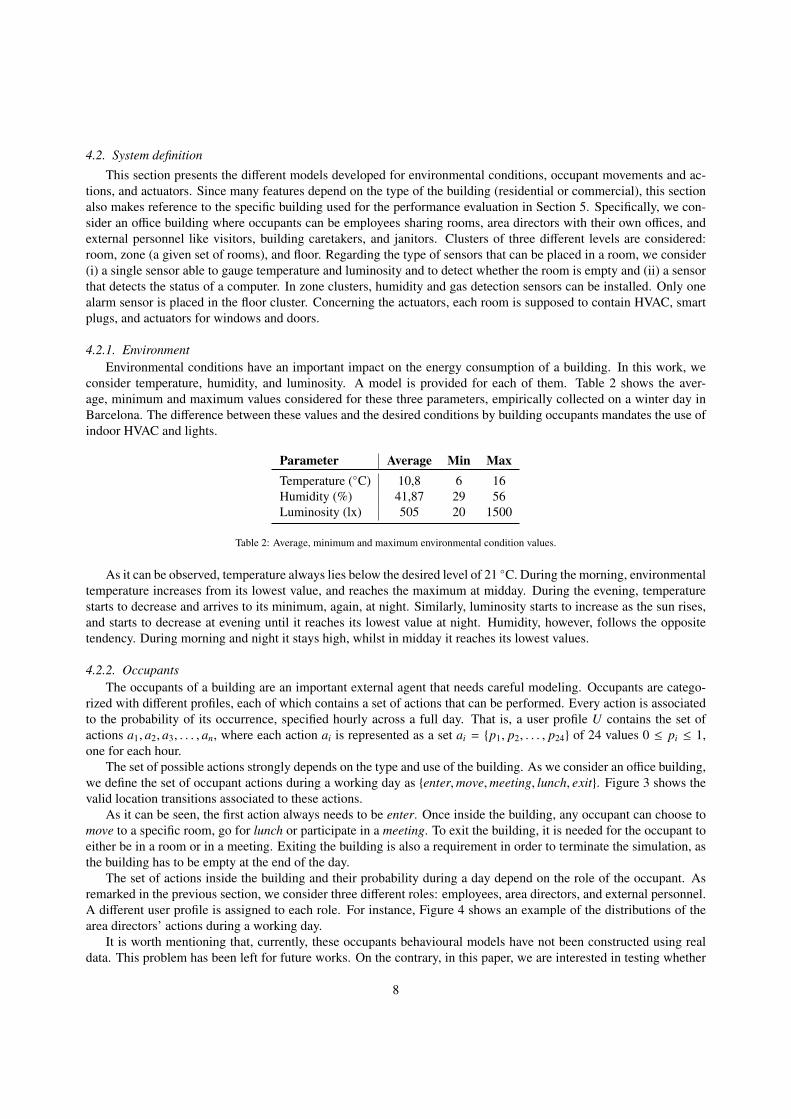
Parameter Average Min MaxTemperature (C) 10,8 6 16Humidity (%) 41,87 29 56Luminosity (lx) 505 20 1500
Table 2: Average, minimum and maximum environmental condition values.
As it can be observed, temperature always lies below the desired level of 21 C. During the morning, environmentaltemperature increases from its lowest value, and reaches the maximum at midday. During the evening, temperaturestarts to decrease and arrives to its minimum, again, at night. Similarly, luminosity starts to increase as the sun rises,and starts to decrease at evening until it reaches its lowest value at night. Humidity, however, follows the oppositetendency. During morning and night it stays high, whilst in midday it reaches its lowest values.
4.2.2. OccupantsThe occupants of a building are an important external agent that needs careful modeling. Occupants are catego-
rized with different profiles, each of which contains a set of actions that can be performed. Every action is associatedto the probability of its occurrence, specified hourly across a full day. That is, a user profile U contains the set ofactions a1, a2, a3, . . . , an, where each action ai is represented as a set ai = p1, p2, . . . , p24 of 24 values 0 ≤ pi ≤ 1,one for each hour.
The set of possible actions strongly depends on the type and use of the building. As we consider an office building,we define the set of occupant actions during a working day as enter,move,meeting, lunch, exit. Figure 3 shows thevalid location transitions associated to these actions.
As it can be seen, the first action always needs to be enter. Once inside the building, any occupant can choose tomove to a specific room, go for lunch or participate in a meeting. To exit the building, it is needed for the occupant toeither be in a room or in a meeting. Exiting the building is also a requirement in order to terminate the simulation, asthe building has to be empty at the end of the day.
The set of actions inside the building and their probability during a day depend on the role of the occupant. Asremarked in the previous section, we consider three different roles: employees, area directors, and external personnel.A different user profile is assigned to each role. For instance, Figure 4 shows an example of the distributions of thearea directors’ actions during a working day.
It is worth mentioning that, currently, these occupants behavioural models have not been constructed using realdata. This problem has been left for future works. On the contrary, in this paper, we are interested in testing whether
8
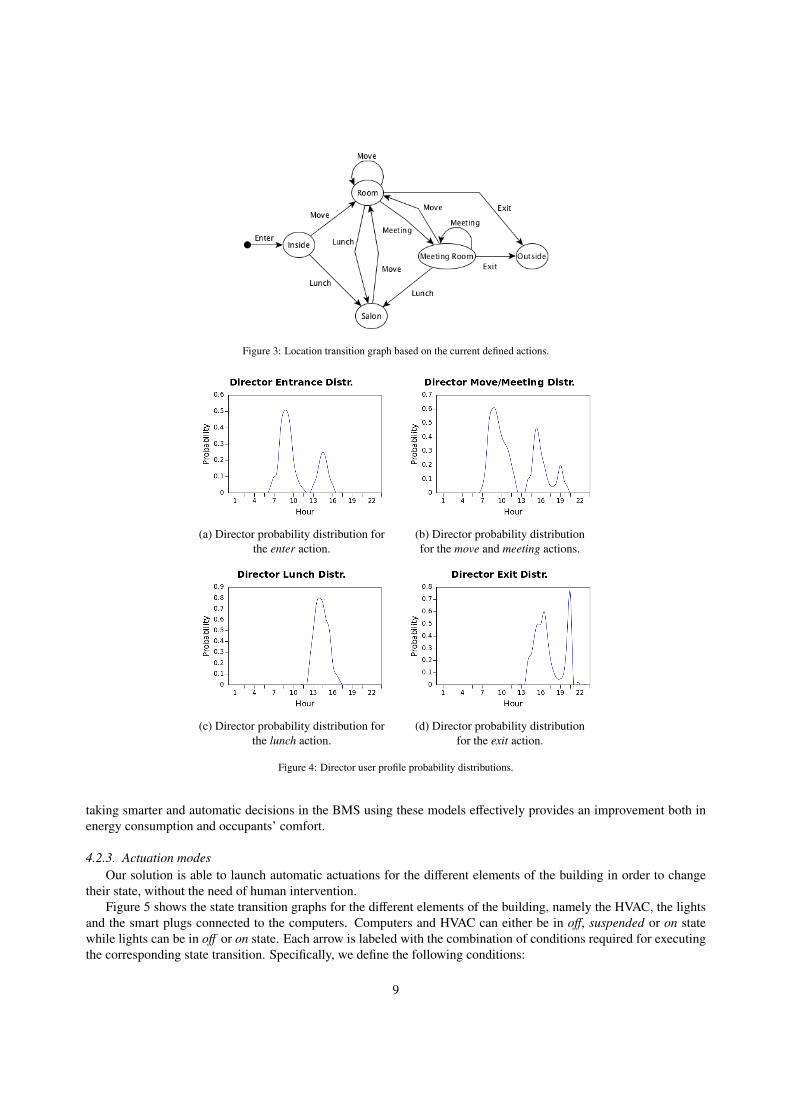
Figure 3: Location transition graph based on the current defined actions.
(a) Director probability distribution forthe enter action.
(b) Director probability distributionfor the move and meeting actions.
(c) Director probability distribution forthe lunch action.
(d) Director probability distributionfor the exit action.
Figure 4: Director user profile probability distributions.
taking smarter and automatic decisions in the BMS using these models effectively provides an improvement both inenergy consumption and occupants’ comfort.
4.2.3. Actuation modesOur solution is able to launch automatic actuations for the different elements of the building in order to change
their state, without the need of human intervention.Figure 5 shows the state transition graphs for the different elements of the building, namely the HVAC, the lights
and the smart plugs connected to the computers. Computers and HVAC can either be in off, suspended or on statewhile lights can be in off or on state. Each arrow is labeled with the combination of conditions required for executingthe corresponding state transition. Specifically, we define the following conditions:
9
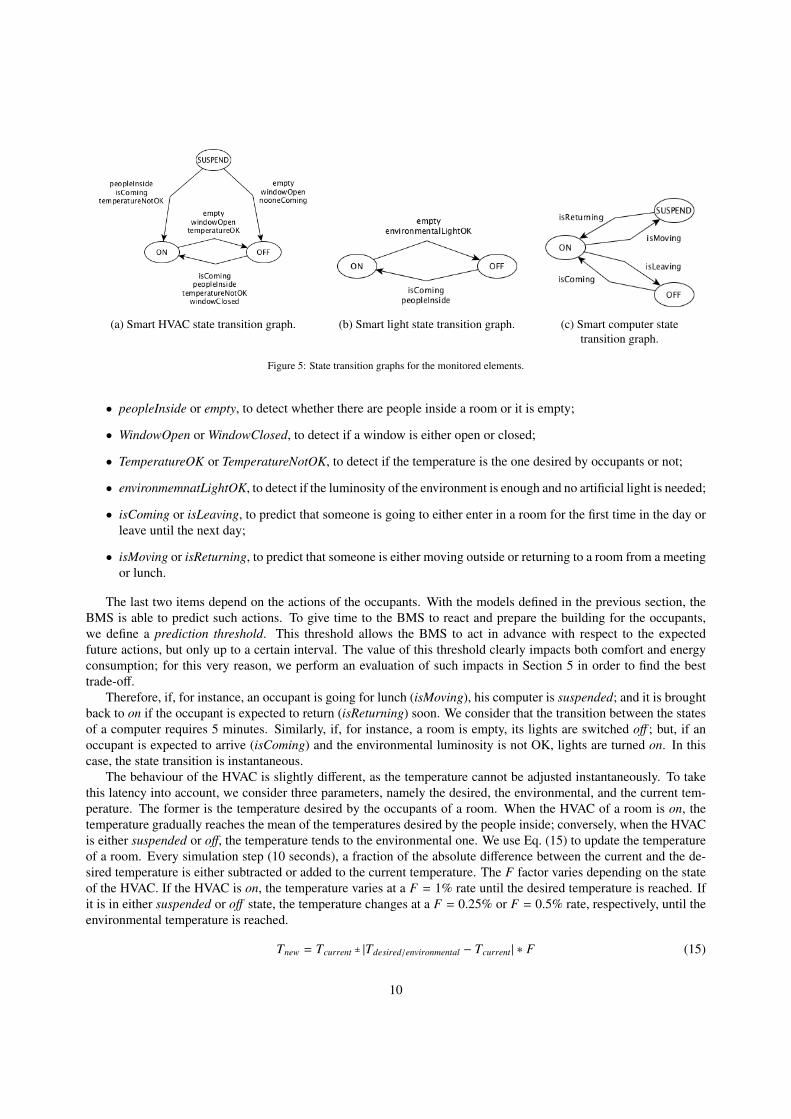
(a) Smart HVAC state transition graph. (b) Smart light state transition graph. (c) Smart computer statetransition graph.
Figure 5: State transition graphs for the monitored elements.
• peopleInside or empty, to detect whether there are people inside a room or it is empty;
• WindowOpen or WindowClosed, to detect if a window is either open or closed;
• TemperatureOK or TemperatureNotOK, to detect if the temperature is the one desired by occupants or not;
• environmemnatLightOK, to detect if the luminosity of the environment is enough and no artificial light is needed;
• isComing or isLeaving, to predict that someone is going to either enter in a room for the first time in the day orleave until the next day;
• isMoving or isReturning, to predict that someone is either moving outside or returning to a room from a meetingor lunch.
The last two items depend on the actions of the occupants. With the models defined in the previous section, theBMS is able to predict such actions. To give time to the BMS to react and prepare the building for the occupants,we define a prediction threshold. This threshold allows the BMS to act in advance with respect to the expectedfuture actions, but only up to a certain interval. The value of this threshold clearly impacts both comfort and energyconsumption; for this very reason, we perform an evaluation of such impacts in Section 5 in order to find the besttrade-off.
Therefore, if, for instance, an occupant is going for lunch (isMoving), his computer is suspended; and it is broughtback to on if the occupant is expected to return (isReturning) soon. We consider that the transition between the statesof a computer requires 5 minutes. Similarly, if, for instance, a room is empty, its lights are switched off ; but, if anoccupant is expected to arrive (isComing) and the environmental luminosity is not OK, lights are turned on. In thiscase, the state transition is instantaneous.
The behaviour of the HVAC is slightly different, as the temperature cannot be adjusted instantaneously. To takethis latency into account, we consider three parameters, namely the desired, the environmental, and the current tem-perature. The former is the temperature desired by the occupants of a room. When the HVAC of a room is on, thetemperature gradually reaches the mean of the temperatures desired by the people inside; conversely, when the HVACis either suspended or off, the temperature tends to the environmental one. We use Eq. (15) to update the temperatureof a room. Every simulation step (10 seconds), a fraction of the absolute difference between the current and the de-sired temperature is either subtracted or added to the current temperature. The F factor varies depending on the stateof the HVAC. If the HVAC is on, the temperature varies at a F = 1% rate until the desired temperature is reached. Ifit is in either suspended or off state, the temperature changes at a F = 0.25% or F = 0.5% rate, respectively, until theenvironmental temperature is reached.
Tnew = Tcurrent ± |Tdesired/environmental − Tcurrent | ∗ F (15)
10
4.3. Metrics
The two main metrics considered in our work are the overall building energy consumption and the comfort of theoccupants. Following sections aim at defining such metrics in more detail.
4.3.1. Energy consumptionWe consider that the building energy consumption depends on the HVAC systems, lights and computers. The
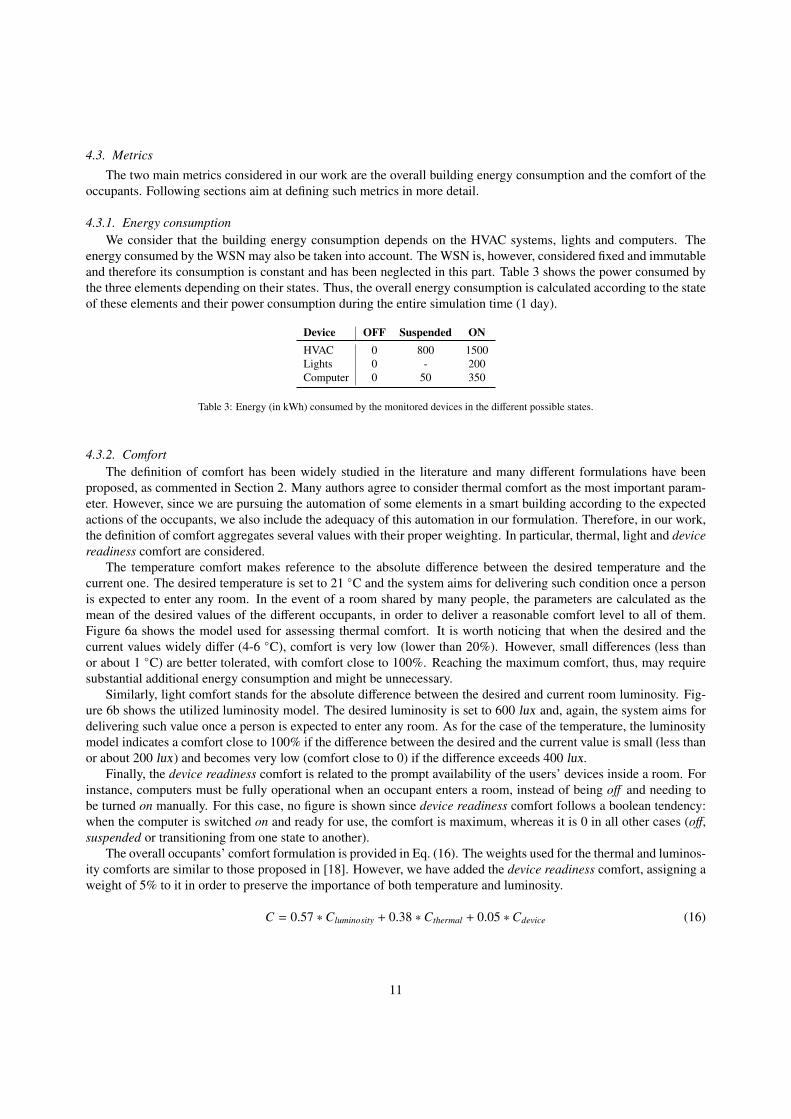
energy consumed by the WSN may also be taken into account. The WSN is, however, considered fixed and immutableand therefore its consumption is constant and has been neglected in this part. Table 3 shows the power consumed bythe three elements depending on their states. Thus, the overall energy consumption is calculated according to the stateof these elements and their power consumption during the entire simulation time (1 day).
Device OFF Suspended ONHVAC 0 800 1500Lights 0 - 200Computer 0 50 350
Table 3: Energy (in kWh) consumed by the monitored devices in the different possible states.
4.3.2. ComfortThe definition of comfort has been widely studied in the literature and many different formulations have been
proposed, as commented in Section 2. Many authors agree to consider thermal comfort as the most important param-eter. However, since we are pursuing the automation of some elements in a smart building according to the expectedactions of the occupants, we also include the adequacy of this automation in our formulation. Therefore, in our work,the definition of comfort aggregates several values with their proper weighting. In particular, thermal, light and devicereadiness comfort are considered.
The temperature comfort makes reference to the absolute difference between the desired temperature and thecurrent one. The desired temperature is set to 21 C and the system aims for delivering such condition once a personis expected to enter any room. In the event of a room shared by many people, the parameters are calculated as themean of the desired values of the different occupants, in order to deliver a reasonable comfort level to all of them.Figure 6a shows the model used for assessing thermal comfort. It is worth noticing that when the desired and thecurrent values widely differ (4-6 C), comfort is very low (lower than 20%). However, small differences (less thanor about 1 C) are better tolerated, with comfort close to 100%. Reaching the maximum comfort, thus, may requiresubstantial additional energy consumption and might be unnecessary.
Similarly, light comfort stands for the absolute difference between the desired and current room luminosity. Fig-ure 6b shows the utilized luminosity model. The desired luminosity is set to 600 lux and, again, the system aims fordelivering such value once a person is expected to enter any room. As for the case of the temperature, the luminositymodel indicates a comfort close to 100% if the difference between the desired and the current value is small (less thanor about 200 lux) and becomes very low (comfort close to 0) if the difference exceeds 400 lux.
Finally, the device readiness comfort is related to the prompt availability of the users’ devices inside a room. Forinstance, computers must be fully operational when an occupant enters a room, instead of being off and needing tobe turned on manually. For this case, no figure is shown since device readiness comfort follows a boolean tendency:when the computer is switched on and ready for use, the comfort is maximum, whereas it is 0 in all other cases (off,suspended or transitioning from one state to another).
The overall occupants’ comfort formulation is provided in Eq. (16). The weights used for the thermal and luminos-ity comforts are similar to those proposed in [18]. However, we have added the device readiness comfort, assigning aweight of 5% to it in order to preserve the importance of both temperature and luminosity.
C = 0.57 ∗Cluminosity + 0.38 ∗Cthermal + 0.05 ∗Cdevice (16)
11
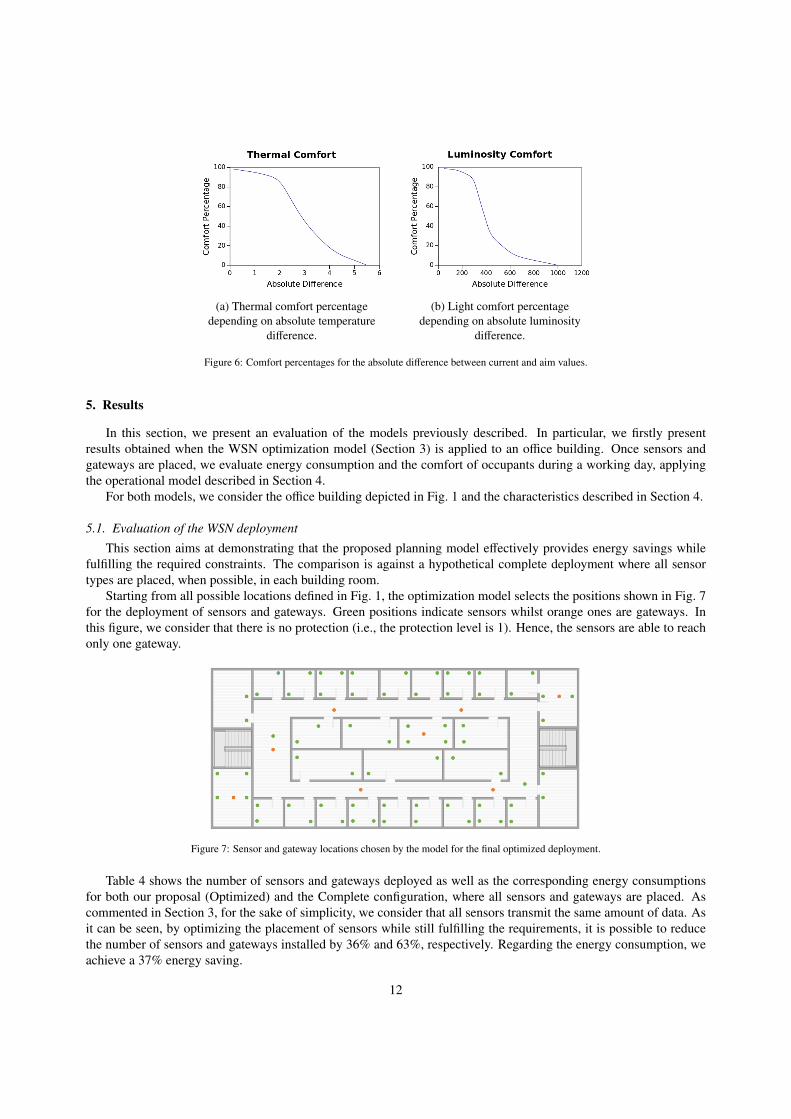
(a) Thermal comfort percentagedepending on absolute temperature
difference.
(b) Light comfort percentagedepending on absolute luminosity
difference.
Figure 6: Comfort percentages for the absolute difference between current and aim values.
5. Results
In this section, we present an evaluation of the models previously described. In particular, we firstly presentresults obtained when the WSN optimization model (Section 3) is applied to an office building. Once sensors andgateways are placed, we evaluate energy consumption and the comfort of occupants during a working day, applyingthe operational model described in Section 4.
For both models, we consider the office building depicted in Fig. 1 and the characteristics described in Section 4.
5.1. Evaluation of the WSN deployment
This section aims at demonstrating that the proposed planning model effectively provides energy savings whilefulfilling the required constraints. The comparison is against a hypothetical complete deployment where all sensortypes are placed, when possible, in each building room.
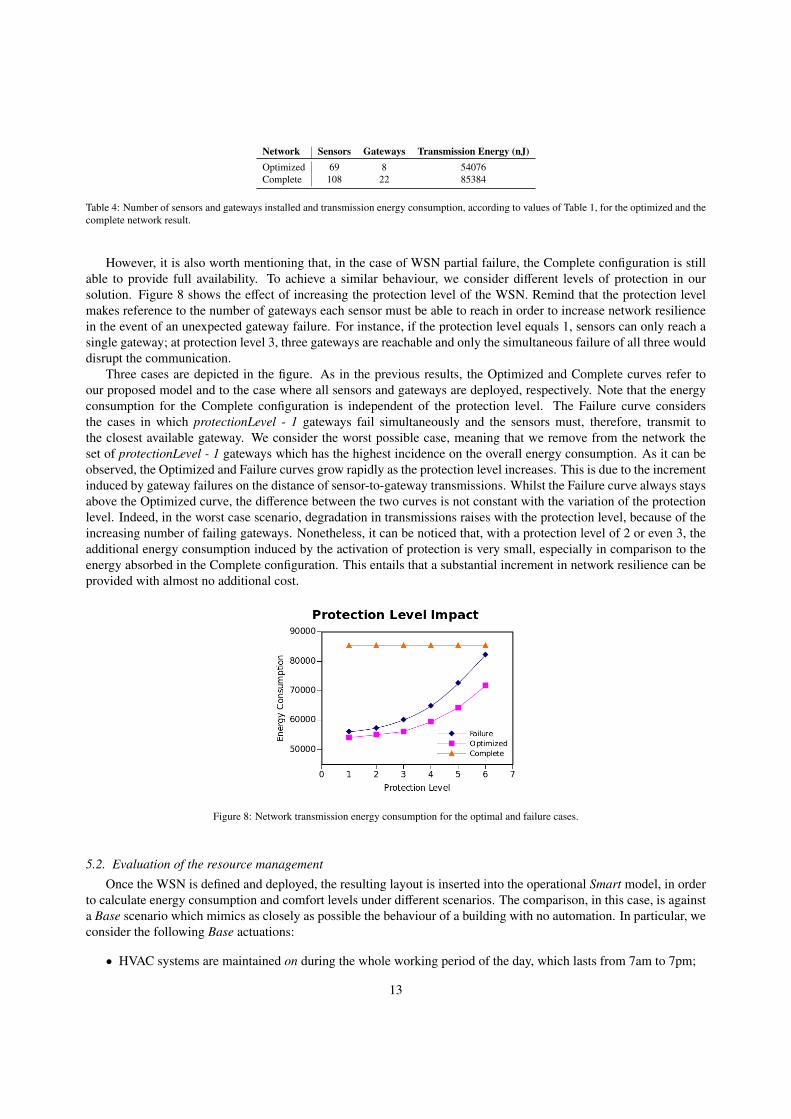
Starting from all possible locations defined in Fig. 1, the optimization model selects the positions shown in Fig. 7for the deployment of sensors and gateways. Green positions indicate sensors whilst orange ones are gateways. Inthis figure, we consider that there is no protection (i.e., the protection level is 1). Hence, the sensors are able to reachonly one gateway.
Figure 7: Sensor and gateway locations chosen by the model for the final optimized deployment.
Table 4 shows the number of sensors and gateways deployed as well as the corresponding energy consumptionsfor both our proposal (Optimized) and the Complete configuration, where all sensors and gateways are placed. Ascommented in Section 3, for the sake of simplicity, we consider that all sensors transmit the same amount of data. Asit can be seen, by optimizing the placement of sensors while still fulfilling the requirements, it is possible to reducethe number of sensors and gateways installed by 36% and 63%, respectively. Regarding the energy consumption, weachieve a 37% energy saving.
12
Network Sensors Gateways Transmission Energy (nJ)Optimized 69 8 54076Complete 108 22 85384
Table 4: Number of sensors and gateways installed and transmission energy consumption, according to values of Table 1, for the optimized and thecomplete network result.
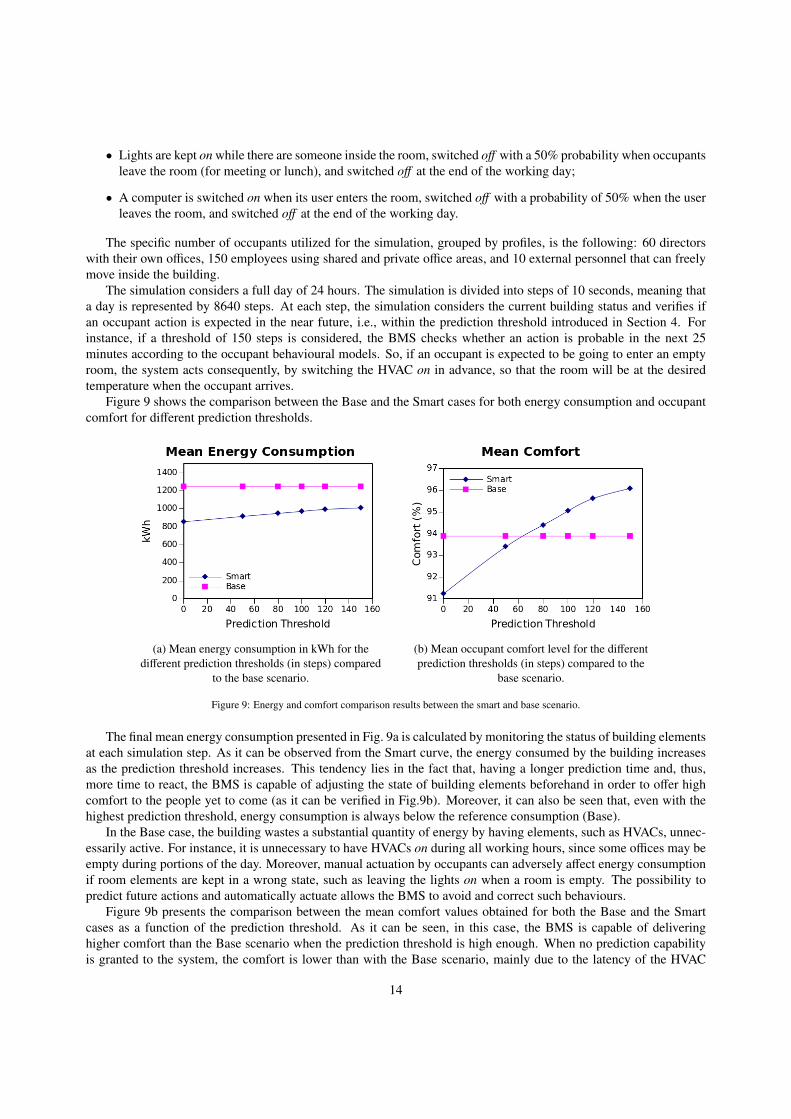
However, it is also worth mentioning that, in the case of WSN partial failure, the Complete configuration is stillable to provide full availability. To achieve a similar behaviour, we consider different levels of protection in oursolution. Figure 8 shows the effect of increasing the protection level of the WSN. Remind that the protection levelmakes reference to the number of gateways each sensor must be able to reach in order to increase network resiliencein the event of an unexpected gateway failure. For instance, if the protection level equals 1, sensors can only reach asingle gateway; at protection level 3, three gateways are reachable and only the simultaneous failure of all three woulddisrupt the communication.
Three cases are depicted in the figure. As in the previous results, the Optimized and Complete curves refer toour proposed model and to the case where all sensors and gateways are deployed, respectively. Note that the energyconsumption for the Complete configuration is independent of the protection level. The Failure curve considersthe cases in which protectionLevel - 1 gateways fail simultaneously and the sensors must, therefore, transmit tothe closest available gateway. We consider the worst possible case, meaning that we remove from the network theset of protectionLevel - 1 gateways which has the highest incidence on the overall energy consumption. As it can beobserved, the Optimized and Failure curves grow rapidly as the protection level increases. This is due to the incrementinduced by gateway failures on the distance of sensor-to-gateway transmissions. Whilst the Failure curve always staysabove the Optimized curve, the difference between the two curves is not constant with the variation of the protectionlevel. Indeed, in the worst case scenario, degradation in transmissions raises with the protection level, because of theincreasing number of failing gateways. Nonetheless, it can be noticed that, with a protection level of 2 or even 3, theadditional energy consumption induced by the activation of protection is very small, especially in comparison to theenergy absorbed in the Complete configuration. This entails that a substantial increment in network resilience can beprovided with almost no additional cost.
Figure 8: Network transmission energy consumption for the optimal and failure cases.
5.2. Evaluation of the resource management
Once the WSN is defined and deployed, the resulting layout is inserted into the operational Smart model, in orderto calculate energy consumption and comfort levels under different scenarios. The comparison, in this case, is againsta Base scenario which mimics as closely as possible the behaviour of a building with no automation. In particular, weconsider the following Base actuations:
• HVAC systems are maintained on during the whole working period of the day, which lasts from 7am to 7pm;
13
• Lights are kept on while there are someone inside the room, switched off with a 50% probability when occupantsleave the room (for meeting or lunch), and switched off at the end of the working day;
• A computer is switched on when its user enters the room, switched off with a probability of 50% when the userleaves the room, and switched off at the end of the working day.
The specific number of occupants utilized for the simulation, grouped by profiles, is the following: 60 directorswith their own offices, 150 employees using shared and private office areas, and 10 external personnel that can freelymove inside the building.
The simulation considers a full day of 24 hours. The simulation is divided into steps of 10 seconds, meaning thata day is represented by 8640 steps. At each step, the simulation considers the current building status and verifies ifan occupant action is expected in the near future, i.e., within the prediction threshold introduced in Section 4. Forinstance, if a threshold of 150 steps is considered, the BMS checks whether an action is probable in the next 25minutes according to the occupant behavioural models. So, if an occupant is expected to be going to enter an emptyroom, the system acts consequently, by switching the HVAC on in advance, so that the room will be at the desiredtemperature when the occupant arrives.
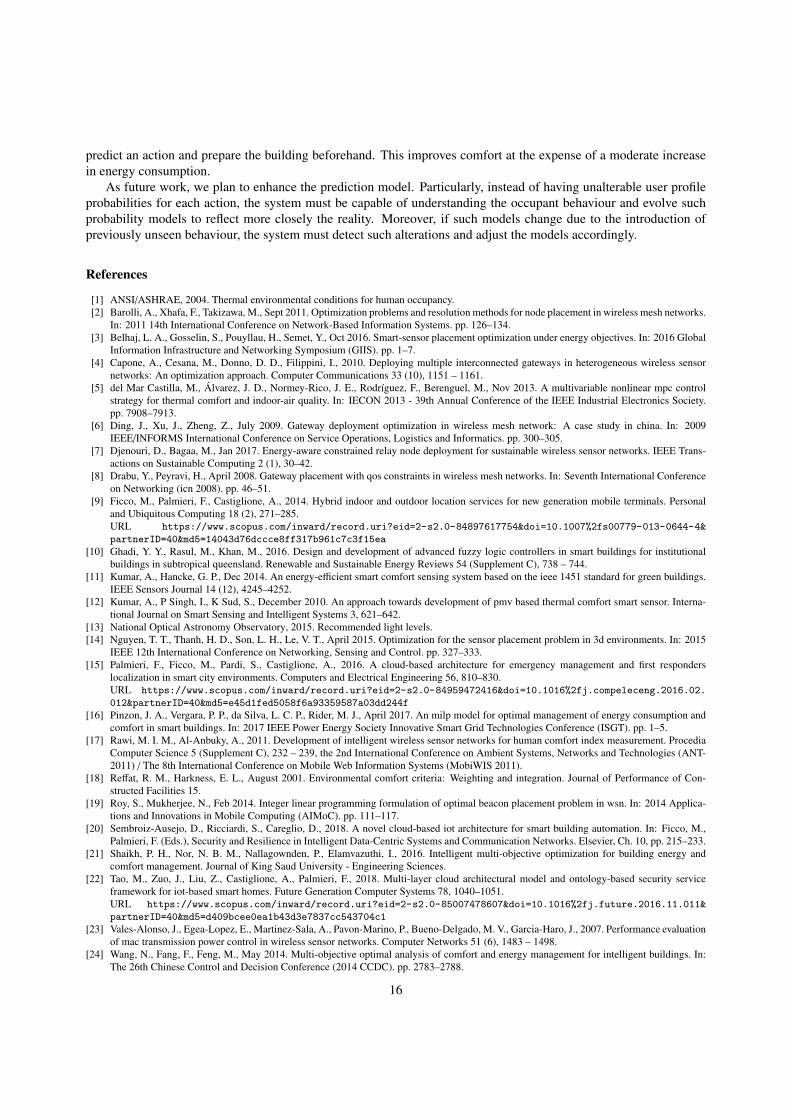
Figure 9 shows the comparison between the Base and the Smart cases for both energy consumption and occupantcomfort for different prediction thresholds.
(a) Mean energy consumption in kWh for thedifferent prediction thresholds (in steps) compared
to the base scenario.
(b) Mean occupant comfort level for the differentprediction thresholds (in steps) compared to the
base scenario.
Figure 9: Energy and comfort comparison results between the smart and base scenario.
The final mean energy consumption presented in Fig. 9a is calculated by monitoring the status of building elementsat each simulation step. As it can be observed from the Smart curve, the energy consumed by the building increasesas the prediction threshold increases. This tendency lies in the fact that, having a longer prediction time and, thus,more time to react, the BMS is capable of adjusting the state of building elements beforehand in order to offer highcomfort to the people yet to come (as it can be verified in Fig.9b). Moreover, it can also be seen that, even with thehighest prediction threshold, energy consumption is always below the reference consumption (Base).
In the Base case, the building wastes a substantial quantity of energy by having elements, such as HVACs, unnec-essarily active. For instance, it is unnecessary to have HVACs on during all working hours, since some offices may beempty during portions of the day. Moreover, manual actuation by occupants can adversely affect energy consumptionif room elements are kept in a wrong state, such as leaving the lights on when a room is empty. The possibility topredict future actions and automatically actuate allows the BMS to avoid and correct such behaviours.
Figure 9b presents the comparison between the mean comfort values obtained for both the Base and the Smartcases as a function of the prediction threshold. As it can be seen, in this case, the BMS is capable of deliveringhigher comfort than the Base scenario when the prediction threshold is high enough. When no prediction capabilityis granted to the system, the comfort is lower than with the Base scenario, mainly due to the latency of the HVAC
14

system in reaching the desired temperature inside the building, and the inability to switch elements like lights andcomputers on before the arrival of the occupants. In particular, the comfort of the occupants is reduced by 2.6%, butthe overall energy consumed is also reduced by 31%, which entails important savings. As the prediction thresholdincreases, the smart system is capable of adjusting room elements to create a comfortable workplace for the buildingoccupants. Specifically, using the highest prediction threshold, the BMS is capable of increasing the overall occupantcomfort by 2.2% with respect to the Base case and, at the same time, reduce the overall energy consumption by 19%.
In order to better understand the efficiency of the smart building prediction system in creating appropriate condi-tions, we present Table 5. This table summarizes the overall number of times each room is delivered with all its insideelements in the desired state. In the Base case, a state is correct if, in an empty room, all inside elements are switchedoff. For the Smart case, the elements have to be switched off except iff an occupant is expected to arrive soon. Whenthe room is occupied, the room is considered to be in a correct state iff all occupants are 95% comfortable accordingto Eq. 16. If at least one element is in a wrong state, the room is considered in a failure state.
Threshold Success Failure %Base 440692 103628 80.91Smart 0 502241 42079 92.27Smart 50 508145 36175 93.35Smart 80 510657 33663 93.82Smart 100 512191 32129 94.09Smart 120 513268 31052 94.29Smart 150 514164 30156 94.46
Table 5: Number of success and failure room status for the base and each smart threshold simulations.
As it can be seen, the Base case offers a good environment 81% of the time, while the Smart case with no predictionis capable of delivering the correct environment 92% of the time. The main difference is because, in the case of emptyrooms, the base system keeps elements on unnecessarily. The Smart system is capable of automatically turn devicesoff when rooms are empty, and adjust them fast enough to offer comfortable levels if an arrival is expected. As theprediction threshold increases, the success percentage also increases, getting to 94% with the maximum predictionthreshold considered.
In conclusion, we have been able to determine and control the trade-off between building energy consumption andoccupancy comfort. In the Smart scenarios, the comfort level can reach an average of 96% for all occupants (2% morethan the Base case) while the energy consumption is still 19% lower than the Base case.
6. Conclusions and Future Work
In this paper, we have presented novel models for the planning and operational problems in smart buildings.For the planning problem, we have proposed a MIP formulation for the optimal deployment of the building au-
tomation WSN. To this end, we have considered a model able to identify the optimal locations for different sensortypes and gateways, and optimize energy consumption while fulfilling connectivity, resource, protection, and cluster-ing coverage constraints. Obtained results show the capability of our proposal to reduce the amount of sensors andgateways needing to be deployed. For instance, we need about 37% less sensors, and 64% less gateways than withrespect to the case where all sensors and gateways are placed, with an overall energy savings of 36%. If protectionis enforced, the number of sensors and gateways increases as well as the energy consumption. Nonetheless, with aprotection level as high as 6, the energy bill is still 18% better.
For the operational problem, we have proposed a solution that, using behavioural models, is able to efficientlyconfigure the different building elements while maintaining, or even improving, occupant comfort. Behavioural mod-els are used to predict the occupants’ actions and act accordingly. The system is able to act proactively and configurethe building in a better and faster way if a prediction threshold is adopted. For instance, we can reduce the energyconsumption in a range between 20% and 32% with respect to the case with no automation. Nonetheless, the greatestsavings are obtained when no prediction is used as the system acts only when the occupant actually performs an ac-tion. However, this is also associated with the lowest comfort. When a threshold is applied, the system can accurately
15
predict an action and prepare the building beforehand. This improves comfort at the expense of a moderate increasein energy consumption.
As future work, we plan to enhance the prediction model. Particularly, instead of having unalterable user profileprobabilities for each action, the system must be capable of understanding the occupant behaviour and evolve suchprobability models to reflect more closely the reality. Moreover, if such models change due to the introduction ofpreviously unseen behaviour, the system must detect such alterations and adjust the models accordingly.
References
[1] ANSI/ASHRAE, 2004. Thermal environmental conditions for human occupancy.[2] Barolli, A., Xhafa, F., Takizawa, M., Sept 2011. Optimization problems and resolution methods for node placement in wireless mesh networks.
In: 2011 14th International Conference on Network-Based Information Systems. pp. 126–134.[3] Belhaj, L. A., Gosselin, S., Pouyllau, H., Semet, Y., Oct 2016. Smart-sensor placement optimization under energy objectives. In: 2016 Global
Information Infrastructure and Networking Symposium (GIIS). pp. 1–7.[4] Capone, A., Cesana, M., Donno, D. D., Filippini, I., 2010. Deploying multiple interconnected gateways in heterogeneous wireless sensor
networks: An optimization approach. Computer Communications 33 (10), 1151 – 1161.[5] del Mar Castilla, M., Alvarez, J. D., Normey-Rico, J. E., Rodrıguez, F., Berenguel, M., Nov 2013. A multivariable nonlinear mpc control
strategy for thermal comfort and indoor-air quality. In: IECON 2013 - 39th Annual Conference of the IEEE Industrial Electronics Society.pp. 7908–7913.
[6] Ding, J., Xu, J., Zheng, Z., July 2009. Gateway deployment optimization in wireless mesh network: A case study in china. In: 2009IEEE/INFORMS International Conference on Service Operations, Logistics and Informatics. pp. 300–305.
[7] Djenouri, D., Bagaa, M., Jan 2017. Energy-aware constrained relay node deployment for sustainable wireless sensor networks. IEEE Trans-actions on Sustainable Computing 2 (1), 30–42.
[8] Drabu, Y., Peyravi, H., April 2008. Gateway placement with qos constraints in wireless mesh networks. In: Seventh International Conferenceon Networking (icn 2008). pp. 46–51.
[9] Ficco, M., Palmieri, F., Castiglione, A., 2014. Hybrid indoor and outdoor location services for new generation mobile terminals. Personaland Ubiquitous Computing 18 (2), 271–285.URL https://www.scopus.com/inward/record.uri?eid=2-s2.0-84897617754&doi=10.1007%2fs00779-013-0644-4&
partnerID=40&md5=14043d76dccce8ff317b961c7c3f15ea
[10] Ghadi, Y. Y., Rasul, M., Khan, M., 2016. Design and development of advanced fuzzy logic controllers in smart buildings for institutionalbuildings in subtropical queensland. Renewable and Sustainable Energy Reviews 54 (Supplement C), 738 – 744.
[11] Kumar, A., Hancke, G. P., Dec 2014. An energy-efficient smart comfort sensing system based on the ieee 1451 standard for green buildings.IEEE Sensors Journal 14 (12), 4245–4252.
[12] Kumar, A., P Singh, I., K Sud, S., December 2010. An approach towards development of pmv based thermal comfort smart sensor. Interna-tional Journal on Smart Sensing and Intelligent Systems 3, 621–642.
[13] National Optical Astronomy Observatory, 2015. Recommended light levels.[14] Nguyen, T. T., Thanh, H. D., Son, L. H., Le, V. T., April 2015. Optimization for the sensor placement problem in 3d environments. In: 2015
IEEE 12th International Conference on Networking, Sensing and Control. pp. 327–333.[15] Palmieri, F., Ficco, M., Pardi, S., Castiglione, A., 2016. A cloud-based architecture for emergency management and first responders
localization in smart city environments. Computers and Electrical Engineering 56, 810–830.URL https://www.scopus.com/inward/record.uri?eid=2-s2.0-84959472416&doi=10.1016%2fj.compeleceng.2016.02.
012&partnerID=40&md5=e45d1fed5058f6a93359587a03dd244f
[16] Pinzon, J. A., Vergara, P. P., da Silva, L. C. P., Rider, M. J., April 2017. An milp model for optimal management of energy consumption andcomfort in smart buildings. In: 2017 IEEE Power Energy Society Innovative Smart Grid Technologies Conference (ISGT). pp. 1–5.
[17] Rawi, M. I. M., Al-Anbuky, A., 2011. Development of intelligent wireless sensor networks for human comfort index measurement. ProcediaComputer Science 5 (Supplement C), 232 – 239, the 2nd International Conference on Ambient Systems, Networks and Technologies (ANT-2011) / The 8th International Conference on Mobile Web Information Systems (MobiWIS 2011).
[18] Reffat, R. M., Harkness, E. L., August 2001. Environmental comfort criteria: Weighting and integration. Journal of Performance of Con-structed Facilities 15.
[19] Roy, S., Mukherjee, N., Feb 2014. Integer linear programming formulation of optimal beacon placement problem in wsn. In: 2014 Applica-tions and Innovations in Mobile Computing (AIMoC). pp. 111–117.
[20] Sembroiz-Ausejo, D., Ricciardi, S., Careglio, D., 2018. A novel cloud-based iot architecture for smart building automation. In: Ficco, M.,Palmieri, F. (Eds.), Security and Resilience in Intelligent Data-Centric Systems and Communication Networks. Elsevier, Ch. 10, pp. 215–233.
[21] Shaikh, P. H., Nor, N. B. M., Nallagownden, P., Elamvazuthi, I., 2016. Intelligent multi-objective optimization for building energy andcomfort management. Journal of King Saud University - Engineering Sciences.
[22] Tao, M., Zuo, J., Liu, Z., Castiglione, A., Palmieri, F., 2018. Multi-layer cloud architectural model and ontology-based security serviceframework for iot-based smart homes. Future Generation Computer Systems 78, 1040–1051.URL https://www.scopus.com/inward/record.uri?eid=2-s2.0-85007478607&doi=10.1016%2fj.future.2016.11.011&
partnerID=40&md5=d409bcee0ea1b43d3e7837cc543704c1
[23] Vales-Alonso, J., Egea-Lopez, E., Martinez-Sala, A., Pavon-Marino, P., Bueno-Delgado, M. V., Garcia-Haro, J., 2007. Performance evaluationof mac transmission power control in wireless sensor networks. Computer Networks 51 (6), 1483 – 1498.
[24] Wang, N., Fang, F., Feng, M., May 2014. Multi-objective optimal analysis of comfort and energy management for intelligent buildings. In:The 26th Chinese Control and Decision Conference (2014 CCDC). pp. 2783–2788.
16