pk / pd concepts in clinical research - phusewiki.org 2014 sde presentations/pk... · ivivc toolkit...
TRANSCRIPT
-Dhanashri Gudi, Ph.D. Founder, EduCater
Presented at:
PhUSE SDE 2014 PKPD Concepts and Programming
06 Dec 2014 Bangalore, INDIA
PK / PD Concepts in Clinical Research
2
Mission- Building Knowledge-Inspiring Minds
o EduCater provides highly specialized, practical and theoretical knowledge driven training programs.
o USP-Focus on key areas for pharmaceutical R&D where limited training is available in India..
o Training to build solid scientific foundation to create scientists and leaders in the field.
o Experienced and renowned trainers and speakers are hand-picked to bring authentic information and knowledge.
o Limited class-size to enable participants to interact with speakers.
3
Training Events at EduCater n Workshop on PK/PD modeling (Dec 2011) Jonathan Wagg n 3 day Course on “Unlocking the Mystery of
Pharmacokinetics” (July 2012) Dr. Shashank Rohatagi
n Software based Training: Collaboration with Certara (Pharsight) (since May 2012) o Introduction to Phoenix WinNonlin at Mumbai, Hyderabad,
Bangalore (7 workshops of 2.5days) o IVIVC toolkit for Phoenix WinNonlin, Mumbai o Population PKPD analysis using Phoenix NLME o Intermediate PK/PD Modeling using PHX WNL
n “Statistics in Pharmaceutical Development” (May 2013) n “R in Clinical Trial Data Analysis” (June 2014)
Outline and Agenda o What is Pharmacokinetics o Why Pharmacokinetics o Processes that govern the Pharmacokinetics o Pharmacokinetic Parameters o Types of Kinetics o Noncompartmental Modeling (Plasma and Urine NCA) o Compartmental Modeling o Examples o What is Pharmcodymics o Types of PD Models o PK/PD link Models o Demonstration of Phoenix ® WinNonlin®
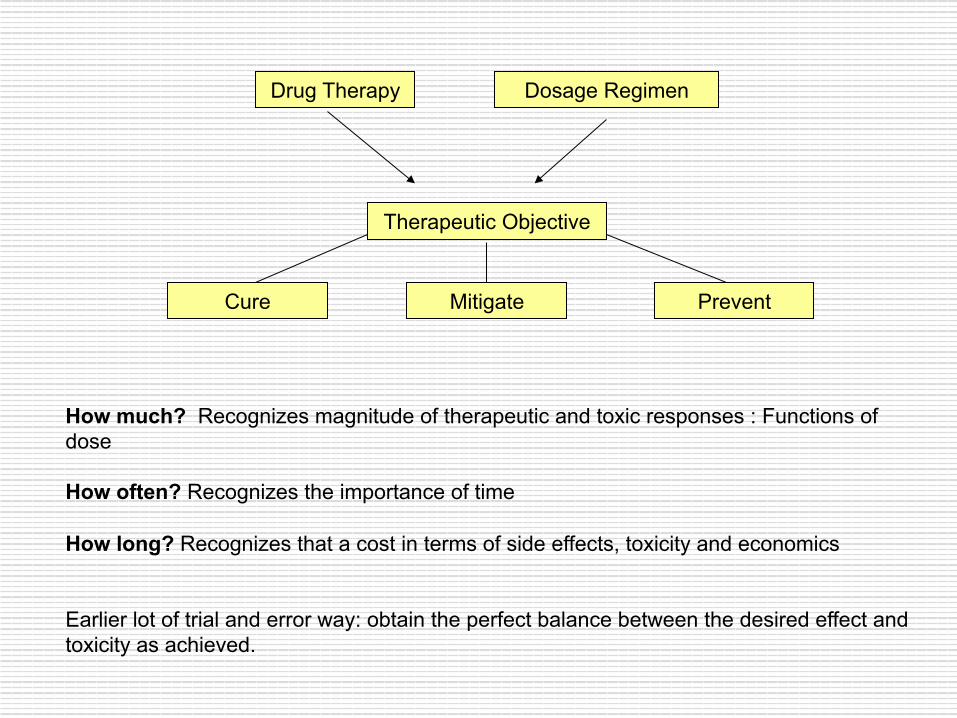
Drug Therapy Dosage Regimen
Therapeutic Objective
Cure Mitigate Prevent
How much? Recognizes magnitude of therapeutic and toxic responses : Functions of dose How often? Recognizes the importance of time How long? Recognizes that a cost in terms of side effects, toxicity and economics Earlier lot of trial and error way: obtain the perfect balance between the desired effect and toxicity as achieved.
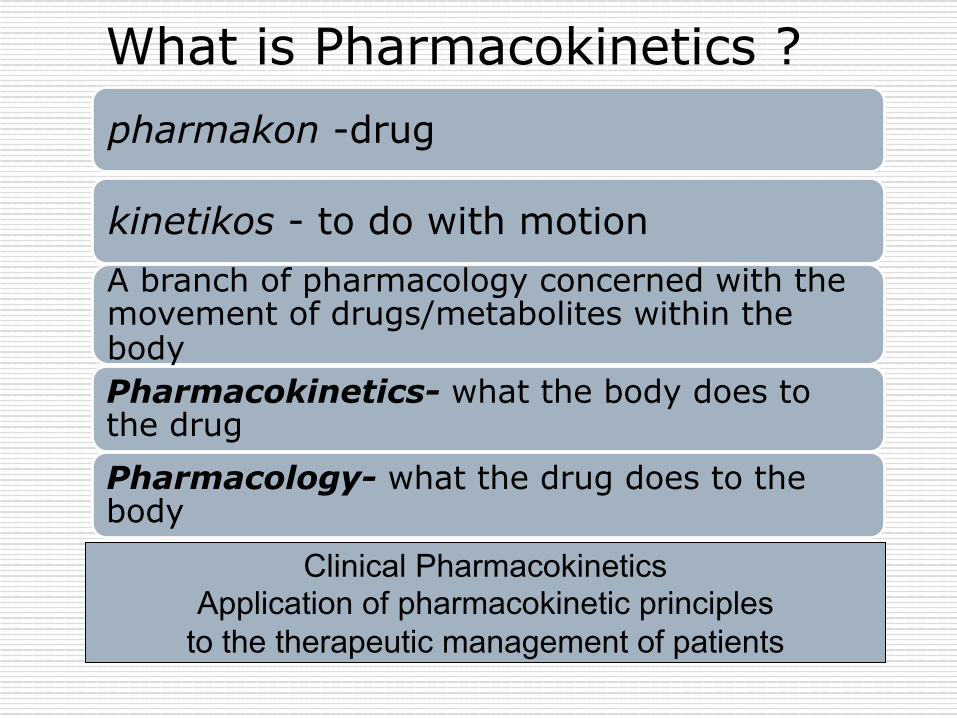
What is Pharmacokinetics ? pharmakon -drug
kinetikos - to do with motion A branch of pharmacology concerned with the movement of drugs/metabolites within the body
Pharmacology- what the drug does to the body
Pharmacokinetics- what the body does to the drug
Clinical Pharmacokinetics Application of pharmacokinetic principles
to the therapeutic management of patients
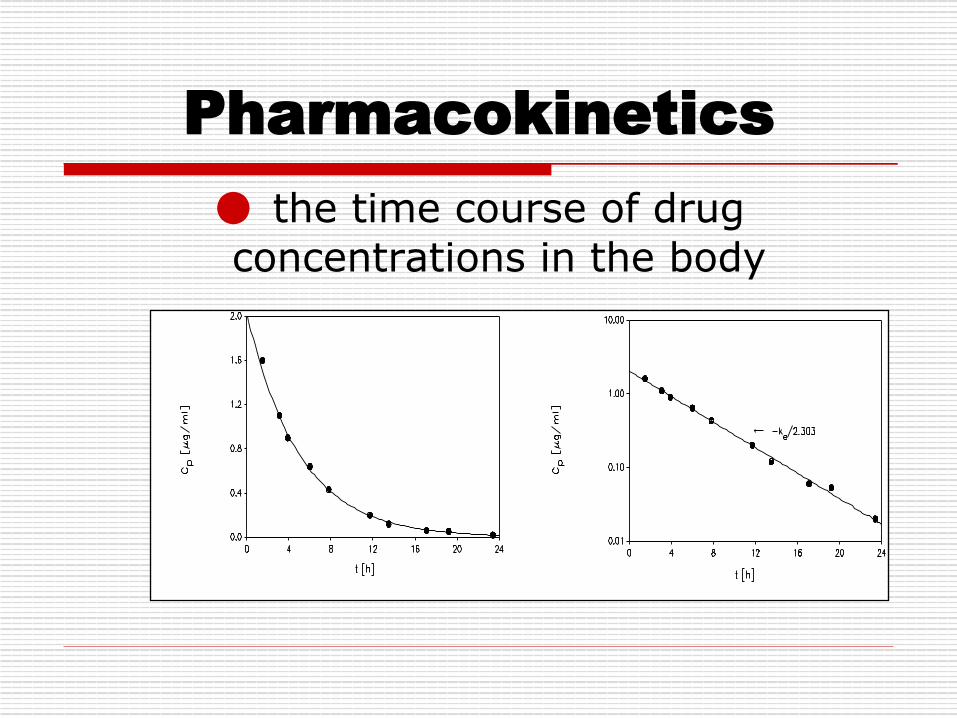
Pharmacokinetics ● the time course of drug concentrations in the body
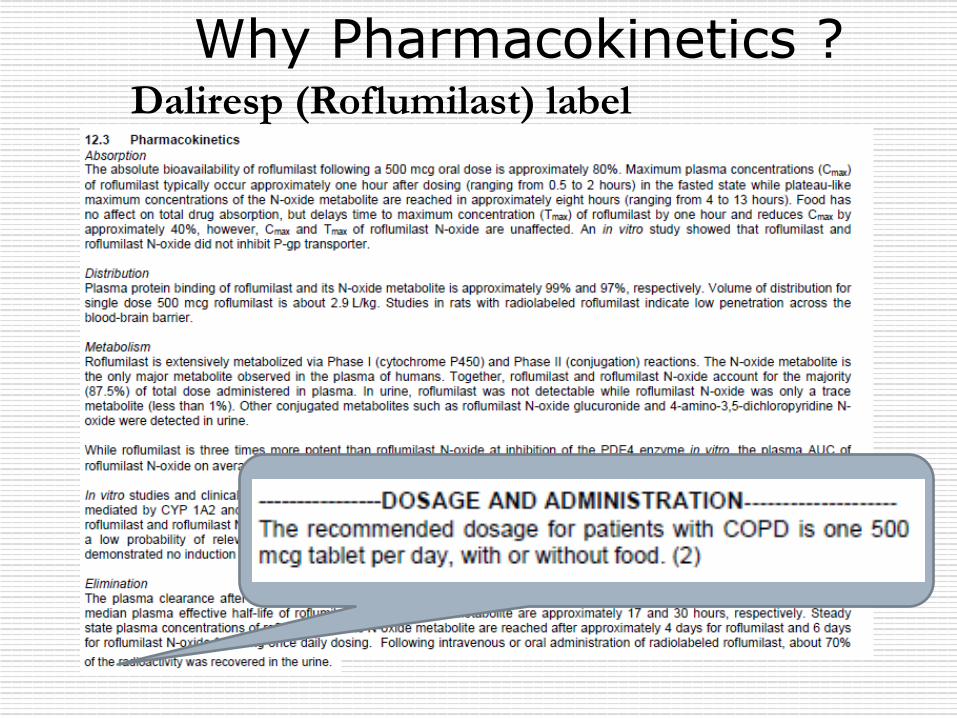
Why Pharmacokinetics ? Daliresp (Roflumilast) label
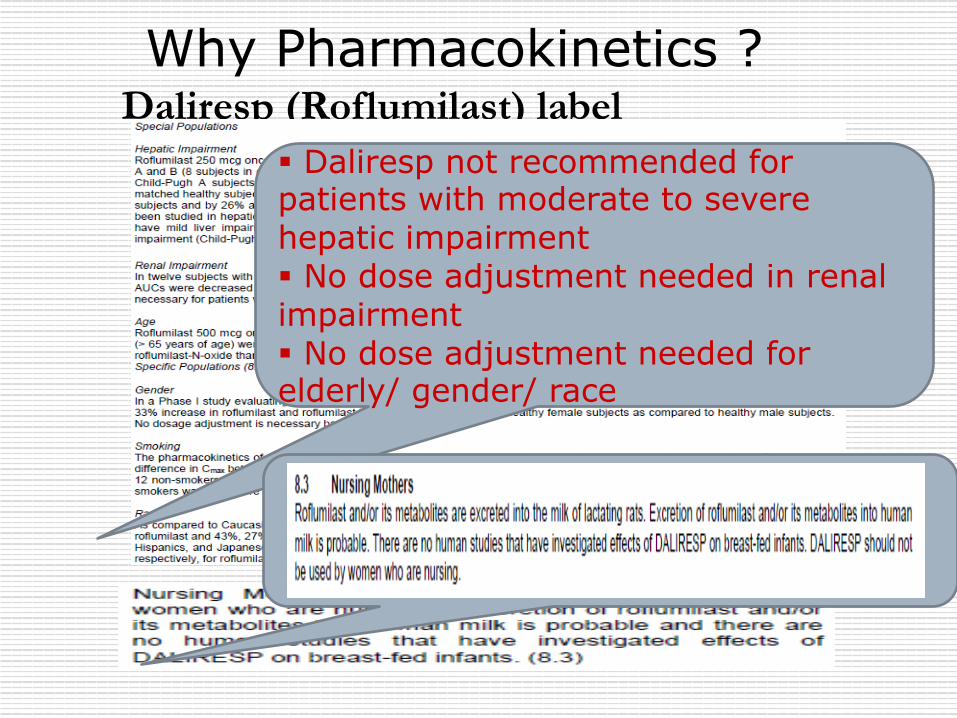
Why Pharmacokinetics ? Daliresp (Roflumilast) label
§ Daliresp not recommended for patients with moderate to severe hepatic impairment § No dose adjustment needed in renal impairment § No dose adjustment needed for elderly/ gender/ race
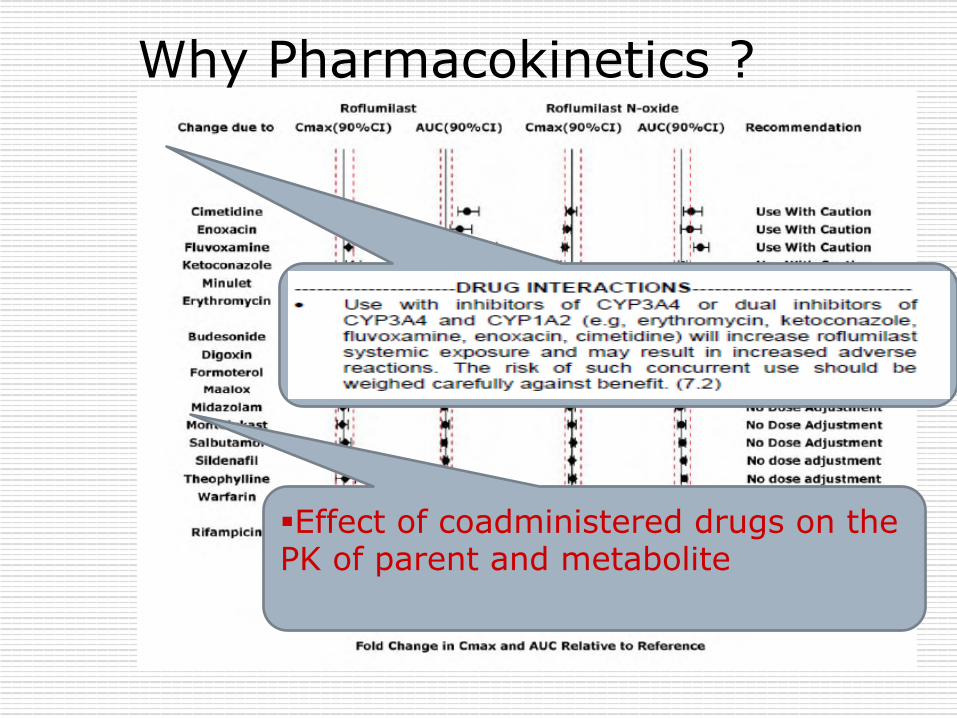
Why Pharmacokinetics ?
§ Effect of coadministered drugs on the PK of parent and metabolite
12
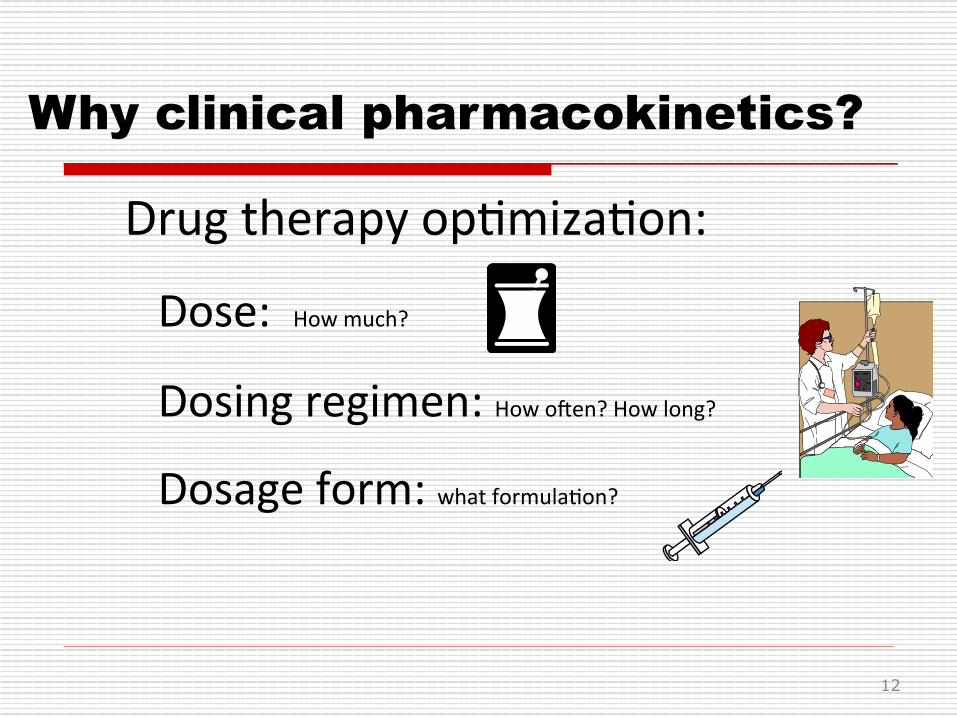
Drug therapy op-miza-on:
Dose: How much?
Dosing regimen: How o8en? How long?
Dosage form: what formula-on?
Why clinical pharmacokinetics?
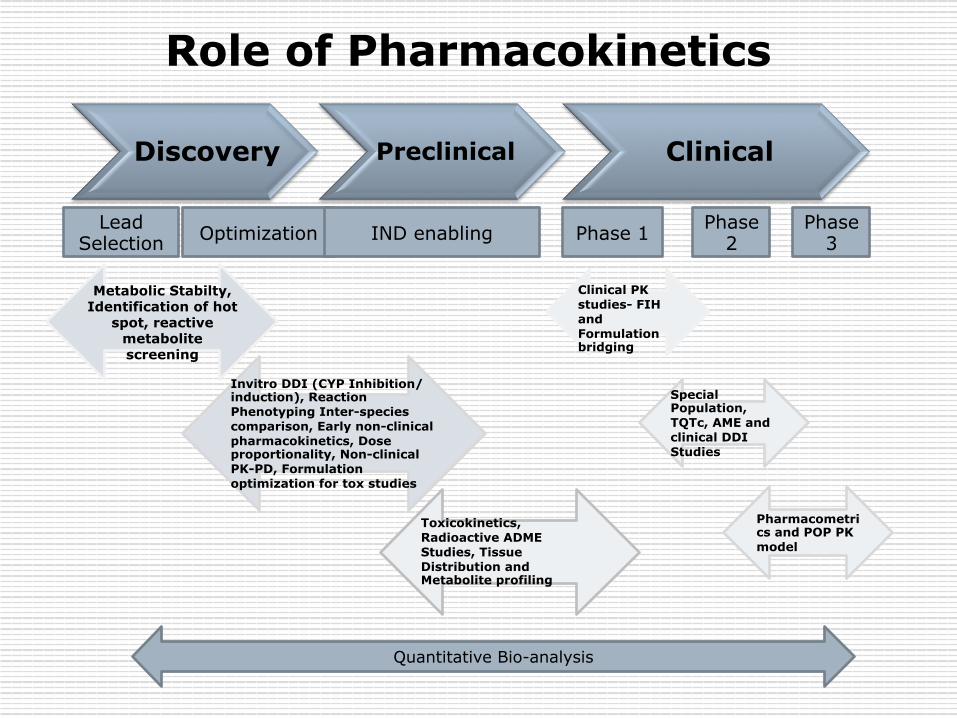
Discovery Preclinical Clinical
Lead Selection Optimization IND enabling Phase 1 Phase
2 Phase
3
Metabolic Stabilty, Identification of hot
spot, reactive metabolite screening
Invitro DDI (CYP Inhibition/induction), Reaction Phenotyping Inter-species comparison, Early non-clinical pharmacokinetics, Dose proportionality, Non-clinical PK-PD, Formulation optimization for tox studies
Toxicokinetics, Radioactive ADME Studies, Tissue Distribution and Metabolite profiling
Quantitative Bio-analysis
Clinical PK studies- FIH and Formulation bridging
Special Population, TQTc, AME and clinical DDI Studies
Pharmacometrics and POP PK model
Role of Pharmacokinetics
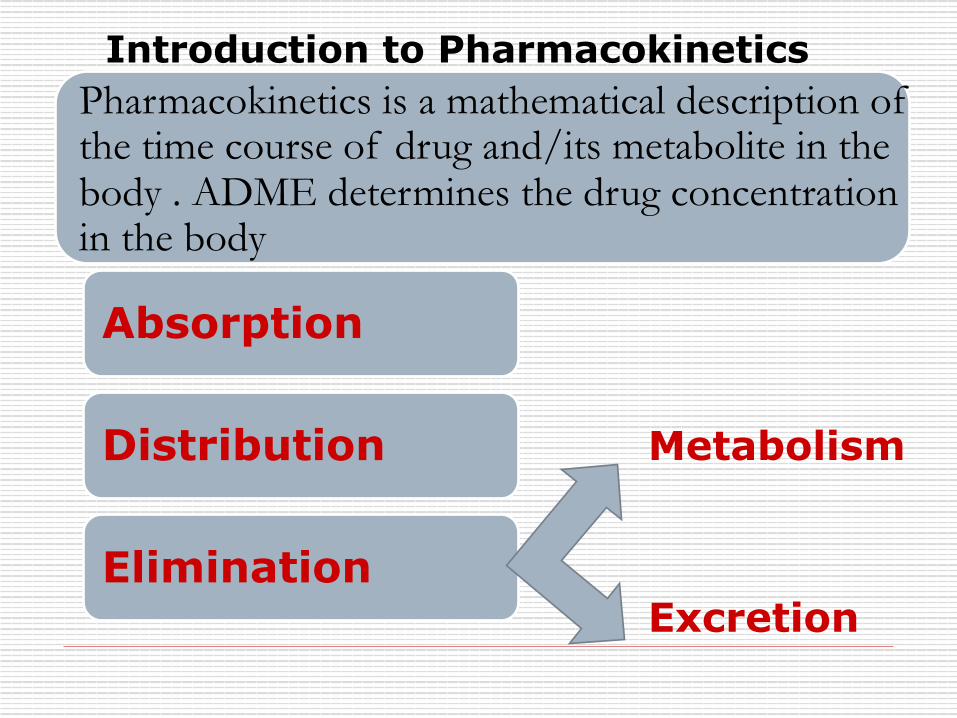
Metabolism Excretion
Introduction to Pharmacokinetics Pharmacokinetics is a mathematical description of the time course of drug and/its metabolite in the body . ADME determines the drug concentration in the body
Absorption
Distribution
Elimination
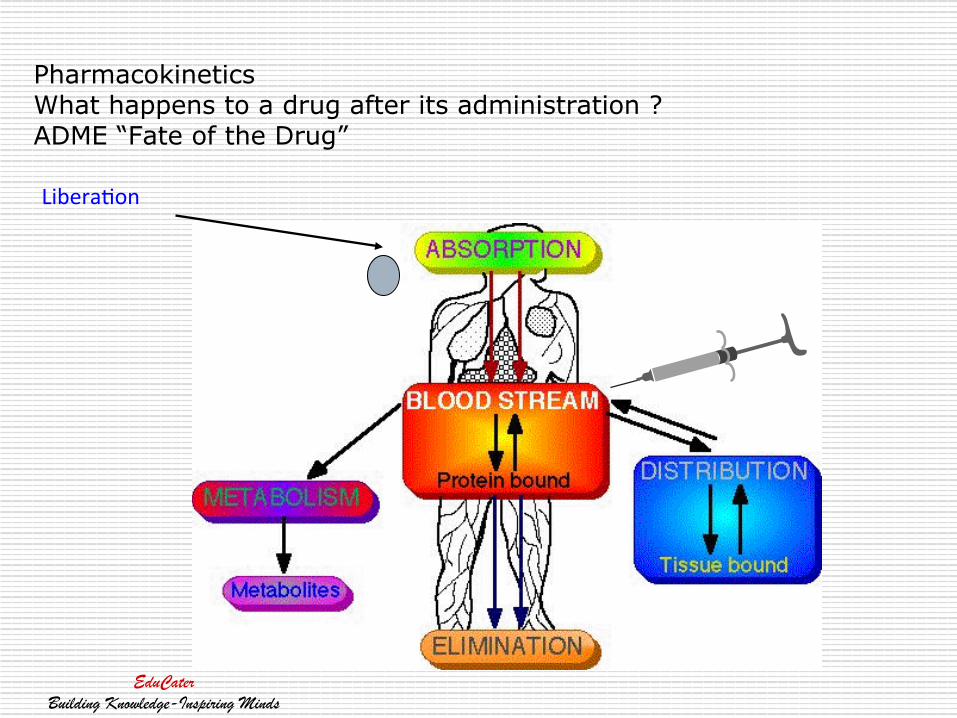
Pharmacokinetics What happens to a drug after its administration ? ADME “Fate of the Drug”
Libera-on
EduCaterBuilding Knowledge-Inspiring Minds
EduCaterBuilding Knowledge-Inspiring Minds
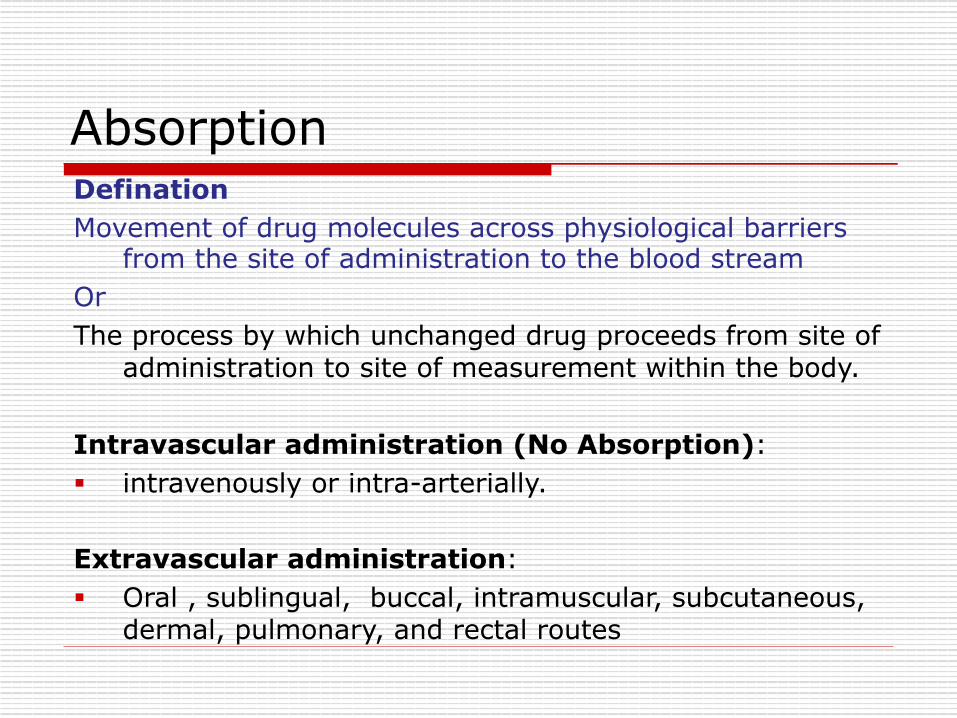
Defination Movement of drug molecules across physiological barriers
from the site of administration to the blood stream Or The process by which unchanged drug proceeds from site of
administration to site of measurement within the body. Intravascular administration (No Absorption): § intravenously or intra-arterially. Extravascular administration: § Oral , sublingual, buccal, intramuscular, subcutaneous,
dermal, pulmonary, and rectal routes
Absorption
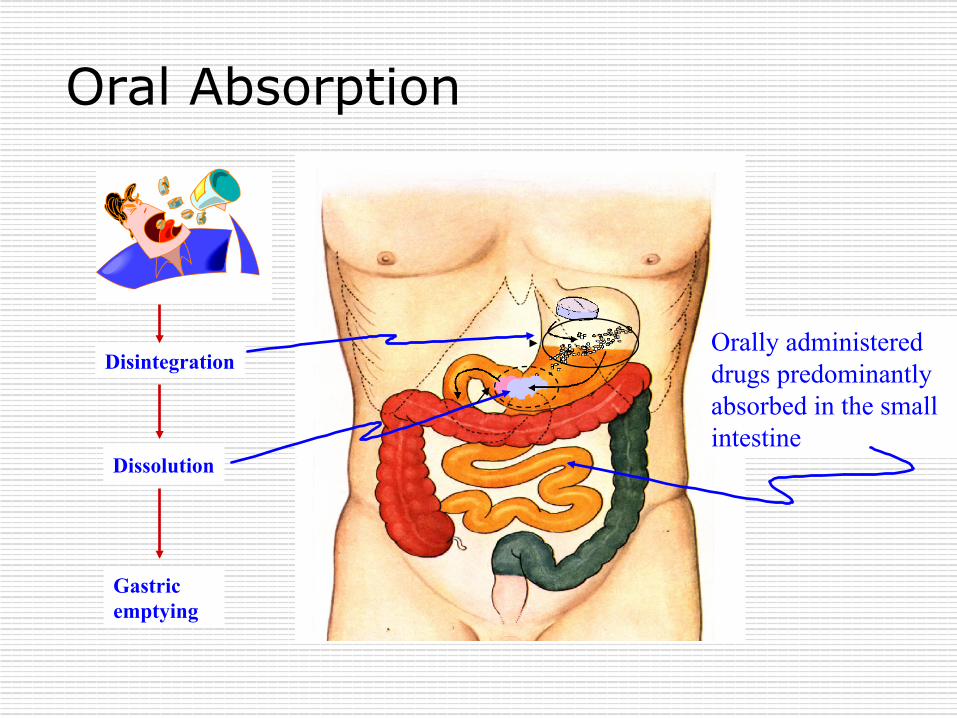
Oral Absorption
Disintegration
Dissolution
Gastric emptying
Orally administered drugs predominantly absorbed in the small intestine
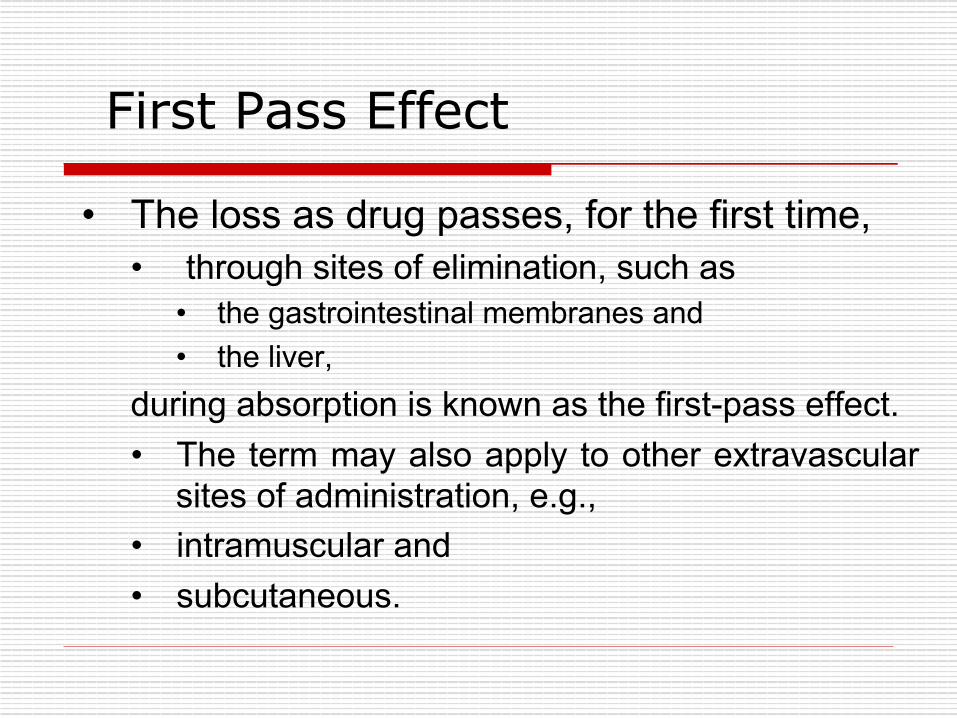
First Pass Effect
• The loss as drug passes, for the first time, • through sites of elimination, such as
• the gastrointestinal membranes and • the liver,
during absorption is known as the first-pass effect. • The term may also apply to other extravascular
sites of administration, e.g., • intramuscular and • subcutaneous.
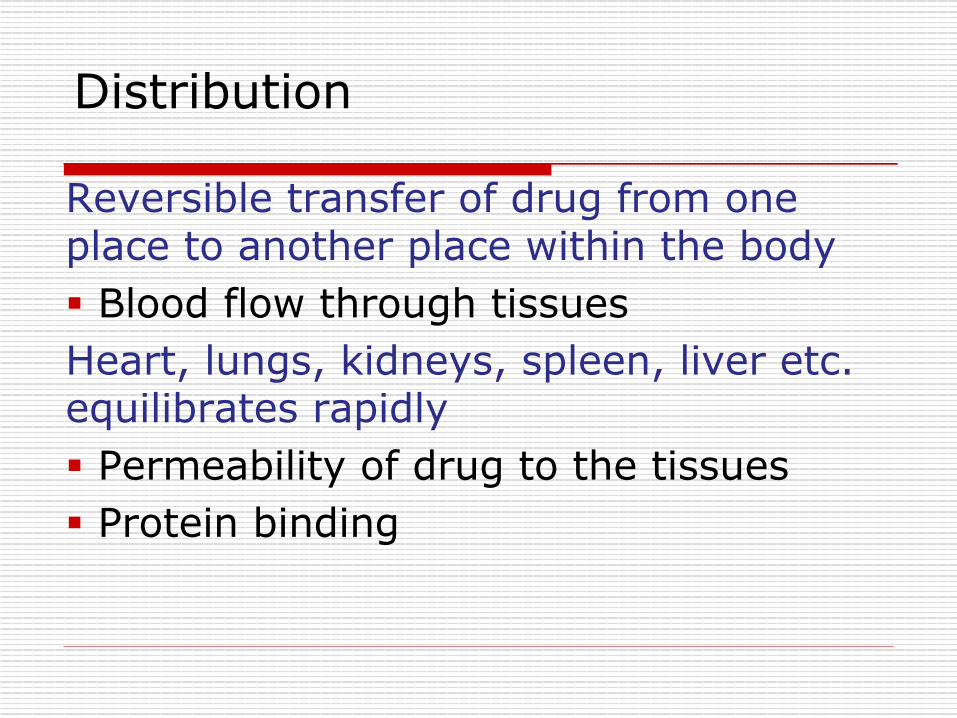
Reversible transfer of drug from one place to another place within the body § Blood flow through tissues Heart, lungs, kidneys, spleen, liver etc. equilibrates rapidly § Permeability of drug to the tissues § Protein binding
Distribution
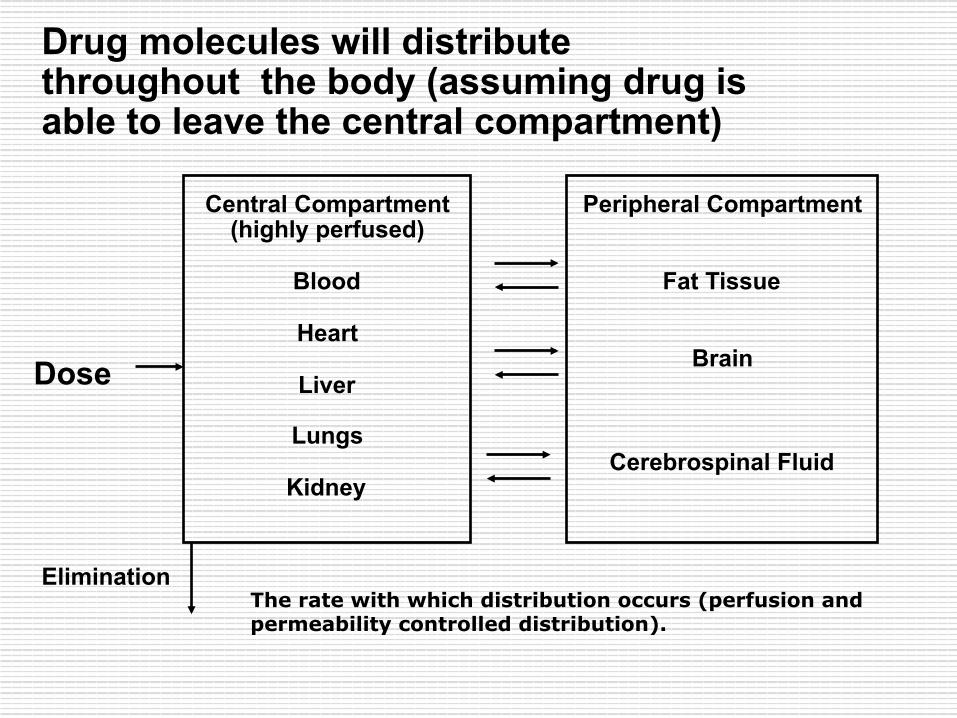
Central Compartment (highly perfused)
Blood
Heart
Liver
Lungs
Kidney
Peripheral Compartment
Fat Tissue
Brain
Cerebrospinal Fluid
Dose
Elimination
Drug molecules will distribute throughout the body (assuming drug is able to leave the central compartment)
The rate with which distribution occurs (perfusion and permeability controlled distribution).
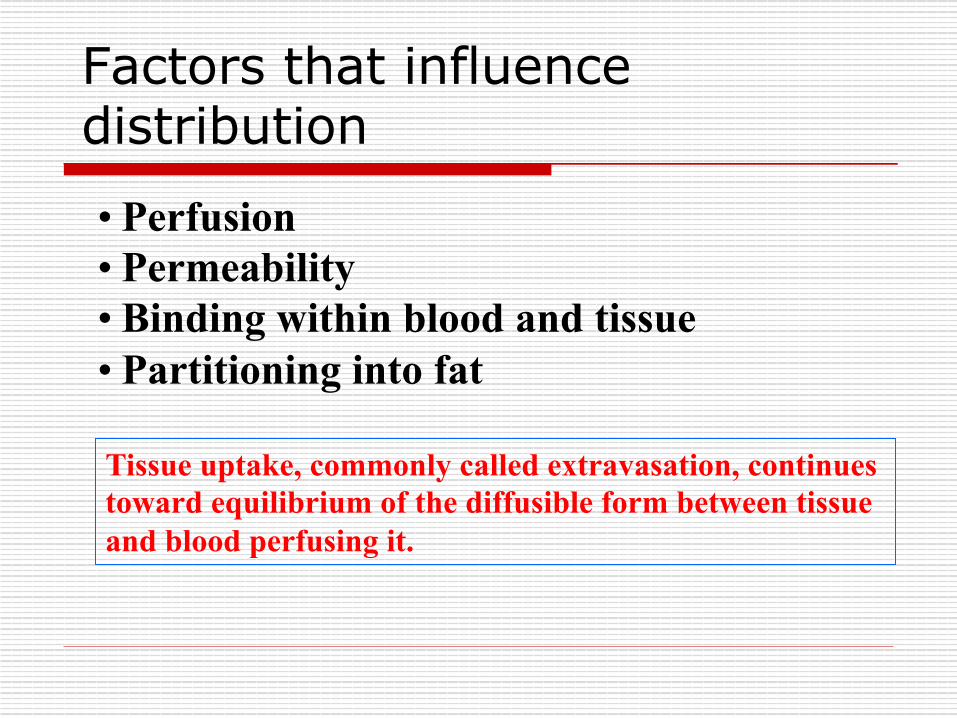
Factors that influence distribution
• Perfusion • Permeability • Binding within blood and tissue • Partitioning into fat
Tissue uptake, commonly called extravasation, continues toward equilibrium of the diffusible form between tissue and blood perfusing it.
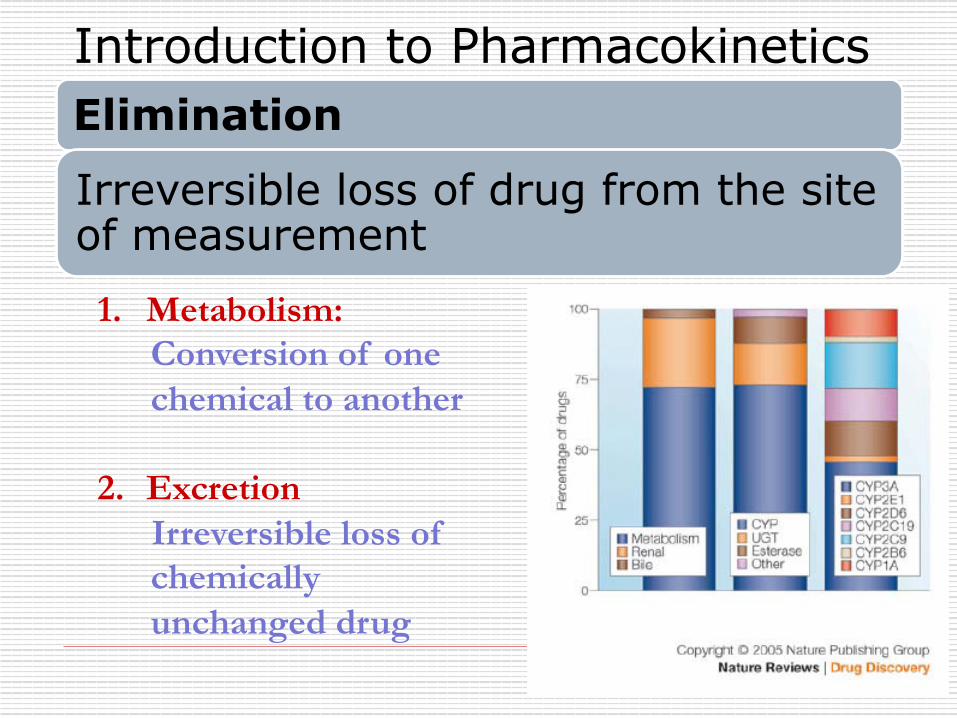
Elimination
Irreversible loss of drug from the site of measurement
Introduction to Pharmacokinetics
1. Metabolism: Conversion of one chemical to another
2. Excretion Irreversible loss of chemically unchanged drug
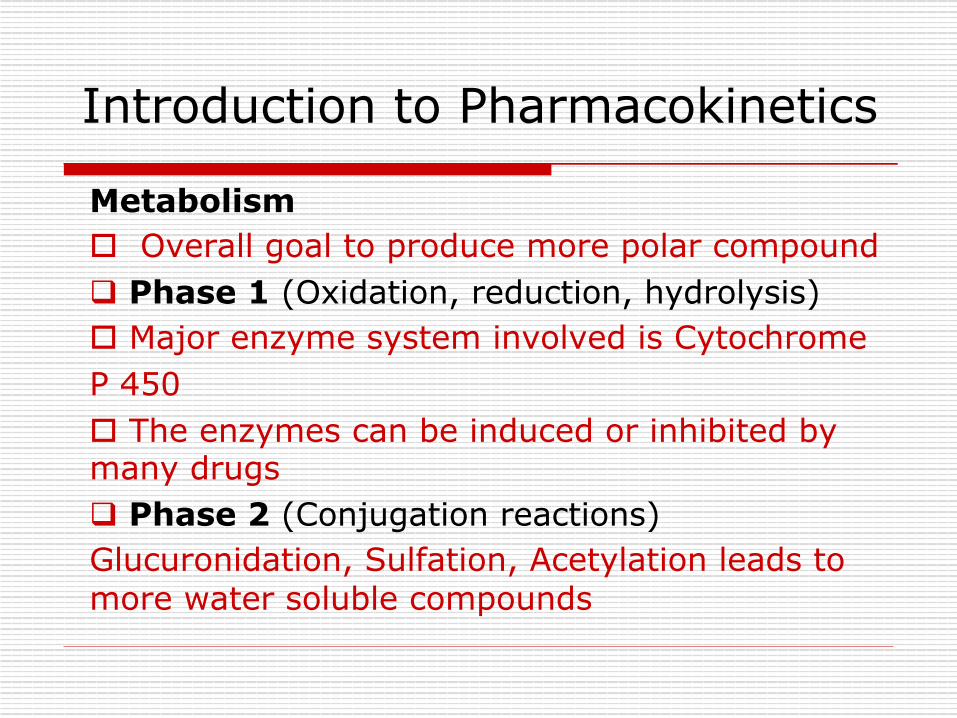
Introduction to Pharmacokinetics
Metabolism o Overall goal to produce more polar compound q Phase 1 (Oxidation, reduction, hydrolysis) o Major enzyme system involved is Cytochrome P 450 o The enzymes can be induced or inhibited by many drugs q Phase 2 (Conjugation reactions) Glucuronidation, Sulfation, Acetylation leads to more water soluble compounds
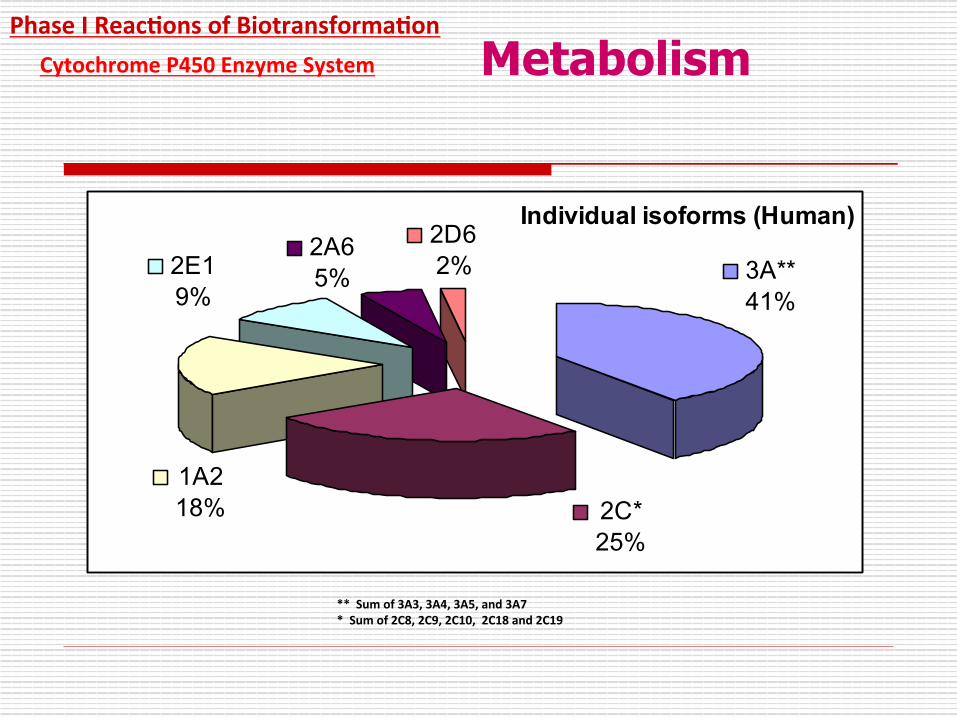
Cytochrome P450 Enzyme System
Phase I Reac7ons of Biotransforma7on
Individual isoforms (Human)2D62% 3A**
41%
2C*25%
1A218%
2E19%
2A65%
** Sum of 3A3, 3A4, 3A5, and 3A7 * Sum of 2C8, 2C9, 2C10, 2C18 and 2C19
Metabolism
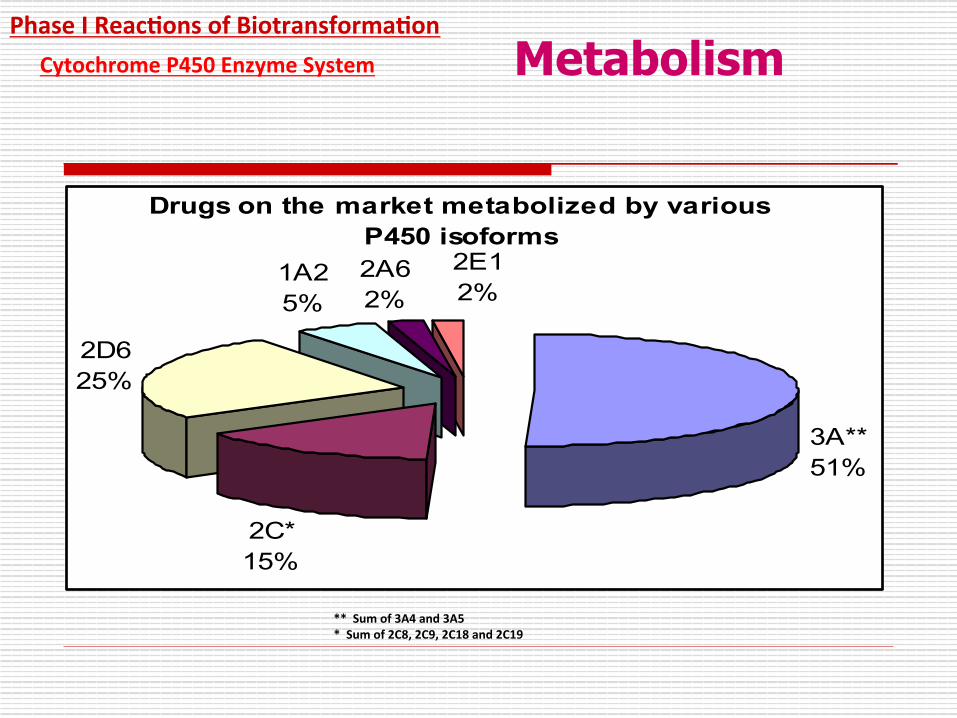
Drugs on the market metabolized by various P450 isoforms
3A**51%
2C*15%
2D625%
1A25%
2A62%
2E12%
** Sum of 3A4 and 3A5 * Sum of 2C8, 2C9, 2C18 and 2C19
Cytochrome P450 Enzyme System
Phase I Reac7ons of Biotransforma7on Metabolism
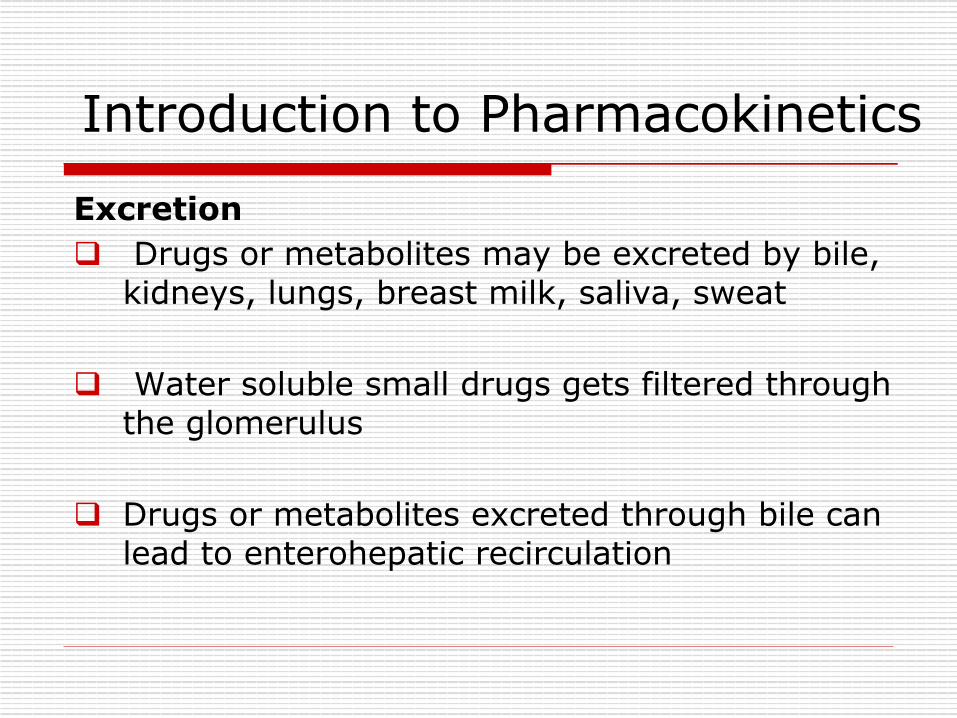
Excretion q Drugs or metabolites may be excreted by bile,
kidneys, lungs, breast milk, saliva, sweat q Water soluble small drugs gets filtered through
the glomerulus q Drugs or metabolites excreted through bile can
lead to enterohepatic recirculation
Introduction to Pharmacokinetics
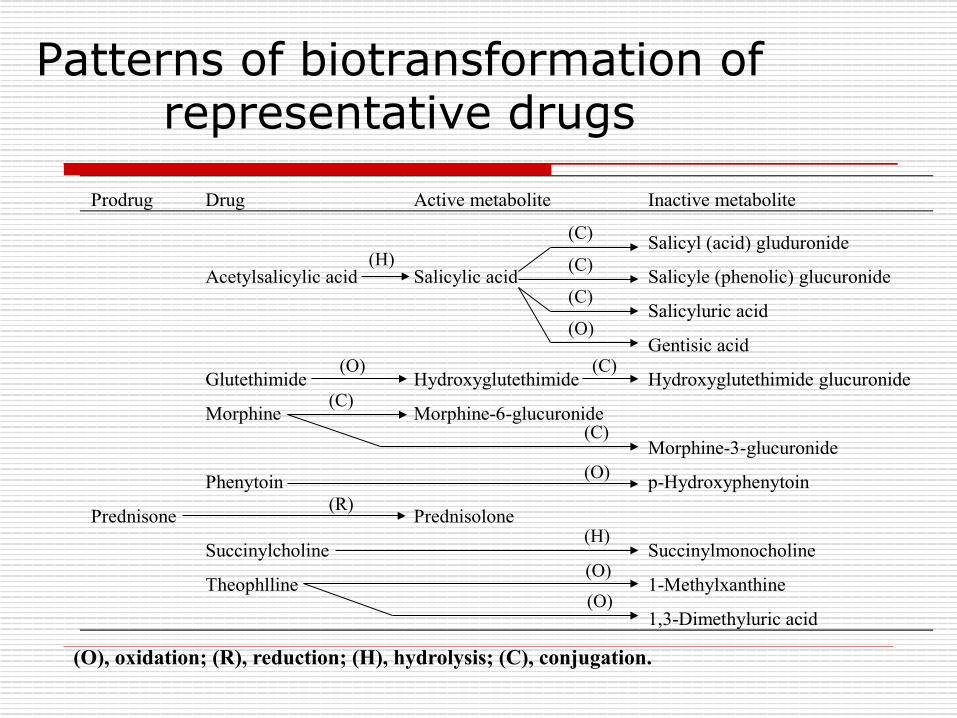
Patterns of biotransformation of representative drugs
Prodrug Drug Active metabolite Inactive metabolite
Salicyl (acid) gluduronide
Acetylsalicylic acid Salicylic acid Salicyle (phenolic) glucuronide
Salicyluric acid
Gentisic acid
Glutethimide Hydroxyglutethimide Hydroxyglutethimide glucuronide
Morphine Morphine-6-glucuronide
Morphine-3-glucuronide
Phenytoin p-Hydroxyphenytoin
Prednisone Prednisolone
Succinylcholine Succinylmonocholine
Theophlline 1-Methylxanthine
1,3-Dimethyluric acid
(H) (C)
(C)
(C)
(O)
(O) (C)
(C)
(C)
(O)
(R)
(H)
(O)
(O)
(O), oxidation; (R), reduction; (H), hydrolysis; (C), conjugation.
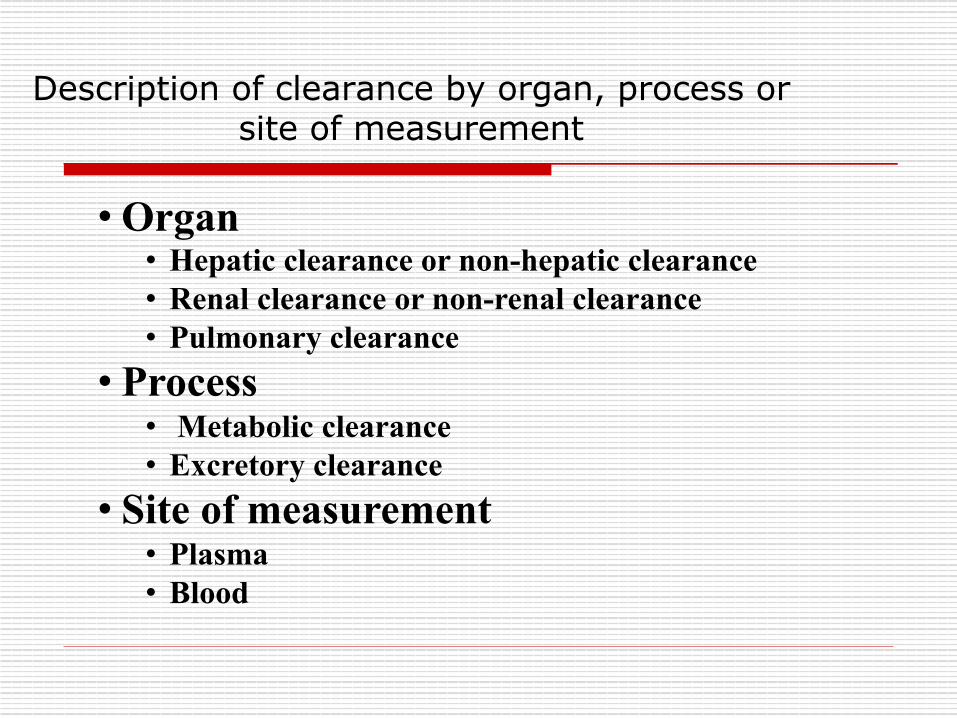
Description of clearance by organ, process or site of measurement
• Organ • Hepatic clearance or non-hepatic clearance • Renal clearance or non-renal clearance • Pulmonary clearance
• Process • Metabolic clearance • Excretory clearance
• Site of measurement • Plasma • Blood
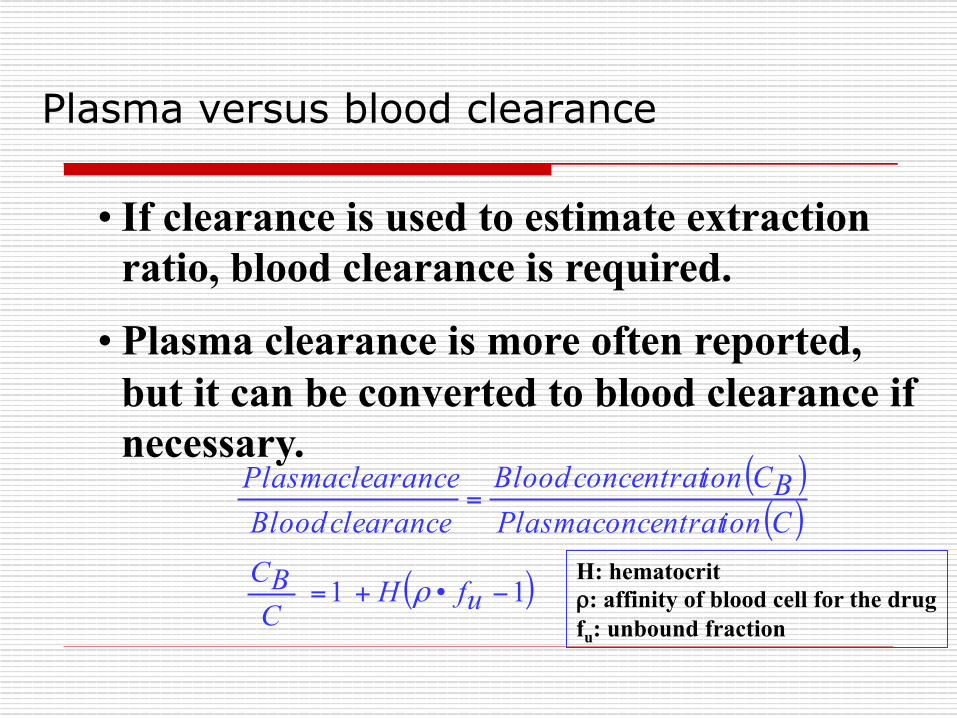
Plasma versus blood clearance
• If clearance is used to estimate extraction ratio, blood clearance is required.
• Plasma clearance is more often reported, but it can be converted to blood clearance if necessary.
( )( )C ionconcentrat lasmaPBC ionconcentrat Blood
clearance Bloodclearance Plasma
=
( ) uf• H CBC 11 −+= ρ
H: hematocrit ρ: affinity of blood cell for the drug fu: unbound fraction
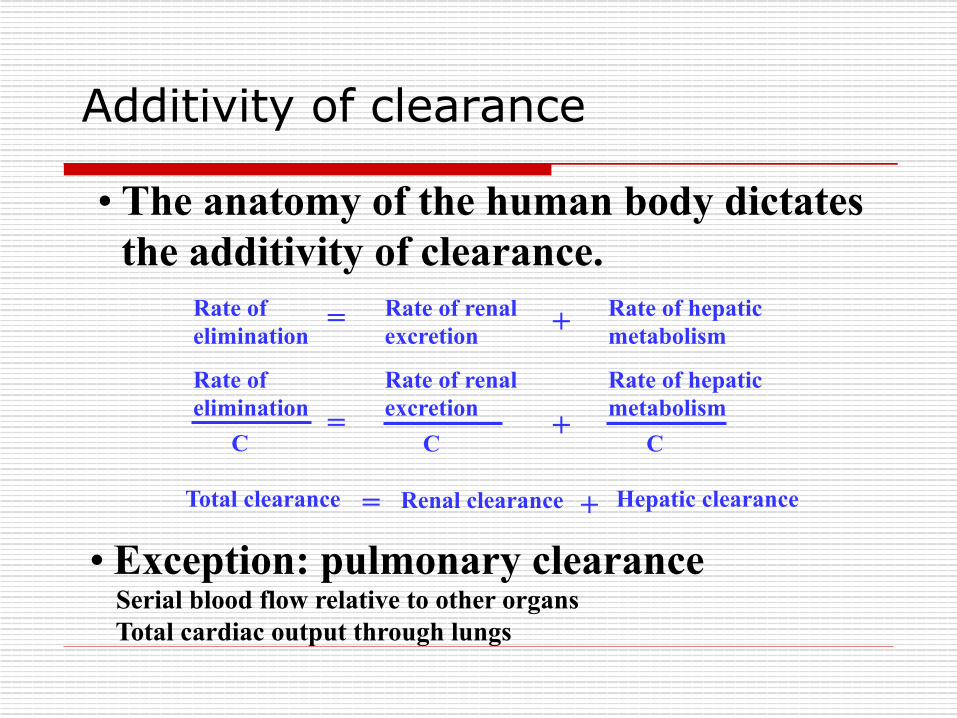
Additivity of clearance
• The anatomy of the human body dictates the additivity of clearance.
Rate of elimination
Rate of renal excretion
Rate of hepatic metabolism = +
Rate of elimination
Rate of renal excretion
Rate of hepatic metabolism = + C C C
= Total clearance Renal clearance Hepatic clearance +
• Exception: pulmonary clearance Serial blood flow relative to other organs Total cardiac output through lungs
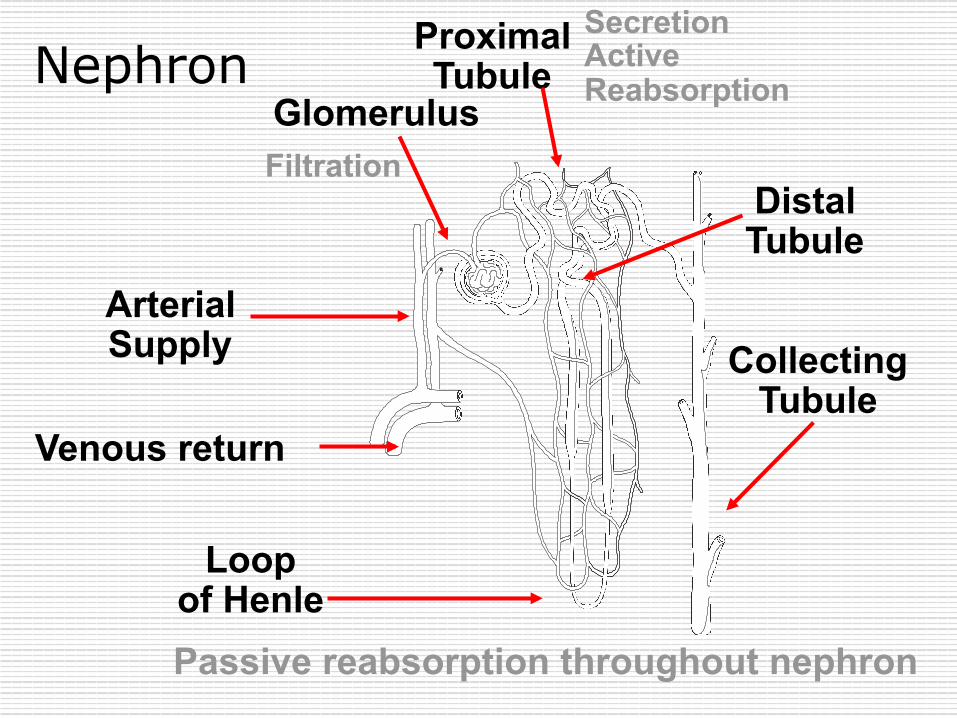
Nephron
Loop of Henle
Collecting Tubule
Distal Tubule
Proximal Tubule
Arterial Supply
Filtration
Secretion Active Reabsorption
Passive reabsorption throughout nephron
Venous return
Glomerulus
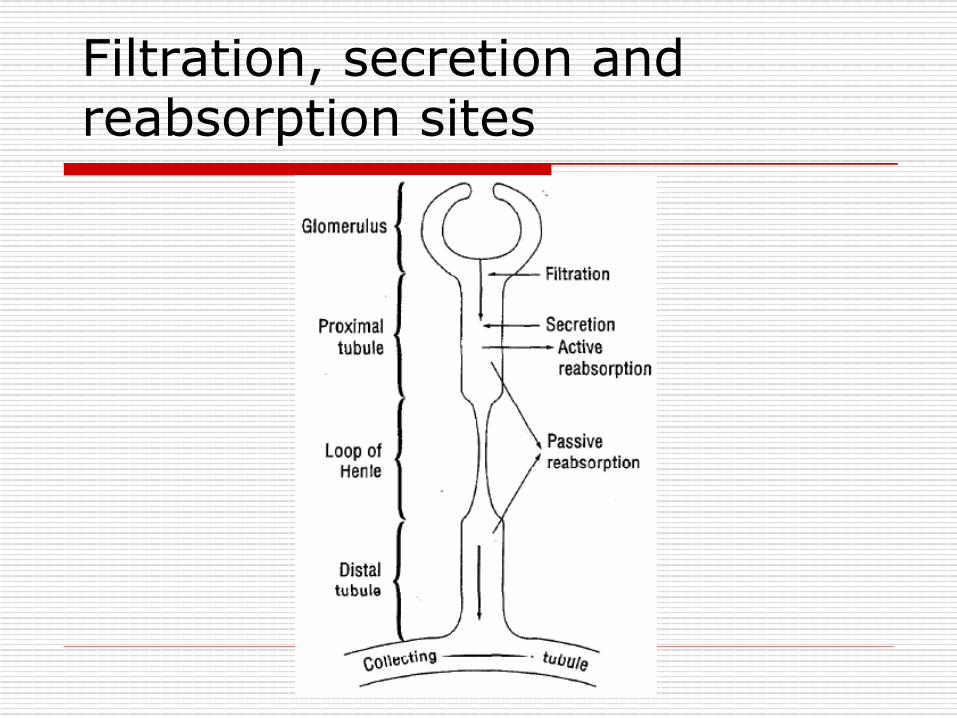
Filtration, secretion and reabsorption sites
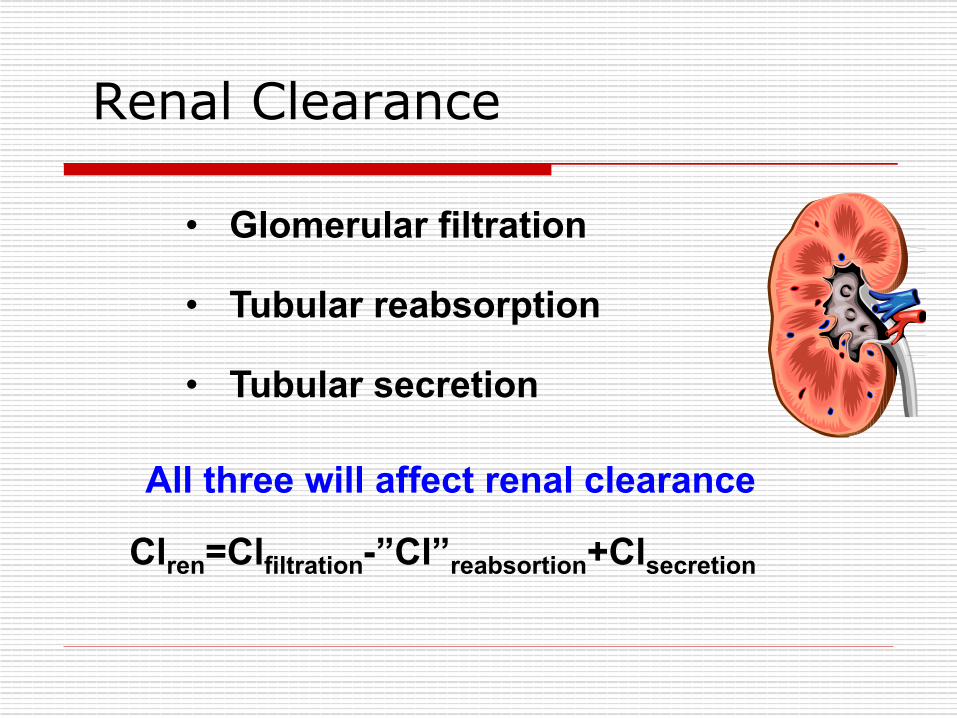
Renal Clearance
• Glomerular filtration
• Tubular reabsorption
• Tubular secretion
All three will affect renal clearance
Clren=Clfiltration-”Cl”reabsortion+Clsecretion
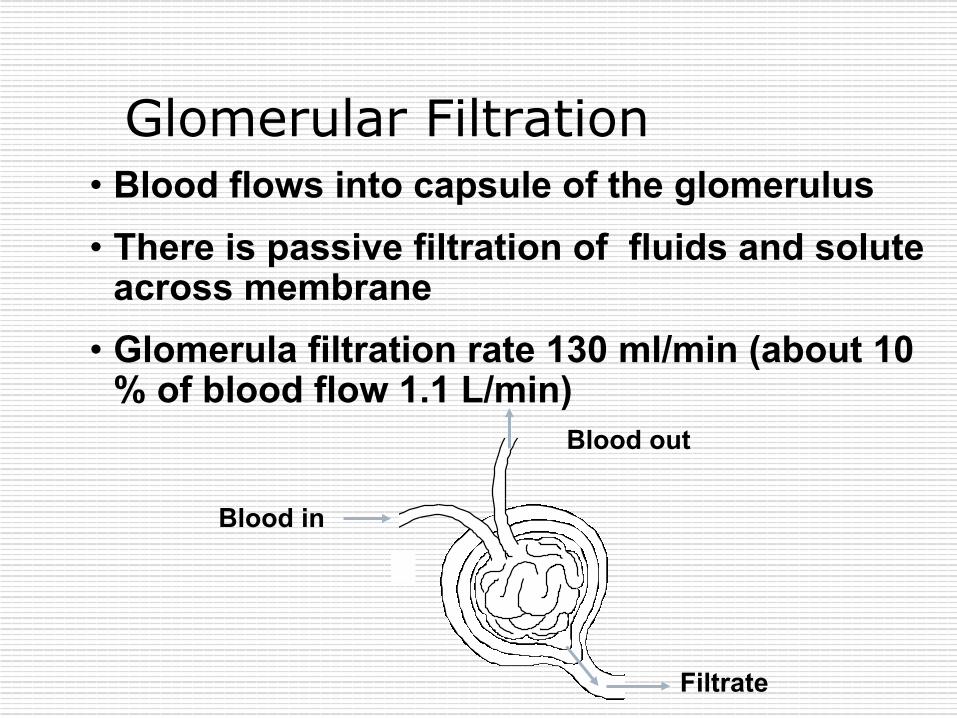
Glomerular Filtration • Blood flows into capsule of the glomerulus • There is passive filtration of fluids and solute
across membrane • Glomerula filtration rate 130 ml/min (about 10
% of blood flow 1.1 L/min)
Blood in
Blood out
Filtrate
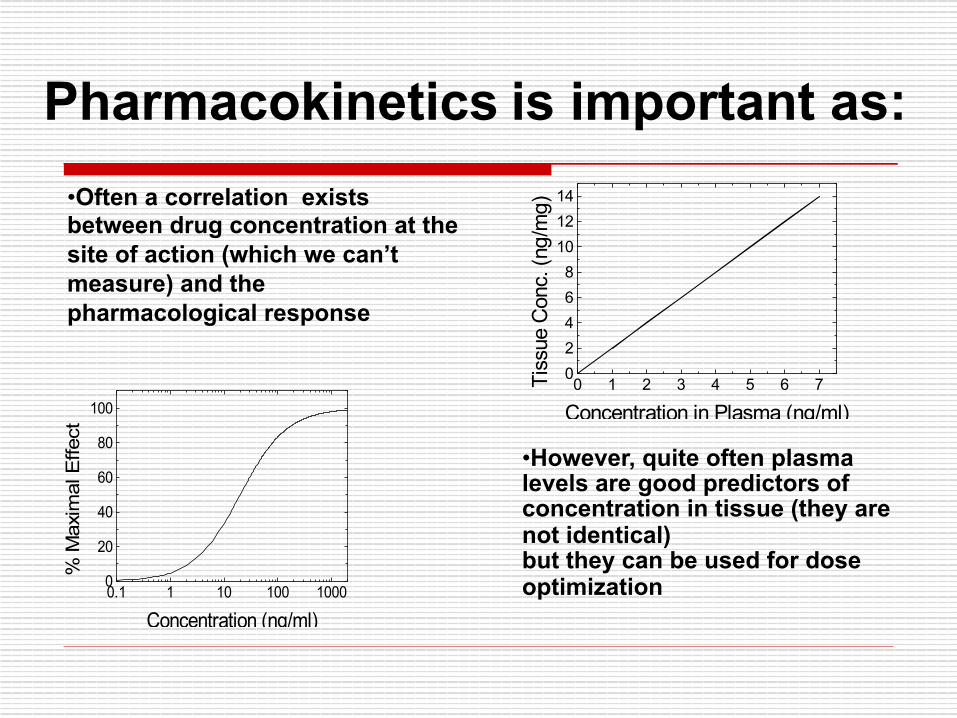
Pharmacokinetics is important as:
• However, quite often plasma levels are good predictors of concentration in tissue (they are not identical) but they can be used for dose optimization
• Often a correlation exists between drug concentration at the site of action (which we can’t measure) and the pharmacological response
0.1 1 10 100 10000
20
40
60
80
100
% M
axim
al E
ffect
Concentration (ng/ml)
0 1 2 3 4 5 6 702468
101214
Tiss
ue C
onc.
(ng/
mg)
Concentration in Plasma (ng/ml)
Introduction to Pharmacokinetics
How the pharmacokinetics of a drug or metabolite is determined ? Invasive methods Blood, Plasma, and CSF Non invasive methods Urine, feces, saliva, breast milk etc. • Analyze these samples using LC/MS/MS or HPLC
Introduction to Pharmacokinetics
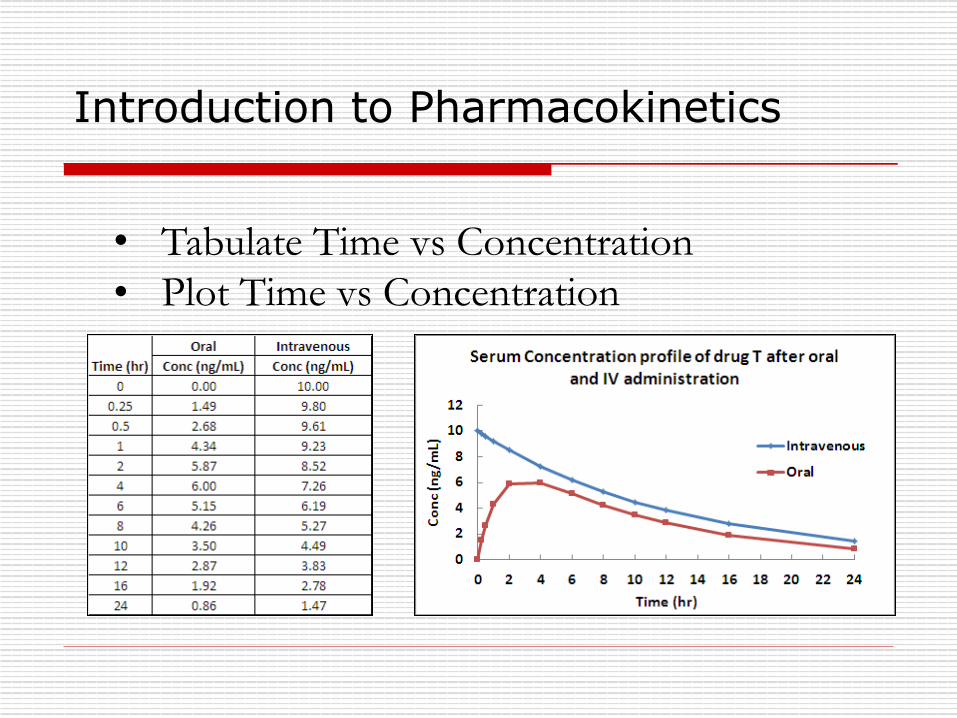
• Tabulate Time vs Concentration • Plot Time vs Concentration
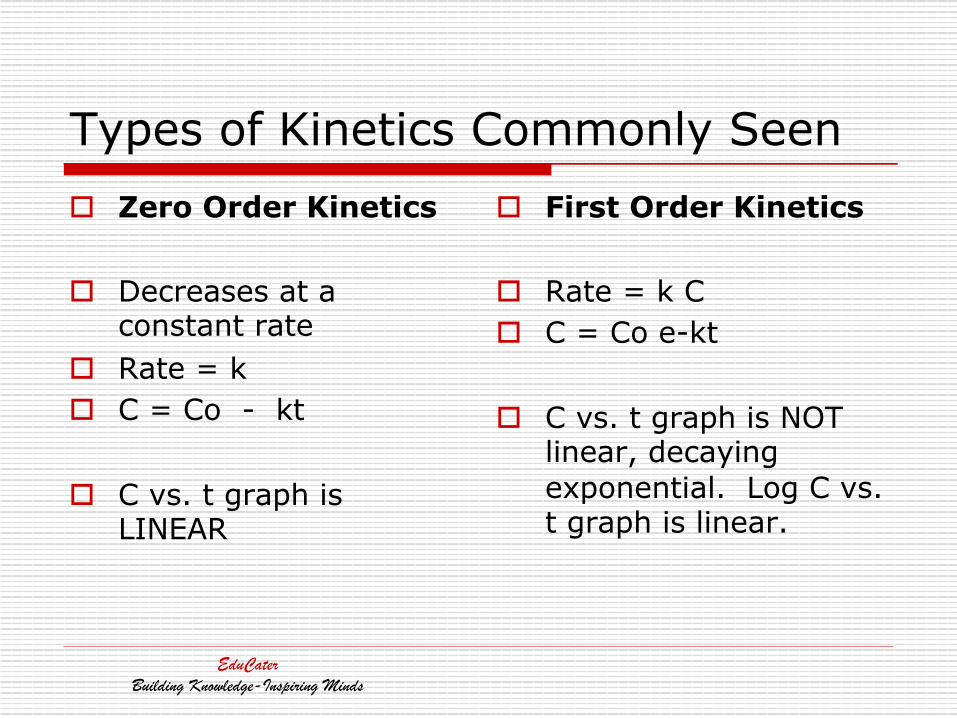
Types of Kinetics Commonly Seen o Zero Order Kinetics
o Decreases at a constant rate
o Rate = k o C = Co - kt
o C vs. t graph is LINEAR
o First Order Kinetics
o Rate = k C o C = Co e-kt
o C vs. t graph is NOT linear, decaying exponential. Log C vs. t graph is linear.
EduCaterBuilding Knowledge-Inspiring Minds
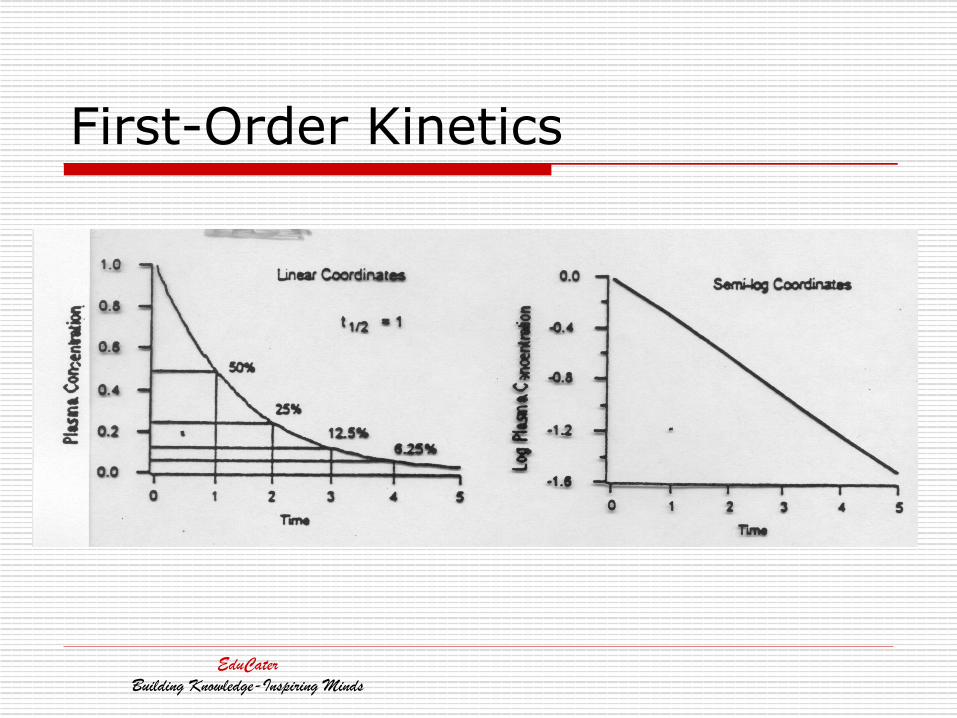
First-Order Kinetics
EduCaterBuilding Knowledge-Inspiring Minds
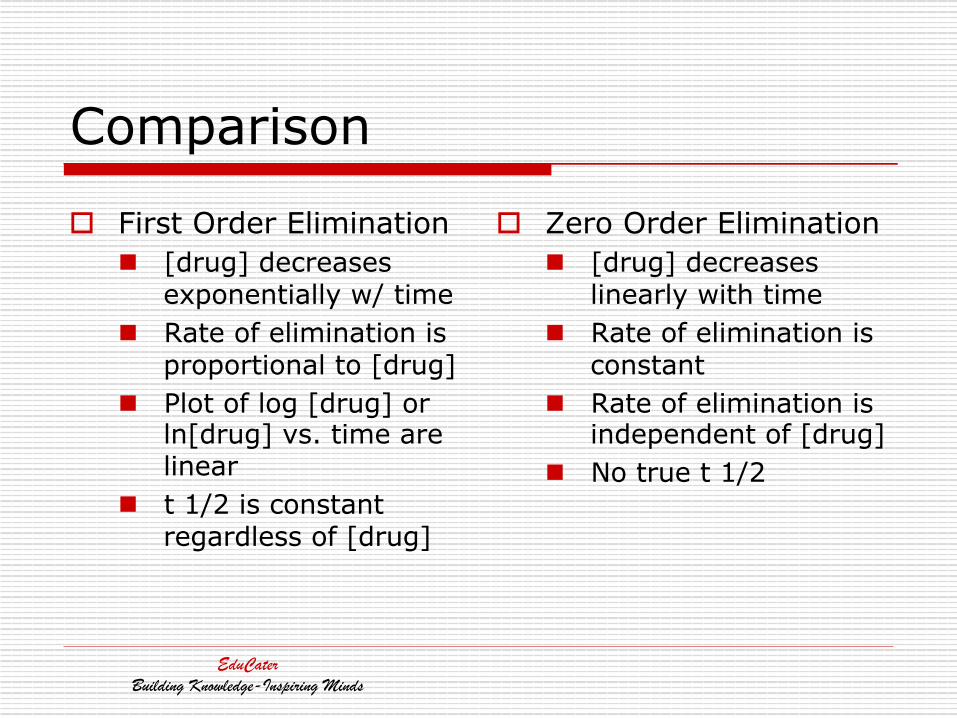
Comparison
o First Order Elimination n [drug] decreases
exponentially w/ time n Rate of elimination is
proportional to [drug] n Plot of log [drug] or
ln[drug] vs. time are linear
n t 1/2 is constant regardless of [drug]
o Zero Order Elimination n [drug] decreases
linearly with time n Rate of elimination is
constant n Rate of elimination is
independent of [drug] n No true t 1/2
EduCaterBuilding Knowledge-Inspiring Minds
Pharmacokinetic Models o Models are hypothetical structures
that are used to describe the fate of a drug in a biological system following its administration.

Non-compartmental: n Does not rely on any underlying assumptions on model
development – n Generally applies to first order linear models n Most toxicokinetic, preclinical, phase I studies utilize this method n Also appropriate for sparse data especially in toxicokinetic studies
Pharmacokinetic Analysis
EduCaterBuilding Knowledge-Inspiring Minds
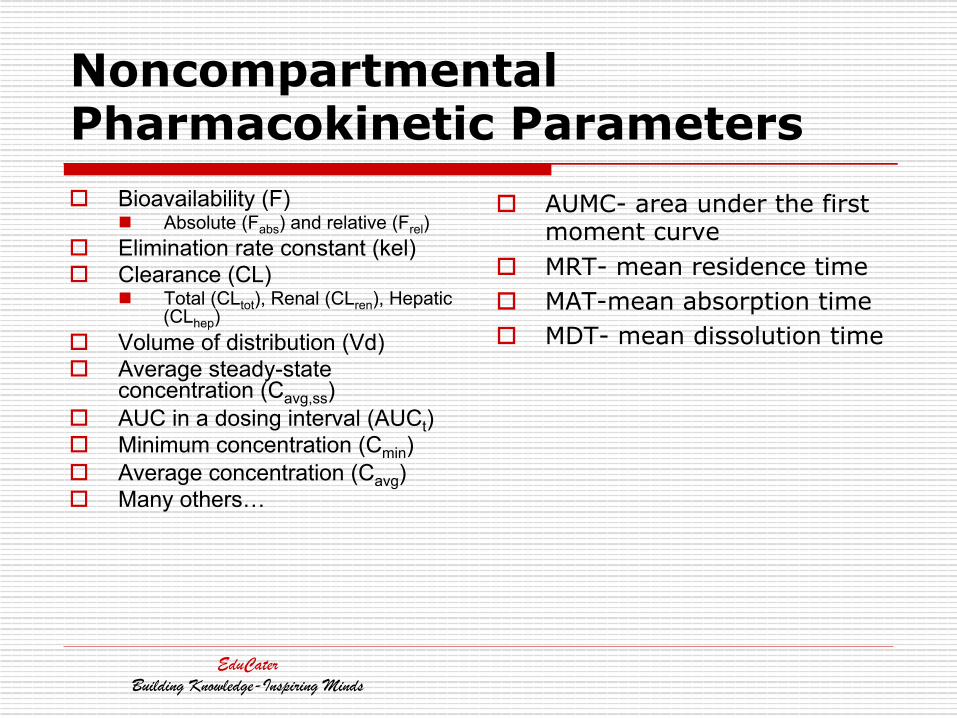
Noncompartmental Pharmacokinetic Parameters o Bioavailability (F)
n Absolute (Fabs) and relative (Frel) o Elimination rate constant (kel) o Clearance (CL)
n Total (CLtot), Renal (CLren), Hepatic (CLhep)
o Volume of distribution (Vd) o Average steady-state
concentration (Cavg,ss) o AUC in a dosing interval (AUCt) o Minimum concentration (Cmin) o Average concentration (Cavg) o Many others…
o AUMC- area under the first moment curve
o MRT- mean residence time o MAT-mean absorption time o MDT- mean dissolution time
EduCaterBuilding Knowledge-Inspiring Minds
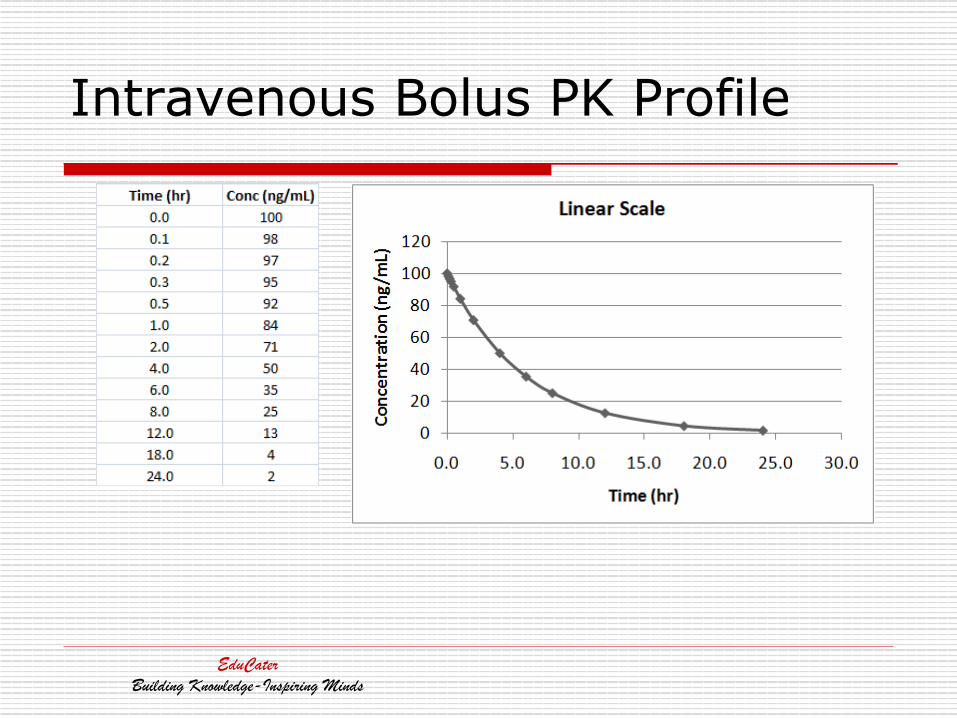
Intravenous Bolus PK Profile
EduCaterBuilding Knowledge-Inspiring Minds
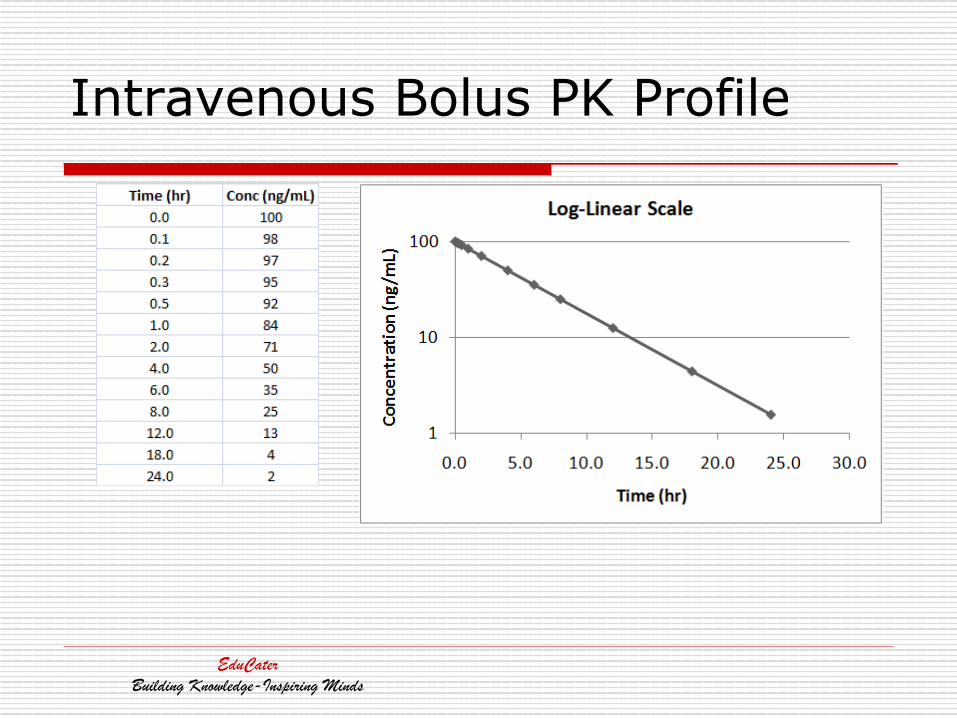
Intravenous Bolus PK Profile
EduCaterBuilding Knowledge-Inspiring Minds
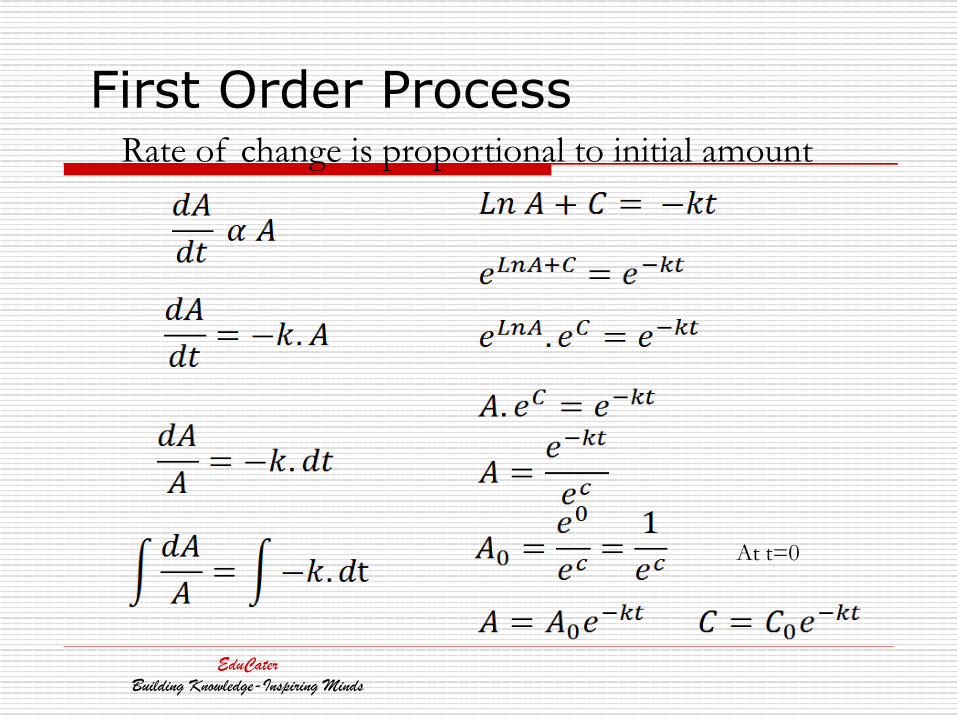
First Order Process Rate of change is proportional to initial amount
At t=0
EduCaterBuilding Knowledge-Inspiring Minds
EduCaterBuilding Knowledge-Inspiring Minds
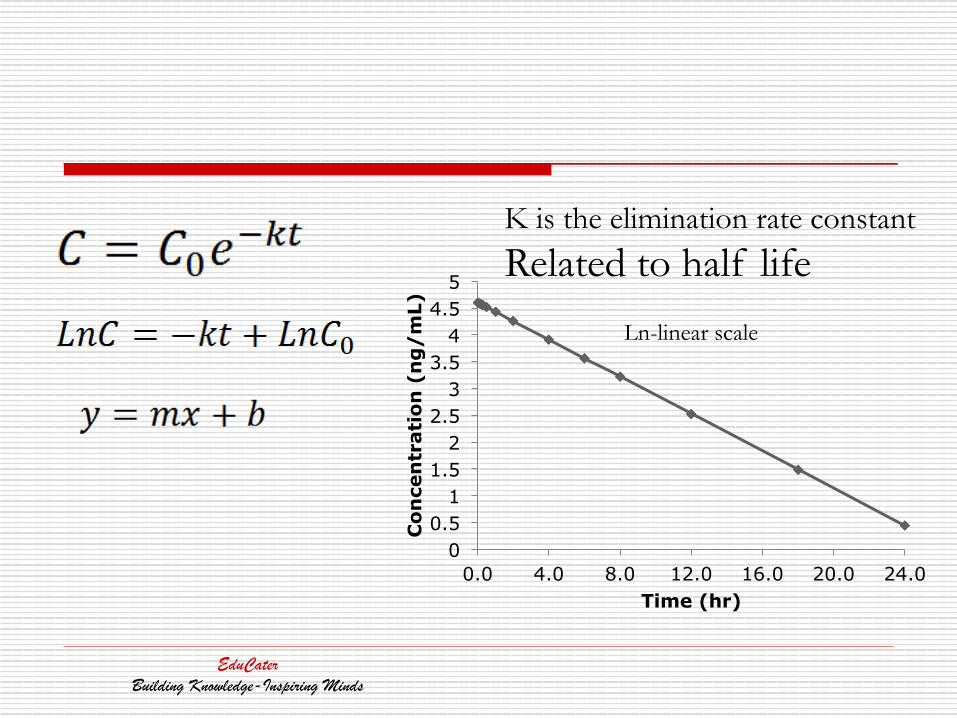
K is the elimination rate constant
Related to half life
0 0.5
1 1.5
2 2.5
3 3.5
4 4.5
5
0.0 4.0 8.0 12.0 16.0 20.0 24.0
Con
cen
trat
ion
(n
g/
mL)
Time (hr)
Ln-linear scale
EduCaterBuilding Knowledge-Inspiring Minds
05
101520253035404550
0 5 10 15 20 25 30Time
Pla
sma
Co
nce
ntr
atio
n (n
g/m
L)
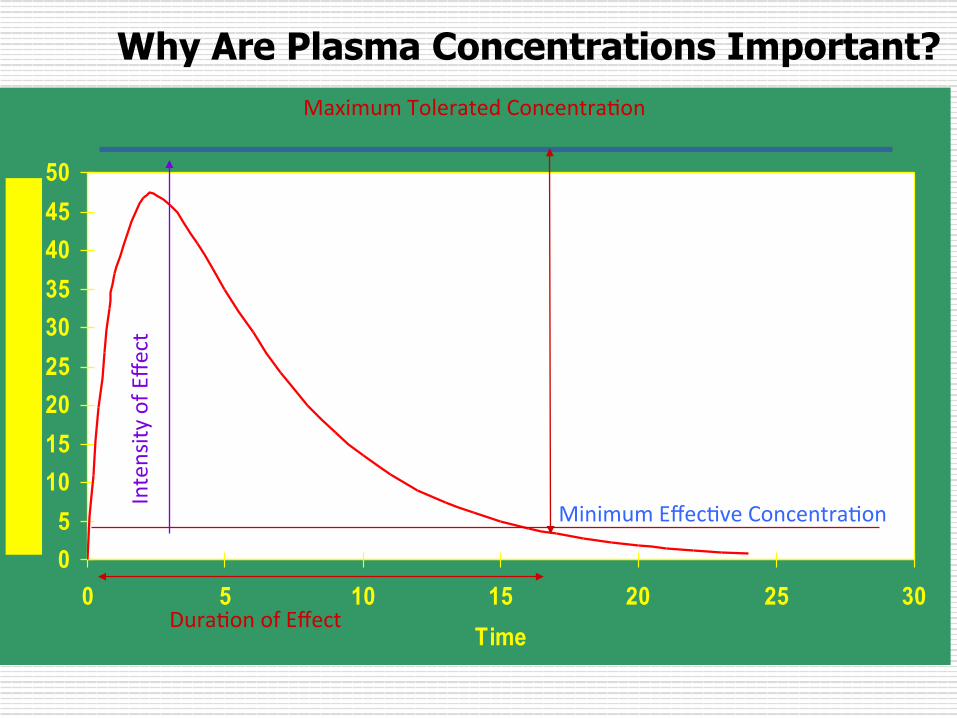
Minimum Effec-ve Concentra-on
Dura-on of Effect
Intensity
of E
ffect
Maximum Tolerated Concentra-on
Therapeu
-c windo
w
Why Are Plasma Concentrations Important?
0
5
10
15
20
25
30
35
40
45
50
0 5 10 15 20 25 30Time
Plas
ma
Conc
entra
tion
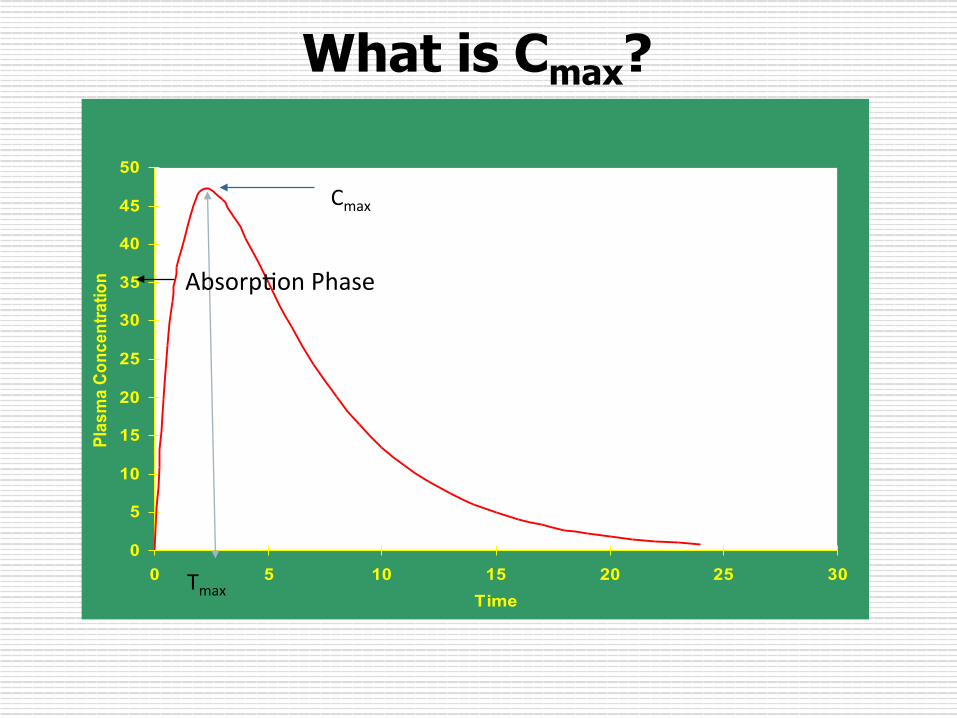
Tmax
Cmax
Absorp-on Phase
What is Cmax?
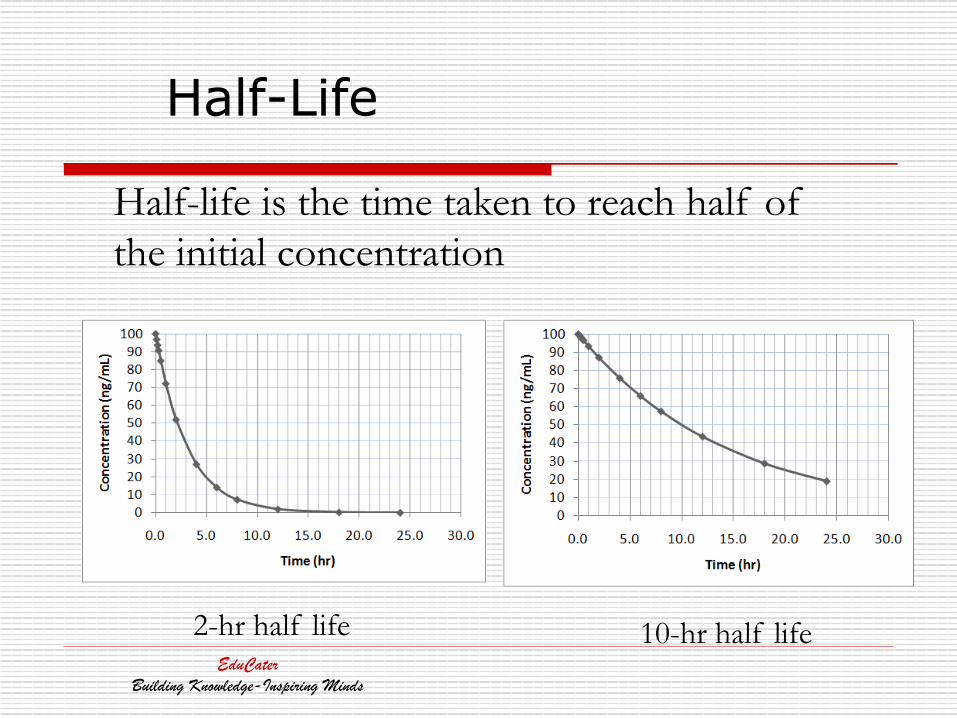
Half-Life
Half-life is the time taken to reach half of the initial concentration
2-hr half life 10-hr half life EduCater
Building Knowledge-Inspiring Minds
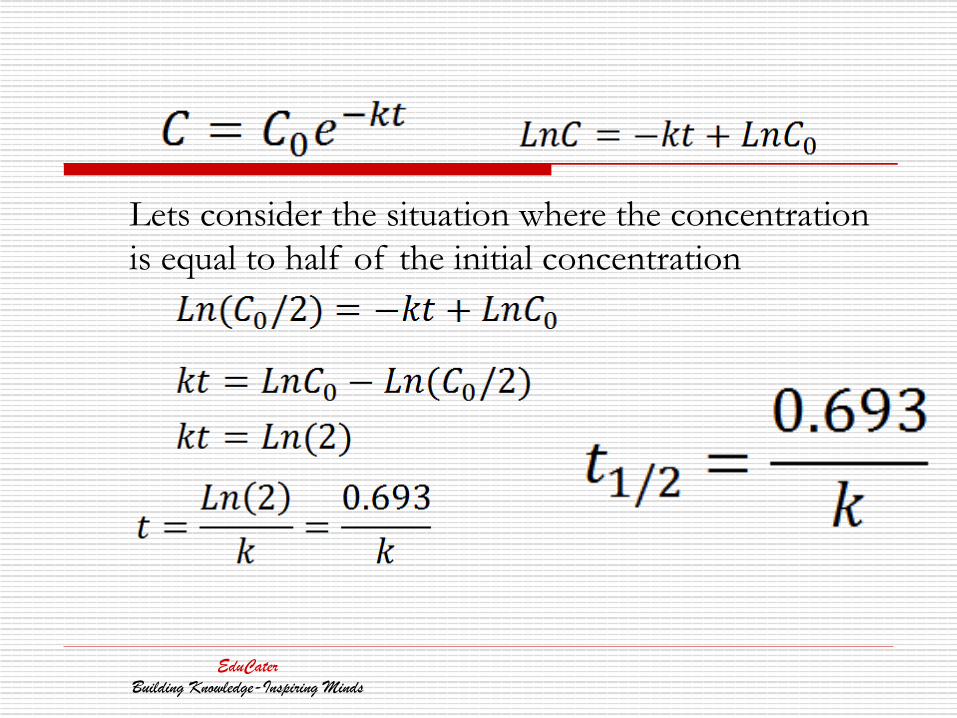
Lets consider the situation where the concentration is equal to half of the initial concentration
EduCaterBuilding Knowledge-Inspiring Minds
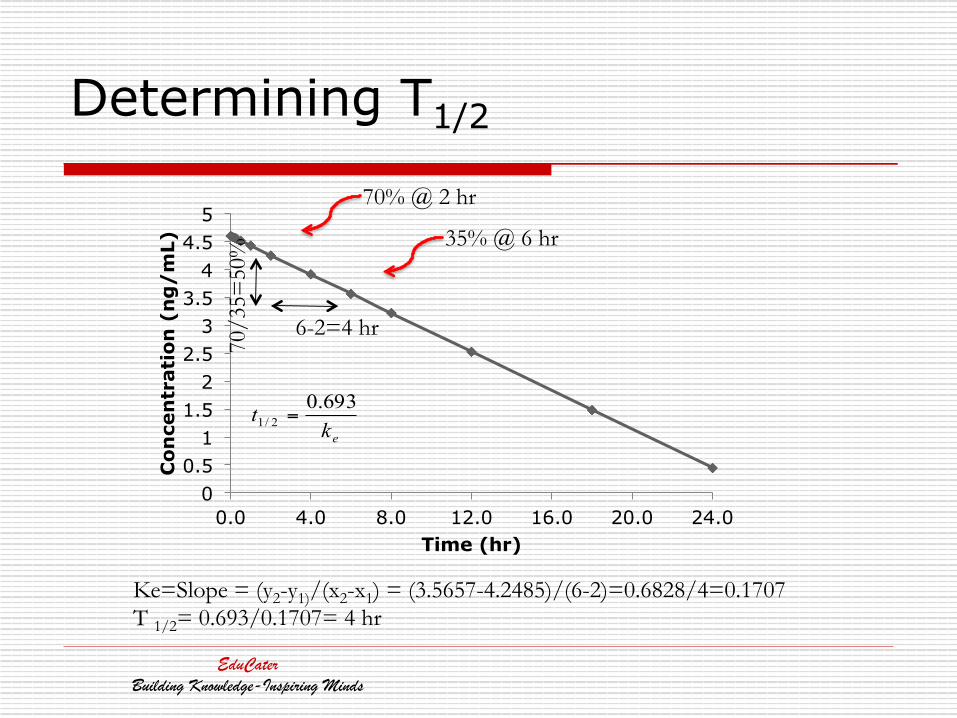
Determining T1/2
0 0.5
1 1.5
2 2.5
3 3.5
4 4.5
5
0.0 4.0 8.0 12.0 16.0 20.0 24.0
Con
cen
trat
ion
(n
g/
mL)
Time (hr)
70% @ 2 hr
35% @ 6 hr
6-2=4 hr
70/3
5=50
%
ekt 693.0
2/1 =
Ke=Slope = (y2-y1)/(x2-x1) = (3.5657-4.2485)/(6-2)=0.6828/4=0.1707 T 1/2= 0.693/0.1707= 4 hr
EduCaterBuilding Knowledge-Inspiring Minds
Volume of distribution (Vd)
o Vd is the apparent volume of distribution o Not a ‘real’ volume but a theoretical
volume that has no real physiological meaning
o Defined as that volume of plasma in which the total amount of drug in the body would be required to be dissolved in order to reflect the drug concentration attained in plasma.
EduCaterBuilding Knowledge-Inspiring Minds
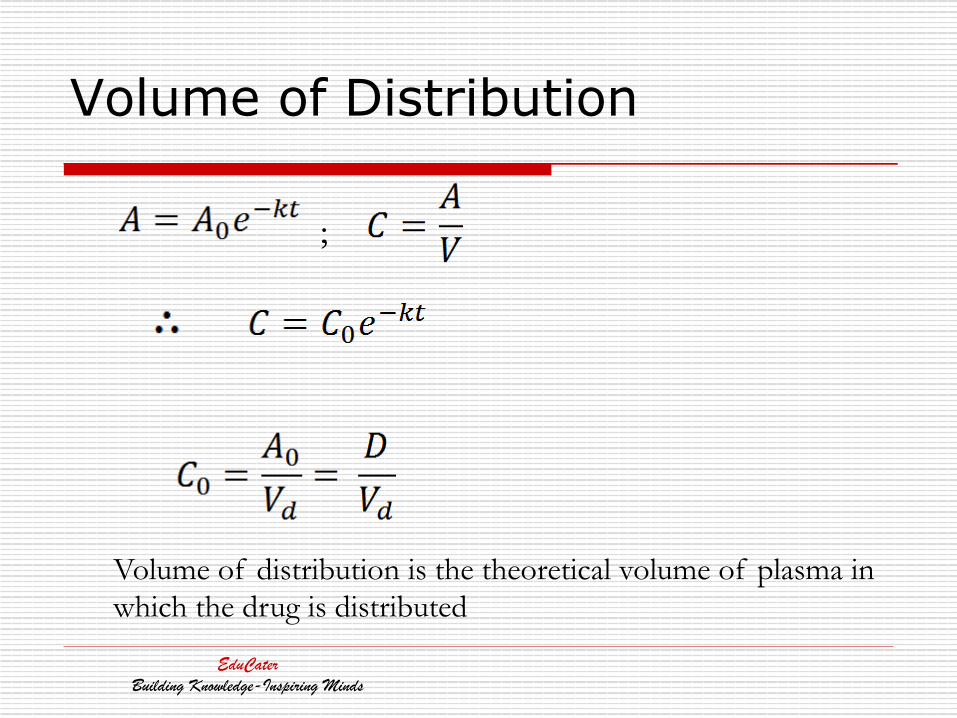
Volume of Distribution
;
Volume of distribution is the theoretical volume of plasma in which the drug is distributed
EduCaterBuilding Knowledge-Inspiring Minds
Clearance
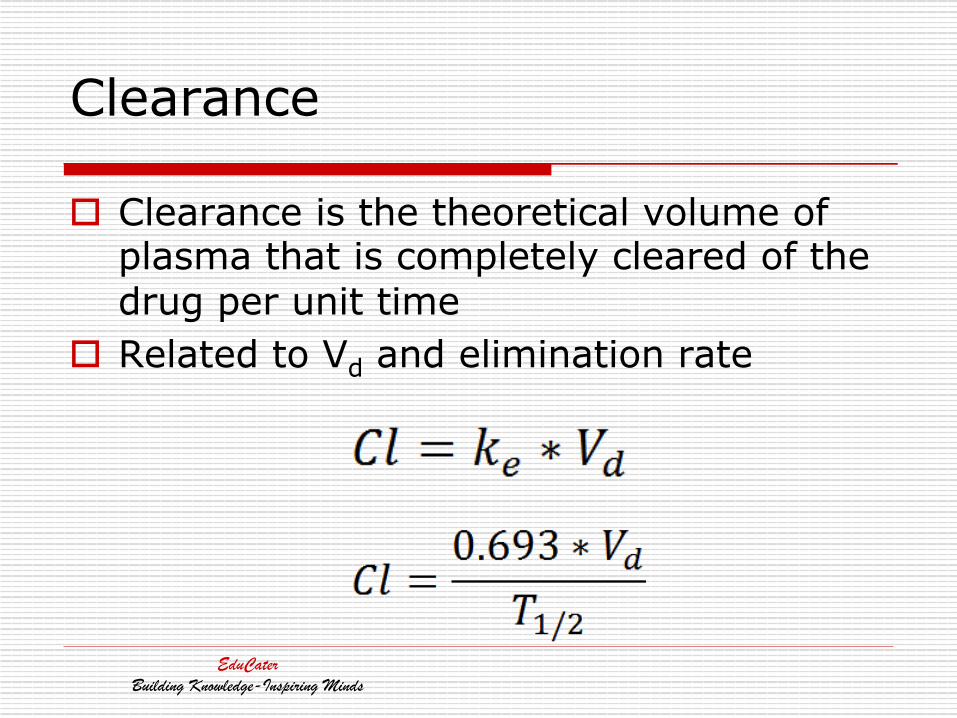
o Clearance is the theoretical volume of plasma that is completely cleared of the drug per unit time
o Related to Vd and elimination rate
EduCaterBuilding Knowledge-Inspiring Minds
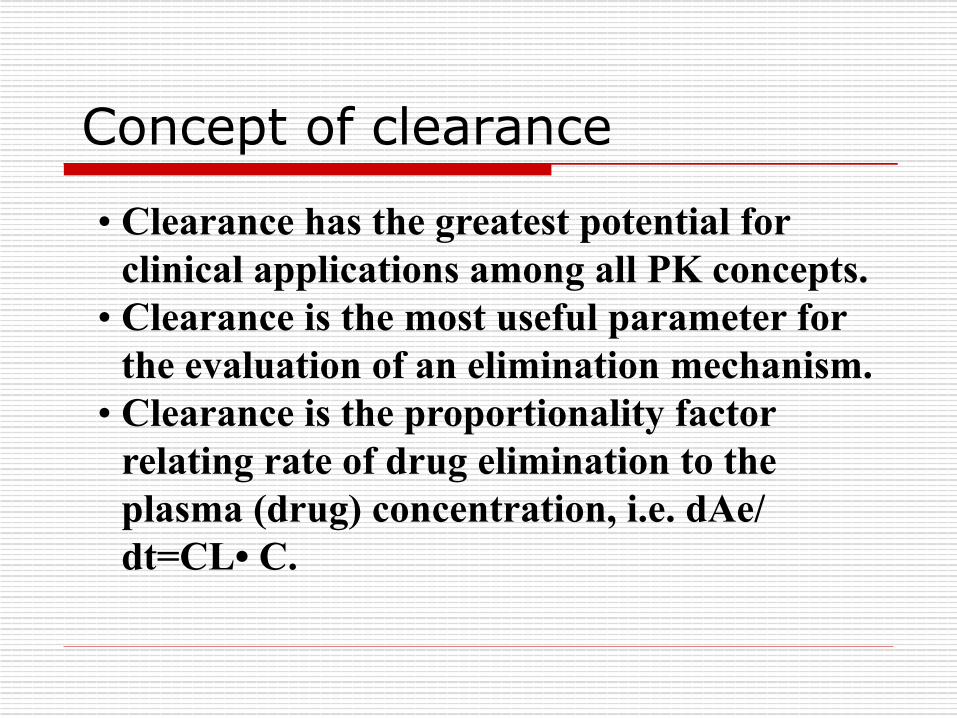
Concept of clearance
• Clearance has the greatest potential for clinical applications among all PK concepts.
• Clearance is the most useful parameter for the evaluation of an elimination mechanism.
• Clearance is the proportionality factor relating rate of drug elimination to the plasma (drug) concentration, i.e. dAe/dt=CL• C.
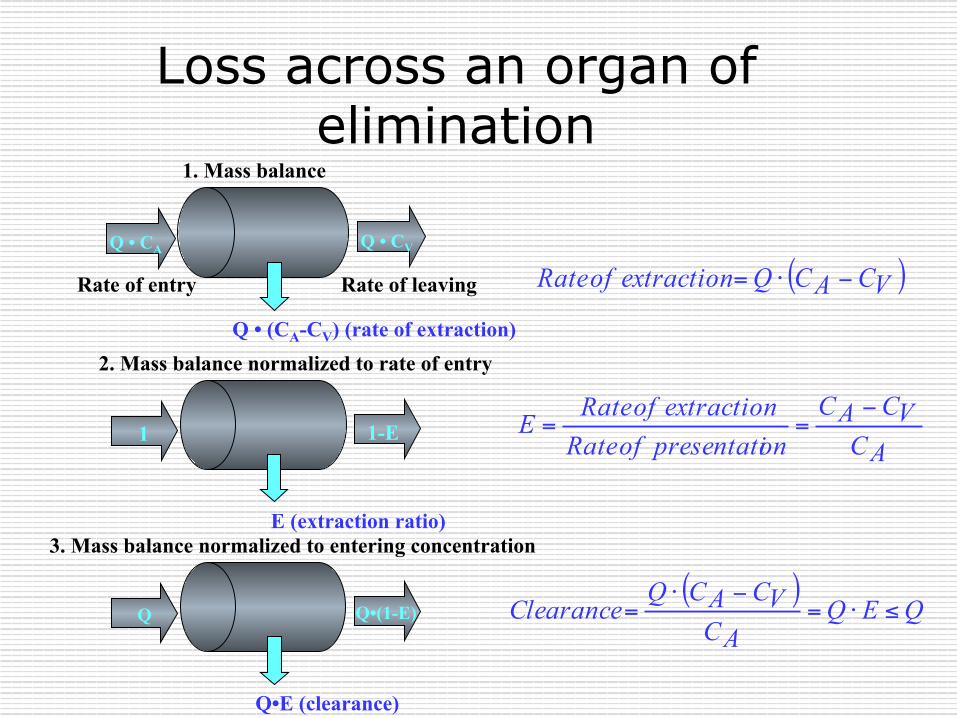
Loss across an organ of elimination
1 1-E
E (extraction ratio)
2. Mass balance normalized to rate of entry
Q • CA Q • CV
Q • (CA-CV) (rate of extraction)
1. Mass balance
Rate of entry Rate of leaving
ACVCAC
onpresentati of Rateextraction of RateE
−==
( )VCACQextraction of Rate −⋅=
Q Q•(1-E)
Q•E (clearance)
3. Mass balance normalized to entering concentration
( )QEQ
ACVCACQ
Clearance ≤⋅=−⋅
=
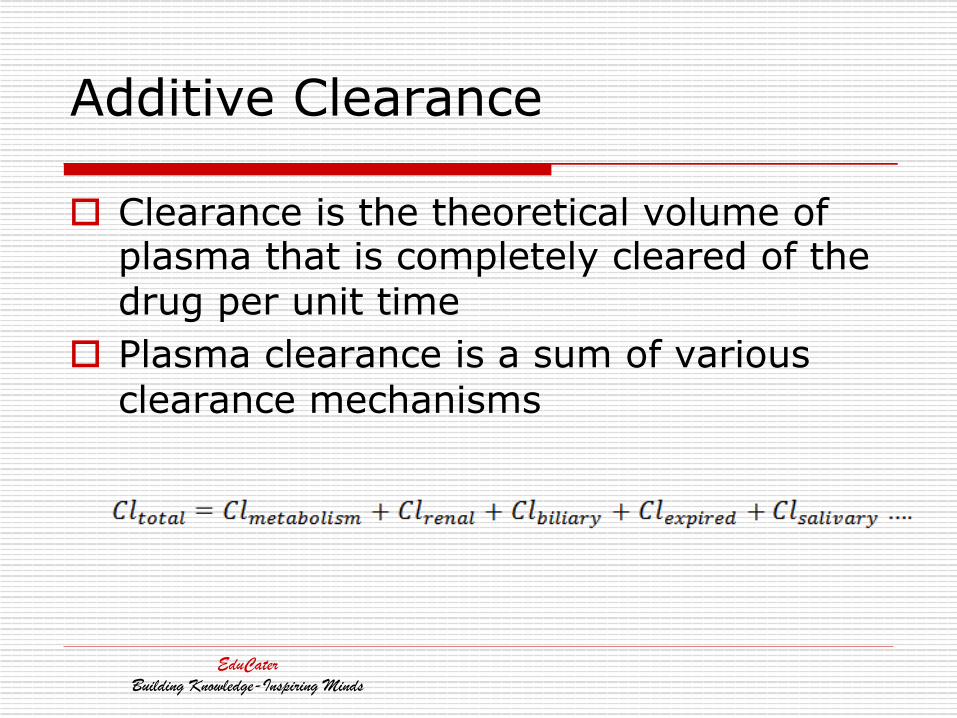
Additive Clearance
o Clearance is the theoretical volume of plasma that is completely cleared of the drug per unit time
o Plasma clearance is a sum of various clearance mechanisms
EduCaterBuilding Knowledge-Inspiring Minds
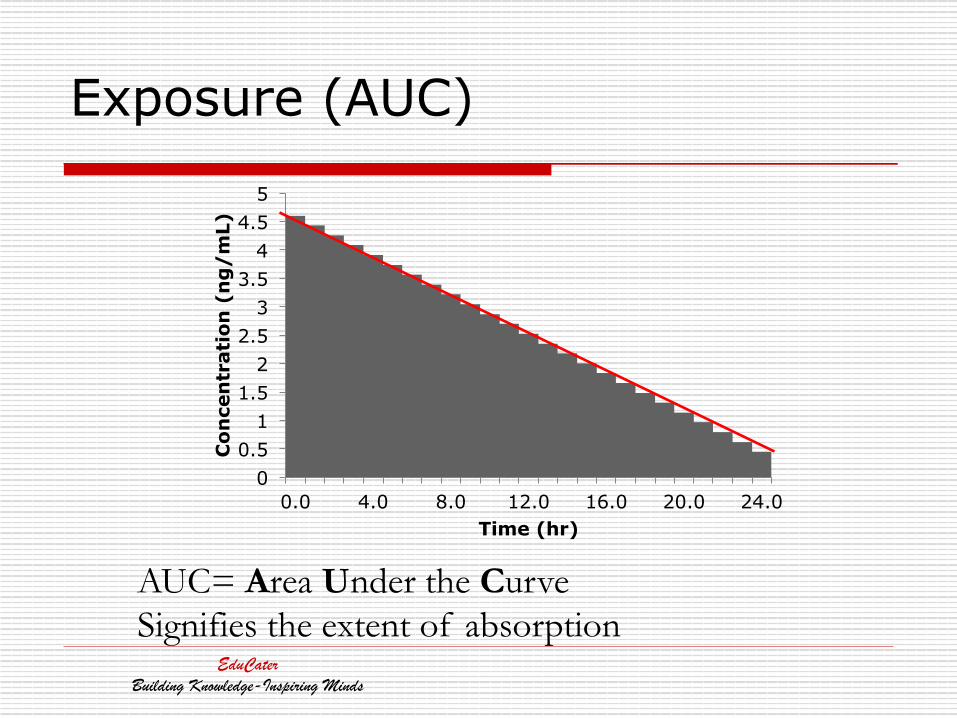
Exposure (AUC)
0 0.5
1 1.5
2 2.5
3 3.5
4 4.5
5
0.0 4.0 8.0 12.0 16.0 20.0 24.0
Con
cen
trat
ion
(n
g/
mL)
Time (hr)
AUC= Area Under the Curve Signifies the extent of absorption
EduCaterBuilding Knowledge-Inspiring Minds
0
5
10
15
20
25
30
35
40
45
50
0 5 10 15 20 25 30Time
Pla
sma
Con
cent
ratio
n
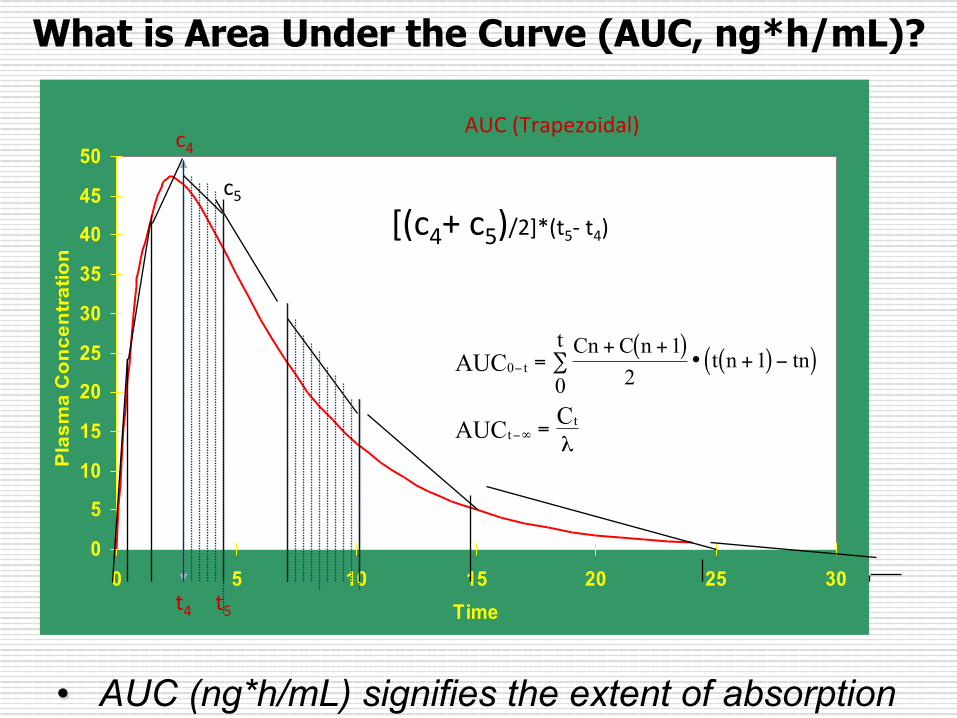
AUC (Trapezoidal)
t4 t5
c5
c4
[(c4+ c5)/2]*(t5-‐ t4)
( ) ( )( )0 t
tt
AUC
AUC C
Cn C n 12
t n 1 tn0
t−
−∞
=+ +
• + −∑
=λ
What is Area Under the Curve (AUC, ng*h/mL)?
• AUC (ng*h/mL) signifies the extent of absorption

Area of Rectangle = Length*Breadth
EduCaterBuilding Knowledge-Inspiring Minds
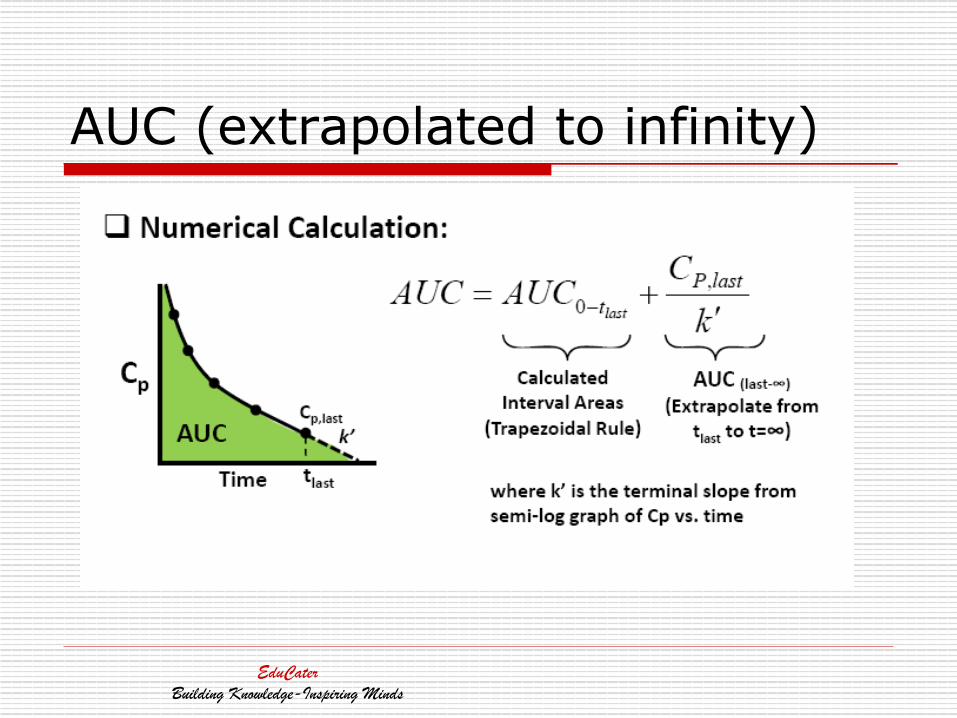
AUC (extrapolated to infinity)
EduCaterBuilding Knowledge-Inspiring Minds
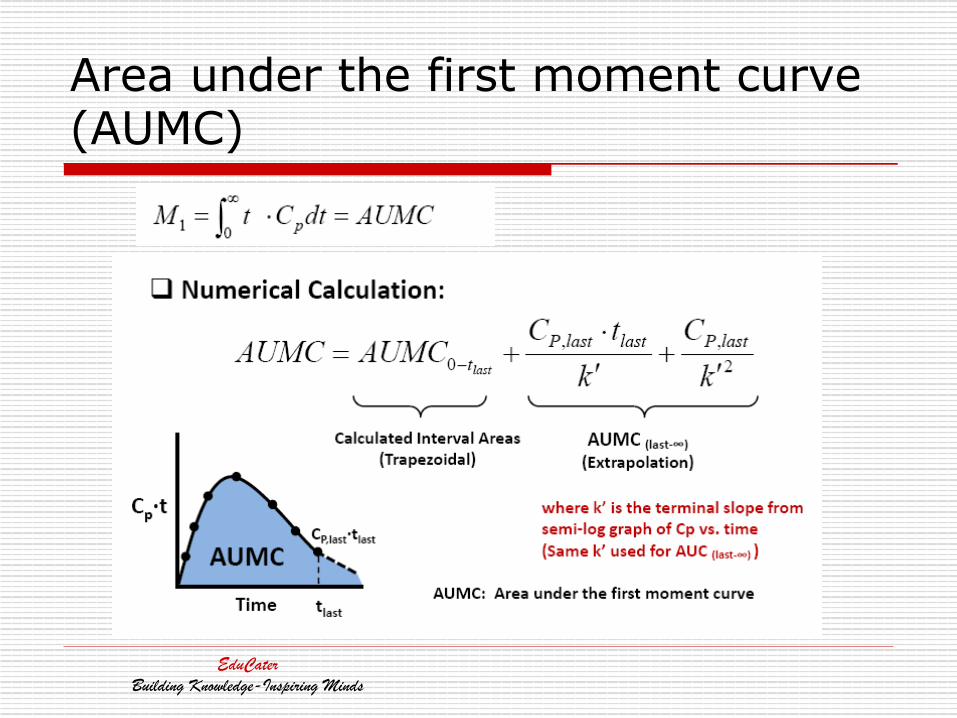
Area under the first moment curve (AUMC)
EduCaterBuilding Knowledge-Inspiring Minds
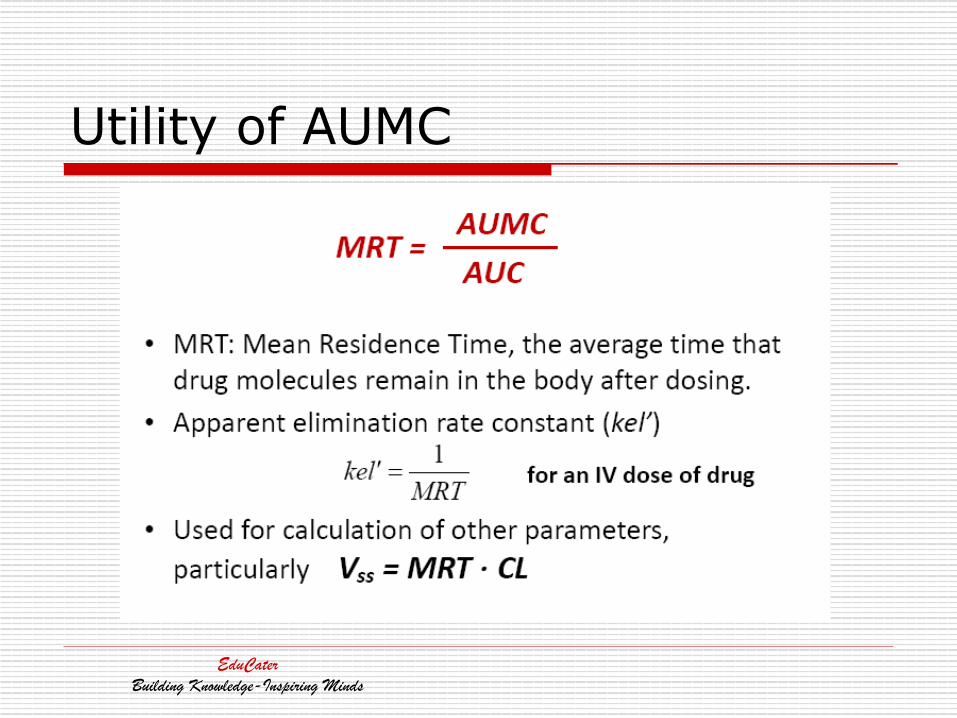
Utility of AUMC
EduCaterBuilding Knowledge-Inspiring Minds
ORAL PHARMACOKINETICS
EduCaterBuilding Knowledge-Inspiring Minds
Bioavailability
o Bioavailability (designated as F) is defined as the fraction of the administered drug reaching the systemic circulation intact (i.e., not metabolized or chemically altered in any way).
o F = 100% for intravenously administered drugs
o F ≤ 100% for orally administered drugs
o F affected by metabolism, reduced absorption (efflux transporters, poor solubility, etc.)
EduCaterBuilding Knowledge-Inspiring Minds

Bioavailability: Fraction of drug that reaches systemic circulation
§ Solubility, Permeability, First pass metabolism
§ Blood flow to site of absorption § Degradation § Gastric emptying and intestinal transit
time
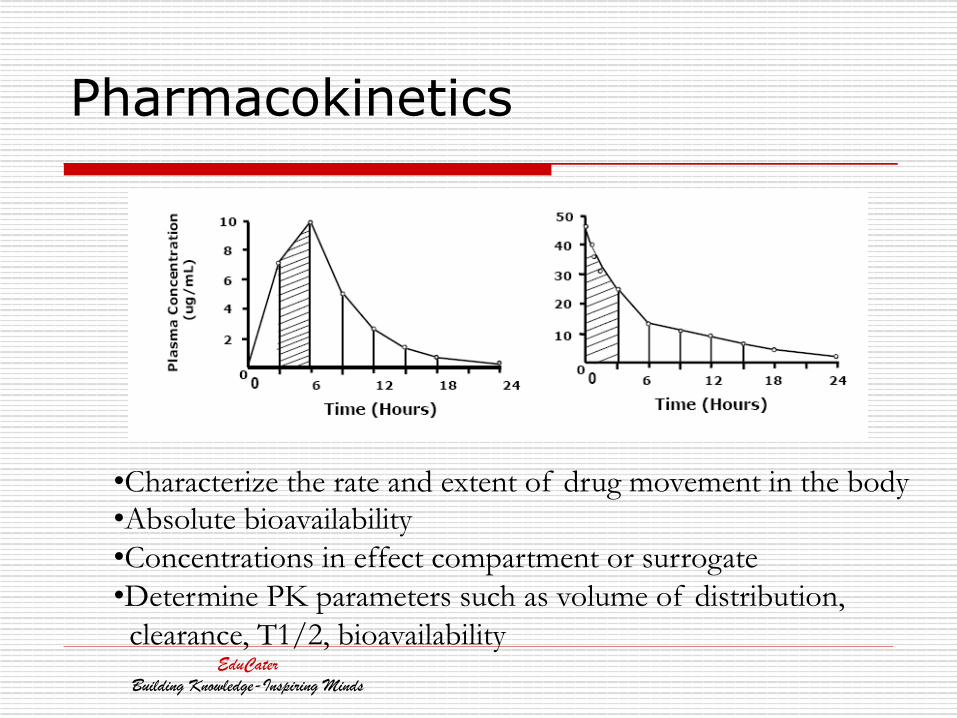
Pharmacokinetics
• Characterize the rate and extent of drug movement in the body • Absolute bioavailability • Concentrations in effect compartment or surrogate • Determine PK parameters such as volume of distribution, clearance, T1/2, bioavailability
EduCaterBuilding Knowledge-Inspiring Minds
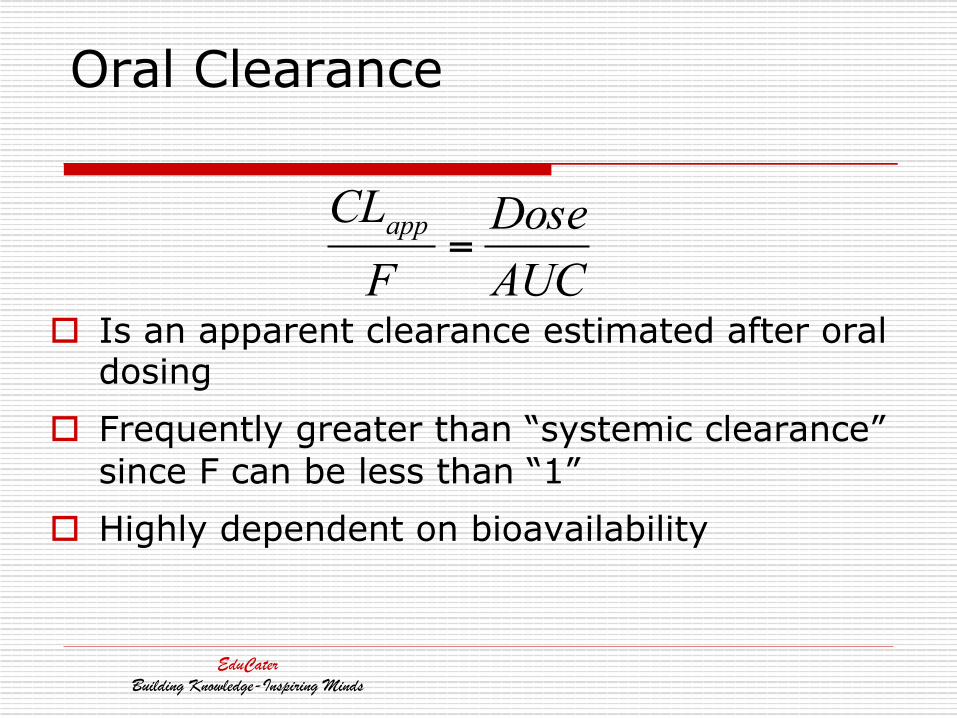
Oral Clearance
o Is an apparent clearance estimated after oral dosing
o Frequently greater than “systemic clearance” since F can be less than “1”
o Highly dependent on bioavailability
AUCDose
FCLapp =
EduCaterBuilding Knowledge-Inspiring Minds
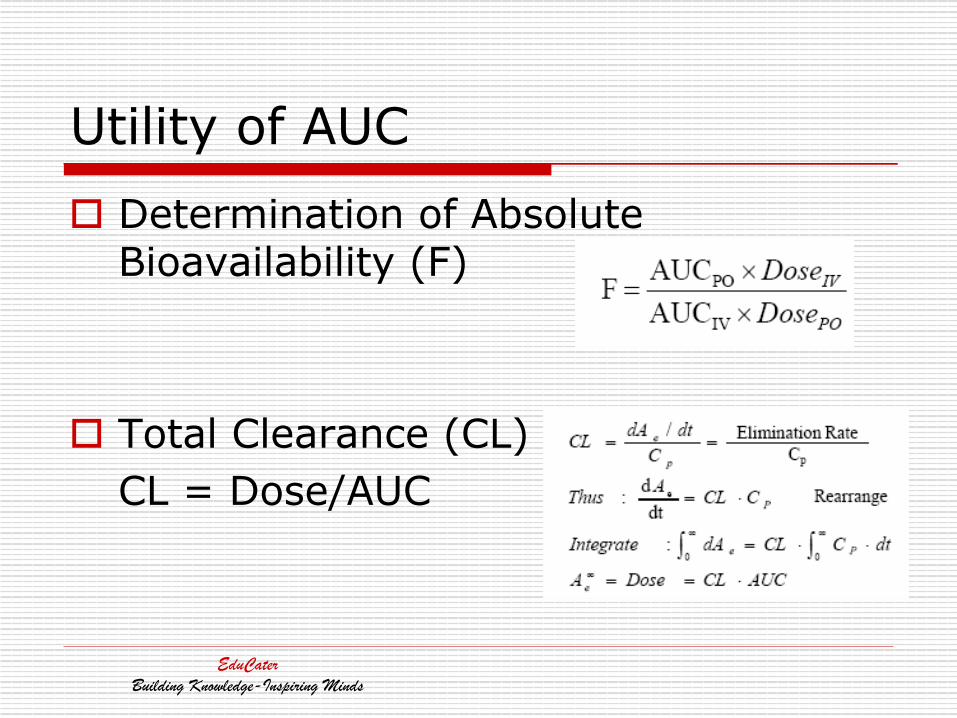
Utility of AUC o Determination of Absolute
Bioavailability (F)
o Total Clearance (CL) CL = Dose/AUC
EduCater
Building Knowledge-Inspiring Minds

Compartmental Modeling o Compartmental: uses intensive phase I and
II data to develop and establish model - applications to PK/PD and population pharmacokinetic research
Uses of Compartmental Modeling
• Obtain good estimates of physiological parameters, e.g. Ka, Cl
• Do simulations to estimate administered dose necessary to achieve a therapeutic range of plasma levels
• Predict concentrations in a compartment which can’t be measured directly
• Predict how differing drug release characteristics will affect bioavailability
• Determine the relationship between PK and PD
• Predict the effect of a loading dose on plasma concentrations
75
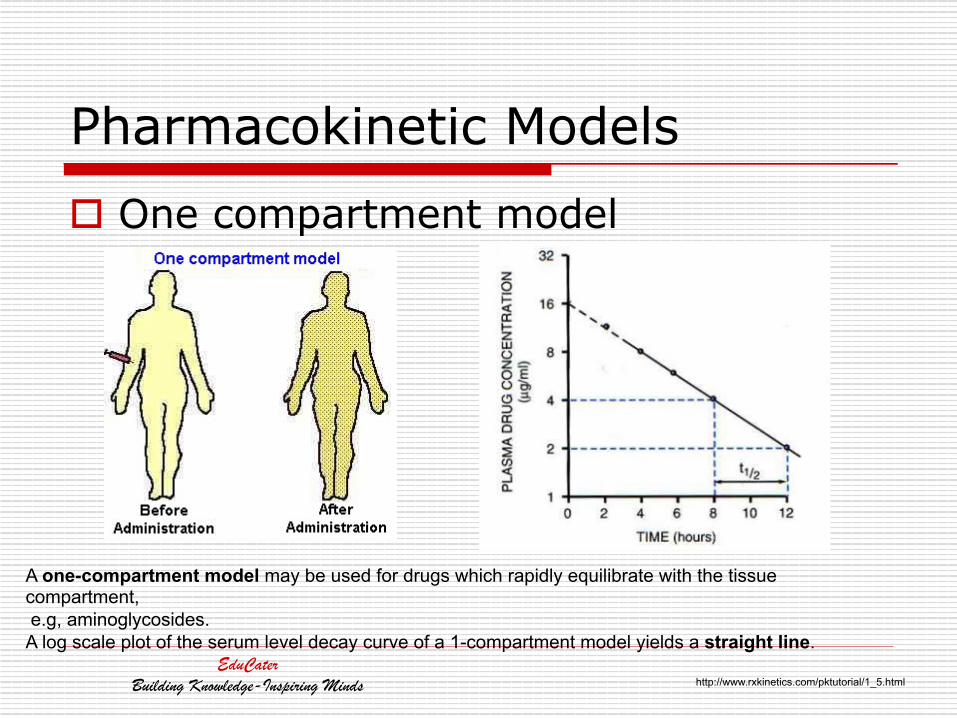
Pharmacokinetic Models o One compartment model
EduCaterBuilding Knowledge-Inspiring Minds
A one-compartment model may be used for drugs which rapidly equilibrate with the tissue compartment, e.g, aminoglycosides. A log scale plot of the serum level decay curve of a 1-compartment model yields a straight line.
http://www.rxkinetics.com/pktutorial/1_5.html
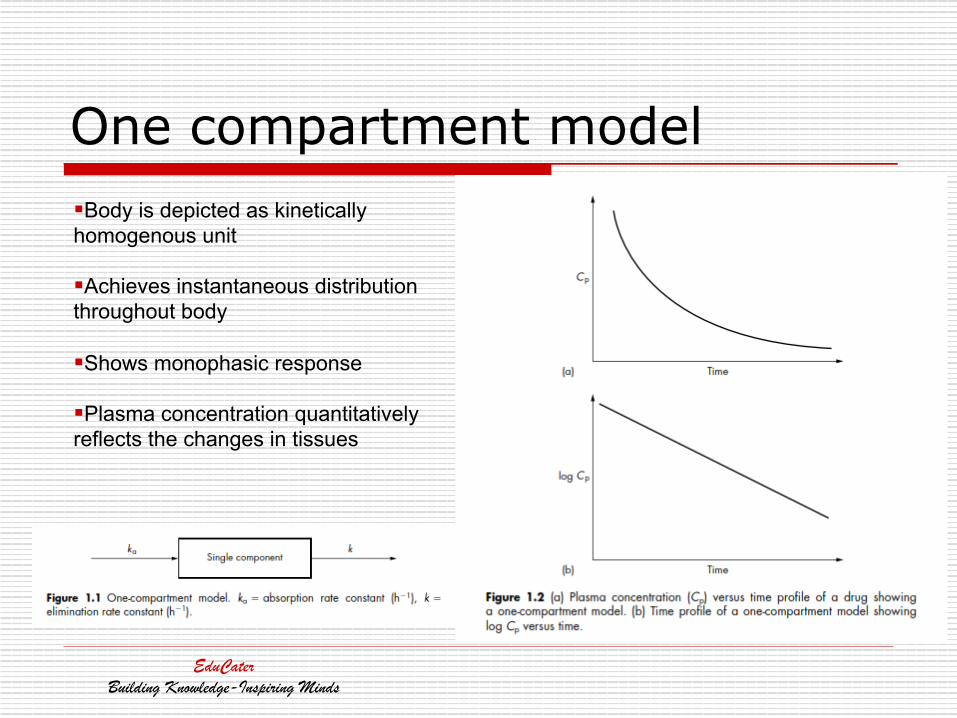
One compartment model § Body is depicted as kinetically homogenous unit
§ Achieves instantaneous distribution throughout body
§ Shows monophasic response
§ Plasma concentration quantitatively reflects the changes in tissues
EduCaterBuilding Knowledge-Inspiring Minds
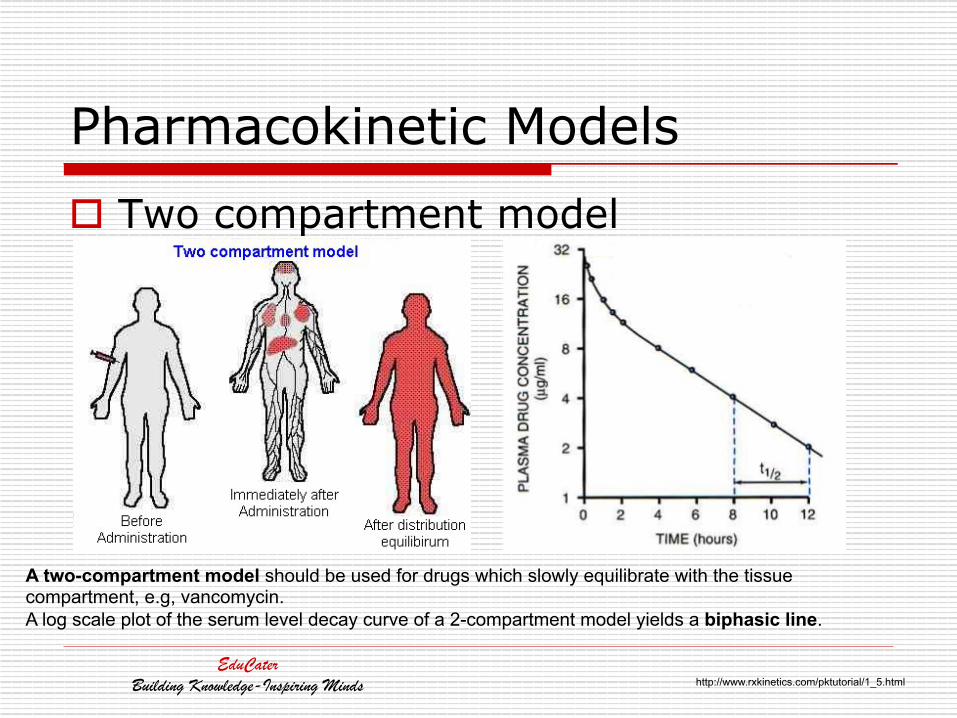
Pharmacokinetic Models o Two compartment model
EduCaterBuilding Knowledge-Inspiring Minds
A two-compartment model should be used for drugs which slowly equilibrate with the tissue compartment, e.g, vancomycin. A log scale plot of the serum level decay curve of a 2-compartment model yields a biphasic line.
http://www.rxkinetics.com/pktutorial/1_5.html
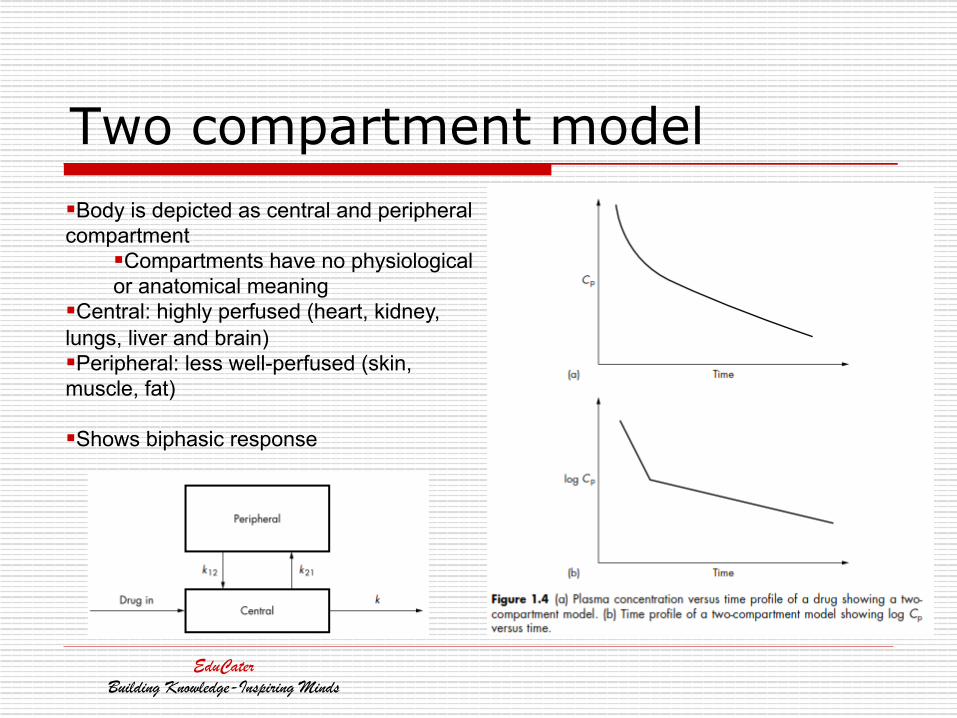
Two compartment model § Body is depicted as central and peripheral compartment
§ Compartments have no physiological or anatomical meaning
§ Central: highly perfused (heart, kidney, lungs, liver and brain) § Peripheral: less well-perfused (skin, muscle, fat)
§ Shows biphasic response
EduCaterBuilding Knowledge-Inspiring Minds
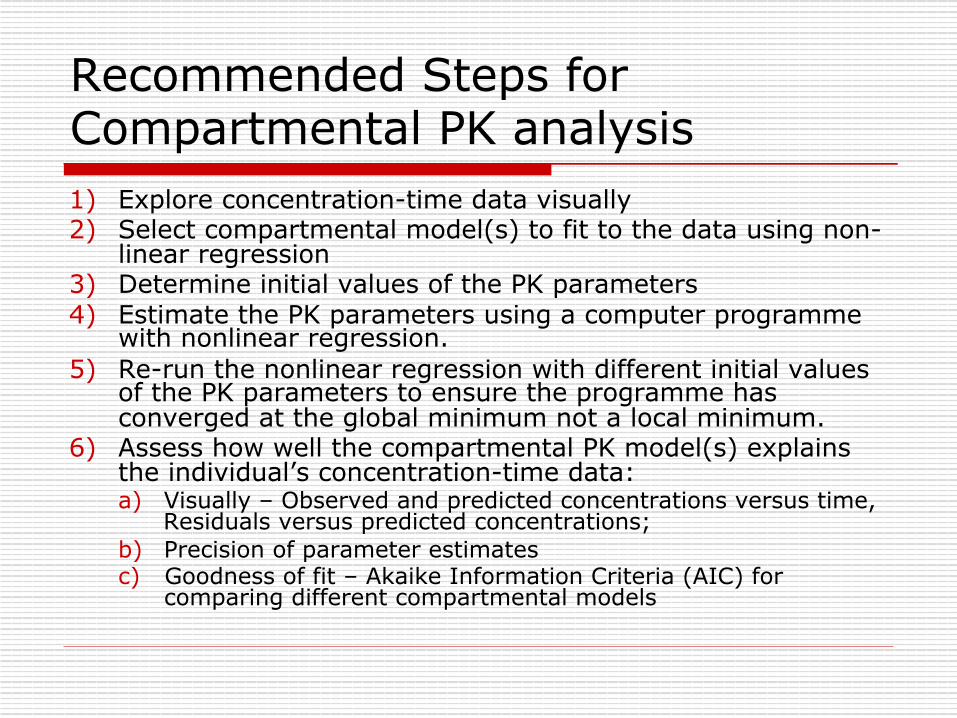
Recommended Steps for Compartmental PK analysis 1) Explore concentration-time data visually 2) Select compartmental model(s) to fit to the data using non-
linear regression 3) Determine initial values of the PK parameters 4) Estimate the PK parameters using a computer programme
with nonlinear regression. 5) Re-run the nonlinear regression with different initial values
of the PK parameters to ensure the programme has converged at the global minimum not a local minimum.
6) Assess how well the compartmental PK model(s) explains the individual’s concentration-time data: a) Visually – Observed and predicted concentrations versus time,
Residuals versus predicted concentrations; b) Precision of parameter estimates c) Goodness of fit – Akaike Information Criteria (AIC) for
comparing different compartmental models
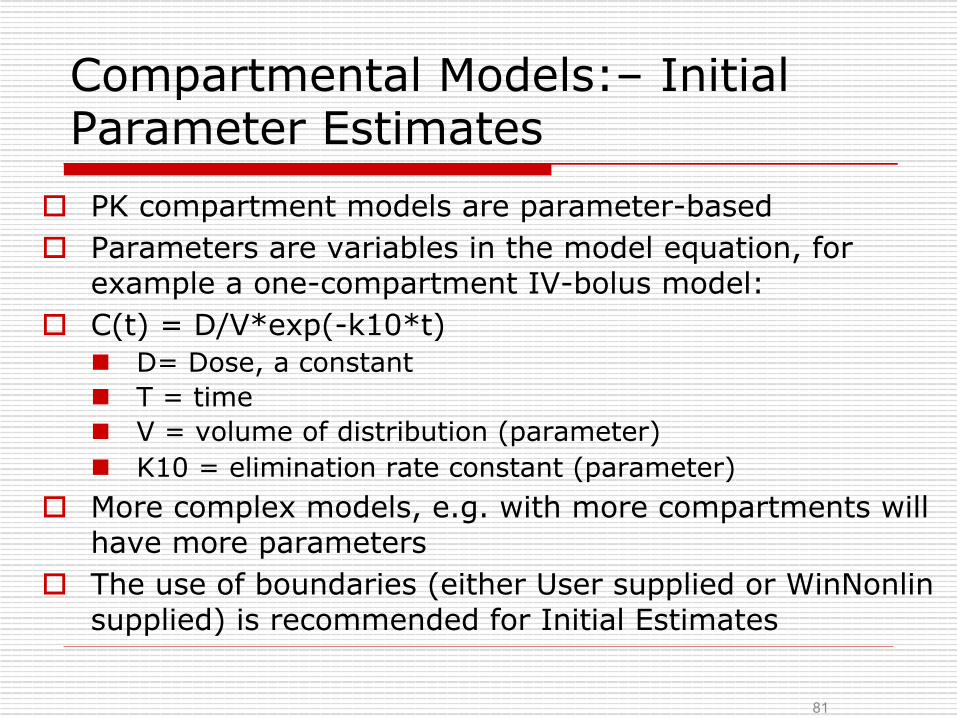
Compartmental Models:– Initial Parameter Estimates
o PK compartment models are parameter-based o Parameters are variables in the model equation, for
example a one-compartment IV-bolus model: o C(t) = D/V*exp(-k10*t)
n D= Dose, a constant n T = time n V = volume of distribution (parameter) n K10 = elimination rate constant (parameter)
o More complex models, e.g. with more compartments will have more parameters
o The use of boundaries (either User supplied or WinNonlin supplied) is recommended for Initial Estimates
81

0.1
1.0
10.0
100.0
0 12 24 36 48 60 72Time
Extrapolated Observed Residual
Slope = -ke/2.303
Slope = -ka/2.303
Obtaining Initial Estimates
82
C = A e-αt + B e-βt
A and B are coefficients ; α and β are exponents
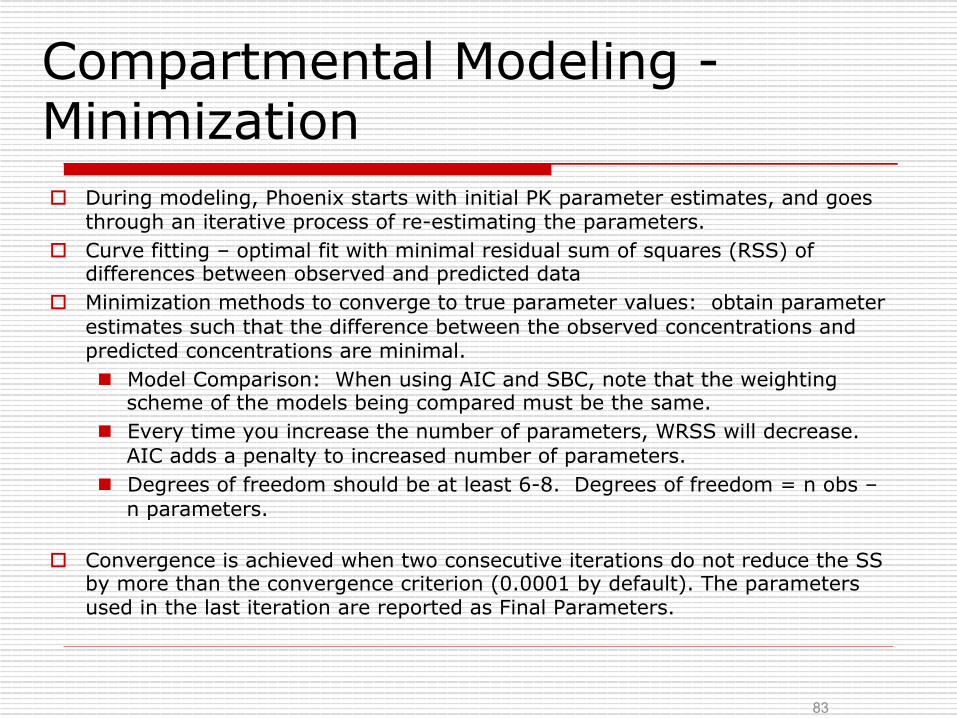
Compartmental Modeling - Minimization o During modeling, Phoenix starts with initial PK parameter estimates, and goes
through an iterative process of re-estimating the parameters. o Curve fitting – optimal fit with minimal residual sum of squares (RSS) of
differences between observed and predicted data o Minimization methods to converge to true parameter values: obtain parameter
estimates such that the difference between the observed concentrations and predicted concentrations are minimal. n Model Comparison: When using AIC and SBC, note that the weighting
scheme of the models being compared must be the same. n Every time you increase the number of parameters, WRSS will decrease.
AIC adds a penalty to increased number of parameters. n Degrees of freedom should be at least 6-8. Degrees of freedom = n obs –
n parameters.
o Convergence is achieved when two consecutive iterations do not reduce the SS by more than the convergence criterion (0.0001 by default). The parameters used in the last iteration are reported as Final Parameters.
83
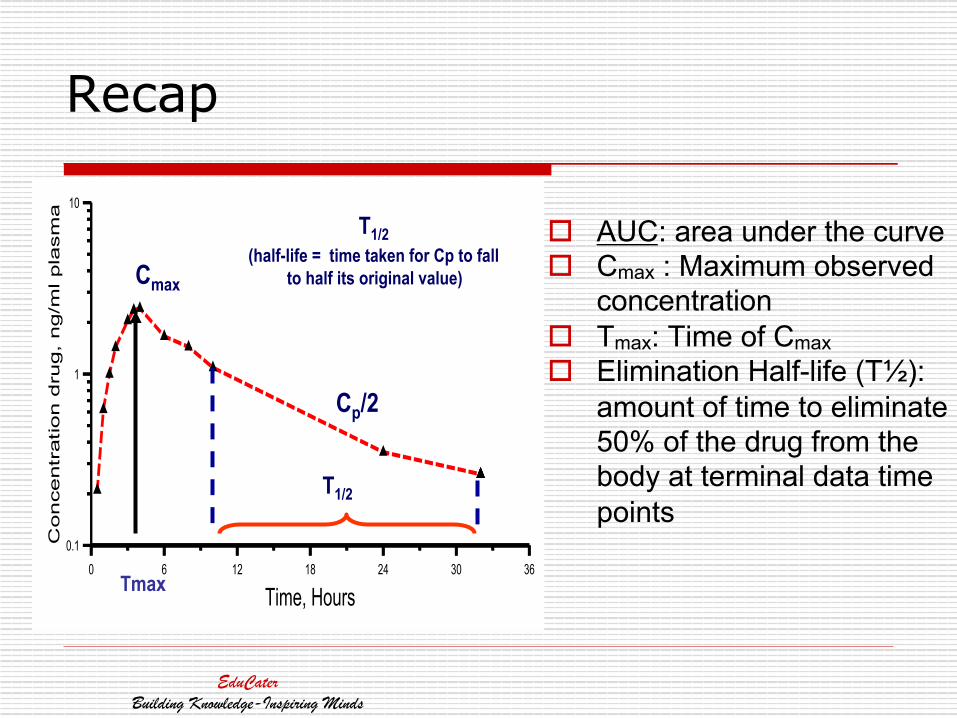
Recap
o AUC: area under the curve o Cmax : Maximum observed
concentration o Tmax: Time of Cmax o Elimination Half-life (T½):
amount of time to eliminate 50% of the drug from the body at terminal data time points
0.1
1
10
0 6 12 18 24 30 36
Time, Hours
T1/2 (half-life = time taken for Cp to fall
to half its original value)
Cp/2
T1/2
Cmax
Tmax
EduCaterBuilding Knowledge-Inspiring Minds
Time (hr) 10 mg IV 10 mg oral
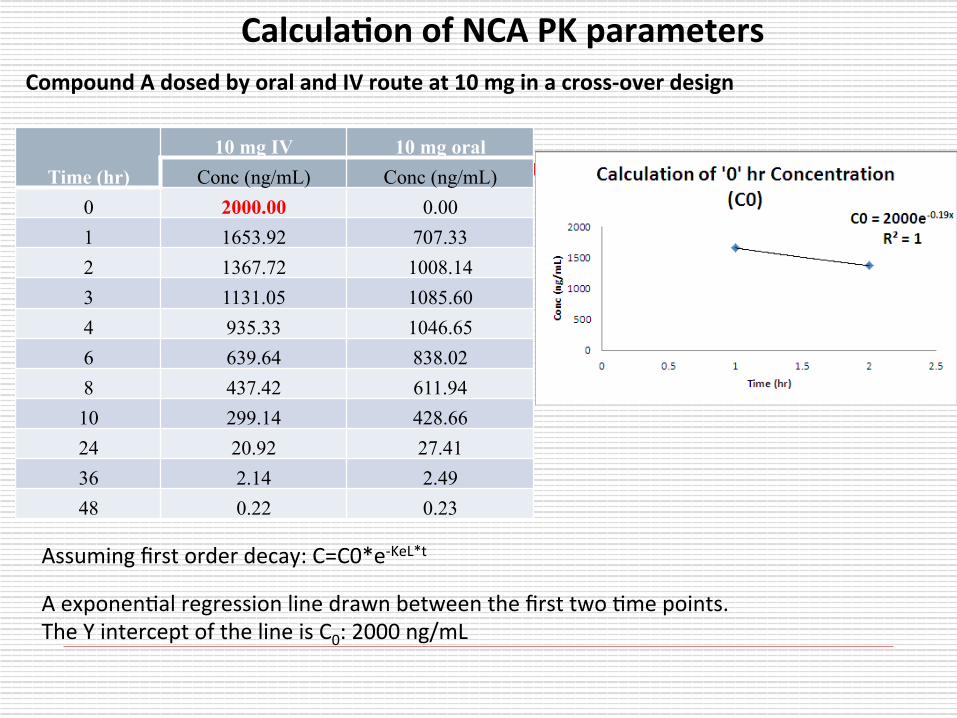
Conc (ng/mL) Conc (ng/mL) 0 2000.00 0.00 1 1653.92 707.33 2 1367.72 1008.14 3 1131.05 1085.60 4 935.33 1046.65 6 639.64 838.02 8 437.42 611.94 10 299.14 428.66 24 20.92 27.41 36 2.14 2.49 48 0.22 0.23
Calcula7on of NCA PK parameters
Assuming first order decay: C=C0*e-‐KeL*t
A exponen-al regression line drawn between the first two -me points. The Y intercept of the line is C0: 2000 ng/mL
Compound A dosed by oral and IV route at 10 mg in a cross-‐over design
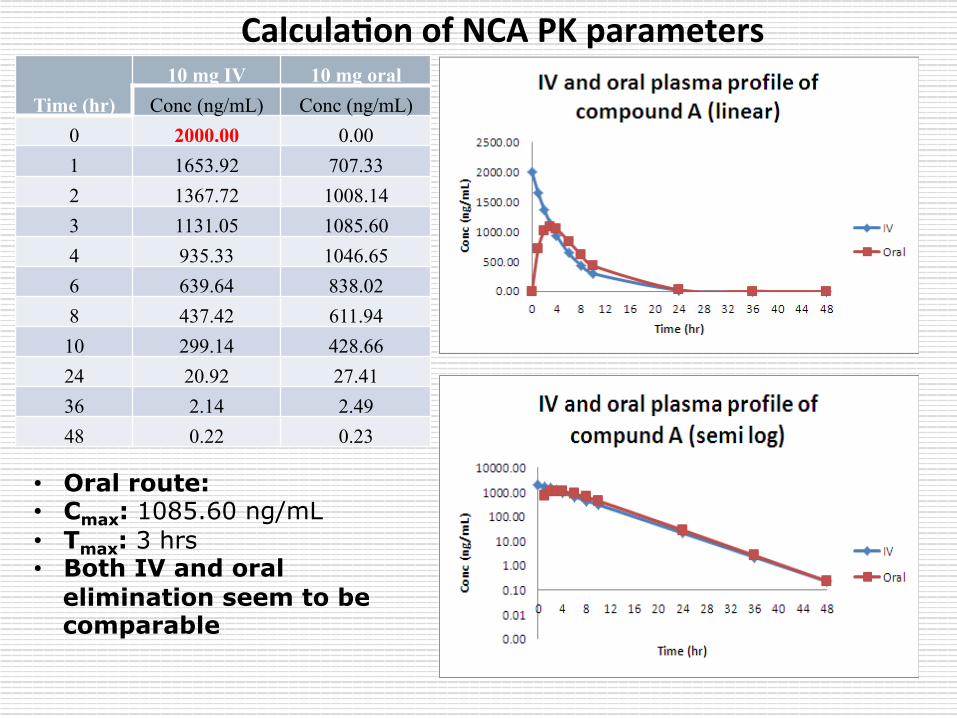
Time (hr) 10 mg IV 10 mg oral
Conc (ng/mL) Conc (ng/mL) 0 2000.00 0.00 1 1653.92 707.33 2 1367.72 1008.14 3 1131.05 1085.60 4 935.33 1046.65 6 639.64 838.02 8 437.42 611.94 10 299.14 428.66 24 20.92 27.41 36 2.14 2.49 48 0.22 0.23
Calcula7on of NCA PK parameters
• Oral route: • Cmax: 1085.60 ng/mL • Tmax: 3 hrs • Both IV and oral
elimination seem to be comparable
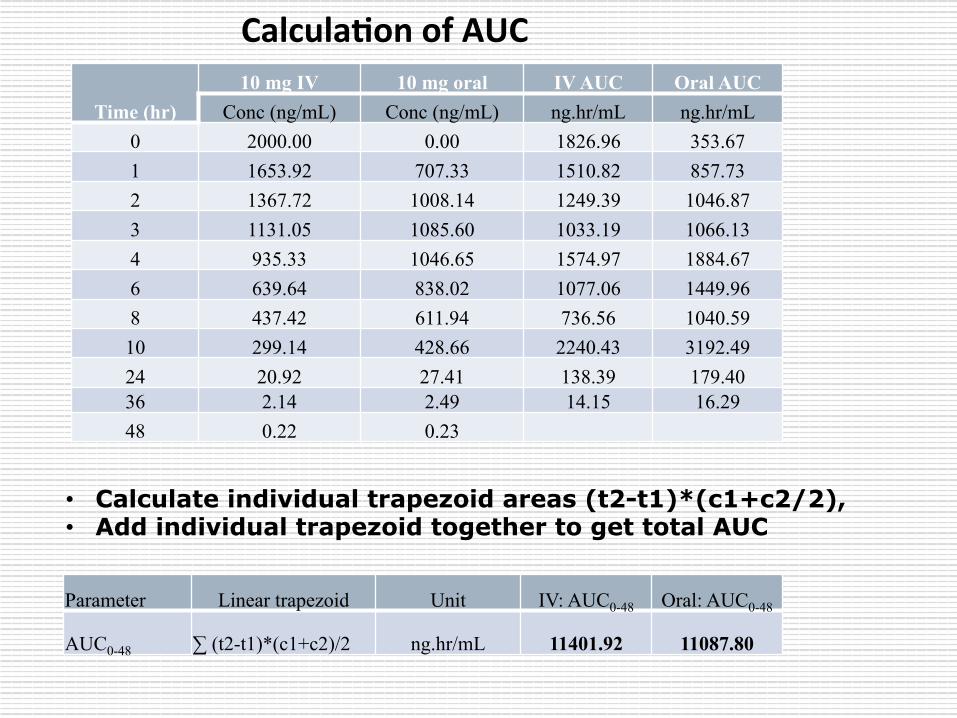
Time (hr) 10 mg IV 10 mg oral IV AUC Oral AUC
Conc (ng/mL) Conc (ng/mL) ng.hr/mL ng.hr/mL 0 2000.00 0.00 1826.96 353.67 1 1653.92 707.33 1510.82 857.73 2 1367.72 1008.14 1249.39 1046.87 3 1131.05 1085.60 1033.19 1066.13 4 935.33 1046.65 1574.97 1884.67 6 639.64 838.02 1077.06 1449.96 8 437.42 611.94 736.56 1040.59 10 299.14 428.66 2240.43 3192.49 24 20.92 27.41 138.39 179.40 36 2.14 2.49 14.15 16.29 48 0.22 0.23
Calcula7on of AUC
Parameter Linear trapezoid Unit IV: AUC0-48 Oral: AUC0-48
AUC0-48 ∑ (t2-t1)*(c1+c2)/2 ng.hr/mL 11401.92 11087.80
• Calculate individual trapezoid areas (t2-t1)*(c1+c2/2), • Add individual trapezoid together to get total AUC
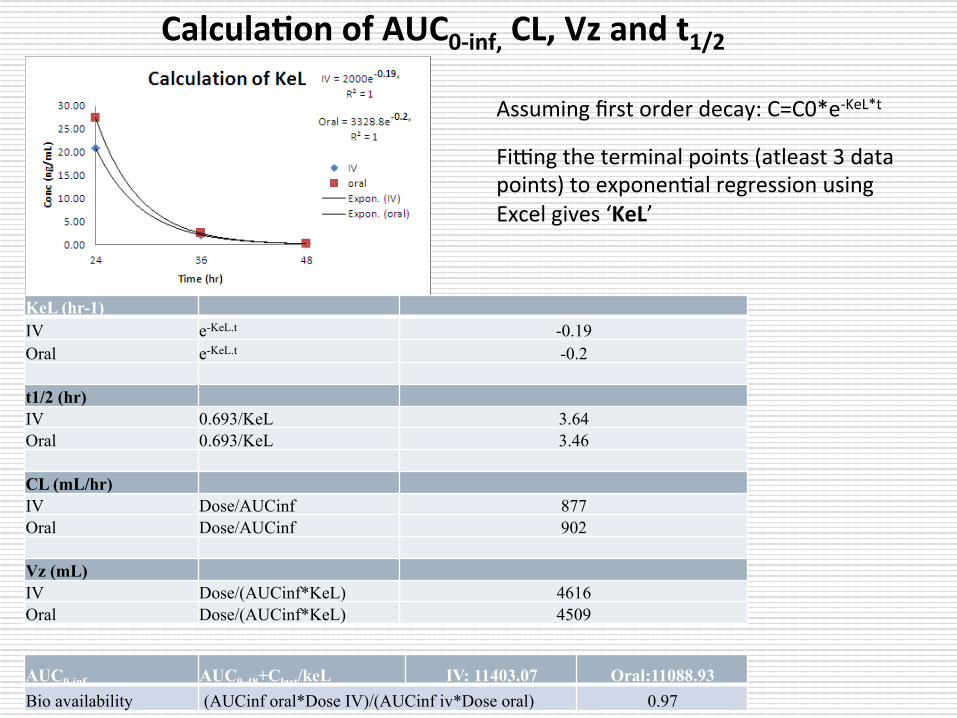
Calcula7on of AUC0-‐inf, CL, Vz and t1/2
Assuming first order decay: C=C0*e-‐KeL*t
Fi[ng the terminal points (atleast 3 data points) to exponen-al regression using Excel gives ‘KeL’
AUC0-inf AUC0-48+Clast/keL IV: 11403.07 Oral:11088.93 Bio availability (AUCinf oral*Dose IV)/(AUCinf iv*Dose oral) 0.97
KeL (hr-1) IV e-KeL.t -0.19 Oral e-KeL.t -0.2
t1/2 (hr) IV 0.693/KeL 3.64 Oral 0.693/KeL 3.46
CL (mL/hr) IV Dose/AUCinf 877 Oral Dose/AUCinf 902
Vz (mL) IV Dose/(AUCinf*KeL) 4616 Oral Dose/(AUCinf*KeL) 4509
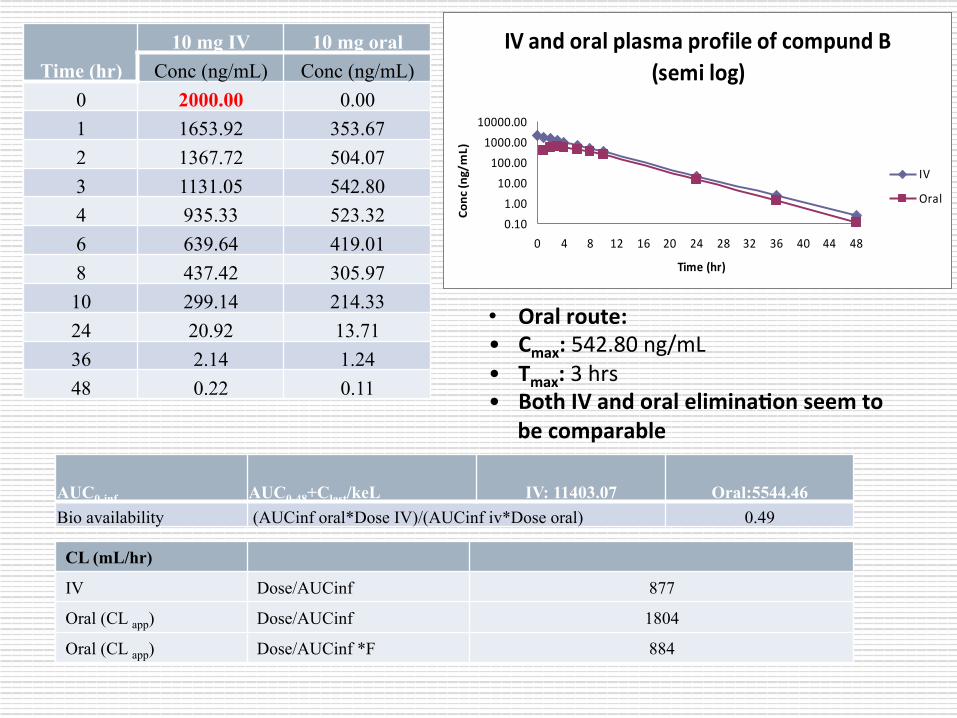
Time (hr) 10 mg IV 10 mg oral
Conc (ng/mL) Conc (ng/mL) 0 2000.00 0.00 1 1653.92 353.67 2 1367.72 504.07 3 1131.05 542.80 4 935.33 523.32 6 639.64 419.01 8 437.42 305.97 10 299.14 214.33 24 20.92 13.71 36 2.14 1.24 48 0.22 0.11
• Oral route: • Cmax: 542.80 ng/mL • Tmax: 3 hrs • Both IV and oral elimina7on seem to
be comparable
IV and oral plasma profile of compund B (semi log)
0.101.00
10.00100.00
1000.0010000.00
0 4 8 12 16 20 24 28 32 36 40 44 48
Time (hr)
Conc (n
g/mL)
IV
Oral
AUC0-inf AUC0-48+Clast/keL IV: 11403.07 Oral:5544.46 Bio availability (AUCinf oral*Dose IV)/(AUCinf iv*Dose oral) 0.49
CL (mL/hr)
IV Dose/AUCinf 877
Oral (CL app) Dose/AUCinf 1804
Oral (CL app) Dose/AUCinf *F 884
Non Compartmental Analysis - Urine
Non-Compartmental Analysis
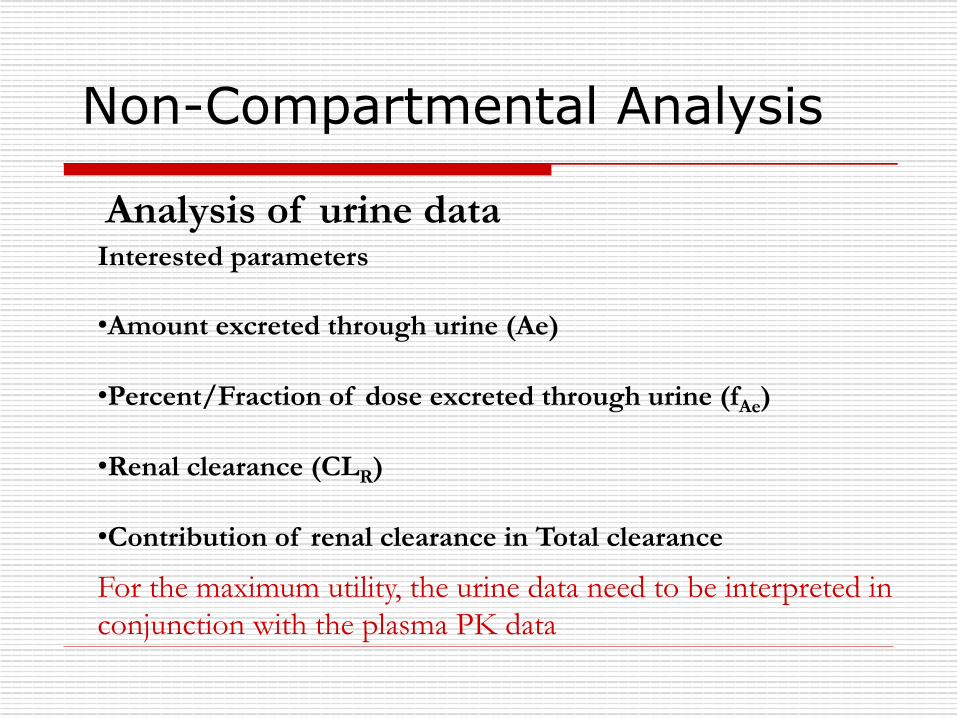
Analysis of urine data Interested parameters • Amount excreted through urine (Ae)
• Percent/Fraction of dose excreted through urine (fAe)
• Renal clearance (CLR)
• Contribution of renal clearance in Total clearance
For the maximum utility, the urine data need to be interpreted in conjunction with the plasma PK data
Non-Compartmental Analysis Plasma and Urine data analysis
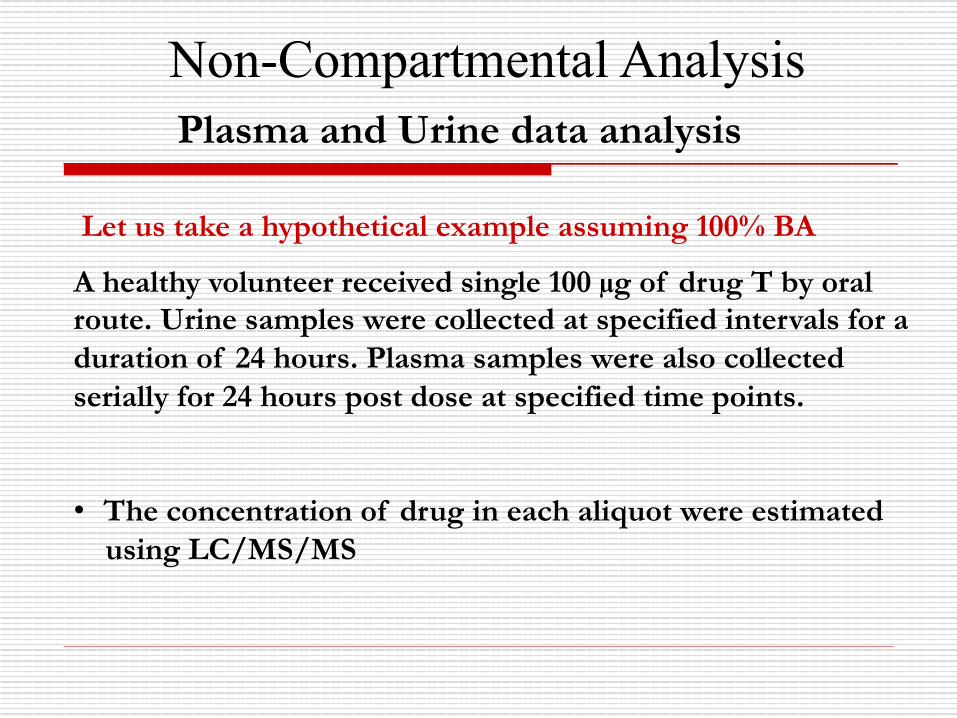
Let us take a hypothetical example assuming 100% BA
A healthy volunteer received single 100 µg of drug T by oral route. Urine samples were collected at specified intervals for a duration of 24 hours. Plasma samples were also collected serially for 24 hours post dose at specified time points.
• The concentration of drug in each aliquot were estimated using LC/MS/MS
Non-Compartmental Analysis Plasma Theoretical example
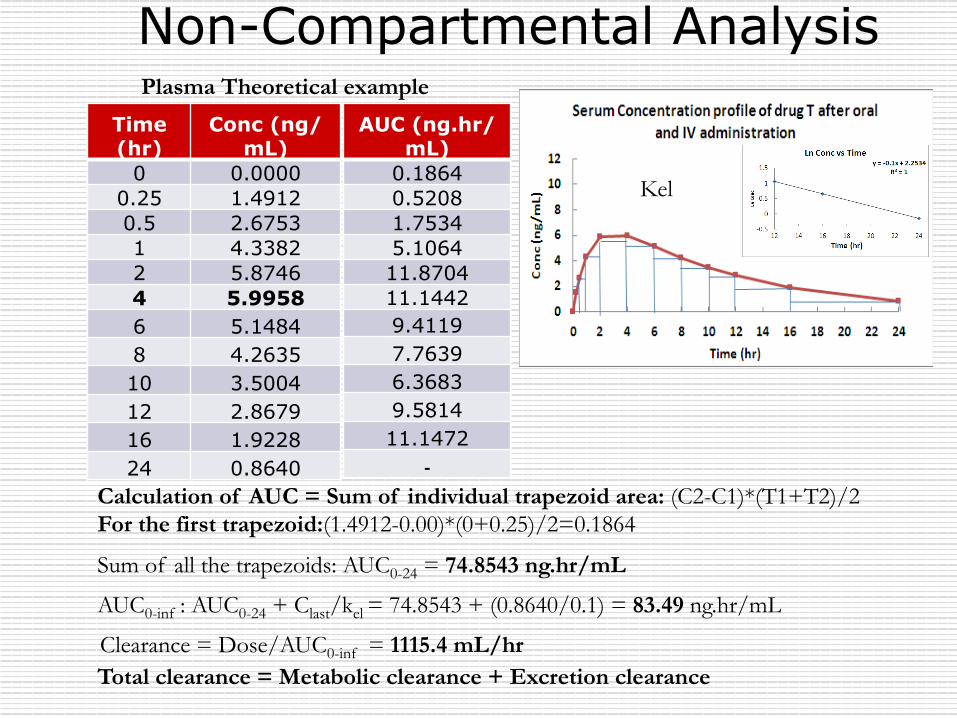
Time (hr)
Conc (ng/mL)
0 0.0000 0.25 1.4912 0.5 2.6753 1 4.3382 2 5.8746 4 5.9958 6 5.1484 8 4.2635 10 3.5004 12 2.8679 16 1.9228 24 0.8640
Calculation of AUC = Sum of individual trapezoid area: (C2-C1)*(T1+T2)/2 For the first trapezoid:(1.4912-0.00)*(0+0.25)/2=0.1864
AUC (ng.hr/mL)
0.1864 0.5208 1.7534 5.1064 11.8704 11.1442 9.4119 7.7639 6.3683 9.5814 11.1472
-‐
Sum of all the trapezoids: AUC0-24 = 74.8543 ng.hr/mL
AUC0-inf : AUC0-24 + Clast/kel = 74.8543 + (0.8640/0.1) = 83.49 ng.hr/mL
Clearance = Dose/AUC0-inf = 1115.4 mL/hr Total clearance = Metabolic clearance + Excretion clearance
Kel
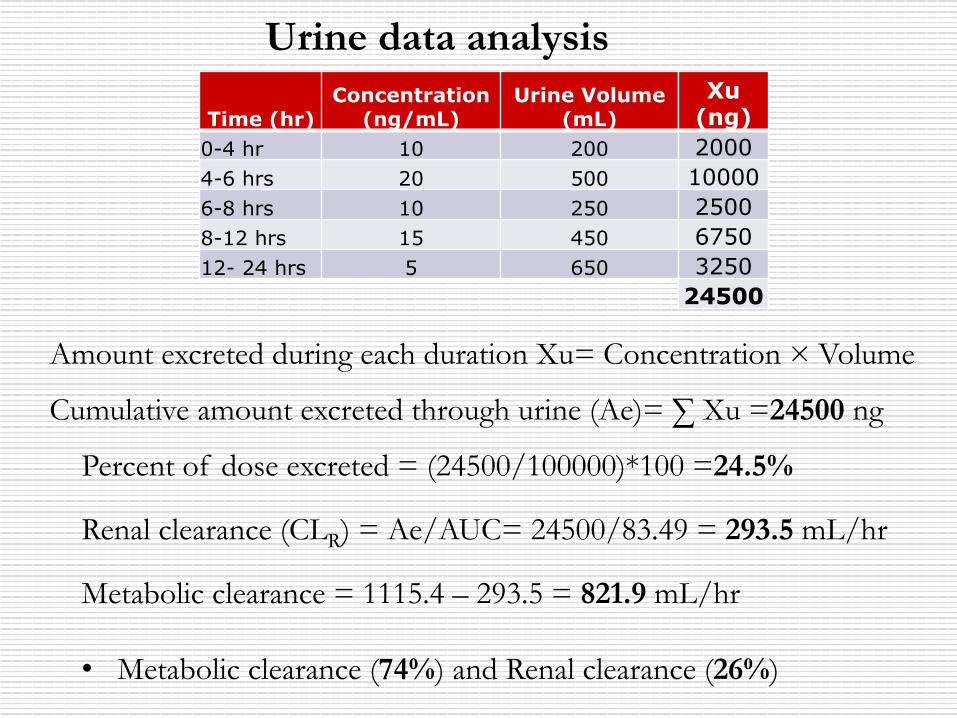
Time (hr) Concentration
(ng/mL) Urine Volume
(mL) 0-4 hr 10 200 4-6 hrs 20 500 6-8 hrs 10 250 8-12 hrs 15 450 12- 24 hrs 5 650
Urine data analysis Xu
(ng) 2000 10000 2500 6750 3250
24500
Amount excreted during each duration Xu= Concentration × Volume
Percent of dose excreted = (24500/100000)*100 =24.5%
Renal clearance (CLR) = Ae/AUC= 24500/83.49 = 293.5 mL/hr
Cumulative amount excreted through urine (Ae)= ∑ Xu =24500 ng
Metabolic clearance = 1115.4 – 293.5 = 821.9 mL/hr • Metabolic clearance (74%) and Renal clearance (26%)
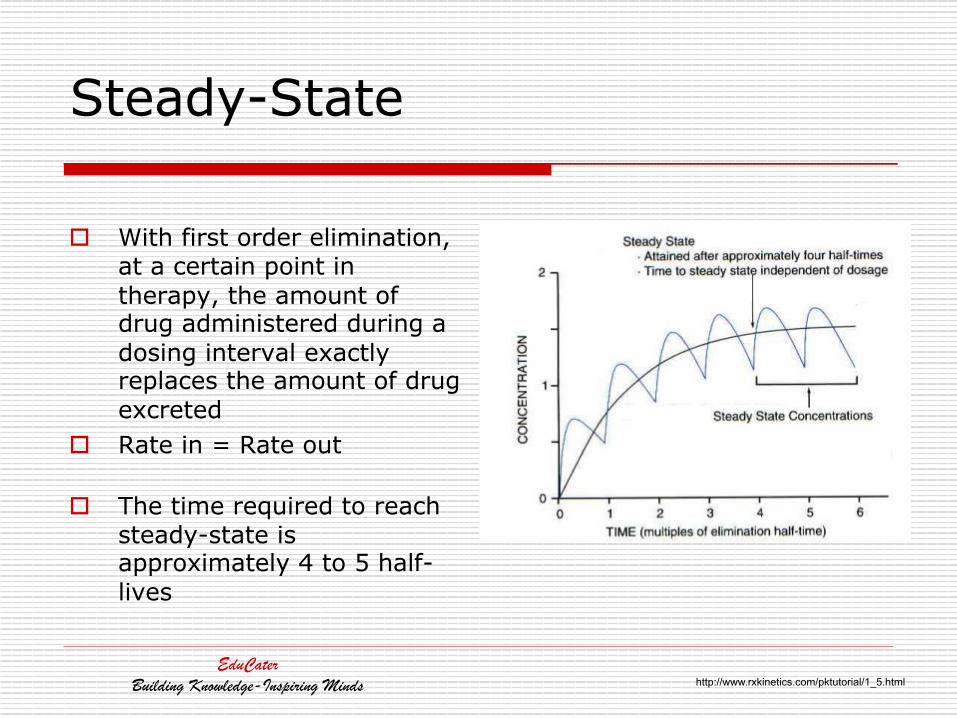
Steady-State
o With first order elimination,
at a certain point in therapy, the amount of drug administered during a dosing interval exactly replaces the amount of drug excreted
o Rate in = Rate out
o The time required to reach steady-state is approximately 4 to 5 half-lives
EduCaterBuilding Knowledge-Inspiring Minds http://www.rxkinetics.com/pktutorial/1_5.html
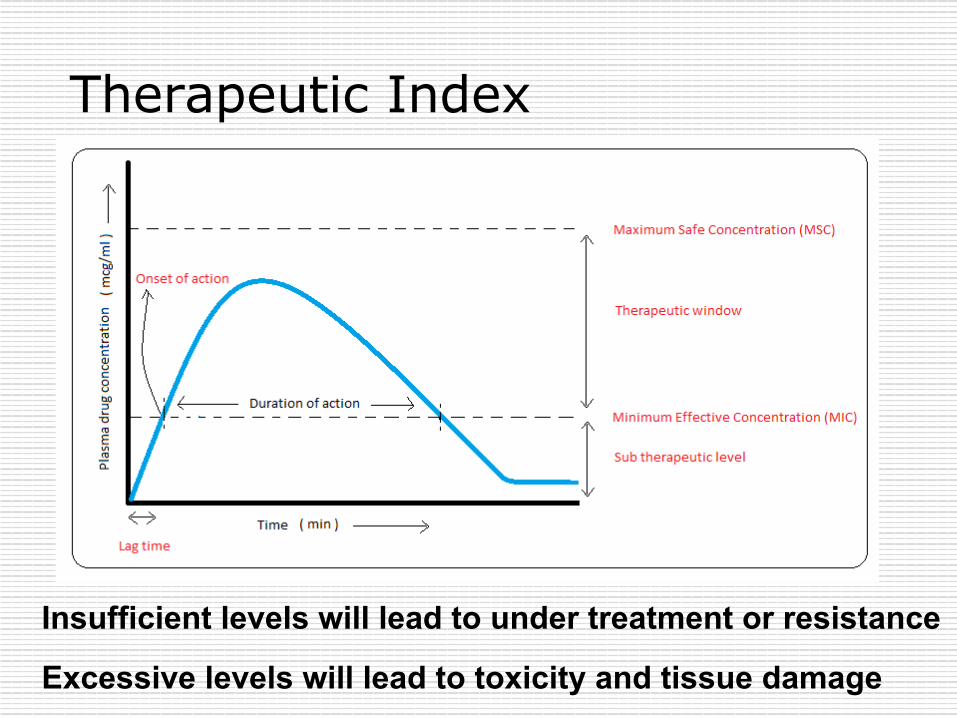
Therapeutic Index
Insufficient levels will lead to under treatment or resistance
Excessive levels will lead to toxicity and tissue damage

Therapeutic Drug Monitoring
o Narrow Therapeutic Window Drugs (digoxin, aminoglycosides, lidocaine, lithium, phenobarbital, phenytoin, theophylline)
o Allows rapid and safe delivery of drugs as these drugs can be easily over or under dosed
o Give drug, measure plasma concentrations o Use concentration data to develop safe
dosing regimen for individual patient.
98
1. Measure drug and metabolite concentrations in blood, urine and other body fluids as a function of time.
2. Set up models to describe the time course and to predict the drug levels at times not studied.
3. Determine parameters from model which can be related to physiological, clinical, physical or chemical properties of the drug.
Determination of pharmacokinetic parameters in "normal" subjects
Pharmacodynamics
Pharmacodynamics is the study of what the drug does to the body dynamics = change
Drug Receptors o Most drugs bind to cellular receptors
n Initiate biochemical reactions n Pharmacological effect is due to the alteration of an intrinsic physiologic
process and not the creation of a new process o Proteins or glycoproteins
n Present on cell surface, on an organelle within the cell, or in the cytoplasm
n Finite number of receptors in a given cell o Receptor mediated responses plateau upon saturation of all receptors
o Action occurs when drug binds to receptor and this action may be: n Ion channel is opened or closed n Second messenger is activated
o cAMP, cGMP, Ca++, inositol phosphates, etc. o Initiates a series of chemical reactions
n Normal cellular function is physically inhibited n Cellular function is “turned on
Drug Receptor o Affinity
n Refers to the strength of binding between a drug and receptor
n Number of occupied receptors is a function of a balance between bound and free drug
o Dissociation constant (KD) n Measure of a drug’s affinity for a given receptor n Defined as the concentration of drug required in
solution to achieve 50% occupancy of its receptors
PD Model: Definitions o Efficacy
n Degree to which a drug is able to produce the desired response o Potency
n Amount of drug required to produce 50% of the maximal response the drug is capable of inducing
n Used to compare compounds within classes of drugs o Effective Concentration 50% (ED50)
n Concentration of the drug which induces a specified clinical effect in 50% of subjects
o Lethal Dose 50% (LD50) n Concentration of the drug which induces death in 50% of
subjects o Therapeutic Index
n Measure of the safety of a drug n Calculation: LD50/ED50
o Margin of Safety n Margin between the therapeutic and lethal doses of a drug
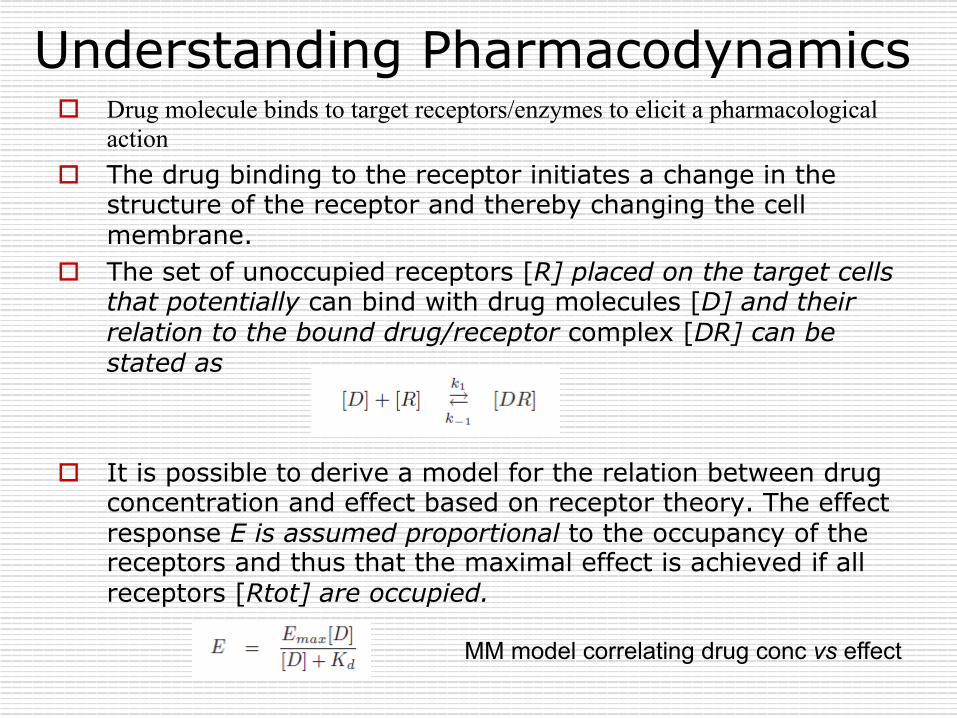
Understanding Pharmacodynamics o Drug molecule binds to target receptors/enzymes to elicit a pharmacological
action o The drug binding to the receptor initiates a change in the
structure of the receptor and thereby changing the cell membrane.
o The set of unoccupied receptors [R] placed on the target cells that potentially can bind with drug molecules [D] and their relation to the bound drug/receptor complex [DR] can be stated as
o It is possible to derive a model for the relation between drug
concentration and effect based on receptor theory. The effect response E is assumed proportional to the occupancy of the receptors and thus that the maximal effect is achieved if all receptors [Rtot] are occupied.
MM model correlating drug conc vs effect
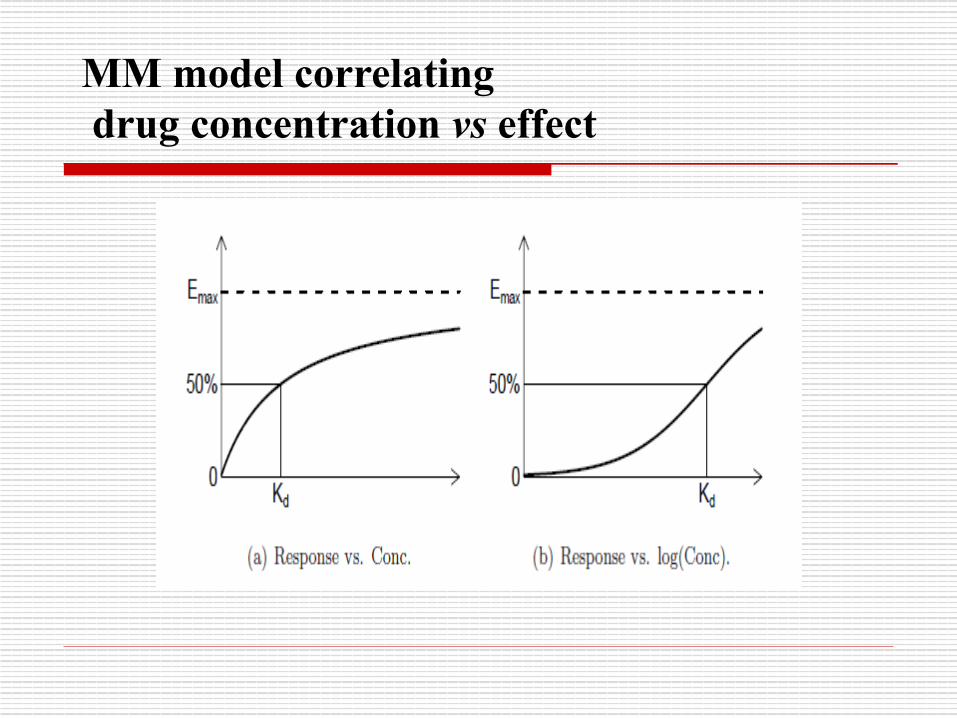
MM model correlating drug concentration vs effect
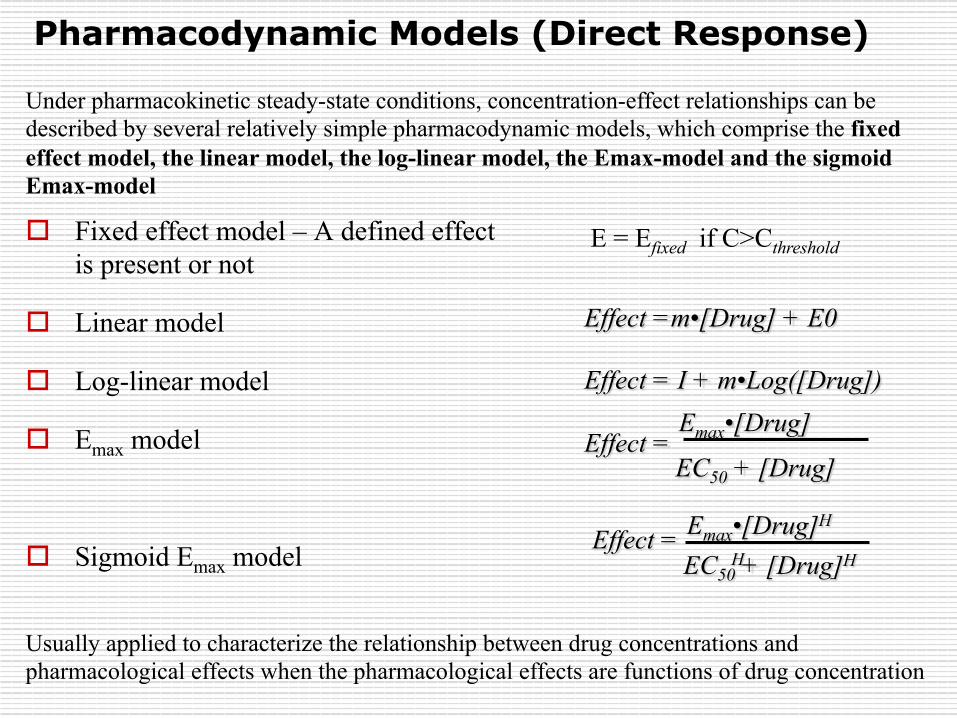
Pharmacodynamic Models (Direct Response)
o Fixed effect model – A defined effect is present or not
o Linear model
o Log-linear model
o Emax model
o Sigmoid Emax model
Effect =m•[Drug] + E0
Effect = I + m•Log([Drug])
Effect = EC50 + [Drug]H Emax•[Drug]H
H
Usually applied to characterize the relationship between drug concentrations and pharmacological effects when the pharmacological effects are functions of drug concentration
Under pharmacokinetic steady-state conditions, concentration-effect relationships can be described by several relatively simple pharmacodynamic models, which comprise the fixed effect model, the linear model, the log-linear model, the Emax-model and the sigmoid Emax-model
E = Efixed if C>Cthreshold
Effect = EC50 + [Drug]
Emax•[Drug]
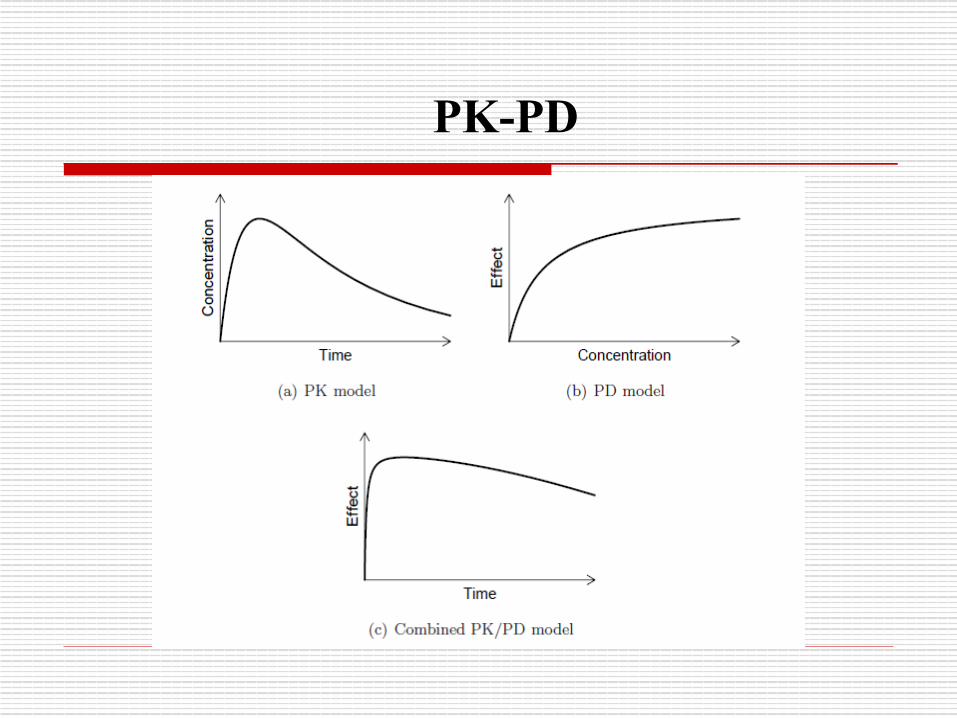
PK / PD Modeling
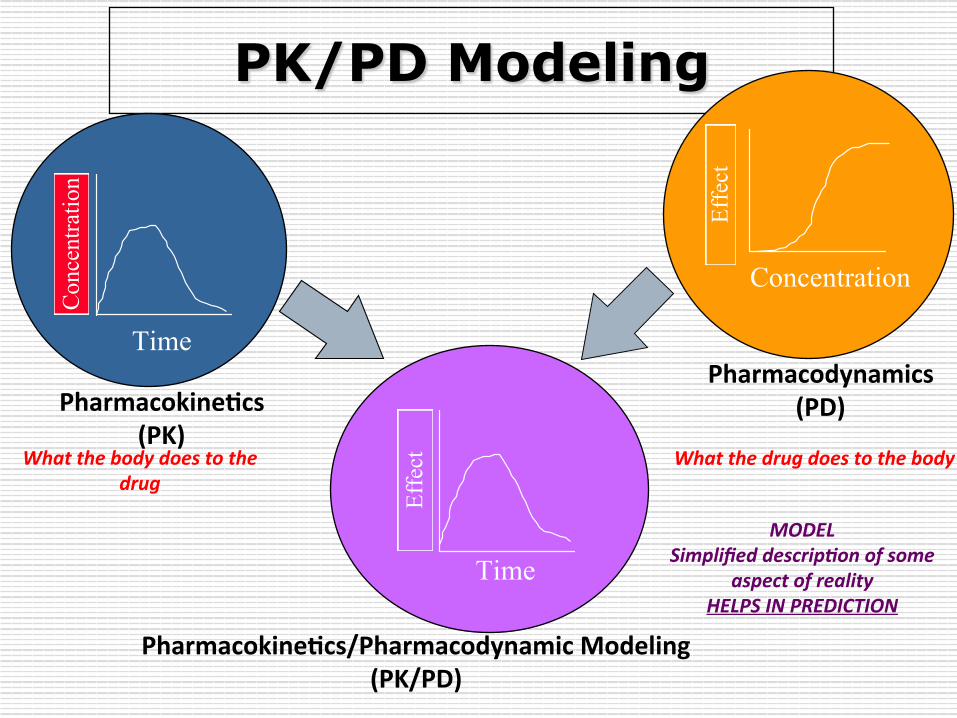
PK/PD Modeling
Pharmacokine7cs (PK)
Pharmacodynamics (PD)
Effect
Concentration
Concentration
Time
Effect
Time
Pharmacokine7cs/Pharmacodynamic Modeling (PK/PD)
What the body does to the drug
What the drug does to the body
MODEL Simplified descrip;on of some
aspect of reality HELPS IN PREDICTION
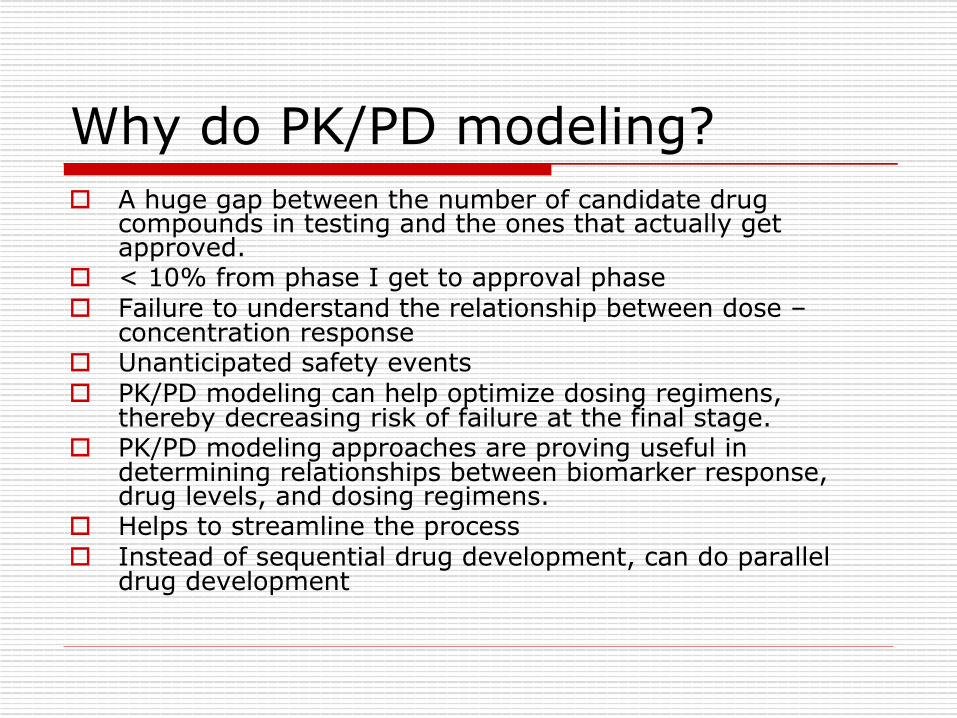
Why do PK/PD modeling? o A huge gap between the number of candidate drug
compounds in testing and the ones that actually get approved.
o < 10% from phase I get to approval phase o Failure to understand the relationship between dose –
concentration response o Unanticipated safety events o PK/PD modeling can help optimize dosing regimens,
thereby decreasing risk of failure at the final stage. o PK/PD modeling approaches are proving useful in
determining relationships between biomarker response, drug levels, and dosing regimens.
o Helps to streamline the process o Instead of sequential drug development, can do parallel
drug development
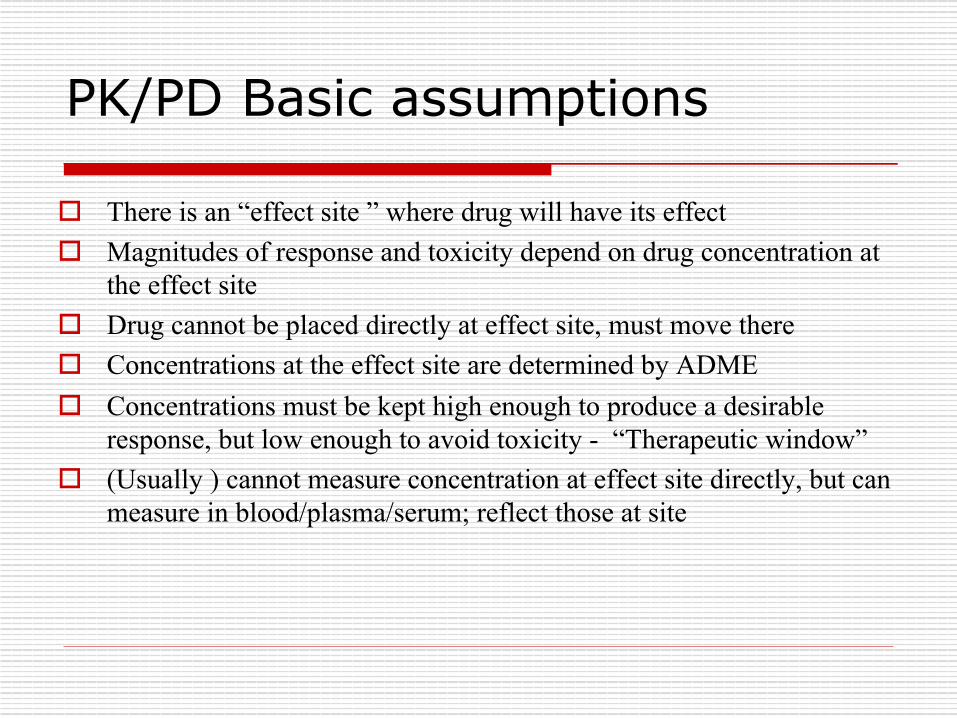
PK/PD Basic assumptions
o There is an “effect site ” where drug will have its effect o Magnitudes of response and toxicity depend on drug concentration at
the effect site o Drug cannot be placed directly at effect site, must move there o Concentrations at the effect site are determined by ADME o Concentrations must be kept high enough to produce a desirable
response, but low enough to avoid toxicity - “Therapeutic window” o (Usually ) cannot measure concentration at effect site directly, but can
measure in blood/plasma/serum; reflect those at site
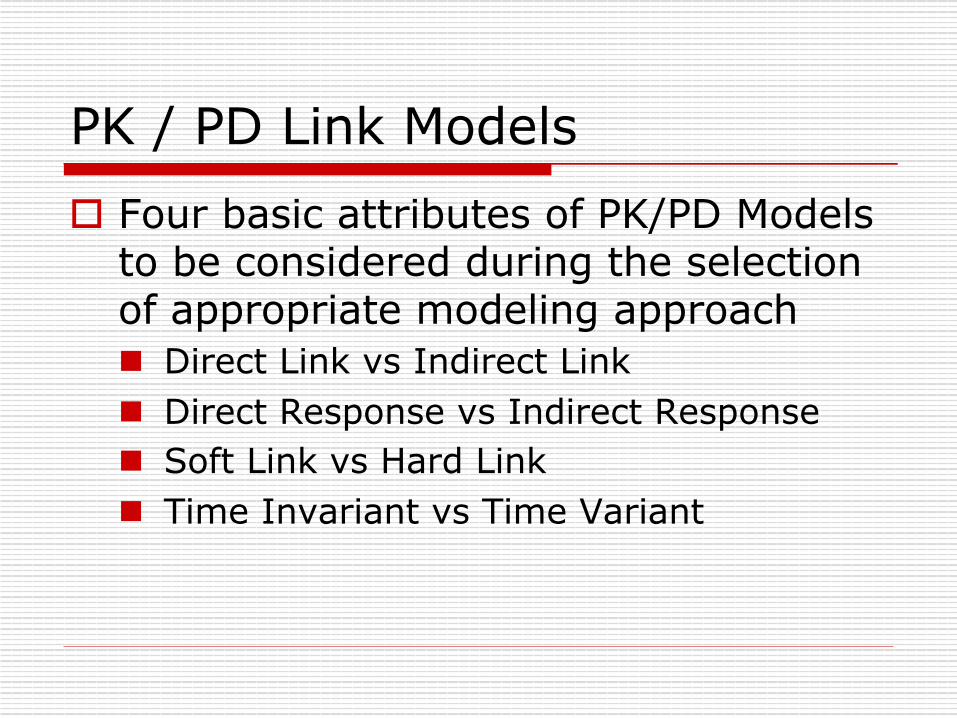
PK / PD Link Models o Four basic attributes of PK/PD Models
to be considered during the selection of appropriate modeling approach n Direct Link vs Indirect Link n Direct Response vs Indirect Response n Soft Link vs Hard Link n Time Invariant vs Time Variant
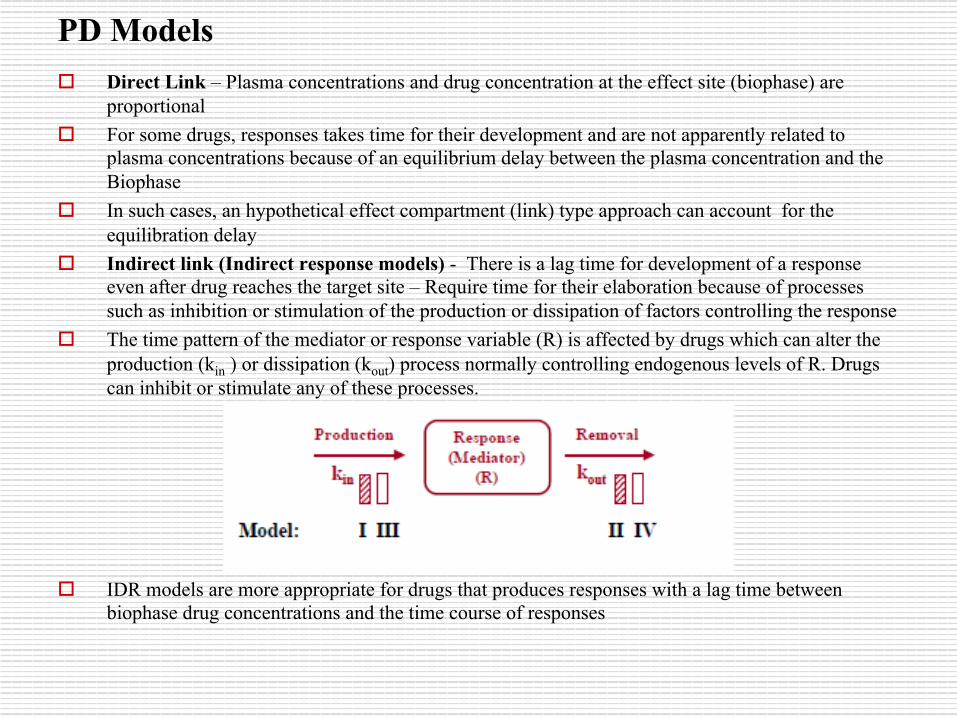
PD Models o Direct Link – Plasma concentrations and drug concentration at the effect site (biophase) are
proportional o For some drugs, responses takes time for their development and are not apparently related to
plasma concentrations because of an equilibrium delay between the plasma concentration and the Biophase
o In such cases, an hypothetical effect compartment (link) type approach can account for the equilibration delay
o Indirect link (Indirect response models) - There is a lag time for development of a response even after drug reaches the target site – Require time for their elaboration because of processes such as inhibition or stimulation of the production or dissipation of factors controlling the response
o The time pattern of the mediator or response variable (R) is affected by drugs which can alter the production (kin ) or dissipation (kout) process normally controlling endogenous levels of R. Drugs can inhibit or stimulate any of these processes.
o IDR models are more appropriate for drugs that produces responses with a lag time between biophase drug concentrations and the time course of responses
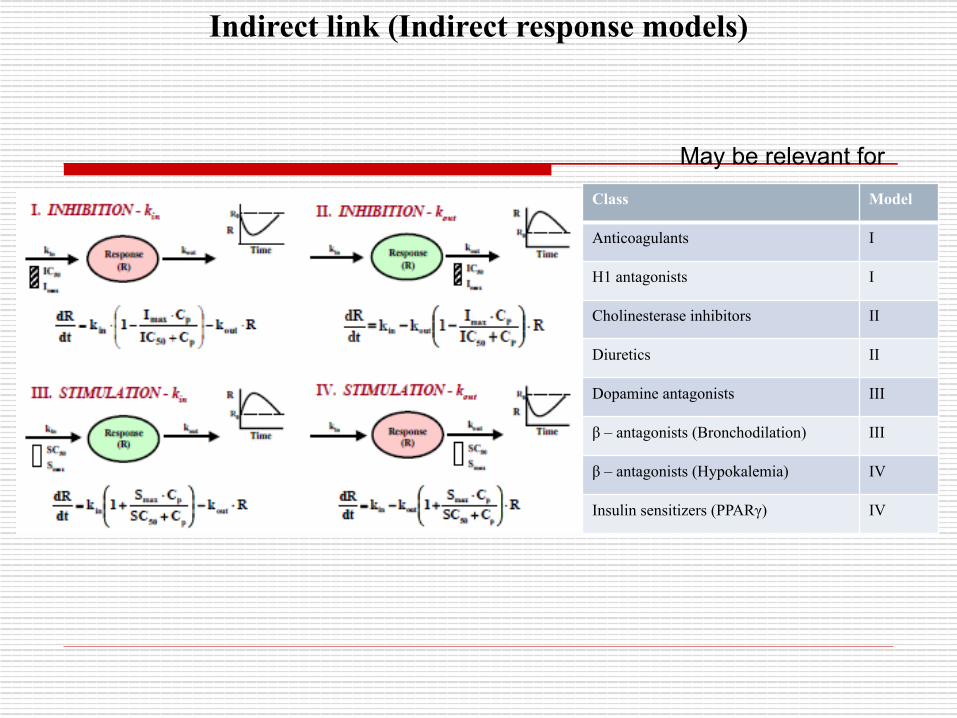
Class Model
Anticoagulants I
H1 antagonists I
Cholinesterase inhibitors II
Diuretics II
Dopamine antagonists III
β – antagonists (Bronchodilation) III
β – antagonists (Hypokalemia) IV
Insulin sensitizers (PPARγ) IV
Indirect link (Indirect response models)
May be relevant for
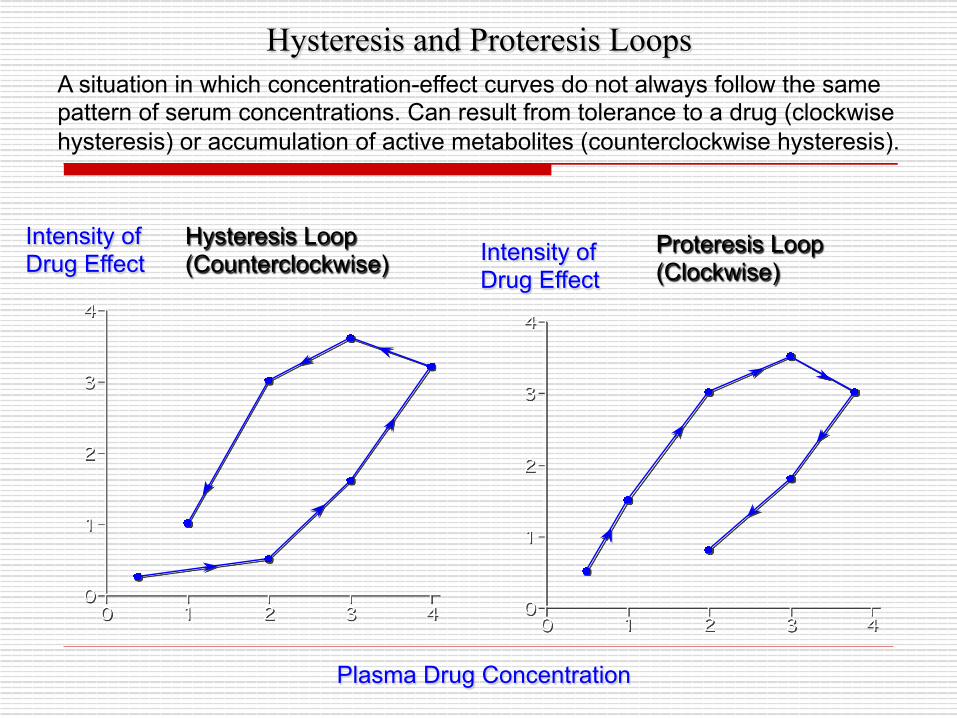
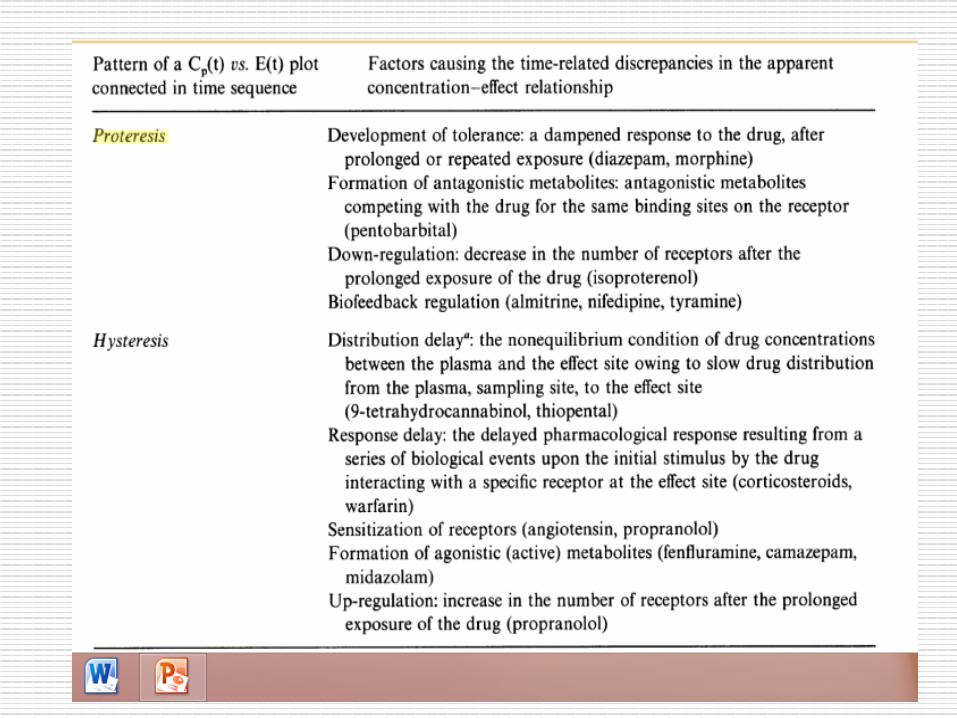
Hysteresis and Proteresis Loops
0
1
2
3
4
0 1 2 3 4
Plasma Drug Concentration
Intensity of Drug Effect Intensity of
Drug Effect
Hysteresis Loop (Counterclockwise)
Proteresis Loop (Clockwise)
0
1
2
3
4
0 1 2 3 4
A situation in which concentration-effect curves do not always follow the same pattern of serum concentrations. Can result from tolerance to a drug (clockwise hysteresis) or accumulation of active metabolites (counterclockwise hysteresis).
115
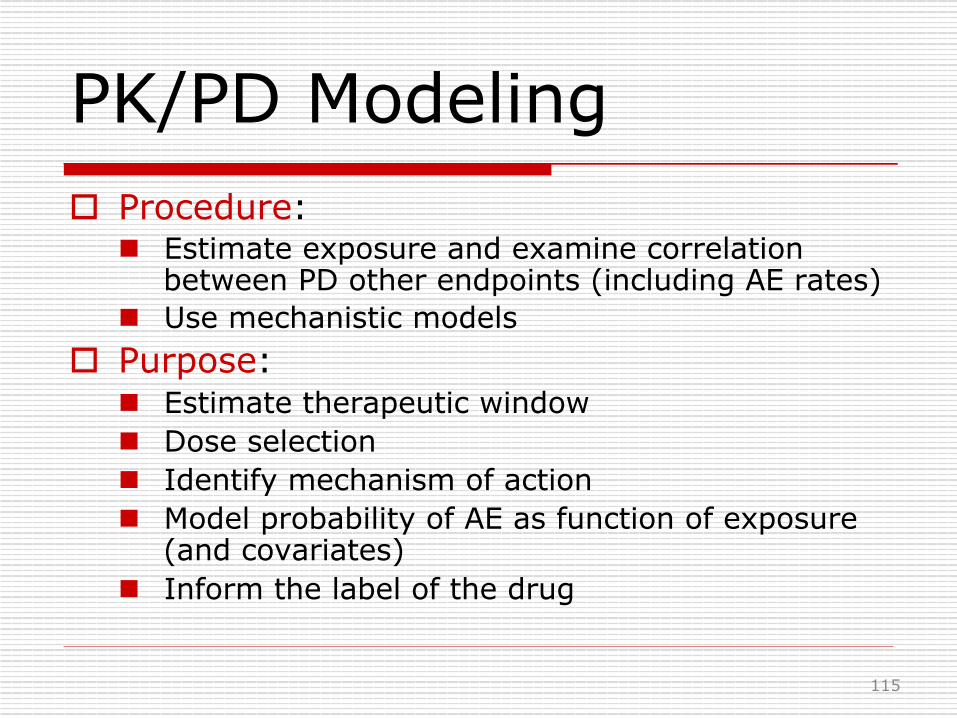
PK/PD Modeling o Procedure:
n Estimate exposure and examine correlation between PD other endpoints (including AE rates)
n Use mechanistic models o Purpose:
n Estimate therapeutic window n Dose selection n Identify mechanism of action n Model probability of AE as function of exposure
(and covariates) n Inform the label of the drug
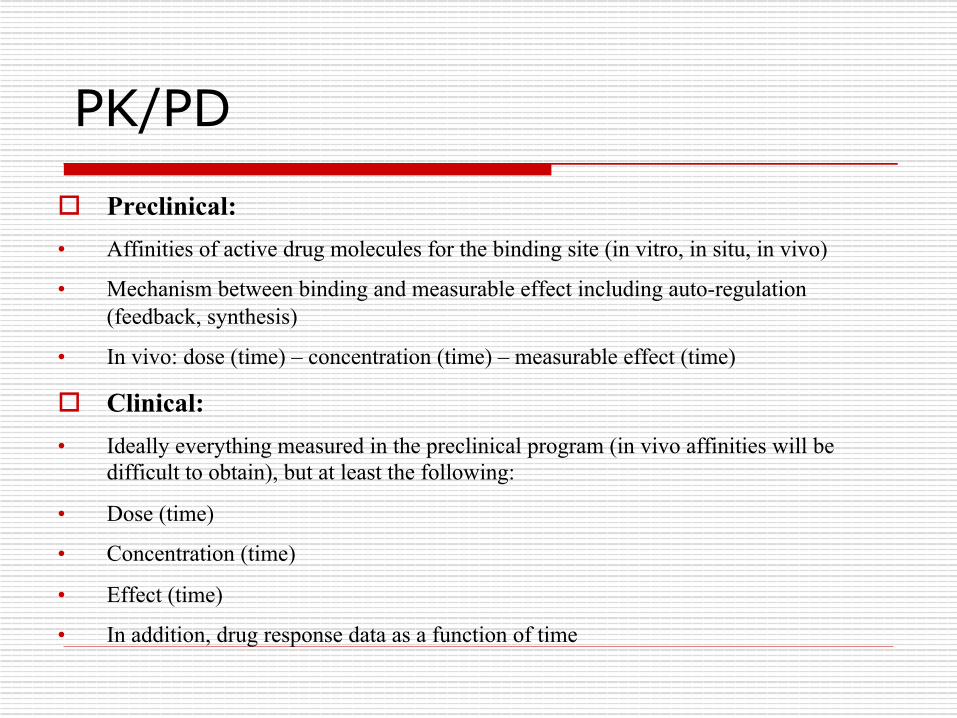
PK/PD
o Preclinical: • Affinities of active drug molecules for the binding site (in vitro, in situ, in vivo)
• Mechanism between binding and measurable effect including auto-regulation (feedback, synthesis)
• In vivo: dose (time) – concentration (time) – measurable effect (time)
o Clinical: • Ideally everything measured in the preclinical program (in vivo affinities will be
difficult to obtain), but at least the following:
• Dose (time)
• Concentration (time)
• Effect (time)
• In addition, drug response data as a function of time
PK/PD
o Pharmacokinetic-Pharmacodynamic (PK/PD) modeling - Scientific mathematical tool which integrates relationship with PK model (describing the relationship between dose, systemic drug concentrations, and time) to that of PD model (describing the relationship between systemic drug concentration and the effect vs time profile) and a statistical model (particularly, the intra- and inter-individual variability of PK and/or PD origin)
o PK/PD-modeling establish and evaluate dose-concentration-response
relationships and subsequently describe and predict the effect-time courses resulting from a drug dose.
o Applications of PK/PD have been extended to virtually all phases of drug development, which has resulted in the current Guidance for Industry on Exposure-Response Relationships: Study Design, Data Analysis, and Regulatory Applications from the Food and Drug Administration
Process of PK/PD Modeling o Build a PK model o Build a PD model o Link PKPD models o Simulate treatment regimens or trials
for useful predictions
Reference Text
o Clinical Pharmacokinetics, 3rd Edition, M. Rowland, T.N. Tozer, Lippincott Williams, and Williams, Philadelphia, 1994
o Pharmacokinetics, 2nd Revised and Expanded Edition, M. Gibaldi and D.Perrier, Marcel and DekkerInc., New York, USA 1982
o PK/PD Data Analysis: Concepts and Applications, 4th Edition, Johan Grabrielson and Dan Weiner
Thank You o PhUSE o PhUSE organizing team o Quintiles o Attendees

Demonstration of Phoenix® WinNonlin ®
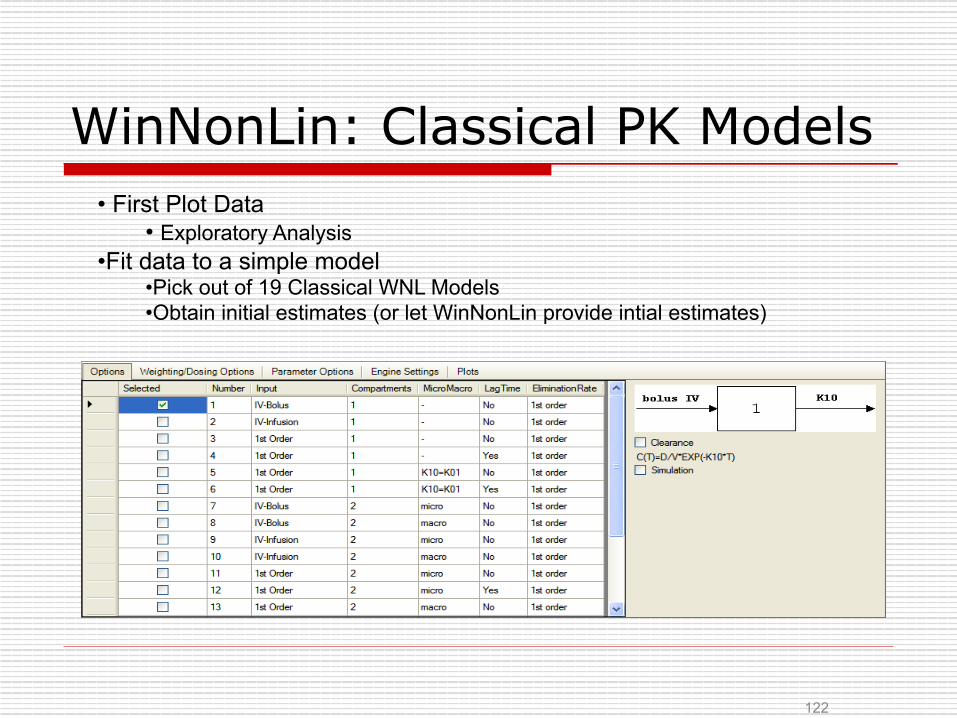
WinNonLin: Classical PK Models
122
• First Plot Data • Exploratory Analysis
• Fit data to a simple model • Pick out of 19 Classical WNL Models • Obtain initial estimates (or let WinNonLin provide intial estimates)
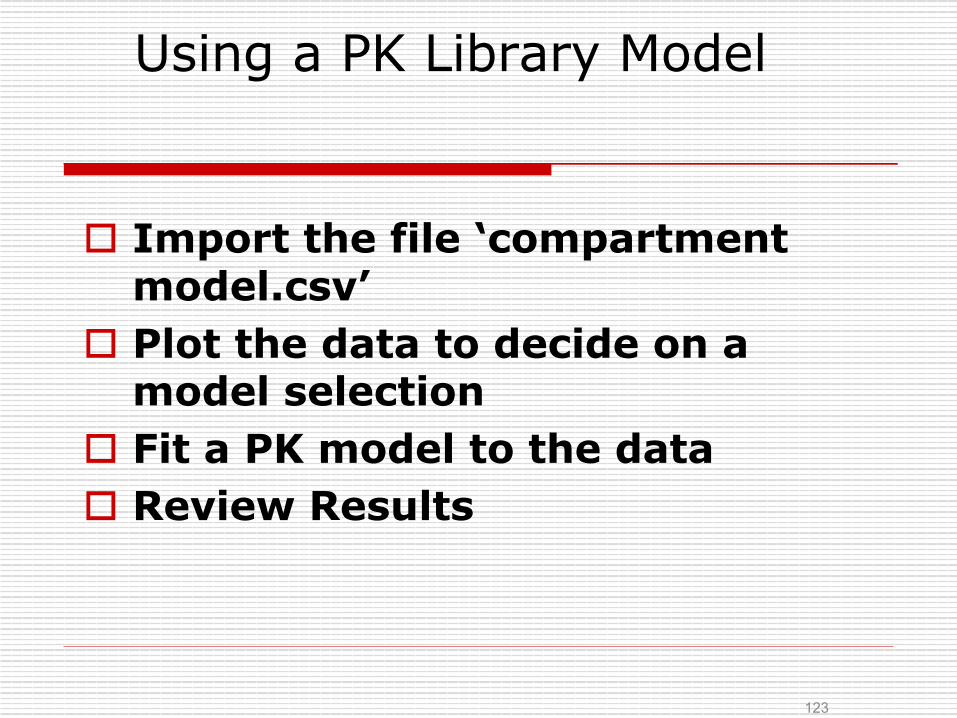
Using a PK Library Model
o Import the file ‘compartment model.csv’
o Plot the data to decide on a model selection
o Fit a PK model to the data o Review Results
123
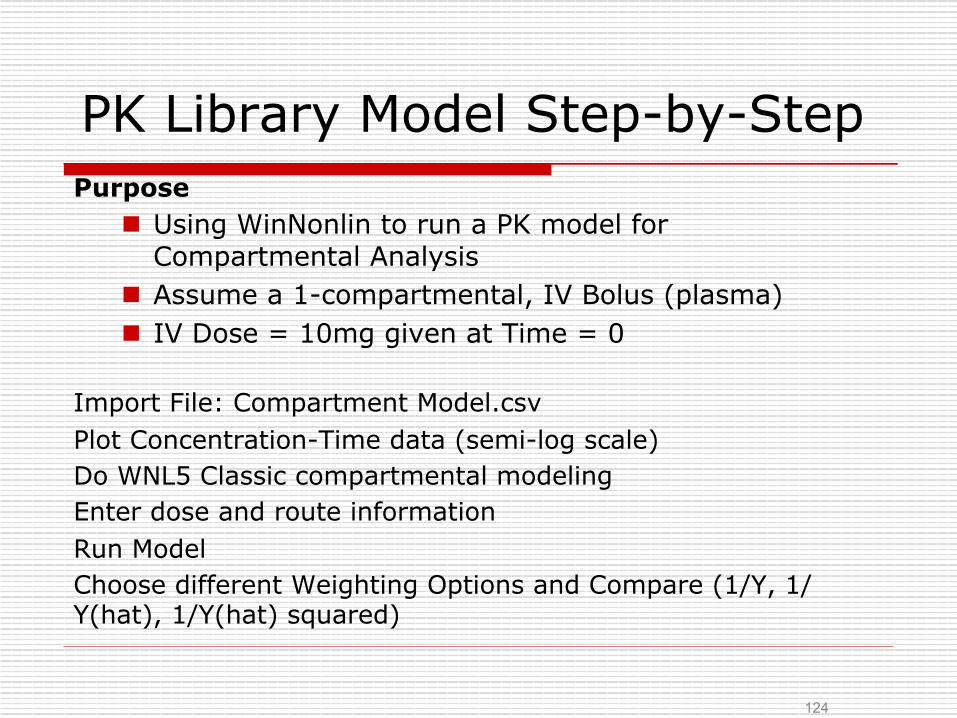
PK Library Model Step-by-Step Purpose
n Using WinNonlin to run a PK model for Compartmental Analysis
n Assume a 1-compartmental, IV Bolus (plasma) n IV Dose = 10mg given at Time = 0
Import File: Compartment Model.csv Plot Concentration-Time data (semi-log scale) Do WNL5 Classic compartmental modeling Enter dose and route information Run Model Choose different Weighting Options and Compare (1/Y, 1/Y(hat), 1/Y(hat) squared)
124
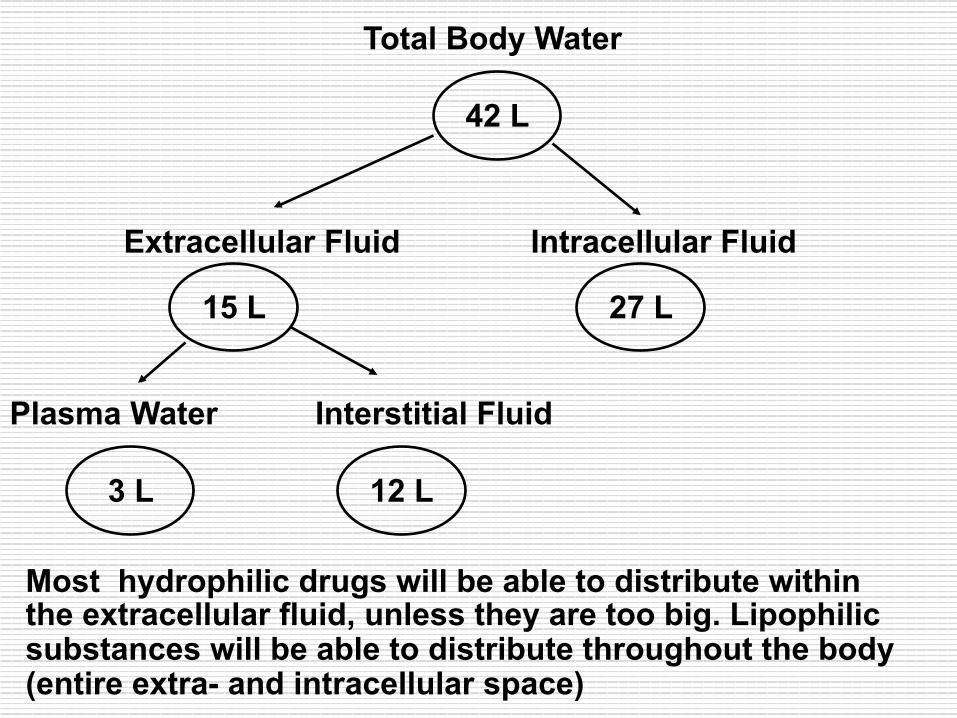
Total Body Water
42 L
Extracellular Fluid Intracellular Fluid
15 L 27 L
Plasma Water
3 L
Interstitial Fluid
12 L
Most hydrophilic drugs will be able to distribute within the extracellular fluid, unless they are too big. Lipophilic substances will be able to distribute throughout the body (entire extra- and intracellular space)
PK-PD

What happens? Filtration (Blood flow:1.1 L/min)
Filter No large molecules are filtered For drugs with molecular weight larger than 20,000, filtration falls off sharply. Proteins with MW of 60,000 are not filtered at all.
About 10 % of plasma (130 ml/min) is being filtered. This includes solutes. H2O
H2O H2O
H2O H2O
H2O
Drug Molecule
Macromolecule