pishtaz teb diagnostics - iacld.ir
TRANSCRIPT

PISHTAZ TEB DIAGNOSTICS
QUALITY ASSURANCE IN ELISAIN ELISADR. ALI MIRJALILIJ

CONTENTS
• Definitions• Quality assurance cycle • Pre‐analytical Errors and interference• Analytical Errors and Good ELISA Practice Testy• Verification, IQC and EQC

Path of WorkflowPath of WorkflowTHE PATIENT Test selection Sample Collection
Sample Transport
Preexamination Phase
Laboratory AnalysisLaboratory Analysis Examination Phase
Report CreationReport Transport
Result Interpretation Postexamination Phase
3

DEFINITIONS
• Quality Control QC refers to operational techniques that
DEFINITIONS
• Quality Control ‐QC refers to operational techniques that must be included during each assay run to verify that the requirements for Quality are met with
• Quality Assurance ‐ QA refers to all those planned and systematic activities to provide confidence that the results given out by the laboratory are correctgiven out by the laboratory are correct
• The aim of QC is simply to ensure that the results generated by the test are correct. However quality assurance is concerned with much more: that the right test is carried out on the right specimen and that the right result and right interpretation is delivered to the right person at the rightinterpretation is delivered to the right person at the right time

++++
QUALITY ASSURANCEQUALITY ASSURANCE5

DEFINITIONS (cont.)
• Evaluation is the determination of the analytical performance
DEFINITIONS (cont.)
• Evaluation is the determination of the analytical performance characteristics of a new method.
• Validation is confirmation by examination and provision of objective• Validation is confirmation by examination and provision of objective evidence that the particular requirements for a specific intended use can be consistently fulfilled.
• Verification is confirmation by examination of objective evidence that specified requirements have been fulfilled.

The Quality Assurance Cycle
P ti t/Cli t P
•Data and Lab
Patient/Client PrepSample Collection
ReportingPersonnel Competency
Test Evaluations•Data and Lab
Management•Safety
•Customer Service Sample ReceiptService Sample Receipt
and Accessioning
Record
Sample TransportQuality Control
Testing
Keepingpre‐examination processespreanalytical phase processes that start, in chronological order, from the clinician's request and include the examination request, preparation and identification of the patient, collection f th i l ( ) d t t ti t d ithi th l b t d d h th
7
of the primary sample(s), and transportation to and within the laboratory, and end when the analytical examination begins

PREANALYTICAL PHASE
Between 32 and 75% ofBetween 32 and 75% of all test errors occur in
the preanalytical phasethe preanalytical phase.

PREANALYTICAL PHASEIncluded all process from the time a
laboratory request is made by alaboratory request is made by a physician until the sample is ready
for testing
Errors that occur at this stage often become apparent later in the
analytical and post analytical phase.

The Quality Assurance CycleBefore specimen collectionBefore specimen collection
1. Inappropriate test requested or correct test
Patient/Client PrepSample Collection
not ordered2. Inadequate collection of
patient information
Exercise
Personnel Competency
Test Evaluations
Sample Receipt and Accessioning
Sample Transport
10

The Quality Assurance CycleBefore specimen collectionBefore specimen collection
1. Inappropriate test requested or correct test
Patient/Client PrepSample Collection
not ordered2. Inadequate collection of
patient information
Smoking
Alcohol
11

The Quality Assurance CycleBefore specimen collection
1. Inappropriate test requested or correct test
Before specimen collection
Patient/Client PrepSample Collection
qnot ordered
2. Inadequate collection of patient information
3 Inadequate patient After four weeks3. Inadequate patient preparation
After four weeks starvation
12

The Quality Assurance CycleBefore specimen collectionBefore specimen collection
GH / PRL / Cortisol / Renin
T f iTransferinFerritin
Thyroid Hormones
Insulin / Gastrin /Calcitonin
Cortisol / T4 /Drug
Renin, Cortisol, thyroxine and drugs

The Quality Assurance CycleBefore specimen collectionBefore specimen collection

The Quality Assurance CycleBefore specimen collection
1. Inappropriate test requested or correct test
Before specimen collectionPatient/Client PrepSample Collection
requested or correct test not ordered
2. Inadequate collection of patient information
3. Inadequate patient preparation
4. Patient identification error
Primary samples that are not adequately identified should not be accepted or processed by the lab exception
15
exceptionirreplaceable or critical samples such as CSF,Biopsy

The Quality Assurance CycleSpecimen collection
• Selecting the Site
Specimen collection• Selecting the Site• Site Preparation• Tourniquet Application and Time• Proper Venipuncture Techniquep p q• Order of Draw• Proper Tube Mixing• Proper Tube Mixing• Correct Specimen Volume

The Quality Assurance CycleSpecimen collection
• Plastic tube vs Glass tube
Specimen collection• Plastic tube vs Glass tube
– But some low‐molecular weight organic substances released by plastic tubes could interfere in some assays.(Physical masking of Ag‐Ab by lipids and silicon oils of some plastic containers)oils of some plastic containers)
– ACTH readily absorbed onto glass
• The water-soluble silicone polymer coating the p y ginterior of serum separator tubes – Interfere negatively with avidin‐biotin binding in an IRMA for thyrotropin,
l i d hCG (Wi k l 1992)prolactin, and hCG (Wickus et al, 1992). – Conversely, silicone formed a complex with C‐reactive protein (CRP) that
enhanced the Ag‐Ab reaction in the Vitros CRP assay resulting in falsely elevated results (Chang et al 2003)elevated results (Chang et al., 2003).

The Quality Assurance CycleSpecimen collection
S l t Bl d
Specimen collectionSample type: BloodMany analytes are stable a period of time when store in whole blood Inhibin A level decline significantly even when store for short periodInhibin A level decline significantly even when store for short period in whole blood due to erythrocyte catalase interfrerence in certain
enzyme based assay.Homocyctein is unstable in whole blood and must separated and frozen within 1 hrLow molecular mass polypeptide hormones such asLow molecular mass polypeptide hormones such as ACTH,Glucagon,Gasterin rapidly destroyed by enzyme present in blood

The Quality Assurance CycleSpecimen collection
• Sample type: Serum
Specimen collection• Sample type: Serum
• matrix of choice for all immunoassay. except PTH ,degrades significantly in serum compared to EDTA plasma
• Sample type: Gel tubesDecreaseDecrease
Anticonvulsants(phenobarbital , phenytoin, carbamazepin)PTH Progesteroneg
Increase CRP in certain method on slide

The Quality Assurance CycleSpecimen collectionSpecimen collection

The Quality Assurance CycleSpecimen collectionSpecimen collection
Sample type: Plasma• Plasma can be a very useful alternative, as it
eliminates the extra time needed for clotting, thereby reducing the overall pre-analytical y g p ytime
• EDTA chelates metallic ions that are part of label (europium in DELFIA assays)
• Part of the detection system ALP labelled Antibody inhibited by EDTA

The Quality Assurance CycleSpecimen collectionSpecimen collectionOrder of draw:Order of draw:
• The recommended order to fill being plain tube citrate lithium heparinplain tube, citrate, lithium heparin, EDTA and finally fluoride/potassium oxalate.oxalate.
• Care must still be taken to avoid cross‐contamination between different additive tubes (Wilde, 2005)

Invalid specimensEndogenous Interference
Li i
Endogenous Interference
LipemiaFat soluble compounds like steroidsTurbidimetic assays FFA in FT4Turbidimetic assays, FFA in FT4
Hemolysisrelease of proteolytic enzyme and destroyedrelease of proteolytic enzyme and destroyed peptide Insulin,Glucagon,PTH,ACTH,GastrinRelease of Analyte from RBC FolateRelease of Analyte from RBC Folate
IcterMinimal interference but some reference indicateMinimal interference but some reference indicate interference.

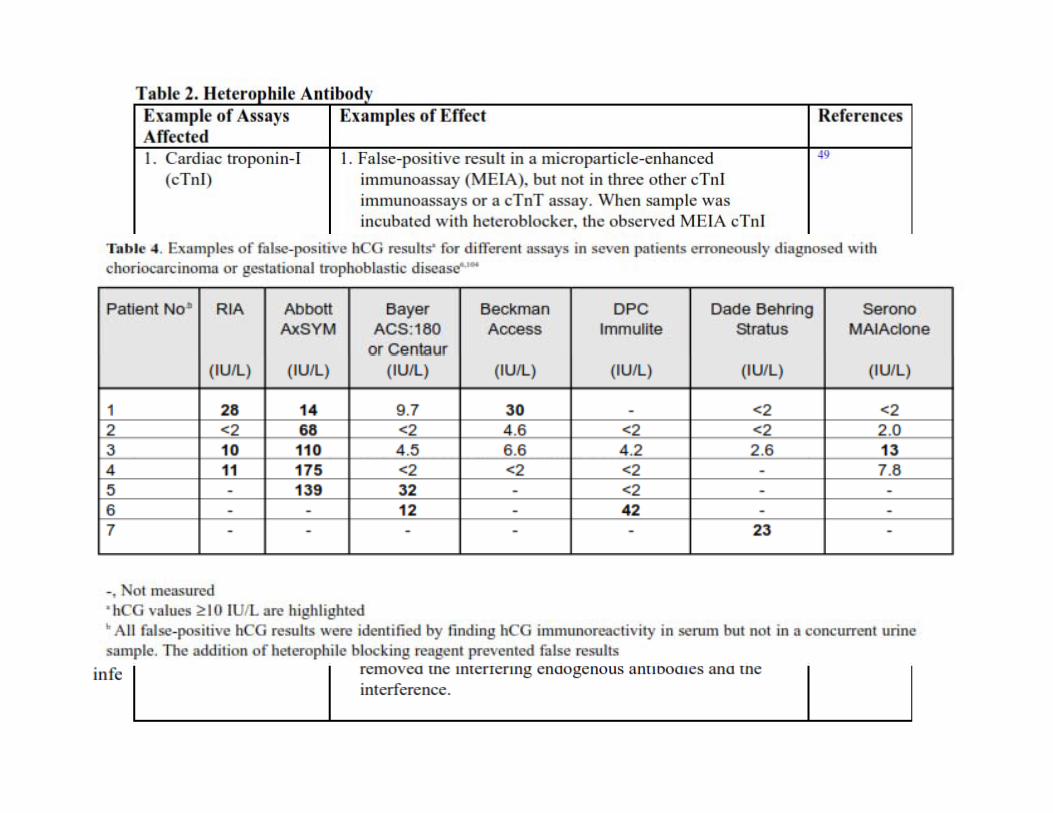
Invalid specimensEndogenous InterferenceEndogenous Interference1 Cross reacting substances1. Cross-reacting substances
The specificity of any immunoassay is primarily determinedby the specificity of the antibodies used and the assay format
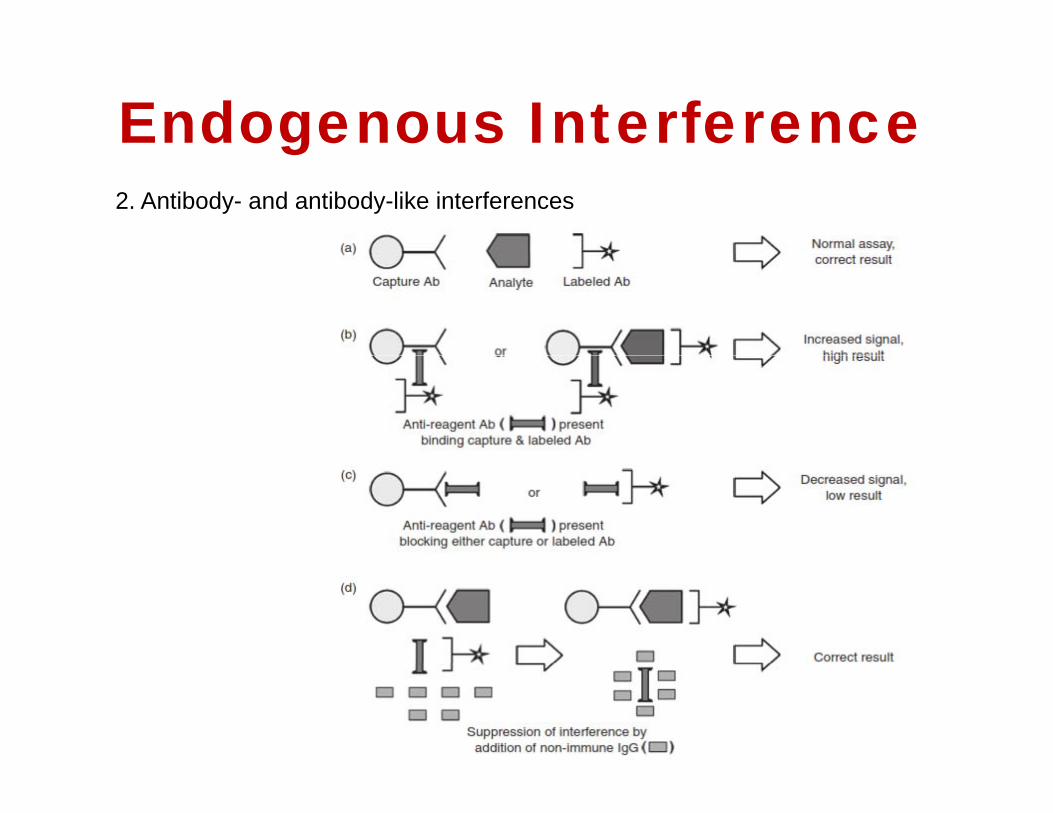
Endogenous Interferenceg2. Antibody- and antibody-like interferences

Endogenous Interferenceg2. Origins of Interfering antibodies
CLSI ILA30ACLSI-ILA30A

Endogenous Interferenceg
CLSI ILA30A2. Origins of Interfering antibodies
CLSI-ILA30A

Endogenous Interferenceg2. Origins of Interfering antibodies
CLSI-ILA30A
Anti-prolactin autoantibodies can be present in serum in the form of macroprolactin (macroPRL).
Endogenous Interferenceg2. Origins of Interfering antibodies
CLSI-ILA30A

Other interfering agentsOther interfering agentsAlbumin: High concentration can bind and release ligands
Complement: Binds to Fc fragment, blocking sites. Especially with fresh serum. Eliminate with EDTA
Lysozyme: Strongly binds to protein with low PI. Can forma bridge with soild phase IgG and the signal Ab.

Other interfering agentsOther interfering agents• Interference with detection systems
• Endogenous signal‐generating substances1. Diagnostic or therapeutic administration of radioisotopes2 Endogenous fluorescent substances fluorescent drugs or fluorescein2. Endogenous fluorescent substances, fluorescent drugs or fluorescein
administration for the performance of retinal angiography
• Enzyme inhibitors/activators1. Antibodies that cross react with horse‐radish peroxidase or alkaline phosphatase2. Azide present as preservative in some control sera may lead to suppression of enzyme
activity in assays using peroxidase as label. 3 Sodium fluoride may be unsuitable for some enzymatic immunoassay methods3. Sodium fluoride may be unsuitable for some enzymatic immunoassay methods
• Enzyme catalysts or cofactors1. Enzyme‐immunoassays can be affected by enzyme catalysts or cofactors, for example Cu2+
i i i l i l h il i i h fcontamination promoting luminol chemiluminescence in the presence of H2O2.

High Dose Hook EffectHigh Dose Hook Effect
• Two‐site immunometricTwo site immunometric assays, sample and capture antibody arecapture antibody are added simultaneously
• Example AFP CA125• Example AFP, CA125, CEA, hCG, PSA, prolactin andprolactin and thyroglobulin

Diagnosis of InterferenceDiagnosis of Interference

Analytical Errors, Good ELISA Practice

Five M of Quality
FACILITY (E i t)
Machine
FACILITY (Environment)
Qualifications, Organization, Job description
Qualification, CalibrationP P
description, Training, etc.
Material/Sample
Prea
ost-
Man
Manual
p
Storage
L b l
ana
-anaco
mE
B.C
OM Methodology Label
Motivation SOP, Mfr B h
lytic
alytem
egal
lery
.cIS
HTA
ZT
E Bruchure
cal
icalAnalytical
ww
w.t
he
WW
W.P
I a yt ca(Examination Phase)

Good ELISA Practice

ELISA Equipment :Mi l R dMicroplate Reader
INSTALLATION REQUIREMENTSINSTALLATION REQUIREMENTS1. A clean, dust free environment.2. A stable work table away from equipment that vibrates(centrifuges, agitators). 3. An electrical supply source, which complies with thecountry’s norms and standards.
• Calibration• Calibration• Executed by a technician or trained engineer• Following the instructions provided by each manufacturer.• It is necessary to have a set of grey filters mounted on a plate of equal geometric size• Calibration plates are equipped with at least three pre‐established
Optic density values within the measurementranges; low, medium, and high value.

Grey FilterGrey Filter

Calibration of the microplate reader
1. Place the calibration plate on the equipment.2 Carry out a complete reading with the calibration plate
4. If the instrument does not have a calibration plate, verifyit by placing a coloured solution in the wells of a plate2. Carry out a complete reading with the calibration plate.
Verify if there are differences in the readings obtainedfrom well to well. If this is the case, invert the plate (180°)and repeat the reading to rule out that differences areattributed to the plate itself. In general, it is accepted
it by placing a coloured solution in the wells of a plateand immediately carry out a complete reading. Theninvert the plate 180° and read the plate again. If bothreadings display identical, average values in each row,the reader is calibrated.
that the instrument does not need further calibration ifthe plate results are as expected at two wavelengths.3. Verify if the reader requires calibration. If so, proceedwith the calibration following the routine outlined bythe manufacturer verifying that the reading’s linearity
5. Verify that the reader is calibrated, column by column.Place a clean, empty plate and carry out a reading. Ifthere is no difference between each of the averagereading of the first to the last column, it can be assumedthat the reader is calibratedthe manufacturer, verifying that the reading’s linearity
is maintained as rigorously as possible.that the reader is calibrated.
ELISA Ch kELISA Check

Basic maintenanceBasic maintenanceFrequency: Daily1 R i h i l f h h l l1. Review that optical sensors of each channel are clean.If dirt is detected, clean the surface of the windows ofthe light emitters and the sensors with a small brush.2. Confirm that the lighting system is clean.3. Verify that the reader’s calibration is adequate. Whenthe daily operations begin, let the reader warm up for30 minutes. Next, do a blank reading and then read afull plate of substrate. The readings must be identical.If not, invert the plate and repeat the reading in orderto determine if the deviation originated in the plate orthe reader.4. Examine the automatic drawer sliding system. It mustg ybe smooth and constant.

Preventive maintenancePreventive maintenanceFrequency: Quarterly1 V if h bili f h l U h lib i l1. Verify the stability of the lamp. Use the calibration plate,conducting readings with intervals of 30 minutes withthe same plate. Compare readings. There must be nodifferences.2. Clean the detectors’ optical systems and the lightingsystems.3. Clean the plate drawer.4. Verify the alignment of each well with the light emissionand detection systems.

Microplate WasherELISA Equipment :Microplate Washer
• INSTALLATION REQUIREMENTS 1. A clean, dust‐free environment. 2. A stable work table located away from equipment
that generates vibrations (centrifuges and agitators)that generates vibrations, (centrifuges, and agitators). 3. An electric outlet in good condition with a ground pole.

Microplate Washer Performance fVerification
• Washing process verification To Tetramethylbenzidine/Hydrogen verify that the washing process is done according to the specifications of ELISA
h i
Peroxide). Whatever conjugate remains will hydrolyze the enzyme and the chromogen will h bl ftechniques
• One of the controls is based on using the peroxidase reagent, hi h i di d i
change to blue. After stopping the reaction with acid, the TMB will turn yellow again. The resulting colour intensity iswhich is dispensed using a
pipette in the plate wells to be read at 405, 450 and 492 nm. At once the wells are washed and a
resulting colour intensity is directly related to the washing process efficiency.
once the wells are washed and a colourless substrate is added (TMB/H2O2)
ELISA Check

Microplate Washer MaintenanceMicroplate Washer MaintenanceBasic maintenance Frequency: Daily 6. Verify that the body of the washer 1. Verify the volume distributed. 2. Test the filling uniformity. 3 Verify the aspiration sub‐system’s
has been cleaned. If necessary, clean the exterior surfaces with a piece of cloth, moistened with a mild d3. Verify the aspiration sub system s
efficiency. 4. Confirm the cleaning of the supply and extraction needles
detergent.
and extraction needles.5. Clean the washer with distilled water after use, to remove every vestige of salt in the supply andevery vestige of salt in the supply and extraction subsystems’ channels. The needles may be kept submerged in distilled waterdistilled water.

Microplate Washer Preventive Maintenance
• Preventive maintenance the subsystems. Calibrate according to Frequency: Quarterly
1. Disassemble and clean the channels and connectors.
the manufacturer’s recommendations. 4. Confirm the integrity of the electrical connector and the inter‐connection
Verify their integrity. If leaks or any vestiges of corrosion are detected, adjust and/or replace.
cable.5. Clean the washer with distilled water after using it in order to remove every
2. Verify the integrity of the mechanical components. Lubricate according to the manufacturer’s instructions.
vestige of salt in the supply and extraction subsystems’ channels. 6. Verify the integrity of the fuse, and
3. Test the adjustment of each one of that its contact points are clean.

Pipettes and Best pipetting practice
Manual single
channel
Manual multi-
channel
Electronic single
channel
Electronic multi-
channel

Ways to optimize pipette performance
• Choose the right pipette for the job.• Check for leaks or any other pipette malfunctionsy p p• Choose the correct pipette tip
– Correct sizeCorrect style– Correct style
• Have pipettes calibrated and serviced regularly.• Allow all liquids and equipment to equilibrate to ambient temperature
b f b i i kbefore beginning work.• Pre‐rinse the pipette tip by aspirating and dispensing the sample liquid
at least 3 times before aspirating a sample for delivery.• Immerse the tip vertically into the sample liquid well clear of the
container walls and bottom and at a depth of approximately 2 – 5mm below the meniscus.

Tips to minimize pipetting errors• Aspirate using a consistent speed, rhythm, and plunger
pressure.H ld th ti i th l f 1 d ft i ti d• Hold the tip in the sample for 1 second after aspiration and withdraw the tip slowly and smoothly
• To dispense touch the pipette tip to the sidewall of the p p p pcontainer where sample is to be delivered just above the liquid the sample is being dispensed into. Use consistent speed rhythm and plunger pressure to dispensespeed, rhythm, and plunger pressure to dispense.
• Put the pipette in it’s stand between pipetting cycles to avoid warming the pipette in your hand – this can affect the volume of liquid dispensed.
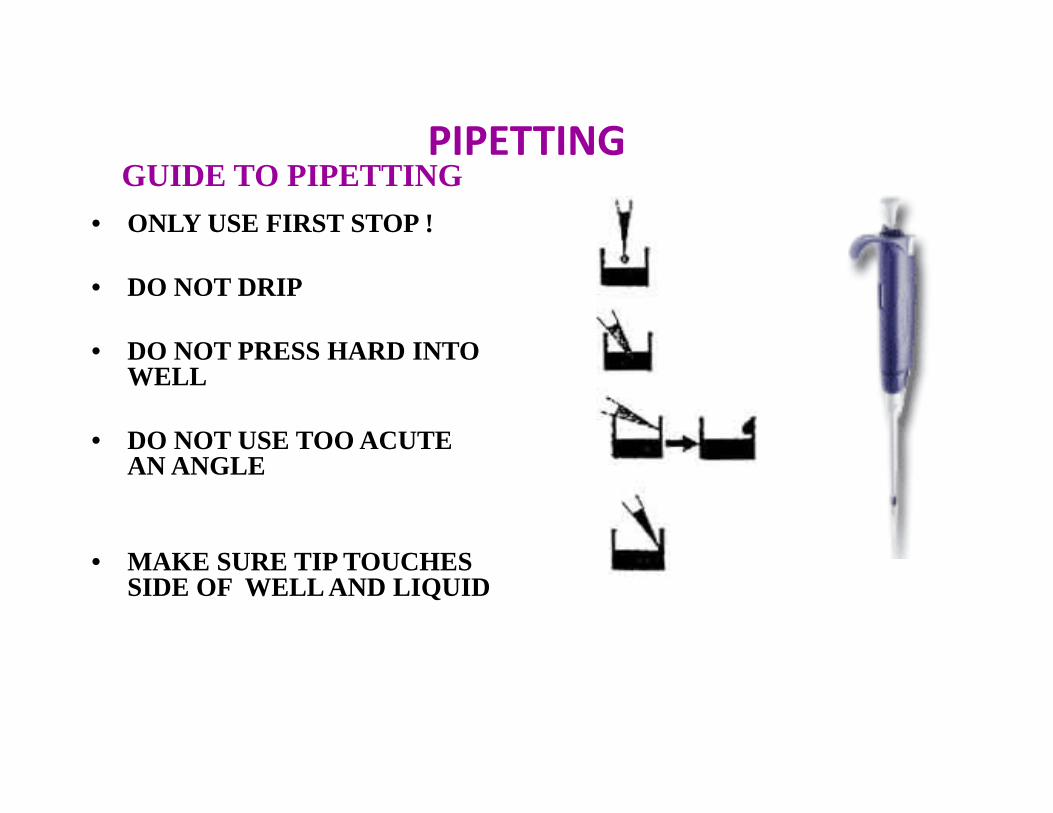
PIPETTINGPIPETTINGGUIDE TO PIPETTING
• ONLY USE FIRST STOP !
• DO NOT DRIP
• DO NOT PRESS HARD INTODO NOT PRESS HARD INTO WELL
• DO NOT USE TOO ACUTE AN ANGLEAN ANGLE
• MAKE SURE TIP TOUCHES• MAKE SURE TIP TOUCHES SIDE OF WELL AND LIQUID

Pipetting tipsPipetting tips
• Forward Pipetting technique
• Reverse Pipetting technique q
• q
•
• Highly viscous fluid• Avoid foaming

Pipette calibrationPipette calibration
• GravimetricGravimetric• Colourimetric

Pipette Calibration ConsiderationsPipette Calibration Considerations• All pipettes must be tested when first purchased, following any
major service and once annually by analyzing ten replicates. • All pipettes must be tested quarterly by analyzing four replicates.
Replicate analyses must meet acceptance criteria or use of the pipette should be discontinued until the problem has been p p pcorrected.
• Inaccuracy [(Corr. Mean ‐ true value) ÷ true value × 100] must be less than 2%less than 2%
• No single replicate may be greater than 2% from the true value. • %CV (Standard Deviation ÷ Corr. Mean × 100) must be less than
1.00 • Three different volumes are tested; 10% of maximum volume,
mid volume and maximum volume.mid volume and maximum volume.

Good ELISA Practice B f R i th t tBefore Running the test
Equipment Documentation

Good ELISA Practice B f R i th t tBefore Running the test

Good ELISA Practice R i th t tRunning the test
• Direct pipetting for samplesDirect pipetting for samples• Reverse pipetting for reagentsCh k d f l lib l• Check order of samples, calibrators, controls, etc.,

Good ELISA Practice Running the test, Running the test,
Incubation
NONONONO

Good ELISA Practice R i th t t W hiRunning the test, Washing
Ensure about standard laboratory water used for washing working solution preparation
Ensure about stability of washing solution (MFQ bruchure)

Good ELISA Practice R i th t t W hiRunning the test, Washing

Good ELISA Practice Running the test Conjugate substrate and stop
HOW TO TREAT WITH THE REAGENTS?7
test, Conjugate, substrate and stop
HOW TO TREAT WITH THE REAGENTS?-7
Use reservoir for eachUse reservoir for each reagent
Label the reservoirLabel the reservoir

Don’t use the same reservoir for multiple
regents
Don’t return the reagents to the stock

Good ELISA Practice, Reading and calculationcalculation
Don’t forget to use right filter
Don’t forget to use blank reading
Don’t forget to check plate back cleaningg p g
Don’t forget to use correct formula for calculation based on mfq claim

Good ELISA Practice, Check COA

Good ELISA Practice, Check Standard curveStandard curve

KIT VERIFICATION KIT VERIFICATION

5.5.1.2 Verification of examination proceduresThe laboratory shall document the procedure used for the verification and record the res lts obtainedrecord the results obtained.
St ff ith th i t th it h llStaff with the appropriate authority shall review the verification results and record the review
com
the review.
emeg
alle
ry.c
ww
w.t
he

HOW WE HOW WE SHOULD VERIFY SHOULD VERIFY OUR KIT?OUR KIT?

CLIA REGULATION 493 1253(2)493.1253(2)
1. Precision1. Precision2. Accuracy3. Reportable range3. Reportable range 4. Reference interval 5 Analytical sensitivity5. Analytical sensitivity 6. Analytical specificity 7 Other specifications Determine the assay7. Other specifications Determine the assay
performs in your hands the way the manufacturer says it performs y p

VERIFYING TEST PERFORMANCE IN YOUR LABPERFORMANCE IN YOUR LAB
• Accuracy: can the test produce the correctresult?• Reproducibility/precision: can it do thisconsistently?consistently?• Reference range/reportable range: was themanufacturer’s range established with apopulation similar to ours?• Calibration plan: what does the manufacturerrecommend, and can we do this?recommend, and can we do this?• QC plan: how do we detect clinically significanterrors when they occur?

PRECISION STUDIES: WITHIN RUN PRECISION WITHIN-RUN PRECISION
– Patient or QC samples assayed 20 times on the same day within the same runthe same day within the same run
– If precision poor, no need to do further eval
S l t l t 2 3 l l di l• Samples at least 2 - 3 levels – medical decision points

BETWEEN-RUN PRECISION PRECISION
– Patient or QC samples once per day for 5-20Patient or QC samples once per day for 5 20 days
– Establish qc range as well as total precision q g p
• Samples at least 2 - 3 levels – medical• Samples at least 2 - 3 levels – medical decision points

DATA ON IMPRECISIONDATA ON IMPRECISION
Mean SD CV %Mean SD CV, % • Within run (n = 20 replicates)
I 50 4 (2 8) 1 4 (0 08) 2 8• I 50.4 (2.8) 1.4 (0.08) 2.8 • II 200.6 (11.14) 2.7 (0.15) 1.4 • Between run (n = 20 runs) • I 51 2 (2 84) 2 1 (0 12) 4 1I 51.2 (2.84) 2.1 (0.12) 4.1 • II 202.3 (11.24) 3.5 (0.19) 1.7

WHAT’S GOOD PRECISION?PRECISION?
– Depends on the analyzer and the analyte <5% CV considered good , Neonatal Screening <20%CV considered good , Neonatal Screening 20%
– Many automated analyzers (blood gases) < 1% CV

ACCURACY –CORRELATION ACCURACY CORRELATION
• Comparison of Methods – correlation SelectComparison of Methods correlation Select a minimum of 20 (usually 40 – 60) patient’s serum samples with analyte values as evenly p y ydistributed throughout the linear reportable range of the assay as possible p g y p
• Assay all samples by the current method (comparative or reference method – x-axis ( pdata) and the method being evaluated (test method – y-axis data)

CORRELATION EXPERIMENT EXPERIMENT
• Plot (x,y) pairs of values and apply appropriate regression analysis to these data
Obtain linear regression equation of the line– Obtain linear regression equation of the line (least squares line) Assumption: Any errors are in the test method (TM) and not the comparative method (CM)(CM)
• Deming Regression – assigns errors to both methods depending on their variancesmethods depending on their variances
• Slope, intercept, correlation coefficient, standard error of the estimate, bias plot p

ACCURACY EXAMPLEACCURACY EXAMPLE


Answer: CLSI Standard

Aim of this standardAim of this standard
P id i i i l t ti t l• Provide minimum implementation protocol to verify that a particular example of
t d i ti imeasurement procedure is operating in accordance with the manufacturer claims For precision and trueness

Overview of the protocolOverview of the protocol
• Precision evaluation experimentPrecision evaluation experiment– Repeatability, Reproducibility
Trueness evaluation experiment• Trueness evaluation experiment– Comparability (20 serum samples)
f f f– Recovery of expected values from certified reference materials

Precision Evaluation ExperimentExperimentExample

Trueness Evaluation Experiment Example

Reportable range
• Validation of Reportable Range Minimum of 3 test p gspecimens (4-5 better), measured in duplicate or triplicate A i t t i• Appropriate matrix
• Well established target concentrations • Concentrations near the low midpoint and high values• Concentrations near the low, midpoint, and high values
of the AMR

ANALYTICAL MEASUREMENT RANGE MEASUREMENT RANGE
(AMR)

Maximum Dilution Concentration


Practical ExamplePractical Example
ELISA Kit VerificationReference :The Immunoassay HandbookyTheory and applications of ligand binding, ELISA and related techniques
Edited byEdited byDavid Wild

Method Evaluation
Description (2 Kits) ReplicationNon-specific binding (NSB) or no sample 2Non specific binding (NSB) or no sample 2Set of controls normally used by laboratory 4 x 2Zero calibrator 10Remaining Calibrators 5 X 2Kit manufacturer’s controls 3 x 2Patient samples 12 x 2
com
Sample dilutions (1/2, 1/5, 1/10) 3 x 2Diluent 1 x 2External QC scheme samples 5 X 2
emeg
alle
ry.c External QC scheme samples 5 X 2
Set of controls normally used by laboratory 5 x 2
ww
w.t
he
Company LogoCompany Logo

Method EvaluationAnalysis of results from initial kit
evaluationThe calibration curve should be fitted as recommended by the manufacturerWithin assay precisionWithin assay precision%CV for the controls, samples and calibrators
(Value not OD)Between assay differences and stored calibration
com
Between-assay differences and stored calibration curve stability% CV for control and sample
emeg
alle
ry.c Compare the values generated by the stored
calibration curve with those derived from a manual plot of all the calibrators
ww
w.t
he
Company LogoCompany Logo
plot of all the calibrators

Method EvaluationAnalysis of results from initial kit
evaluation (continue)( )Drift Plot the values of controls obtained at the beginning middle and end of the assay to detectbeginning, middle and end of the assay to detect assay drift Sensitivity10 li t f lib t A l ti l
com
10 replicates of zero calibrator, Analytical sensitivity is two SD above or below the zero calibrator mean
emeg
alle
ry.c
AccuracyCompare the results for the external QC scheme samples with those obtained from other methods and all-laboratory
ww
w.t
he
Company LogoCompany Logo
with those obtained from other methods and all laboratory trimmed meansCompare the patient samples with current method

Method EvaluationAnalysis of results from initial kit
evaluation (continue 2)( )DilutionSamples diluted by zero calibrator, Plot the dilution curve straight linecurve, straight lineVerification of Reference IntervalOther information1 Ch k th f th tC
OM
com
1. Check the appearance of the reagents, 2. Check the ease of using of packaging3. Quality of the instructionsTA
ZT
EB
.Cem
egal
lery
.c
y4. Estimate the total assay time5. Telephone to customer service and ask
one/two questions to check the quality and theWW
.PIS
HT
ww
w.t
he
Company LogoCompany Logo
one/two questions to check the quality and the speed of their responsesW
W

IQC and EQC
com
emeg
alle
ry.c
ww
w.t
he
Company LogoCompany Logo

Implementing a QC Program to ensure quality
Implementing a QC Program to ensure quality
CO
Mco
mTA
ZT
EB
.Cem
egal
lery
.cW
W.P
ISH
Tw
ww
.th
eW
W

CO
Mco
mTA
ZT
EB
.Cem
egal
lery
.cW
W.P
ISH
Tw
ww
.th
eW
W

CO
Mco
mTA
ZT
EB
.Cem
egal
lery
.cW
W.P
ISH
Tw
ww
.th
eW
W

Analysis of Control MaterialsC
OM
com
TAZ
TE
B.C
emeg
alle
ry.c
WW
.PIS
HT
ww
w.t
he
WW

CO
Mco
mTA
ZT
EB
.Cem
egal
lery
.cW
W.P
ISH
Tw
ww
.th
eW
W

Levey-Jennings ChartLevey-Jennings Chart
Record Time on X-Axis and the Control Values on Y-Axis
105110115
mg/
dL)
105110115
es
105
110
115
+2SD
+3SD
CO
M 95100105
lues
(e.g
.
95100105
trol
Val
ue
95
100
105
Mean+1SD
1SD
com
TAZ
TE
B.C
808590
ontr
ol V
a
808590
Con
t
80
85
90-1SD-2SD-3SD
emeg
alle
ry.c
WW
.PIS
HT 80
1 2 3 4 5 6 7 8 9 10 11 12 13 14 15 16 17 18 19 20 21 22 23 24Co 80
1 2 3 4 5 6 7 8 9 10 11 12 13 14 15 16 17 18 19 20 21 22 23 24
Time (e.g. day, date, run number)
1 2 3 4 5 6 7 8 9 10 11 12 13 14 15 16 17 18 19 20 21 22 23 24
ww
w.t
he
WW

Example of QC Graphco
mem
egal
lery
.cw
ww
.th
e
Company LogoCompany Logo

com
emeg
alle
ry.c
ww
w.t
he

Westgard Flowchart..
Control data
1 pointoutside 2 SD In control – report data
No
1 pointoutside 3 SD
2 consecutivevalues outside
Difference between2 t l ithi
4 consecutive controll id
10 consecutive
Yes NoNo No No N
com
outside 3 SD values outsidethe same 2 SD
2 controls withina run
exceeds 4 SD
values on one sideof the mean and
further than 1 SD from the mean
valueson one side of
the mean
Y
No No
.CO
Mem
egal
lery
.cYesYesYes
YesYes
ISH
TAZ
TE
B.
ww
w.t
he
Out of control – reject analytical run
WW
W.P
I

Westgard Multi-Rule Procedure (examples for 13s, 22s, R4s. 22s, 41s across two levels, and 41s for one level )
Mco
mT
EB
.CO
Mem
egal
lery
.cPI
SHTA
ZT
ww
w.t
he
Company LogoCompany LogoWW
W.P

Westgard Multi-Rule Procedure (examples for across two levels and for one level.)
CO
Mco
mTA
ZT
EB
.Cem
egal
lery
.cW
W.P
ISH
Tw
ww
.th
eW
W

Errors DetectedError Condition
1. No errors12s
Random error13s, R4s
Systematic error
com
y22s, 41s, 8x, 10x, 12x
emeg
alle
ry.c
ww
w.t
he
Company LogoCompany Logo

Thanks for your attention