pisa, 7 september, 2016 an introduction lesson 3 to...
TRANSCRIPT

An introduction to the
mathematical modeling
of the sleep
M.L. Manca Department of Clinical and Experimental Medicine University of Pisa
Pisa, 7 September, 2016 Lesson 3

What we will learn today?
• The sleep
• Homeostatic and circadian aspects of the sleep
• Derivation of the 2-process model
• REM-nonREM sleep alternation
• Derivation of 2 variants of the McCarley’s model

Sleep and literature• Judeo-Christian tradition: the Bible
compares death to sleep more than 50 times; New Testament writers consider that the disciples’ inability to remain awake represented a figurative abandonment of Jesus
• In Greek mythology, Hypnos was the god of sleep; Hypnos lived next to his twin brother, Thanatos (death personified) in the underworld
• The “Roman Hypnos” was known as Somnus; the term Insomnia comes from this Roman name (insomnia = no sleep)

Sleep and literature• William Shakespeare wove themes
of sleep: “To die, to sleep; To sleep: perchance to dream: ay, there's the rub; For in that sleep of death what dreams may come” (Hamlet)
• Charles Dickens wrote of a specific sleep disorders in “The Pickwick Papers”
• “Baku” are Japanese supernatural beings that devour dreams and nightmares

Sleep research
The importance of sleep research is both in medicine and in mathematical modeling
After the pain, sleep disturbances are the second most frequent indicator of illness
During sleep, human brain goes through several psychophysiological states that are relatively stable
Moreover, many nervous centers are inactive, so brain becomes a less complex system and is a suitable object for mathematical
modeling
Nevertheless, sleep is a mystery

Sleep and EEGThe beginning of modern sleep research dates back to the 1930s and is closely
connected with the invention of the EEG
In 1937, Loomis was the first to observe that sleep is not a homogeneous state during the whole night and described different stages of
sleep based on EEG
In 1953, Aserinsky and Kleitman observed a special state of sleep - rapid eye movement
(REM) sleep -, during which rapid, binocularly symmetrical eye movements
occur
They also divided nonREM sleep into 4 stages
Kleitman and Dement specified the cyclic pattern of REM-nonREM sleep
One cycle of REM-nonREM lasts about 90-100 minutes and during the night, 4-5
cycles occur

Studies of sleep regulation rely heavily on recordings of the EEG, which specify the stages of sleep and define their temporal
organization

Sleep stagesThe main states during the day are
wakefulness, REM sleep and nonREM sleep
NonREM sleep is further divided into 4 stages from the lightest Stage 1 to the
deepest Stage 4
Stages 3 and 4 are referred to as slow wave sleep (SWS)
The frequency of sleep stages alters during the night - in the early hours of sleep SWS
dominates, whereas REM sleep occurs more often in the second part of sleep
The portion of REM sleep during night changes with age, in newborn babies REM
sleep lasts for 50%, in adults for 20%
Sleep duration Approximately 8h
Sleep latency 10 min
Stage 1 5%
Stage 2 50%
Stages 3 & 4 20%
REM 25%

One cycle of nonREM and REM sleep

Sleep architecture: 4 - 5 cycles

EEG waves
• Alpha waves: 8 - 12 / 13 Hz
• Beta waves: 15 / 18 - 30 Hz
• Theta waves: 3,5 / 4 - 7,5 / 8 Hz
• Delta waves: 0,75 / 1 - 3 / 4,5 Hz
• Gamma waves: > 31 Hz

Theta and delta waves• Normally are seen during
sleep
• They are known as slow waves
• Delta waves are seen during deep sleep

Waking
• Adults are typically awake for at least two-thirds of the 24-hour day
• Behavioral cues, including open eyes, movement, and conversation, demonstrate alertness
• As activities wind down, people recline and close their eyes; it is at this time that the brainwaves slow to an alpha rhythm
• Alpha rhythm is the bridge between wake and sleep

nonREM sleep
Stage 1 is the typical transition from wakefulness to sleep It is characterized by a reduction of alpha waves, and then by low amplitude mixed
EEG frequencies in the theta range It is the lightest stage of sleep; typically accounts for 5 - 10 % or less of the total
sleep time in young adults
Stage 2 generally comprises the largest percentage of total sleep time in a normal middle aged adult, typically 45 - 55 % of the night
It is characterized by theta EEG frequency, but in addiction there are two distinct features of nonREM sleep that appear for the first time on the EEG: sleep spindles
and K-complexes
Stage 3 (in the past Stages 3 and 4) is frequently referred to as "slow wave sleep" or "deep sleep"
It is characterized by low frequency and high amplitude delta waves Stage 3 sleep typically accounts for 10 to 20 % of the total sleep time in young to
middle age adults and decreases with age

K and spindles

REM sleep• There are 2 phases of REM sleep: phasic and
tonic
• Phasic REM sleep contains bursts of rapid eye movements, respiratory variability, and brief electromyographic activity
• More limited motor activity occurs during tonic REM sleep, with few eye movements
• REM sleep has typically been associated with vivid dreaming, based on early studies in which patients were awoken out of REM sleep
• One hypothesis suggests that REM sleep is a time of memory consolidation
• Several sleep disorders may be related to abnormalities in REM sleep

Today it is generally accepted that there are 3 processes that regulate sleep: a homeostatic process, a circadian process and an ultradian process

Homeostatic processThe term sleep homeostasis refers to the sleep-wake dependent aspect of
sleep regulation, because homeostatic mechanisms counteract deviations from an average reference level of
sleep
The homeostatic process takes control of the amount of sleep and
wakefulness, so that the homeostasis is reached
It increases the fatigue and sleep propensity during wakefulness and
decreases it during sleep
The longer we are active (and, perhaps, the more we are active), the
deeper we sleep

Circadian processCirca: "about” Dies: “day"
Circadian rhythms are physiological and behavioral characteristics that follow a
pattern cycle lasting approximately 24 h
Circadian process reflects the influence of external events which oscillate with
circadian rhythm
Circadian principle in the sleep represents the alternation of sleep propensity with
24 h rhythm: the longer we are active, the shorter we
sleep

Circadian process
• In humans, the main pacemaker regulating endogenous (internal) circadian rhythms is the suprachiasmatic nucleus (SCN)
• This is a small group of cells located in the area of the brain called the hypothalamus
• On the contrary, until now, physiological centre of the homeostatic process has not been identified

Examples of circadian processes

Ultradian processUltradian rhythms: a period or cycle shorter than a day - milliseconds it takes for a neuron to fire - 90 / 100 minutes sleep cycle (REM and nonREM sleep) - your attention span in class
On the contrary, infradian rhythms have period longer than a day

The 2-process model of Borbely & Daan (qualitative model 1982; quantitative model 1984)
This model assumes the interaction of the homeostatic S and circadian C processes
S, representing sleep debt, increases during wakefulness and declines during sleep, within a value-range that oscillates with a periodicity that is normally entrained to day and night by a circadian pacemaker

The process C• The Authors postulate a first process C, regulated by a circadian
pacemaker
• It can be entrained by an external cue, called zeitgeber, that influences the timing of this internal clock, by providing a stimulus
• The most common example of zeitgeber is the light - dark cycle, via the retinohypothalamic tract and the pineal gland that releases melatonin
• Readiness for nocturnal sleep is initiated by the circadian signal of melatonin release in the evening, which induces distal vasodilatation, enhancing the probability of sleep onset

The process C• The investigation of circadian factors is difficult under
standardized experimental conditions, as a variety of environmental and circadian rhythms occur
• For the analysis of the circadian aspects of the sleep, the association between sleep and body temperature is very important
• Several studies concur that the variations in sleepiness are a mirror image of the body temperature rhythm
• Sleep propensity is highest at the time of the circadian temperature minimum and lowest at the time of the temperature maximum

Outline of the model
• Borbely & Daan introduce a second process S
• S increases during wakefulness and decreases during sleep
• The begin of sleep and wakefulness occur when S is above or below the thresholds H and L, respectively
• The model rests on the assumption that 2 independent processes underlie sleep regulation

Some experimental data on the independence of the 2 processes
In the course of a prolonged sleep deprivation period, subjective alertness showed a prominent circadian rhythm
In studies in which the phase of the circadian process (as indexed by body temperature and plasma melatonin) was shifted by morning bright light, the course of slow waves sleep (which is connected to S) remained unaffected
Furthermore, the homeostatic response to sleep deprivation persists even after circadian rhythmicity had been disrupted or abolished by lesioning the suprachiasmatic nucleus (in animals)

Some experimental data on connection between S, slow waves sleep (SWS) and slow
waves activity (SWA)• With the progression of waking time, the level of sleepiness increases and sleep
latency (i.e. the amount of time that it takes to fall asleep) shortens
• The association between sleep parameters and the duration of prior waking is not linear: the “slept debt” is only partially compensated by an increase in the duration of recovery sleep and, probably, sleep loss can be balanced by an enhancement of sleep intensity (during nonREM sleep)
• The Authors chose SWS as a candidate for a high-intensity sleep because: i) it predominates in the first part of the sleep; ii) it is enhanced after sleep deprivation iii) if the sleep time is extended and/or naps occur the amount of SWS is reduced
• The EEG spectral power in the delta band (0,75 - 4,5 Hz) has been selected as a physiological indicator of the intensity of the sleep process: EEG slow-wave activity - SWA

EEG spectral power
“Spectral power" answers the question "which frequencies contain the signal´s power?"
Spectral analysis is used to investigate the signal’s power in the various frequency bands
It is based on Fourier transform which displays signal in the frequency domain:
where x1,…,xN is the measured signal in the time domain, Xk is the amplitude
corresponding to the kth frequency and N is the number of values

An example
The spectral power of a particular frequency band is computed as the sum of modulus-square amplitudes belonging to this band
The power in EEG alpha band (8Hz-12Hz)
where k8Hz is the lower limit of alpha band and k12Hz is the upper limit of alpha band
And what about EEG delta band?

The qualitative model: the sleep propensity
• Sleep propensity is assumed to be determined by the combined action of the S and C processes
• The top of the picture shows the exponential decline of SWA after a waking period (continuous line) and a prolonged vigil (interrupted line)
• The lower part shows the time course of S obtained by interpolating selected measure values of SWA
• Sleep propensity corresponds to the difference between S and C (or to the sum between S and - C)

The qualitative model: the sleep propensity
• The process C is represented by a sine function
• The minimum of the function was set for 16 h and the maximum for 4 h
• In the lower part of the figure, the negative image of C (- C) has been plotted; - C can be interpreted as the circadian body temperature (maximum: 16 h and minimum: 4 h)

The qualitative expression of S: during wakefulness
The rate of S buildup has been estimated by interpolating 3 data points: - EEG SWA at the end of a normal sleep night (S0 in the picture) - SWA at the end of a normal waking day (S34) - SWA after 24 h of sleep deprivation (S82)

The qualitative model: the begin and the end of the sleep
• In the 2-process model the sleep homeostatic process and the circadian process interact only at discrete (2) events
• S increases monotonically during wakefulness until it reaches H, at which point sleep is initiated, and declines monotonically during sleep until it reaches L, when sleep is terminated
• The system acts like a thermostat (“somnostat”) that switches off at a higher threshold than it switches on
• The H threshold could by influenced by habits, for example naps may decreases H and social stimulations could increases it

The 2-process model

The quantitative expression of S: during sleep
S is described by a recursive formulation S decreases and asymptotically approaches 0 during the sleep S(t = i) = e -d/2 * S (t = i - 1) d is the decay factor of S, t the time From experimental data on healthy subjects, the Authors estimated d = 0,238, considering that the decrease of SWA during sleep is essentially exponential: S(t = i) = 0,888 S(t = i -1) In all simulations, 30-min period has been used as a convenient time unit

The quantitative expression of S: during wakefulness
S increases and approaches an upper asymptote U S(t = i) = U - e -r/2 [U - S(t = i -1)] r is the rise factor of S For convenience, the Authors assumed U = 1 From experimental data r = 0,055: S(t = i) = 1 - 0,973 [1- S(t = i - 1)]

Derivation of thresholds
If 7:00 a.m. (S0) and 11:00 p.m. (S32) represent the average times of spontaneous sleep termination and onset in healthy adults: S(t = i) = 0,888 S(t = i -1) S0 = S1 * 0,8882 = …. = S32 * 0,88816 = 0,093 (minimum of sleepiness)
S(t = i) = 1 - [1- S(t = i - 1)] * 0,973 S32 = 1 - (1 - S31) * 0,97331 = … = 1 - (1 - S0) * 0,97332 = 0,622 (maximum of sleepiness)

The quantitative expression of C
• A amplitude of skewed wave; t: time; tau: period of C; t0: the circadian phase at the beginning of the simulation
• Core body temperature and melatonin rhythms are markers of C

Model weakness• While SWS is the “high intensity” fraction of nonREM
sleep, SWS and REM sleep exhibit opposite trends in the sleep period
• The proportion of REM sleep increases across successive nonREM - REM sleep cycles, a trend that becomes even more apparent if sleep is extended into the morning hours
• This model is not complete, because it does not take into account the cyclic succession of nonREM-REM sleep

• The circadian literature is replete with physical, electronic, and mathematical models and these analyses have proved invaluable for understanding go the basic properties of circadian oscillators
• On the contrary, researchers who have attempted to model the mechanisms generating the REM-nonREM cycle are few; in ultradian rhythmicity, functions are far from clear
• Dement and Kleitman's research provides us with evidence of internal infradian and ultradian rhythms which help control cycles within the body, but such research is mostly conducted in a laboratory setting which lacks external validity as results may not generalize to real life settings
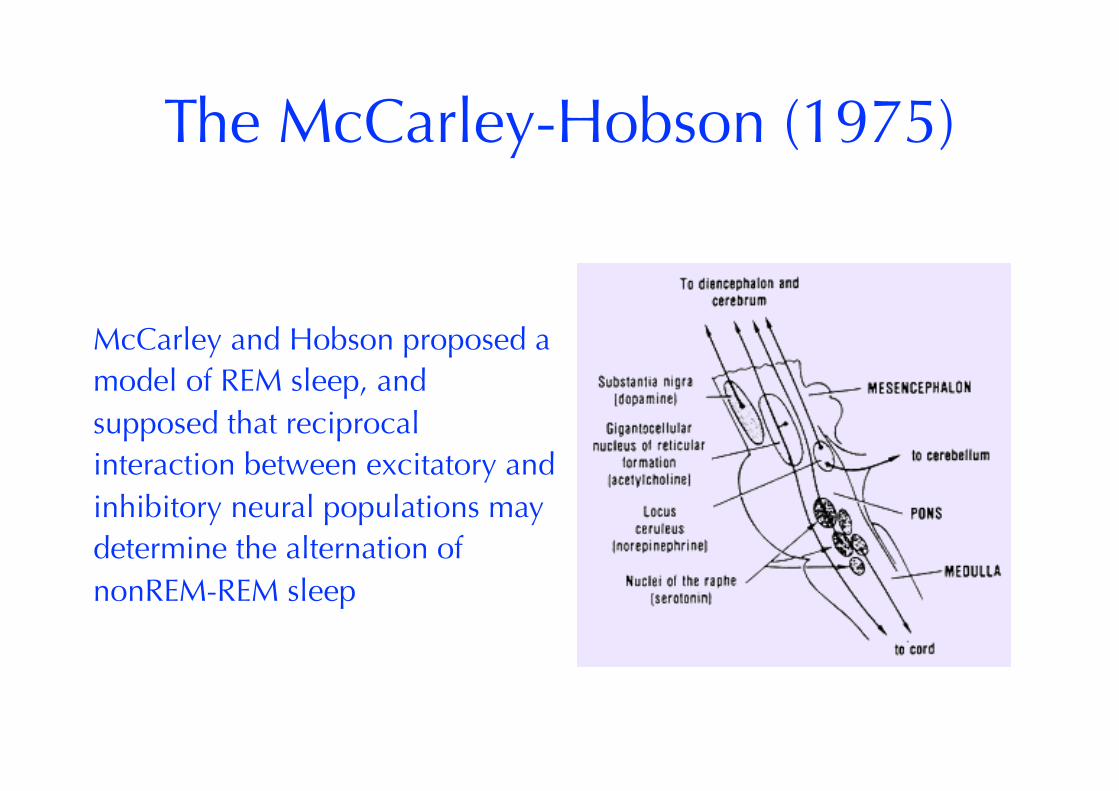
The McCarley-Hobson (1975)
McCarley and Hobson proposed a model of REM sleep, and supposed that reciprocal interaction between excitatory and inhibitory neural populations may determine the alternation of nonREM-REM sleep

Experimental observations
MH observed time course of discharge activity in 2 neuronal populations: - “REM-on” neurons in the pontine reticular formation mPRF (in particular pontine giant cell field) that became active in REM sleep and promote this sleep phase; - “REM-off” neurons in the locus coeruleus (LC) and dorsal raphe nucleus (DR) whose discharge activity had a reciprocal time course to the “REM-on” population “REM-off” cells nearly ceased discharge activity with the advent of REM sleep

What mechanisms might be involved in generation of these non sinusoidal, periodic
neuronal activity curves?
The most relevant features of the discharge time course of REM-on neurons, over multiple sleep-waking cycles, are the periodically and non sinusoidal occurring peaks of discharge activity, each of which corresponds to a REM episode

What mechanisms might be involved in generation of these non sinusoidal, periodic
neuronal activity curves?
• No proof for the time course of REM-on generated by pacemaker neurons involved in control of ultradian rhythmic activity
• McCarley and Hobson hypothesized that the periodic occurrence of REM sleep might be a function of reciprocal interaction between REM-on and REM-off populations

The reciprocal interaction model• X represents the population REM-on, excitatory, and
medial pontine reticular formation (mPRF) neurons are used as exemplars
• Y is the population REM-off, inhibitory, and locus coeruleus (LC) and dorsal raphe (DR) neurons are used as exemplars
• “-“ indicates inhibitory and “+” excitatory connections
• The model describes the influence of REM-on itself (“+ a”) and an excitatory effect of REM-on on REM-off population (“+ d”), probably using acetylcholine as a neurotransmitter
• The Authors proposed the same for REM-off population but with a negative sign because the feedback is inhibitory, respectively “- c” and “- b” terms, i.e there is an inhibitory effect of REM-off on REM-on, probably regulated by the neurotransmitter norepinephrine

The reciprocal interaction model
• The highly non sinusoidal nature of REM-on activity suggests a nonlinear REM-on / REM-off interaction
• McCarley and Hobson model the nonlinearity effect with the product of activities in the 2 populations
• This is in accord with the physiological hypothesis that the effect of an excitatory (or inhibitory) input to the population will be proportional to the current level of discharge activity

Mathematical formulationIt is a Lotka - Volterra (LV) system, originally proposed as a model for prey - predator interaction: X’(t) = aX - bXY and Y’(t) = -cY + + dXY It is a system of first-order nonlinear differential equations
As REM-on neurons excite themselves, they behave as an autonomous self-replicating prey population On the contrary, REM-off neurons inhibit the growth in the activity of mPRF neurons while their own activity die off in the absence of mPRF input, so they behave as a predator population

LV systemX’(t) = aX - bXY and Y’(t) = - cY + dXY X and Y represent the firing rate of REM-on and REM-off populations, respectively X’(t) = aX X(t) = eat, a constant, shows the REM-on response to self-excitation (that increases exponentially) X’(t) = - bXY X(t) = e-bYt, represents the exponential decay of X activity, with a rate dependent on constant b and Y activity Y’(t) = - cY Y(t) = e-ct, c constant, represents an exponential decay in Y activity Y’(t) = dXY Y(t) = edXt, is the exponential growth of Y activity, with a rate dependent on constant d and X activity

The Authors found a good match between theoretical behavior of REM-on neurons and experimental data
The line histogram describes the observed data, while the solid curve the REM-on fit and the dotted line the REM-off fit derived from the model (with a = 0,55; c = 0,27; x(0) = 1; y(0) = 3)
The dot in the ordinate scale indicates the equilibrium values for the 2 populations

LV system• The equations have periodic solutions and there is not a simple
expression in term of trigonometric functions • Population equilibrium occurs in the model when neither of the
population levels is changing, i.e. when both of the derivatives are equal to 0; so the 2 solutions are P0(0, 0) and P*(c/d, a/b)
• P0 represents the extinction of both species, and P* a fixed point at which both populations sustain their current numbers
• The levels of populations at which this equilibrium is achieved depend on the chosen values of a, b, c and d
• The study of stability of P* shows that the levels curves are closed orbits surrounding the fixed points: the levels of populations cycle and oscillate around the fixed point

LV system• LV study is facilitated by plotting the level
of activity of X vs. that of Y, at different times; this X - Y phase plan captures the evolution of the X - Y interaction when we start with different combination of population levels (i.e. low X and Y, high X and low Y…)
• The level of X is plotted on the x-axis while the level of Y on the y-axis
• Each point represents a combination of levels of the 2 populations
• Any stable oscillation of X and Y populations is represented as a closed oval orbit (path), with a constant “energy level”

LV system• In the picture, P1, P2, and P3
correspond to separate solutions generated by different initial conditions and with the same values for a, b, c and d
• For each population, there is a (zero) isocline; for example the X isocline is a combination of levels of the 2 populations where X does not increase or decrease
• The isocline equations are IA: X = c/d and IB: Y = a/b; in the figure being a = b = 2c = 2d, the isoclines are located at X = 1 and Y = 1

Limitations in LV modelThe LV system displays “neutral stability”, that is the system’s long-term behavior was determined entirely by its initial conditions This would imply that, to generate the REM-nonREM cycles, a REM oscillator would have to be set into motion each night with highly reproducible precision and to maintain stability in the face of internal and external influences
LV model produces a cyclic behavior, but the cycles are not stable limit cycles (i.e. not able to assimilate small perturbations and to come back to the original configuration); on the contrary, if perturbed the LV system would origin a different cycle
These conditions are alien to physiological systems

Towards a new version of the model
An additional complications of the “neutral stability” was the difficulty in modeling circadian influences, which would have necessitated postulating the existence of unreasonable phase resetting mechanisms
Furthermore, the LV system does not explain the increases in REM length during the sleep
Finally, there is no limitation on the amplitude of neuronal discharge

The limit cycle or McCarley-Massaquoi model (1986)
The model is mostly based on physiological data
X’(t) = a(X) X S1(X) - b(X) X Y and
Y’(t) = -cY +d(circ) X Y S2(Y)
a(X) = amax L1(X), where L1(X) is a sigmoid, i.e. a function defined by 1 / (1 + e-t)
a(X) is the REM-on self-excitation growth function, smaller with smaller X

Limit cycle modelS1(X) is a sigmoidal saturation function that constraints the growth of REM-on population to finite levels
The slow rate of descent of S1 reflects the heterogeneity of the X population, i.e. some neurons are limited at relatively low rates and others at relatively high discharges rates
b(X) indicates REM-on dependence on REM-off inhibitory input; that means that it exists a nonzero basal level of REM-on activity that cannot be suppressed by inhibition
b(X) = bmax * 1 / (1 + e-80(x - 0,11)
),
where bmax is set to 2

Limit cycle modelREM-off firing rate is also dependent on the phase of the circadian temperature oscillator
d(circ) indicates the dependence of d of circadian aspects of the sleep:
d(circ) = d + A sin(wt + p0),
where d is the average level (fixed), A the amplitude of the oscillations (fixed), p0 is the circadian phase in radians at start of simulation, t the time, and omega the frequency of oscillation (period = 24 h)
d(circ) modulates Y and X (if Y is high thus X activity is low) and also turns the REM sleep oscillations on and off
S2(Y) is a sigmoidal saturation function, limiting the growth of REM-off to finite levels

Solutions• The limit cycle model solutions
are families of spirals that converge to a unique oval termed the limit cycle (PL)
• PL is approached regardless of whether the initial approach is exterior (PE) or interior (PI) (depending on the starting conditions), demonstrating the stability of the oscillatory system

The McCarley’s models: 40 years later
The history of the McCarley models encompasses the history of discovery of neurons and neurotransmitters involved in REM sleep

The Borbely’s model: 30 years later
• Brain differentiation: regional differences in the sleep EEG; analysis of the parameters of process S have confirmed topographic differences
• Both the increase and decrease of S are slowest in the front - central area
• Such regional differences imply that quantitative SWA predictions are dependent upon which brain area is chosen to estimate the time course of S
• In the Borbely's original model, the homeostatic and the circadian processes interact at discrete events (H and L thresholds); now, scientific evidence suggests a continuous mutual influence between the 2 processes

30 years later
• The view of the circadian system has undergone profound changes; the SCN is now viewed as orchestrating and integrating rhythms rather than simply generating and driving them
• Now it has been hypotheses a role for the metabolism in determining the rest - activity rhythms relative to the SCN
• Furthermore, if sleep does not occur within the appropriate phase of the sleep-awake cycle, by being either too short or too long, the risk of type 2 diabetes increases

Some references• Borbély AA. A two process model of sleep regulation. Hum
Neurobiol. 1982;1(3):195-204
• Daan S, Beersma DG, Borbély AA. Timing of human sleep: recovery process gated by a circadian pacemaker. Am J Physiol. 1984 Feb;246(2 Pt 2):R161-83
• Book: Brain Control of Wakefulness and Sleep Hardcover – 2005 by Mircea Steriade, Robert W. McCarley
• McCarley RW, Hobson JA. Neuronal excitability modulation over the sleep cycle: a structural and mathematical model. Science. 1975 Jul 4;189(4196):58-60

An exercise
Try to find an alternative expression for S