pilot monitoring of shipboard environmental conditions … deck/pen dry bulb temperature and...
TRANSCRIPT

The livestock export program is jointly funded by the livestock exporters and producers of Australia
MLA makes no representation as to the accuracy of any information or advice contained in this document and excludes all liability, whether in contract, tort (including negligence or breach of statutory duty) or otherwise as a result of reliance by any person on such information or advice. © Meat and Livestock
Project number LIVE.223 Final Report prepared for MLA and Livecorp by: Michael McCarthy Professional Agricultural Services Pty Ltd P.O. Box 1463 Fremantle WA 6150 Meat & Livestock Australia Limited ABN: 39 081 678 364 Locked Bag 991 North Sydney NSW 2059 ISBN 1 74036 610 7
March 2005
Pilot Monitor ing of Shipboard Environmental Condit ions and Animal Performance

Pilot monitoring of shipboard environmental conditions and animal performance
Page 1
Acknowledgements
This project was made possible through the co-operation of the export industry including livestock export companies, ship-owners, stockmen and veterinarians. The contributions of Siba and KLTT for providing the vessels are gratefully acknowledged. Special thanks are given to the Captains of the MV Al Messilah, MV Al Shuwaikh, MV Becrux and MV Al Kuwait for their assistance and co-operation. Export companies that participated in the project were Emanuel Exports, Wellard Rural Exports and RETWA. Thanks go to Graham Daws and Garry Robinson, Steve Meerwald and David Jarvie, and Captain Mike Kiely for their help. The veterinarians who assisted with the project, Drs David Beatty, Lyn Simpson, Peter Penson, Martin Robertson and Geoff Manefield are thanked for their contributions. Thanks also to Ian Henderson and the stockmen on the voyages involved in the project. Murdoch University staff who co-operated and provided equipment and technical assistance with the project are thanked. In addition, the help and expertise of Drs Anne Barnes, David Beatty (Murdoch University), Shane Maloney (University of Western Australia) and John Gaughan (University of Queensland) is gratefully acknowledged.

Pilot monitoring of shipboard environmental conditions and animal performance
Page 2
TABLE OF CONTENTS
1.0 Abstract...............................................................................................................................................3 2.0 Executive summary.............................................................................................................................3 3.0 Introduction .........................................................................................................................................5
3.1 Background ..................................................................................................................................... 5 3.2 Project objectives............................................................................................................................. 5
4.0 Project procedures ..............................................................................................................................6 4.1 Data collection ................................................................................................................................. 7
4.1.1 Site selection, clock retard times and a log of deck washing procedures ................................. 7 4.1.2 Livestock description................................................................................................................ 8 4.1.3 Pen and deck information (including ventilation system) .......................................................... 8 4.1.4 Ambient/bridge temperatures ................................................................................................... 8 4.1.5 Wind speed and direction (relative to the ship)......................................................................... 8 4.1.6 Deck/pen dry bulb temperature and relative humidity .............................................................. 9 4.1.7 Respiratory rate and character................................................................................................. 9 4.1.8 Panting score and heat stress score ...................................................................................... 11 4.1.9 Ammonia levels...................................................................................................................... 12
4.2 Data download............................................................................................................................... 13 4.2.1 Temperature and relative humidity ......................................................................................... 13 4.2.2 Wind speed and direction....................................................................................................... 13 4.2.3 Ammonia loggers ................................................................................................................... 13
4.3 Data collation................................................................................................................................. 13 5.0 Results ..............................................................................................................................................14 6.0 Discussion.........................................................................................................................................14
6.1 Choosing the site of data loggers .................................................................................................. 15 6.2 Heat production ............................................................................................................................. 15
6.2.1 Stocking density ..................................................................................................................... 16 6.2.2 Breed type.............................................................................................................................. 16 6.2.3 Feed intake ............................................................................................................................ 16 6.2.4 Other factors .......................................................................................................................... 16
6.3 Heat tolerance ............................................................................................................................... 17 6.3.1 Breed type.............................................................................................................................. 17 6.3.2 Acclimatisation ....................................................................................................................... 17 6.3.3 Ventilation system .................................................................................................................. 17
6.4 Use of a panting and/or heat stress score ..................................................................................... 18 6.5 Calibration and accuracy of measuring devices............................................................................. 18 6.6 Calibration of open decks .............................................................................................................. 18 6.7 Ammonia levels ............................................................................................................................. 19 6.8 Participants and training ................................................................................................................ 19
7.0 Recommendations ............................................................................................................................20 7.1 Onboard data loggers to establish direct linkages ......................................................................... 20 7.2 Data loggers to record environmental conditions ........................................................................... 22 7.3 Loggers to validate other assumptions in the HS model ................................................................ 23 7.4 Developing a better understanding of the ventilation system ......................................................... 24 7.5 Other recommendations ................................................................................................................ 24
8.0 Conclusions.......................................................................................................................................25 9.0 References........................................................................................................................................26 Appendix 1................................................................................................................................................27
Example of Written Instructions used in the Project ............................................................................. 27 Appendix 2................................................................................................................................................28
Instructions to be included in Stockman’s Manual ................................................................................ 28 Appendix 3................................................................................................................................................30
Example of Recording Template .......................................................................................................... 30

Pilot monitoring of shipboard environmental conditions and animal performance
Page 3
1.0 Abstract The use of temperature and humidity data loggers to establish direct linkages between environmental conditions and animal performance has proven to be both practical and feasible in the onboard situation. This has been achieved using the existing industry resources. There are however, many contributing factors affecting heat tolerance of livestock and a degree of subjectivity in the measurement of animal performance. These may frustrate efforts of onboard monitoring to re-calibrate (or validate) Heat Stress Thresholds (HST) for different types of livestock. A large amount of information may be required to properly validate current estimates.
2.0 Executive summary Temperature and humidity data loggers have been used successfully to establish linkages between environmental conditions and animal performance. This pilot project evaluated equipment, data collection, downloading and collation procedures and made recommendations about future data collection. The information arising from the pilot project should be analysed to see if it could be used to re-calibrate (or validate) assumptions contained within the industry heat stress risk assessment (HS) model. This report notes the many contributing factors affecting the heat tolerance of livestock. Because these factors are likely to vary from voyage to voyage and from time to time during a voyage, a large amount of information may be required before estimates of heat tolerance can be validated using onboard monitoring. Despite these limitations, onboard monitoring using data loggers could be used: • To provide a record of environmental conditions onboard ship. • To provide more detailed information if a heat-stress incident occurs. • To help establish direct linkages between environmental conditions and animal
performance. • To develop a better understanding of onboard ventilation systems. Animal performance with regard to heat tolerance was measured using a panting score. This score proved to be a reliable and repeatable measure despite its subjectivity. It is therefore recommended that panting score be utilised as the primary indicator of heat stress. The industry HSRA model utilises a definition of heat stress threshold that relates to a shift in core body temperature (Stacey, 2003). The linkage between this and the panting score has been established (John Gaughan, pers. comm.) although this linkage needs to be strengthened. Information was collected on nine voyages during the period April to October 2004. These voyages generated 79 discrete data sets for subsequent analysis. Analysis of this data was outside the scope of the current project and needs to be completed. Provided statistically significant findings are made, it is recommended that onboard monitoring be continued. It is not envisaged that monitoring be conducted on all long-haul voyages to the Middle East, rather it is suggested that monitoring be conducted on an opportunistic basis, when lines of livestock are identified as being of particular interest. This will require the monitoring to be actively managed (see 7.1 Recommendation 3). Because of the many contributing factors to heat tolerance, it was necessary to collect a considerable amount of information to ensure that the data collected could be interpreted. The

Pilot monitoring of shipboard environmental conditions and animal performance
Page 4
most challenging of these factors was site selection. To establish heat stress thresholds, it was imperative that the information measured by the data loggers was representative of the air surrounding the animals in the pen. It should be noted that the wet bulb temperature will vary considerably within a hold (up to 3-4 °C wet bulb, depending on the wet bulb rise within the deck). Site selection was therefore crucial to ensure a proper linkage to animal performance. Livestock description was relatively straightforward, with breed-type being the most important consideration. Coat-length, fatness, age, sex and weight were also recorded. The preparation history of the livestock in question was more difficult to obtain. It is difficult to obtain this information once the vessel has sailed. Even onshore, the origins of livestock are often obscured when mobs are mixed when they pass through assembly centres. Pen and deck information was collected. Pen area was used to calculate stocking densities. In most cases the actual weights of animals were not available and had to be estimated on the basis of known weights within the consignments. The stated pen air-turnover was utilised as the preferred measure of airflow through the deck. The presence or absence of significant airflow above the animals was also noted, as was the proximity to supply and/or exhaust vents. The ship’s crew measure bridge temperatures every four hours. This information was used to represent the ambient challenge. Information relating to wind speed and direction (relative to the ship) was also collected from information held on the bridge. This was important to allow proper interpretation of data collected from open decks. Information about feeding times, clock retard times and deck washing procedures was also collected to assist in the interpretation of the collected data. Because panting score is a relatively recent measure within the live export industry, it was supported by measures of respiratory rate, respiratory character and heat stress score. These measures were useful to the inexperienced participants and helped to make the assessment of a panting score more consistent among the monitoring participants. With practice participants found these supporting measurements less relevant and were able to rely solely on the panting score. Most of the voyages that were monitored were relatively uneventful and rarely recorded anything other than mild levels of heat stress in the livestock. However, on three of the voyages, significant heat stress incidents occurred. It is recommended that these incidents be subjected to more thorough investigation. It was initially envisaged that stockmen would collect most of the project information. However the requirement for all long voyages to the Middle East to be accompanied by a veterinarian resulted in it being better to utilise veterinarians for the monitoring work in some cases. Stockmen were also utilised to undertake the required work. The full benefits of this project will not be evident until the collected data is statistically analysed. The information has been collated and is presented in a form that should facilitate easy analyses. Animal performance was monitored twice daily. Temperature and humidity information is presented as two-hourly averages. Thus data collection procedures can be matched to onboard management procedures.

Pilot monitoring of shipboard environmental conditions and animal performance
Page 5
3.0 Introduction
3.1 Background Heat stress in both sheep and cattle can be a feature on voyages to the Middle East during the Northern Hemisphere summer. To counter this, the industry has developed a risk management approach that utilises a heat stress risk assessment” (HS) model. This model assesses an array of factors relating to the voyage, the livestock and to a lesser extent, the vessel involved. The assumptions contained within the model are based on a comprehensive literature review (Stacey, 2000). They are also based on empirical data collected on a series of voyages that were part of the initial “Ventilation Study” (Stacey, 2001). The assumptions are recognised as being based on the best information available at the time. Many of these assumptions require validation, particularly those linking environmental conditions to individual animal performance. There are many different types of livestock involved in trade to the Middle East and their tolerance to heat will vary. Initial data collection on the voyages undertaken as part of the “Ventilation Study” (Stacey, 2001) relied on hand-held instruments and manual collection of data. This approach was labour intensive and, at best, resulted in information being collected twice a day. Data loggers were assessed at the time, but proved unable to manage high levels of dust and moisture and the information collected from them could not be utilised. Since then, “new generation” loggers have been identified and used in experimental rooms at the both Murdoch University and The University of Queensland. The new loggers are more robust and able to handle the onboard conditions. Use of these loggers has provided more detailed information about the prevailing environmental conditions on the decks and allowed these conditions to be more closely correlated to livestock heat stress. To capitalise on these developments, and better establish the correlation between heat stress and the local environmental conditions, a pilot project was commissioned to determine how to best utilise these loggers to validate the assumptions contained in the industry HS model.
3.2 Project objectives The project objectives were:
By 30th October 2004, to have a pilot program completed, whereby at least three livestock ships over a number of voyages would:
1. Use temperature, relative humidity, ammonia level, wind speed and direction sensors
and loggers to more accurately record and store details of environmental conditions onboard ships. These ships would be those travelling to the Middle East and other long-haul destinations.
2. Have ship stockmen and/or veterinarians on the pilot voyages trained to record and describe the level of heat stress in livestock using information from related climate room research, which included a set of instructions for stockmen suitable for inclusion in the stockman’s manual.
3. Provide the joint R&D program with a database of environmental information and livestock performance, which could be used for the re-calibration and/or validation of the HS model.

Pilot monitoring of shipboard environmental conditions and animal performance
Page 6
4.0 Project procedures The project was divided into three parts. The first was the data collection, the second was the downloading of the information, and the third was the collation of information into a format suitable for subsequent analyses. The project was split into two time periods. It was envisaged that 2-4 voyages would be undertaken between the start date of the project (early April) and the 30th June 2004 and a further 6-8 voyages were planned for the period July 1st – 30th October 2004. The number of voyages undertaken would depend on the co-operation of the two shipping companies that agreed to participate in the project. Three vessels were initially nominated. However it was necessary that these vessels be engaged in voyages to the Middle East during the specified period and because all of the vessels did not meet this requirement it was necessary to source alternative vessels to make up the numbers. A total of nine voyages were included in the project. Both onboard veterinarians and stockmen were used to undertake the required monitoring. Initially it was envisaged that the larger vessels carrying cattle to the Middle East would provide an opportunity to train a number of stockmen in one exercise and that these stockmen could then be used on subsequent voyages to undertake the monitoring work. These voyages did not eventuate and an alternative approach was therefore required. An industry requirement for all long-haul voyages to be accompanied by a veterinarian meant that in many cases it was more efficient for the onboard veterinarian to undertake the work, leaving the stockman free to perform normal stockman duties. However, stockmen were asked to collect information on a number of voyages. It should be noted that in every case, the participants completed the research work voluntarily, and that their presence onboard was paid for by the exporter involved. This enabled the project to be undertaken for very little cost but it meant that the research was secondary to commercial priorities. Fortunately, data collection was not compromised on any of the voyages, but it should be remembered that this might not always be the case if similar monitoring is contemplated in the future. The diligence of all those participating in the project was greatly appreciated. Prior to each voyage, participants were given a set of written instructions describing the information to be collected (see Appendix 1). They were also shown how to read, calibrate and maintain the equipment involved. The principles behind the study were also discussed. A template was provided to allow the entry of collected data. (Only some of the participants carried their own portable computer). Four to 12 loggers were utilised on each voyage. Site selection was left to the participants, but the emphasis was to monitor a range of livestock types and choose pens that were in the path of the normal airflow patterns within the decks. The position of the loggers was described, particularly in relation to the proximity of air supply and exhaust. Participants were asked to monitor pens on a twice-daily basis. It was left to the participants to choose times that best suited the routine of the vessel. The data collection template was designed to accommodate this by using two-hourly intervals and averaging times. This suited the equipment, the ship’s log measurements and the likely daily routines. In most cases, equipment and data were returned to Australia with the stockman (or veterinarian), however, in some cases they were returned with the vessel.

Pilot monitoring of shipboard environmental conditions and animal performance
Page 7
4.1 Data collection Certain information was identified as being important to collect in order to develop an understanding of the correlation between environmental conditions and animal performance. Nominated in the project brief were the following: • Site selection, clock retard times and a log of washing procedures • Livestock description • Pen and deck information • Ambient/bridge temperatures • Wind speed and direction (relative to the ship) • Deck/pen dry bulb and relative humidity • Respiratory rate and character • Panting score • Heat stress score • Ammonia levels Before data could be collected it was necessary to choose a suitable site for each of the data loggers onboard the vessel.
4.1.1 Site selection, clock retard times and a log of deck washing procedures
The selection of the monitoring site was usually driven by a wish to monitor a certain type of livestock, however it was important that the pens selected were representative of the deck involved and that the ventilation was representative of the ventilation system overall. Where open decks were the focus of investigation, six loggers were utilised so that the longitudinal, transverse and diagonal cross- sections could be subsequently analysed to “calibrate” the open deck if required. (This is discussed in more detail in the Discussion section of this report). In most instances, each logger monitored only one pen. However in some cases it was possible to monitor more than one pen. This was particularly the case on double-tiered, open decks where it was possible to monitor up to four pens adjacent to the one logger. (Note that on open decks, although the logger was positioned in the alleyway, the air surrounding the logger was still considered representative of the air surrounding the livestock being monitored). In many cases, the placement of the logger was dictated by practical considerations such as a suitable point of attachment. Where possible, the loggers were placed in the pens that were being monitored, however where suitable attachment points were not available, the loggers were attached in the alleyway adjacent to the pen. The time at which the loggers were erected was noted to allow the logged data to be properly aligned with the daily recordings. It was also necessary to note the times when clocks were retarded. Most voyages to the Middle East involve a retard of between 6-7 hours, (usually one hour every 2nd day). Deck washing events were also noted.

Pilot monitoring of shipboard environmental conditions and animal performance
Page 8
4.1.2 Livestock description As mentioned, the livestock type was often the primary motive for pen selection. The breeds, type, age and sex of the livestock in the pen being monitored was described and recorded. Coat-length and fatness was also described in cattle as was wool-length and fatness in sheep. Known body weights were used to calculate stocking densities. Where individual weights were not known, estimates were used based on known weights. Reference to the appropriate tables in the Livestock Export Accreditation Program (LEAP) manual enabled the calculated densities to be compared to the industry prescribed density restrictions for the time of year, port of loading and destination. A brief statement about the livestock history if known was also included to determine the likely extent of acclimatisation. Any predisposing reason that animals might be less tolerant to heat was also noted (such as breed, preparation history, injury or disease). The normal time of feeding was noted. In general this information was obtained from either the exporter or the ship’s crew.
4.1.3 Pen and deck information (including ventilation system) Pen area was used to determine the stocking density of the pen being monitored. The stated pen air turnover (for either the entire deck or part deck) was also recorded. The ventilation system and the presence (or absence) of direct jetting or significant airspeed above the livestock was described. The proximity of the logger to the point of air supply and/or exhaust was also noted. This information was obtained by direct observation and consultation with the ship’s crew.
4.1.4 Ambient/bridge temperatures The ambient (or bridge) temperature is measured by the ship’s staff on a four-hourly basis and recorded in the ship’s log. This is very useful information because in all but a few cases, it represents the ambient challenge and is usually recorded in the dry bulb/wet bulb format. Occasionally, the bridge temperatures will be affected by exhaust air from the livestock-holds. This may occur under nil wind conditions or when an envelope of exhaust air surrounds the entire vessel. It may also occur when a following breeze slightly exceeds the ship speed (if the bridge is positioned forward) or when there is a slight net breeze directly on the nose of the vessel (if the bridge is positioned aft). These measurements are made by using a standard wet and dry bulb thermometer. Consequently the measurement is reliable but is generally rounded to the nearest degree or half degree. These measurements were collected from the bridge on a regular basis throughout each voyage.
4.1.5 Wind speed and direction (relative to the ship) The wind speed and direction is measured by the ship’s crew on a four-hourly basis and is recorded in the ship’s log. The wind speed is recorded as wind force using the Beaufort Scale. Wind direction is recorded as SSW, SW etc. (this determines the “true” wind speed and direction). The ship’s heading is also recorded. This provides enough information to determine the wind speed and direction relative to the ship (i.e. the “apparent” wind speed and direction). This information was collected from the bridge on a regular basis. In some cases, wind speed and direction was recorded independently of the bridge and simply described as for example: “following breeze slightly in excess of ship’s speed, slightly from the

Pilot monitoring of shipboard environmental conditions and animal performance
Page 9
port side”. This is sufficient to assist in any analyses aimed at understanding the dynamics of the open decks; however, it is not sufficient to properly calibrate the open decks. The only way to properly calibrate the open decks is to have precise wind speed and direction data. The project evaluated a weather station with the capacity to log the wind speed and direction relative to the vessel on an ongoing basis. The weather station also recorded temperature and humidity on an ongoing basis. Unfortunately, the equipment had too many moving parts and was unable to handle the combination of the ship’s movement and strong breezes and was rendered unserviceable mid-voyage. Some of the newer vessels do have wind speed and direction equipment that has no moving parts (Solid State Wind Equipment (No moving parts), Maritronics. John Lilley and Gillie Ltd, Jebel Ali, ph +97143247502). These do not have logging capacity; however the next generation of equipment may be of interest to any future data logging activities.
4.1.6 Deck/pen dry bulb temperature and relative humidity Temperature and relative humidity were measured using T-Tech temperature and humidity data loggers (T-Tech 6 dataloggers, Temperature Technology, South Australia, Australia). These proved sufficiently robust to handle the onboard conditions and were able to function in the dusty and sometimes extremely humid environment. The loggers were pre-programmed for a certain start date and for a pre-set timing and averaging interval. They were erected at the commencement of the voyage and taken down at the end of the voyage. They were generally returned to Australia with the stockman or veterinarian involved. The positioning of the loggers was aimed at ensuring that the air surrounding the logger was representative of the air surrounding the livestock being monitored. Given that the pen selected was representative of the deck, it followed that the logged temperature and humidity were representative of the “deck”. The “deck” or “pen” wet bulb temperature was determined from these measurements using wet bulb tables. Hand-held instruments also measured temperature and relative humidity. The hand- held instrument used (PCWI Model 8705 Hygrometer, PCWI Precision Instrumentation, NSW, Australia) proved to be inoperative when the relative humidity exceeded 95%. This occurred regularly during the voyage. At lower relative humidity levels the instrument was useful to provide a “reality check” to data being collected. The TESTO hand-held instrument (Testo 445 VAC measuring instrument, Testo Australia, Victoria, Australia) was a slightly more reliable piece of equipment under the conditions encountered. This instrument is useful if an accurate measure of temperature and relative humidity is required during a voyage. Note that the T-Tech temperature and relative humidity data loggers have no “real-time” read out.
4.1.7 Respiratory rate and character Panting score is a relatively new measure within the live export industry (“Tips and Tools”, MLA, 2004). To ensure that it was applied universally it was supported by other measures such as respiratory rate, respiratory character and a heat stress score. Respiratory rate and respiratory character are old measures that are included in the stockman’s daily reports. Respiratory rate is measured and expressed in breaths per minute. Respiratory character has a scale of 1-3 (normal, panting and gasping). Because respiratory rate can often subside with the onset of second stage panting, it has been superseded by the panting score (and to a lesser extent a heat stress score).

Pilot monitoring of shipboard environmental conditions and animal performance
Page 10
Accurately measuring respiratory rate is not easy. Firstly it is not practically possible to measure the respiratory rate of all cattle within a pen. Even if it were attempted, the normal “milling” (movement) of cattle would make it very difficult (and time consuming). Furthermore, identification of individual animals is difficult because most ear tags become very hard to read by the end of a voyage. Consequently those animals that are monitored are by necessity only a sample of those in the pen. The emphasis therefore is to ensure that the sample is representative of all the animals in the pen. The task is made more difficult by the fact that respiration is often episodic and can be turned on or off depending on a hierarchy of events (such as feeding, or flight/fight in the presence of the unfamiliar). Another challenge is in determining the time of monitoring. Ideally the respiratory rate should be measured over a full minute period. In practise this can be frustrating since animals will move and interrupt the counting. Often it can be more accurate to actually count over a shorter period. This leads to different multiples, (i.e. multiplied by 2 after 30 seconds, by 4 after 15 seconds, by 6 after 10 seconds, by 10 after 6 seconds). Experience has shown that a shorter time period can often be more (or at least as) accurate as a longer monitoring period. Participants were instructed to obtain a “representative” respiratory rate for the pen. Most observers favoured the use of shorter monitoring periods, and indicated a high level of confidence that the respiratory rate determined was in fact “representative”. Another point of contention was the point at which breathing changed from “normal” to “panting”. In cattle there was a general consensus that panting commenced at a rate of about 80 breaths per minute (bpm). However, in sheep, there were more diverse views. Sheep appear comfortable at a much higher respiratory rate. If panting in sheep is considered to be the point at which respiration seems to require effort, then it probably coincides with a respiratory rate of about 120 bpm. Gasping is an indication of 2nd stage panting. Gasping will often coincide with a reduction in respiratory rate. In cattle gasping will often be preceded by respiration rates of 140-160 bpm. In sheep respiration rates may be as high as 220-240 bpm before gasping occurs (Table 1). Table 1 – Respiratory character in sheep and cattle
Cattle Sheep
At rest 35–45 bpm At rest 35–45 bpm
Normal 45–80 bpm Normal 45–120 bpm
Panting 80–160 bpm Panting 120–220 bpm
Gasping 2nd stage panting Gasping 2nd stage panting
Given that respiratory rate and other measures are being used to determine animals’ tolerance to heat, it is important that the concept of heat load be appreciated when interpreting information that has been collected. It was notable that there was an appreciable lag between the onset of “hotter” environmental conditions and respiratory rate increases. This reflected the concept of heat load. This is well described in the MLA “Tips and Tools” circular (MLA, 2004) and is discussed later in this report. There will often be a “lull” in respiratory rate immediately after deck washing reflecting the respite provided by the washing procedure (Stacey, 2000).

Pilot monitoring of shipboard environmental conditions and animal performance
Page 11
4.1.8 Panting score and heat stress score Because of some of the problems outlined in the previous section, it is likely that the industry will choose to use panting score (Table 2) as the primary measure of an animal’s response to heat. Although panting score is a subjective measurement it is relatively easy to use, is accurate and repeatable. Panting scores are widely used throughout the feedlot industry. Panting score in cattle is well described in the “Tips and Tools” circular (MLA, 2004) regarding the wetting of cattle under heat stress. This was produced by John Gaughan of The University of Queensland and is a product of the project investigating wetting as a means of mitigating heat stress (Gaughan et al., 2004a, 2004b). Table 2. - Panting scores for observed breathing condition - cattle and sheep
Panting Score Breathing Condition
0 No panting
1 Slight panting, mouth closed, no drool or foam
2 Fast panting, drool or foam present
2.5 As for 2, but with occasional open mouth
3 Open mouth plus some drooling, head extended and head usually up
3.5 As for 3 but with tongue slightly out
4 Open mouth, tongue out and drooling, neck extended and head up
4.5 As for 4, but head held down
The only weakness of the panting score in its current form is that it makes no reference to respiratory rate. Some linkage to the likely respiratory rate is desirable to assist inexperienced participants in the assessment of the livestock. With practice the respiratory rate becomes largely irrelevant. Participants in the study were responsible for allocating a representative panting score to the animals in the pens being monitored (based on the guidelines given in “Tips and Tools”, MLA, 2004). The heat stress score is an alternative measure of an animal’s response to heat. It is also well described in the “Tips and Tools” circular mentioned above. Heat stress score is similar to the panting score but has fewer gradations. A measure of heat stress has also been included in the daily stockman report format. It should be noted that this has a different scale to that outlined in the “Tips and Tools” circular. This scale difference needs to be resolved, however it demonstrates that it is possible for important information to be collected routinely provided that a consistent set of guidelines are involved. Because there were no guidelines for determining a heat stress score in sheep, these were formulated from results obtained in this study.

Pilot monitoring of shipboard environmental conditions and animal performance
Page 12
There is useful reference to respiratory rate in the determination of the heat stress score. For inexperienced participants, the guidelines as to the likely respiratory rate associated with each score are useful, however, (as with the panting score) they also become largely irrelevant with more experience. When expressed as a score, 0 would indicate normal, 1 would indicate mild heat stress, 2 moderate heat stress and 3 severe heat stress. Clinical Signs of Heat Stress – Cattle 1. Mild Heat Stress: Drooling and increased respiration rate of 80-100 bpm. 2. Moderate Heat Stress: Drooling, respiration rate of 100-120 bpm and occasional open
mouth panting (panting score1-2.5). 3. Severe Heat Stress: Drooling, respiratory rate greater than 120 bpm, open mouth
panting and tongue out (panting score greater than 2.5). Cattle will also have an agitated appearance, hunched stance and will often have their head down.
Clinical Signs of Heat Stress - Sheep 1. Mild Heat Stress: Drooling and increased respiration rate of 120-140 bpm. 2. Moderate Heat Stress: Drooling, respiration rate of 140-180 bpm and occasional open
mouth panting (panting score1-2.5). 3. Severe Heat Stress: Drooling, respiratory rate greater than 180 bpm, open mouth
panting and tongue out (panting score greater than 2.5). Sheep will also have an agitated appearance, hunched stance and will often have their head down.
4.1.9 Ammonia levels Ammonia levels were measured with the use of hand-held instruments and included in the measurements taken when monitoring the pens on a twice-daily basis. Three different ammonia meters were evaluated. These were the:
i. Neotox MK5 Ammonia Meter (Nutech Australia, Western Australia, Australia) ii. ToxiRAE II Toxic Gas Monitor (RAE Systems, California, USA) iii. QRAE Plus Multi Gas Monitor (RAE Systems, California, USA).
The most useful instrument was the Neotox Mk 5 Ammonia Meter. This instrument was used in earlier studies and proved to be able to tolerate the high levels of dust and humidity that can exist in the onboard environment. It required careful maintenance, regular calibration and the replacement of filters. The ToxiRAE II Toxic Gas Monitor was an ultra-light instrument aimed at being carried on-person in situations that require a personal alarm. This instrument was unable to tolerate the environment as both dust and humidity resulted in the instrument “drifting” and it soon became unserviceable. The other instrument was QRAE Plus Multi Gas Monitor. This instrument was

Pilot monitoring of shipboard environmental conditions and animal performance
Page 13
purchased to enable ammonia levels to be logged on a continuous basis with the idea of obtaining some baseline levels for a time-weighted average (TWA) and short-term exposure limit (STEL). Unfortunately the battery life was quite short (only 20 hrs) and the batteries required regular recharging. The instrument has the capacity to be powered by a mains supply and would be a better option if ammonia levels were to be collected on an ongoing basis. The menus to operate and calibrate the instrument are difficult to master. Furthermore the dust and moisture quickly soiled the filters and the ammonia readings were again subject to “drift”. If ammonia levels are to be taken on a continual basis a specially designed box will be required to house the instrument and allow ammonia levels to be measured without the associated dust and moisture problems. Despite the problems, ammonia levels were successfully collected on most voyages and are contained in the voyage templates. In many cases high ammonia levels correlated with areas of poor ventilation or poor airflow, particularly on open decks, however, it needs to be borne in mind that ammonia production can be independent of ventilation and temperature and will not always demonstrate a direct correlation.
4.2 Data download On return from the voyage, the data loggers were forwarded to Murdoch University where David Beatty (a PhD student studying heat stress and the use of electrolytes in cattle) downloaded the information. This was achieved using the software provided with the loggers.
4.2.1 Temperature and relative humidity Each logger was set up with a pre-determined start date, logging interval and averaging time prior to each voyage. Once downloaded, the information was correlated with data that had been manually collected. A pre-determined Microsoft Excel™ spreadsheet template was used.
4.2.2 Wind speed and direction Data were successfully downloaded also from the weather station designed to measure wind speed and direction. Interpretation of wind speed and direction data is difficult particularly under “fluky” or nil wind conditions. The practice of ships zigzagging to ensure adequate wind speed across open decks added to the complexity of interpretation of the information collected.
4.2.3 Ammonia loggers Data were successfully downloaded from the ammonia logging equipment. There was insufficient information to properly calculate TWA and STEL.
4.3 Data collation Downloaded information was collated into a pre-determined Microsoft Excel™ template. This has standardised the information in a format that can be used for subsequent analysis. Refer to Appendix 3.

Pilot monitoring of shipboard environmental conditions and animal performance
Page 14
5.0 Results A total of nine voyages were included in the pilot project. The number of loggers on each voyage varied, as did the number of pens that were monitored, however a total of 79 discrete sets of data were gathered in the course of the monitoring. All of these have been transferred to data templates and await analysis. This data is confidential and is retained by MLA. Much of the monitoring was conducted under cool conditions and with a correspondingly low panting score. Higher panting scores were rarely recorded for more than 3-4 days of a 16-day voyage. Nevertheless, the monitoring provided an accurate record of the voyages. Information from the data loggers is presented in the data sets as two-hourly averages. Onboard monitoring provides a better opportunity to investigate specific heat stress incidents when they occur. Most of the voyages that were monitored were relatively uneventful; however, some of the voyages encountered heat stress incidents that were worthy of further investigation. The most severe of these occurred on open decks in a Persian Gulf port and is depicted in the data set. In anticipation of such an event, six loggers had been placed strategically on one of the open decks. This provided a continuous log of the events leading up to and throughout the heat stress event. This and the use of hand-held instruments that recorded detail of the ambient challenge in terms of wet bulb temperature wind speed and direction provided sufficient information to allow for a detailed investigation. It should be noted however, that had additional information not been gathered, the combination of the loggers and the simple twice-daily monitoring of the pens would have been insufficient to properly document the event. Firstly, although the loggers were placed in positions that would enable the wet bulb rise to be calculated (by extrapolation), the loggers were not placed where the mortality from heat stress occurred. Furthermore, the whole incident took place between 1400 hrs and 1800 hrs during which time no pen monitoring would have taken place under “normal” monitoring circumstances. It takes exceptional awareness to collect additional information at a time when most of the focus is quite rightly on the welfare of the animals.
6.0 Discussion This project demonstrated that the use of temperature and relative humidity data loggers on livestock shipments is both practical and feasible. At the very least, data loggers could be used to monitor environmental conditions on the decks of livestock vessels throughout a voyage. Using the onboard environment to establish the linkages between these environmental conditions and animal performance is more challenging. There are many factors that contribute to an animal’s ability to tolerate heat. By using an animal house (or climate rooms) it is possible to fix many of these contributing factors and therefore study (or compare) only those factors under scrutiny. In the onboard environment, many of these factors are continually varying from voyage to voyage (and from time to time within the voyage). Consequently, any attempt to analyse the information collected must factor in a large number of permutations and combinations of environmental and animal variables, all with varying degrees of accuracy. Because of this, it is likely that much data will be required before information collected in the onboard environment can establish direct relationships such as HST and ML. Onboard monitoring does however provide the opportunity to better investigate specific heat stress incidents when they occur. This is likely to provide the biggest incentive to continue onboard monitoring. Strategically placed loggers provide objective information in situations when most of the people involved are understandably focussed on the welfare of the animals.

Pilot monitoring of shipboard environmental conditions and animal performance
Page 15
Even in these situations the information will be “broad brush”, but careful investigation of specific incidents will reveal a considerable amount of meaningful information. To get the most out of the information collected, it will be important to minimise the effects of inaccuracy, subjectivity and any other distorting factors such as the effects of “heat load”.
6.1 Choosing the site of data loggers The single most important consideration is the siting of the loggers. It must be ensured that the environmental information collected by the loggers is truly representative of the air surrounding the animals being monitored. As already mentioned, there are sometimes limited points of attachment within the hold, and this may influence the placement of loggers. It important to realise that temperature can vary considerably within the hold. The wet bulb temperature will be lowest as the air enters the hold via the supply and highest as it leaves the hold via the exhaust. Air leaving the hold can be a full 3-4 °C Wb higher than the air entering the hold. The placement of the loggers therefore becomes crucial. The ventilation systems designed for livestock vessels are dynamic, with large quantities of air passing through the hold in any set time period. Air is in the hold for a relatively short time, (only a minute in a deck with 60 exchanges per hour). The aim of the ventilation system is to facilitate the addition of heat and water vapour to the air in the relatively short period of time it is in the hold. In vessels that deliver the air from the walls of the vessel, there is often a significant distance between the point of supply and the point of exhaust. Consequently there may be slight differences between pens and little variation within a pen. In these circumstances the placement of the logger is less crucial. Similarly, open decks may be subject to a wet bulb rise over the entire length or breadth of the vessel and will demonstrate less variation between and within pens. The placement of the logger is less crucial in these circumstances. In vessels that deliver air into one pen and exhaust it from another pen there will be big differences between the wet bulb temperature within a “supply” pen and the wet bulb temperature within an adjacent “exhaust” pen. Correspondingly there will be considerable variations within the pen. There will be even more variation within pens in vessels that deliver air directly into every pen. In these vessels the positioning of the loggers is crucial to ensure that the environmental information measured by the loggers is representative of the air surrounding the livestock being monitored. Animals are free to move around the pens. This means that the environment being experienced by the animal being monitored may not really be known. This is even more the case on vessels that do not practice “penning off” and allow animals the run of both supply and exhaust pens.
6.2 Heat production The ability of an animal to cope with heat depends on the ventilation system removing the heat produced. Heat production is a function of the stocking density and the heat produced by each individual animal.

Pilot monitoring of shipboard environmental conditions and animal performance
Page 16
The estimate of heat production is important because it is part of the function used to calculate the estimated wet bulb rise in the industry HS model (Stacey, 2000, 2003). The model used assumes this wet bulb rise to ultimately determine a “probable” deck wet bulb temperature. If this exceeds the pre-determined HST for the category of livestock involved, stocking density adjustments are required. Because stocking density is the “adjuster” in the model, and because the tolerance falls within a fairly narrow band of wet bulb temperatures, estimates of heat production need to be accurate.
6.2.1 Stocking density If the information collected by onboard monitoring is to be used to establish HST for different categories of livestock, it is important that the estimated weights be as accurate as possible for animals within the pens under observation and for the entire deck. The same applies if the information is to be used to validate the assumptions of the HS model. In practice, the weights of animals in the pen being monitored are usually estimates. Whereas the weights of lines of cattle may be known, the actual weights of the animals within a pen may not be known. Furthermore It is not always clear as to whether the known weights have been adjusted for curfew or not. This may lead to differences of up to 6% of the true weight of the animal.
6.2.2 Breed type Bos indicus cattle have a lower metabolic rate and produce significantly less heat than Bos taurus cattle. The industry HSRA model factors the heat production from Bos taurus cattle at 2.4 W per kg body weight, whereas it factors the heat production from Bos indicus cattle at 2.0 W per kg. In practice, many cattle involved in the live export trade are Bos indicus cross, (rather than pure bred). To cater for this, the heat stress model breaks the breed type into a number of arbitrary categories. These are Bos taurus, Bos indicus, 25% Bos indicus and 50% Bos indicus. It is suggested that participants in any future data logging use these same arbitrary categories when describing the livestock in the pens being monitored.
6.2.3 Feed intake Another factor to affect heat production is feed intake (and to a lesser extent the type of feed). Up to 25% of heat production is attributable to the heat produced by the digestion of feed. The heat produced by the digestion of roughage is reputedly higher than non-roughage feed sources however, it is also less dense which restricts intake. Recent research has shown that effects of the heat produced by digestion can be reduced by feeding smaller quantities more frequently during a 24 hr period (Gaughan et al., 2004a, 2004b). Participants in the monitoring should note the time of feeding because this may influence the panting (or heat stress) scores depending on when they are measured.
6.2.4 Other factors Other factors that affect heat production are the animal’s body temperature, pregnancy, oestrus and also the use of growth promotants (Gaughan et al., 2004a, 2004b). It is not clear whether acclimatisation affects heat production but it should be noted that many different estimates of heat production are reported in the literature (Gaughan et al., 2004a, 2004b).

Pilot monitoring of shipboard environmental conditions and animal performance
Page 17
6.3 Heat tolerance
6.3.1 Breed type Breed type is a major factor in heat tolerance. As previously mentioned, the industry heat stress model places breed type into a number of arbitrary categories. It is sensible that those participating in the project make the same distinctions. For crossbred animals, the distinction should be made on phenotype (what they look like) rather than on genotype (their genetic background). It is considered that tolerance is more likely to follow phenotype than genotype.
6.3.2 Acclimatisation Acclimatisation has been shown to be a major factor in relation to heat tolerance. The industry HS model divides Australia into a number of zones. The climate in each of these zones is then assumed for each month of the year. Animals that are sourced from properties within these zones are assumed to have experienced the corresponding climate prior to shipping. In the absence of more specific information, it is suggested that participants in the data logging project also use these prescribed zones when describing the origins and preparation history of the livestock. It is not always possible to be precise about the preparation history of the livestock being monitored. In many instances the monitoring sites may not be chosen until a couple of days into the voyage, particularly on unfamiliar vessels. By this time it may be difficult to collect accurate information about the preparation history of the livestock involved. Where animals are collected in an assembly area prior to loading, their identity can become lost and mobs may consist of livestock assembled from a range of regions.
6.3.3 Ventilation system The aim of the ventilation system is to facilitate the transfer of heat and water vapour from the animal to the air as it moves through the ship’s hold. There are two aspects to this. The first is the amount of air being delivered (airflow) and the second is the way in which the air is delivered (air delivery). Airflow is measured as air exchanges per hour (eph) or as Pen Air Turnover (PAT) in cubic metres per square metre of pen space per hour (or m/hr). Pen air turnover is a better measure since it links airflow to the pen space within the hold and factors both the deck height and the proportion of pen space relative to the total deck area. Air delivery varies considerably between ships. Some vessels deliver air from the walls of the hold and rely on a “drift velocity” to move air from supply to exhaust. Other vessels go to considerable trouble to jet air directly into pens. The benefits of direct jetting are considerable (Stacey 2000, 2004). Vessels that deliver air directly into pens will have a much greater “cooling power” than vessels without direct jetting (assuming an equivalent airflow).

Pilot monitoring of shipboard environmental conditions and animal performance
Page 18
6.4 Use of a panting and/or heat stress score The shortcomings of using respiratory rate as an indicator of heat stress have been outlined in section 4.1.7 of this report. The use of panting score (and/or heat stress score) has proven to be a far more practical and robust measure (section 4.1.8). However it is a subjective measure and every effort should be made to ensure consistency among those undertaking the measurements.
6.5 Calibration and accuracy of measuring devices Most of the equipment requires regular calibration in clean fresh air. There are many times in a voyage when this is very difficult to find. Examples include when nil wind conditions are experienced with a following breeze, or when in port. Ironically these are the very times when accurate measurements are needed. Confidence in the accuracy of the equipment is also important. A further aspect relating to accuracy of recorded information is the re-ingestion of exhaust air into air intakes. This is a problem for all livestock vessels and much underestimated. The re-ingestion of exhaust air explains many of the “moving hot spots” described onboard livestock vessels.
6.6 Calibration of open decks Although some vessels provide open decks with a supplementary airflow, most open decks rely on a prevailing wind to provide adequate ventilation. In some cases, it may be just the ship’s speed that provides sufficient wind to move air through the deck. At other times a following breeze may negate the breeze generated by the ship’s speed and there may be only limited air moving through the deck. Apart from the prevailing wind, the amount of air that moves through an open deck is influenced by the infrastructure itself. A relatively open infrastructure with high deck height will allow a far greater proportion of the air to penetrate and move through the open deck. In fact most of the air goes around the infrastructure, particularly a solid infrastructure with fully stocked double tiers. The amount of air that flows through an open deck is a function of the wind speed and the degree of resistance caused by the infrastructure. Because of this, open decks experience a far greater range of deck conditions than is seen on enclosed decks. Under favourable conditions the wet bulb rise across open decks can be almost negligible and good conditions can be experienced throughout the deck. Under unfavourable conditions the wet bulb rise across the decks can be high and extreme conditions can be experienced on the lee side of the deck where air is exhausted. For practical purposes, it can be assumed that if the wind speed doubles, the wet bulb rise across the open deck will be halved. This assumes that there is no “threshold effect” associated with air moving through the open deck. Furthermore, for any chosen wind speed, air moving across a transverse section of the open deck will generate a far lower wet bulb rise than if it moves through the entire longitudinal length of the deck. It became evident through the course of the pilot project that although most Captains and ship’s crew had a good understanding of the wet bulb rise, very few had objective information about its cause and effect. The calibration of an open deck is a relatively simple matter. There are only three important cross-sections involved. These are the longitudinal cross-section, the diagonal cross-section

Pilot monitoring of shipboard environmental conditions and animal performance
Page 19
and the transverse cross-section. Because it can be assumed that the wet bulb rise across the deck is directly proportional to the wind speed, it is only necessary to measure the wet bulb rise associated with one wind speed for each of these wind directions. The wet bulb rise for the full range of wind speeds can be extrapolated from these measurements. Furthermore, the wet bulb rise associated with the full complement of wind directions can also be extrapolated from the measurements taken. The important thing to note is that since most of the air goes around the infrastructure, it does not follow that the measured wind speed will produce an effective breeze through the deck at the same velocity. The industry HS model mentions the “effective” cross breeze required to maintain the deck wet bulb temperature below certain levels. Without proper “calibration” of the open deck it is not possible to know how this equates to a specific wind speed (and/or direction). The use of strategically placed loggers can measure the wet bulb rise associated with any wind speed and direction. This enables the open deck to be easily “calibrated”. It is suggested that the calibration of open decks be part of “developing a better understanding of the ventilation systems” (see 7.4, recommendation 7). The approach described above is relatively “broad brush” and the understanding of air movement through open decks may be require fine-tuning, however the procedure described above represents a good starting point.
6.7 Ammonia levels Ammonia levels were measured on a twice-daily basis throughout the voyage. This provided a record of the environmental conditions onboard. Ammonia production can be independent of heat and levels can be independent of ventilation. Ammonia production from the sheep pad will vary as the pad develops over the course of the voyage. The pilot monitoring project was primarily concerned with heat stress and consequently the monitoring undertaken was not designed to establish major links between ammonia levels and the factors that might influence ammonia production. Insufficient information was collected to determine measures of TWA and STEL, however the project provided valuable experience in relation to the use of ammonia measuring equipment. It is suggested that investigation into ammonia levels onboard livestock vessels be handled as a “stand alone” project and approached in a similar way to that of heat stress. This would require the use of loggers to record environmental information, establish direct linkages to factors affecting ammonia production and determine how ammonia levels affect animal performance. This work could be used to confirm the assumptions of earlier work (Costa, 2003)
6.8 Participants and training Monitoring was undertaken by veterinarians and stockmen travelling on long-haul voyages to the Middle East. Initially it was envisaged that the monitoring be undertaken solely by stockmen, however, an industry development that required a veterinarian to travel on all long-haul voyages meant that in some cases it was more practical for veterinarians to undertake the monitoring. Prior to each voyage, the veterinarians/stockmen involved were instructed on how to use the equipment and on the nature of the information required and given written instructions as to the duties expected of them (see Appendix 2). The basic instructions to undertake the monitoring are quite straight forward, however, it was also envisaged that more comprehensive training could be provided. This could take the form of a two-day workshop designed specifically to address the subject of heat stress and ventilation. It

Pilot monitoring of shipboard environmental conditions and animal performance
Page 20
could also take the form of a self-paced learning product contained on a CD or similar teaching medium. The aim of the instruction would be to better prepare participants to document specific heat stress incidents when they occur. The training would be at a higher level than that received at the Stockman’s Training and Accreditation Course. As previously mentioned, it takes exceptional awareness and a cool head to properly document a heat stress incident when it occurs, especially since the primary focus is on the welfare of the animals.
7.0 Recommendations
7.1 Onboard data loggers to establish direct linkages The primary aim of the monitoring project was to determine if shipboard monitoring of the environment and livestock can assist in validating the HST and ML for each of the livestock types involved in the trade. The first and most important recommendation is that the existing data set be subjected to statistical analyses to determine the extent to which it is possible to extract statistically significant conclusions. It is quite possible that the large number of contributing factors, the inherent subjectivity and the extent of possible inaccuracy make it impossible to establish direct linkages (such as HST and ML) from the data set. Even if direct linkages can be established, it is also quite possible that it may take several years of continuous monitoring before sufficient data is generated to draw statistically significant conclusions. Recommendation 1. Subject collected data to statistical analysis to determine the extent to which it is possible to draw statistically significant conclusions. Given that statistically significant conclusions can be drawn from data collected, it is recommended that onboard monitoring be continued on long-haul voyages to establish (or confirm) the direct linkages between environmental conditions and animal performance. This would apply in particular to such measures as the HST and ML for all the categories of livestock involved in the long-haul trade. Recommendation 2. Undertake ongoing monitoring on long-haul voyages with the aim to establish (or confirm) direct linkages between environmental conditions and animal performance. In particular this would apply to such measures as the HST and ML*. (* Subject to recommendation 1.)

Pilot monitoring of shipboard environmental conditions and animal performance
Page 21
It is suggested that a person be appointed to co-ordinate the activities, set up the data loggers, train participants, download data and collate it for subsequent analysis. The activities should be co-ordinated with the stockman’s program, particularly when stockmen are being asked to collect the information. It should be recognised that the monitoring depends on the voluntary co-operation of stockmen, the exporter and the ship owner, and this consent and co-operation should not be taken for granted. It is recommended that the monitoring not be linked to daily reporting, which relies on representative information and describes conditions onboard in a “broad brush” manner. The Information that is required by the monitoring project is far more specific. It is desirable that participants in the monitoring have their own portable computer and are prepared to enter data themselves. An ongoing monitoring project requiring manual entry of data on the completion of each voyage would be too unwieldy to manage. It is suggested that the focus of the project be on lines of livestock and that these be identified on an opportunistic basis. With regard to the establishment of direct linkages, only voyages that are carrying livestock of interest should be monitored. When “lines of interest” are identified, a full preparation history should be determined prior to them sailing, along with details of where it is intended that these animals be stowed. It should be ensured that the pens selected are conducive to monitoring. It is not envisaged that all stockmen and/or veterinarians be involved in monitoring. It is suggested that the monitoring be initiated with a small nucleus of participants, all of whom have received training in not only how to operate the equipment, but also in other aspects of heat stress and ventilation. It is envisaged that this be expanded on an opportunistic basis until onboard monitoring is commonplace on long-haul voyages. It is important that the deck, pen and livestock information collected be accurate. This may require information to be collected prior to sailing; since communication from the vessel after it has left port is difficult. Once onboard it is important that pen integrity be maintained for the entire voyage. This may require an extraordinary commitment from the ship’s crew to ensure that pen integrity is not compromised by commercial priorities. The pen being monitored should be properly “penned off”. Recommendation 3. Appoint a person to set up data loggers, train and co-ordinate participants, download and collate data for subsequent analysis. In addition the co-ordinator’s duties would be to: • Identify lines of livestock prior to sailing. • Collect a comprehensive preparation history prior to sailing. • Ensure that the stockman/veterinarian have received appropriate training. • Ensure that the stowage of livestock corresponds to a suitable site selection for
data loggers and enables “representative” monitoring of selected pen. • Ensure that pen integrity is maintained throughout the voyage. • Ensure that ventilation onboard is properly understood and described. • Validate stated pen air turnovers where possible. • Organise the investigation of specific heat stress incidents when they occur.

Pilot monitoring of shipboard environmental conditions and animal performance
Page 22
Panting score has proved to be a useful indicator of heat stress (and/or heat tolerance). Because of its subjectivity, it is recommended that inexperienced participant be supported with guidelines regarding respiratory rate to assist them in maintaining recording consistency. With practice, respiratory rate can be disregarded. Recommendation 4. Utilise panting score as the primary indicator of heat stress (and/or heat tolerance).
7.2 Data loggers to record environmental conditions Regardless of the outcome of the data analyses, ongoing monitoring can be justified on the following grounds. Firstly it records the environmental conditions onboard the vessel for the entire voyage. This is a useful parameter, but becomes even more useful in investigating specific heat stress incidents. Ongoing monitoring provides far more detail than can ordinarily be expected when investigating a heat stress incident. With appropriate training, participants in the monitoring project are in a position to capture appropriate information when a heat stress incident occurs. As previously mentioned, this takes exceptional awareness. A special procedure should be established to investigate heat stress incidents. This is because the siting of data loggers may not necessarily provide all the information required. A proper debriefing of participants would be part of this investigation. It is recommended that this investigation be mounted from a platform of research, rather than as a regulatory function. Many of these investigations may occur in situations where mortality limits set by authorities have not been exceeded (More, 2002). Recommendation 5. Undertake ongoing monitoring on long-haul voyages to provide a record of the environmental conditions onboard. Establish special procedures to investigate specific heat stress incidents if and when they occur.
Pilot monitoring of shipboard environmental conditions and animal performance
Page 23
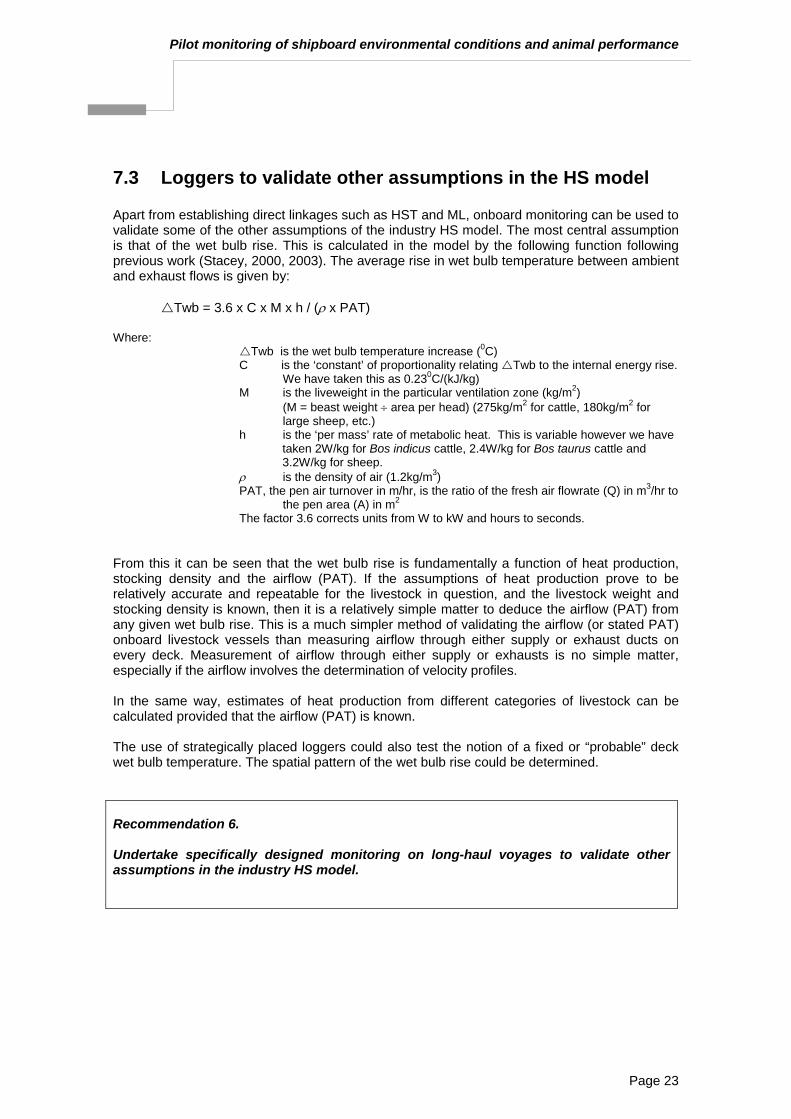
7.3 Loggers to validate other assumptions in the HS model Apart from establishing direct linkages such as HST and ML, onboard monitoring can be used to validate some of the other assumptions of the industry HS model. The most central assumption is that of the wet bulb rise. This is calculated in the model by the following function following previous work (Stacey, 2000, 2003). The average rise in wet bulb temperature between ambient and exhaust flows is given by:
Twb = 3.6 x C x M x h / (ρ x PAT) Where: Twb is the wet bulb temperature increase (0C)
C is the ‘constant’ of proportionality relating Twb to the internal energy rise. We have taken this as 0.230C/(kJ/kg)
M is the liveweight in the particular ventilation zone (kg/m2) (M = beast weight ÷ area per head) (275kg/m2 for cattle, 180kg/m2 for
large sheep, etc.) h is the ‘per mass’ rate of metabolic heat. This is variable however we have
taken 2W/kg for Bos indicus cattle, 2.4W/kg for Bos taurus cattle and 3.2W/kg for sheep.
ρ is the density of air (1.2kg/m3) PAT, the pen air turnover in m/hr, is the ratio of the fresh air flowrate (Q) in m3/hr to
the pen area (A) in m2 The factor 3.6 corrects units from W to kW and hours to seconds.
From this it can be seen that the wet bulb rise is fundamentally a function of heat production, stocking density and the airflow (PAT). If the assumptions of heat production prove to be relatively accurate and repeatable for the livestock in question, and the livestock weight and stocking density is known, then it is a relatively simple matter to deduce the airflow (PAT) from any given wet bulb rise. This is a much simpler method of validating the airflow (or stated PAT) onboard livestock vessels than measuring airflow through either supply or exhaust ducts on every deck. Measurement of airflow through either supply or exhausts is no simple matter, especially if the airflow involves the determination of velocity profiles. In the same way, estimates of heat production from different categories of livestock can be calculated provided that the airflow (PAT) is known. The use of strategically placed loggers could also test the notion of a fixed or “probable” deck wet bulb temperature. The spatial pattern of the wet bulb rise could be determined. Recommendation 6. Undertake specifically designed monitoring on long-haul voyages to validate other assumptions in the industry HS model.

Pilot monitoring of shipboard environmental conditions and animal performance
Page 24
7.4 Developing a better understanding of the ventilation system The use of onboard monitoring could be used to develop a better understanding of the onboard ventilation system. Strategically positioned data loggers could assist in quantifying the benefits of greater airflow as well as the benefits of direct jetting. This would require a properly structured investigation and would likely to be part of a specifically designed research project. It is likely to be separate to the ongoing monitoring described above. This could include the calibration of open decks described earlier. A further development would be to use data loggers to determine heat stress thresholds based on the environmental challenge rather than on localised deck temperatures. This incorporates both the livestock factors as well as the features of the livestock vessel. The vessel factors would include the airflow (PAT), the air delivery system, the positioning of exhaust outlets and supply intakes. From this it could be established that a vessel carrying a certain type of livestock would be capable of withstanding an environmental challenge of “so many” degrees wet bulb. Recommendation 7. Undertake specifically designed monitoring on long-haul voyages to develop a better understanding of the onboard ventilation system.
7.5 Other recommendations In all of the above discussion it should be clear that onboard monitoring is best suited to confirming assumptions stemming from more controlled research. For example it is envisaged that many of the initial heat stress thresholds will first be determined in the animal house where more of the variables can be controlled. Onboard monitoring is likely to be used to confirm the findings of this preliminary research (Barnes et al., 2004). The pilot monitoring utilised a fairly narrow range of equipment. As technology develops, new equipment becomes available. Some of this may have applications to the livestock export industry. Ongoing monitoring should have a conscious policy of evaluating equipment that has features matching the aims of the associated project. This may include the opportunity to evaluate equipment that has the ability to monitor the livestock holds on a “real-time” basis. In fact, it may be possible to compare a predicted deck wet bulb temperature (based on a known ambient challenge and knowledge of the vessel), to an actual deck wet bulb temperature based on real time monitoring. Recommendation 8. Use the “animal house” to establish initial values. Onboard monitoring is better suited to confirming these in a real environment. Continue to evaluate new equipment and technology.

Pilot monitoring of shipboard environmental conditions and animal performance
Page 25
8.0 Conclusions Onboard monitoring can be used to record baseline environmental conditions, establish direct linkages and allow more detailed investigation of heat stress incidents. It may be used also to validate the assumptions of the industry HSRA model. It is however frustrated by subjectivity and the large number of contributing factors. Nevertheless it has been shown to be practical and achievable using existing industry resources.

Pilot monitoring of shipboard environmental conditions and animal performance
Page 26
9.0 References Barnes, A., Beatty, D., Taylor E., Stockman, C., Maloney, S., & McCarthy, M., 2004. The physiology of heat stress in cattle and sheep – the efficacy of electrolyte replacement therapy. Final report prepared for Meat and Livestock Australia, March 2004. LIVE.209, Murdoch University, Murdoch, Western Australia. Costa, N., 2003. Determining critical levels of atmospheric ammonia levels for cattle, sheep and goats. Literature review prepared for Meat and Livestock Australia, December 2003. Project LIVE.218, Murdoch University, Murdoch, Western Australia. Gaughan, J.B., Binns, P. & Lott, S., 2004a. Wetting cattle to alleviate heat stress on ships. Literature review prepared for Meat and Livestock Australia, July 2004. Project LIVE.219, Queensland University and E.A. Systems, Armidale N.S.W. Gaughan, J.B., Binns, P. & Gordon, G., 2004b. Wetting cattle to alleviate heat stress on ships. Final Reports for both Stages 1 and 2 prepared for Meat and Livestock Australia, October 2004. Project LIVE.219, Queensland University and E.A. Systems, Armidale N.S.W. Hahn, G.L., Johnson H.D., Shanklin M. & Kibler H.H., 1965. Inspired-air cooling for lactating dairy cows in a hot environment. Transactions of the ASEA. 8:332-334,337. More, S.J., 2002. Investigation of cattle deaths during voyage 1 of the MV Becrux. Final Report prepared for Meat and Livestock Australia, Revision A, 23rd September 2002, AusVet Animal Health Services, Brisbane. Stacey, C., 2000. Investigations of ventilation efficacy on livestock vessels. Literature review prepared for Meat and Livestock Australia, Project SBMR.002, Report No. 3472/00, MAMIC Pty Ltd, Brisbane. Stacey, C., 2001. Investigations of ventilation efficacy on livestock vessels. Final report prepared for Meat and Livestock Australia, Revision C, 14th May 2002. Project SBMR.002, Report No. 3472/00, MAMIC Pty Ltd, Brisbane. Stacey, C., 2002. Practical ventilation measures for livestock vessels. Report prepared for Meat and Livestock Australia and Livecorp, Revision B, 16th May 2002. Project Live.211, MAMIC Pty Ltd, Brisbane. Stacey, C., 2003. Development of a heat stress risk management model. Final report prepared for Meat and Livestock Australia, Revision D, 14th May 2003. Project LIVE.116, MAMIC Pty Ltd, Brisbane. Stacey, C. & More, S.J., 2002a. Investigation of ventilation efficacy on live sheep vessels. Literature review prepared for Meat and Livestock Australia, Revision C, 15th July 2002. Project LIVE.212, MAMIC Pty Ltd, Brisbane. Stacey, C. & More, S.J., 2002b. Investigation of ventilation efficacy on live sheep vessels. Reports prepared for Meat and Livestock Australia, Revision B, 26th July 2002. Project LIVE.212, MAMIC Pty Ltd, Brisbane. “Tips and Tools” Meat and Livestock Australia (MLA), On Farm “Tips and Tools”, 2004. Wetting cattle to alleviate heat stress on ships. HW.02 April 2004, based on the research results from LIVE.219.

Pilot monitoring of shipboard environmental conditions and animal performance
Page 27
Appendix 1
Example of Written Instructions used in the Project DATE: 24th May 2004. TO: Person / Vessel FROM: Michael McCarthy RE: Onboard R&D Could you please undertake the following on behalf of the data logging research and development project. • With the assistance of either David Beatty or myself, choose suitable sites to place 6-12 data loggers.
Note the data logger number and site position. • Choose the same number of adjacent pens to monitor animal response. • Describe the position of these pens in relation to the overall ventilation configuration, the proximity to
supply and the proximity to exhaust and the presence or absence of direct jetting or airflow above the livestock.
• Note the stated pen air turnover for each deck (or part deck) involved. • Note the stocking density of both the pens and overall decks involved. • Describe the animal breed, type, coat (or wool) length, body condition score and any other factor that
may affect the animal’s tolerance to heat. • Briefly describe the animals’ preparation history (if known), particularly in relation to acclimatisation
and assembly. • On a twice daily basis monitor ammonia levels (in or near) the selected pens. • Using the guidelines outlined in the “Tips and Tools” circular on the wetting of cattle, select a panting
score that represents the animals within the pen. This applies to sheep also although the guidelines are less clear.
• Support these measurements with a representative respiratory rate and/or respiratory character, and
on a similar basis, allocate a representative heat stress score (based on the guidelines in the circular). • Collect (if possible), the 4-hourly ambient wet bulb temperatures from the bridge measured for the
entirety of the voyage as well as the logged wind speed and direction relative to the ship. • Note the clock retard times and note any washing events as they occur and/or describe the condition
of the bedding in the pens. • Enter the information into the spreadsheet provided, and return the data loggers and spreadsheet
information to David Beatty at Murdoch University as soon as is possible after the voyage. Many thanks, Michael McCarthy

Pilot monitoring of shipboard environmental conditions and animal performance
Page 28
Appendix 2
Instructions to be included in Stockman’s Manual Monitoring environmental conditions and animal performance- Instruction’s for stockmen and vets travelling on long haul voyages. Stockmen on long haul voyages may, from time to time be asked to undertake monitoring to help establish links between shipboard environmental conditions and animal performance. The aim, in most cases, will be to establish heat stress thresholds (HST) for the livestock types involved in the livestock export trade. These make a major contribution to the assumptions used in the industry heat stress risk assessment (HS) model. Monitoring may also be used to develop a better understanding of ventilation systems or to provide more detailed information in the event of a heat stress incident. Environmental monitoring is usually achieved by the use of temperature and humidity dataloggers. Animal monitoring is achieved by directly observing animals at specifically chosen sites. Because animal heat tolerance has many contributing factors, stockmen will be asked to collect an array of information relating to the livestock and the vessel’s ventilation system. This ensures that the collected data can be properly interpreted. A project co-ordinator will provide a set of written instructions outlining the information required. To participate in the monitoring program, stockmen will be asked to undertake the following tasks. • Identify the line of livestock of interest for heat stress observations • Ensure these livestock are stowed in a suitable area • Select suitable sites for the dataloggers • Collect information relating to the livestock, the vessel and prevailing weather conditions • Undertake a series of measurements at these sites on a twice daily basis as a minimum • Return loggers and information to the project co-ordinator. It is important that the pens selected for monitoring are representative of the ventilation system onboard. It is also important that the logger is situated in a position that allows it to measure air that is representative of the air surrounding the livestock being monitored. The preparation history of the livestock being monitored should have been collected before sailing. The most important aspect of this is to determine the extent of acclimatisation. The industry HSRA makes assumptions about the temperatures experienced based on a zone of origin system. Participants in the monitoring should be familiar with these zones. They are described in the final report of LIVE.116 (Stacey, 2003). Other livestock factors that should be recorded are the breed, the type, fatness, age, coat (or wool) length and weight. The weight of the livestock should be compared to the pen area to enable the stocking density to be compared to the density tables for that particular time of the year, load port and destination. These are contained in the Stockman’s Handbook and the LEAP Standards. The ventilation system should be described, with reference to the airflow (pen air turnover (PAT) for the deck in question and the extent of direct jetting. The proximity of the logger to both the supply and exhaust should be noted. The information collected should be supported by some of the routine measurements taken by the ship’s crew. This includes the 4-hourly bridge ambient temperature (both dry bulb and wet bulb) and the wind strength and direction relative to the

Pilot monitoring of shipboard environmental conditions and animal performance
Page 29
ship. The wind strength is usually recorded as force on the Beaufort Scale (1-12), with the “true” wind direction. The ship’s heading may be required to convert this to an apparent reading. Animal performance is measured as the panting score. The use of the panting score in cattle is described in the “Tips and Tool” circular entitled “Wetting cattle to alleviate heat stress on ships” (HW.02). Participants will be given a copy of this circular prior to sailing. The panting score for sheep uses the same guidelines although the respiratory rates will be significantly higher for each corresponding score. These are better described in the final report “Pilot monitoring of environmental conditions and animal performance”, (McCarthy, 2005). The panting score is used as an indicator of heat stress. Participants in the monitoring program will be asked to monitor the livestock in the pens on a twice-daily basis as a minimum. Panting score can be supported with respiratory rate, respiratory character and/or heat stress score. These are useful to the uninitiated but with practice it is likely that the panting score is the only measurement required. Sometimes ammonia levels may be required. Participants will be shown how to operate both the loggers and the other measuring equipment prior to sailing. The loggers are very straightforward with the only requirement being to note the time they are erected and taken down. Some of the other equipment requires more instruction, particularly on how to calibrate with fresh air. Participants will be provided with a template that can be used to enter the collected data. Participants may also be asked to complete further training in the area of heat stress and ventilation. The aim of this is to better prepare participants to collect information in the advent of a heat stress incident. Documenting a heat stress incident requires exceptional awareness and a cool head at a time when most of the focus is understandably on the welfare of the livestock involved. It is desirable that participants in the monitoring have their own portable computer and are prepared to enter the data whilst onboard. This is not essential but it streamlines the process considerably. Participants are asked to forward both the loggers and the collected information to the project co-ordinator immediately on their return to Australia. It should be noted that there is currently no extra remuneration for collecting this information. Participation will generally come as a direction from the exporter who is employing you. As such it is recognised that from time to time, the monitoring may become secondary to other commercial priorities. In the interim both stockmen and veterinarians participating in the project will be making a significant contribution toward the overall research and development effort.

Pilot monitoring of shipboard environmental conditions and animal performance
Page 30
Appendix 3
Example of Recording Template