pic nutrient specifications...
TRANSCRIPT

PIC® 2016
NUTRIENT SPECIFICATIONS MANUAL
NEVER STOP IMPROVING

This manual is build up in three sections that lays out the fundamentals of
our nutrition recommendation: first, it summarizes the principles of diet
formulation; secondly, it lays out how different nutritional components can
help fulfill those dietary formulation principles; and then it details how the
basic diets vary for pigs depending on phase of production.
After these sections that lay out the fundamentals of our nutrition
recommendation, we have included some tools and deep dives in specific
topics that will help you optimize the diets for your pigs.
Finally, you find the nutrient specification tables that you can use to
optimize your diets for successful nutrition of PIC pigs. Recommendations
are based on published research, PIC internal research, research from
universities, and commercial large scale designed experiments. The nutrient
specifications have been validated in commercial environments. The
National Swine Nutrition Guide (2010) and National Research Council (2012)
publications serve as the basis for certain information. Concepts and the
basis for recommendations are discussed in greater detail in other technical
memos.
This is a dynamic manual. PIC will continue to update this manual as new
research becomes available and share them with you through nutrition
updates and the PIC website. Access http://na.picgenus.com/enewsletter_
sign_up.aspx to sign up.
WELCOME TO THE 2016 EDITION OF THE PIC NUTRIENT SPECIFICATIONS MANUAL

A. PRINCIPLES AND DECISION MAKING IN DIET FORMULATION ................. A1B. ENERGY......................... ...................................................................................B1 The importance of energy and ingredient loading values ............B3 Response to energy levels in finishing diets ....................................B5SECTION 2: NUTRITIONAL COMPONENTSC. PROTEIN AND AMINO ACIDS ........................................................................C1 Expressing AA requirements .............................................................C1 Formulating to an ideal amino acid pattern ...................................C1D. MACRO MINERALS ....................................................................................... D1E. TRACE MINERALS AND VITAMINS ................................................................E1F. WATER...............................................................................................................F1G. FEED ADDITIVES ............................................................................................ G1 Phytase ................................................................................................ G1 L-carnitine ........................................................................................... G2 Xylanase .............................................................................................. G2H. UPPER LIMITS OF USAGE FOR FEED INGREDIENTS .................................... H1SECTION 3: NUTRITION PROGRAM BY PHASE OF PRODUCTIONI. THE BASIC NUTRITIONAL PROGRAM ............................................................. I1 Mature boars ........................................................................................ I1 Gilt development ................................................................................. I2 Gestating gilt and sow ........................................................................ I3 Lactating sow ....................................................................................... I6 Weaned sow ....................................................................................... I10 Nursery pig ......................................................................................... I11 Finishing pig ....................................................................................... I12J. SOW FEEDING MILESTONES ............................................................................J1K. DYNAMIC DECISION MAKING TOOLS..........................................................K1 PIC adjusted caloric efficiency calculator by sireline .......................K1 Economic model for optimum tryptophan:lysine ratio for nursery and finishing pigs ..............................................................K1 Optimum Corn DDGS calculator .......................................................K1L. CARCASS QUALITY ......................................................................................... L1 High-fiber ingredients on carcass yield ............................................ L1 Pork fat quality ................................................................................... L2M. FEEDINGS PIC PIGS UNDER SPECIFIC PROGRAMS .....................................M1N. FEED MANUFACTURING ............................................................................... N1 Particle size ......................................................................................... N1 Pellet vs. meal ..................................................................................... N3O. FEEDING SYSTEMS, FEEDER SPACE, DRINKING SYSTEMS ......................... O1APPENDIX: NUTRITION SPECIFICATION TABLESP. NUTRIENT SPECIFICATION TABLES .................................................................P1 PIC nutrient specifications for sexually active boars .......................P1 PIC nutrient specifications for gilt development .............................P2 PIC nutrient specifications for gestating gilts and sows in ideal body condition.......................................................................P3 PIC nutrient specifications for lactating gilts and sows ..................P4 PIC nutrient specifications for nursery pigs......................................P5 PIC nutrient specifications for finishing gilts ...................................P6 PIC nutrient specifications for finishing barrows ............................P7Q. BIBLIOGRAPHY .............................................................................................. Q1R. ACKNOWLEDGEMENTS .................................................................................R1
SECTION 1: PRINCIPLES OF DIET FORMULATION
NEVER STOP IMPROVING

iv

A1
Once the principles of diet formulation are understood, there are multiple strategies that can be taken for diet formulation. Production systems around the world will typically decide between a combination of maximizing animal performance, minimize cost of production, and maximize profitability.
From a macro level, once growth and feed intake in the specific production system are known, the first step in diet formulation is to define the most economical net energy (NE) level. The second step is determining the standardized ileal digestible (SID) lysine (Lys) dietary concentration based on the SID Lys:NE ratio. Next, the other SID amino acids (AA) are defined as a ratio to SID Lys. Finally, the levels of macro minerals, trace minerals and vitamins are defined to achieve the requirement in amount of nutrients (i.e., grams, milligrams, or International Units) per pig per day.
THE ECONOMIC IMPLICATIONS OF FIXED TIME VS. FIXED WEIGHTA key concept to consider when formulating diets for a specific production system is to understand if the system is marketing pigs on a fixed time or a fixed weight basis. Fixed time means that the system does not have extra or flexible space in the production flow. For example, when a finishing barn reaches 120 days of placement, the pigs are marketed and the barn is emptied for the next group of pigs. Fixed time can also be explained as being space short and fixed weight as space long. Fixed weight program, however, means that the system has some flexible amount of space available in the production flow and, thus, pigs can be left in the barn until they reach a target weight optimum for the given carcass value payment structure of the processing plant. The difference between these
Section A:
PRINCIPLES AND DECISION MAKING IN DIET FORMULATION
NEVER STOP IMPROVING

A2
two scenarios is important because it changes the relative value of growth rate. The value of weight gain in a fixed time system is more valuable given the fixed constraint on number of growing days available; however, in the fixed weight system, pigs can stay in the barn at a fixed space cost (i.e., $0.11/pig/day) and, therefore, the economic value of weight gain by a given nutritional or management strategy is smaller compared to a fixed time scenario. Production systems will often be on a fixed weight basis during winter when pigs are growing at a faster rate and on a fixed time basis during summer when pigs are growing at a slower rate. The important point is that these two scenarios represent the range of economic optimums and evaluating both scenarios can be an effective tool for evaluating economic sensitivity of dietary changes.
The concept of optimum nutrient levels to maximize profitability in a fixed time program relative to fixed weight scenario is illustrated in Figure A1. Tryptophan (Trp) to Lys ratio can have a significant impact on growth rate. In this specific scenario, varying tryptophan to Lys ratio has a much larger economic impact on a fixed time system than a fixed weight system simply because weight gain offers a greater marginal economic return compared to the fixed weight scenario. For additional information on the value of alternative Trp to Lys ratios, please visit http://www.lysine.com/en/tech-info/TrpLys.aspx to download a free dynamic economic calculator for the most economic Trp to Lys ratio specific to a production system.
FIGURE A1. STANDARDIZED ILEAL DIGESTIBLE TRYPTOPHAN TO LYSINE RATIO, %Standardized ileal digestible (SID) tryptophan:lysine ratio for maximum profit on a fixed time and fixed weight basis (PIC 337 × 1050; Kansas State University and Ajinomoto Heartland, 2016).
STRATEGIES FOR DIET FORMULATIONThere are multiple strategies, or targets, that are commonly used for diet formulation. Some of the commonly used approaches are:
• Growth performance basis• Maximize average daily gain (ADG)• Minimize feed efficiency (F/G)
• Cost reduction basis• Minimize cost per kg of diet• Minimize feed cost per kg of gain
• Profit maximization basis• Maximize income over feed cost (IOFC)• Maximize income over feed and facility costs (IOFFC)• Maximize income over total cost (live or carcass)
15.5 16.5 17.5 18.5 19.5 20.5 21.5
Fixed weight
Fixed time
$0
-$1
-$2
-$3
-$4
-$5
-$6
-$7
Lost
$/
pig
Tryptophan to Lysine ratio (%)

A3
A summary showing how these targets can impact formulation strategies and the resulting diets is shown in Figure A2. These results show the levels of SID Lys to optimize the different strategies listed above. Note that the SID Lys level to maximize profit is greater than that to minimize cost. The economic optimum SID Lys level is dynamic and depends on the market prices. Each of these concepts, and some of the relative risks and rewards, are explained below in more detail.
FIGURE A2. EXAMPLE OF LEVELS OF STANDARDIZED ILEAL DIGESTIBLE (SID) LYSINE TO OPTIMIZE DIFFERENT OUTCOMES FOR PIC PIGS (20- TO 25-KG PIG; PIC INTERNAL DATA).
FORMULATING FOR MAXIMUM PERFORMANCEThe SID Lysine level to improve F/G is generally greater than that to maximize ADG. However, formulation targeting maximum performance does not take into account any economic measurement but only considers the impact on the biological response.
FORMULATING FOR MINIMUM COSTTo minimize the diet cost, the nutritionists set the nutrient levels needed and use a least cost formulation software to achieve the minimum diet cost possible but still meet the needed requirements.
Thus, diet cost is technically an economic variable; however, it does not account for any changes in performance. Feed cost per kg of gain is calculated by multiplying F/G by the cost per kg of feed and, therefore, feed cost per kg of gain takes into account F/G. However, this approach does not take into account any changes in ADG, pig price, or the cost of each extra day in the barn.
Feed cost per kg gain = (Feed:gain x $ per kg of feed)
FORMULATING FOR MAXIMUM PROFIT Income over feed cost (IOFC), on the other hand, takes into account the market price and the value of weight gain under a fixed time scenario:
IOFC = (market price per kg live weight × weight gain) - (feed cost per kg gain × weight gain)
NEVER STOP IMPROVING
Op
tim
um
SID
Lys
, %
Maximizeperformancce
Minimizecost
Maximizeprofit
ADG F/G Feed costper unit gain
Income overfeed cost
Income overfeed and
facility cost
Income overtotal cost perkg produced
1.28
1.42
0.85
1.34 1.35 1.37

A4
Income over feed and facility costs (IOFFC) is similar to IOFC, however it is suitable for a fixed weight scenario:
IOFFC = (market price per kg live weight × weight gain) - (feed cost per kg gain × weight gain) -(cost per pig space × days in the phase)
PUTTING IT ALL TOGETHERThe formulation concept of feed cost per kg of gain generally leads to the conclusion of cheaper diets; however, often that is not necessarily the optimum level to maximize net profit. Income over total cost (IOTC) takes into account the dilution effect of the extra gain over each kg of live or carcass produced. For example, let’s assume that the cost of the weaned pig was $40. Therefore, a production system with 121 kg of gain from weaning to market results in a cost of $0.3306 per kg that will be related to the cost from the weaned pig. However, if a given nutritional or management strategy increases the weight gain to 123 kg, the cost per kg related to that initial weaned pig cost will change to $0.325 or 1.7% reduction in cost.
To calculate income per kg of live weight produced:
Or to calculate income per kg of carcass weight produced:
The following examples use these principles for comparison of a few specific scenarios and the impact on income over feed cost and income over total cost on a carcass basis:
COMPARISON OF MINIMIZING COST VS. MAXIMIZING PROFIT PER PIGTABLE A1. SCENARIOS AND ASSUMPTIONS.
Diet cost should have manufacturing and delivery included and not just ingredient cost because this is a more accurate reflection of the total cost of the feed consumed and the value of the performance differences.
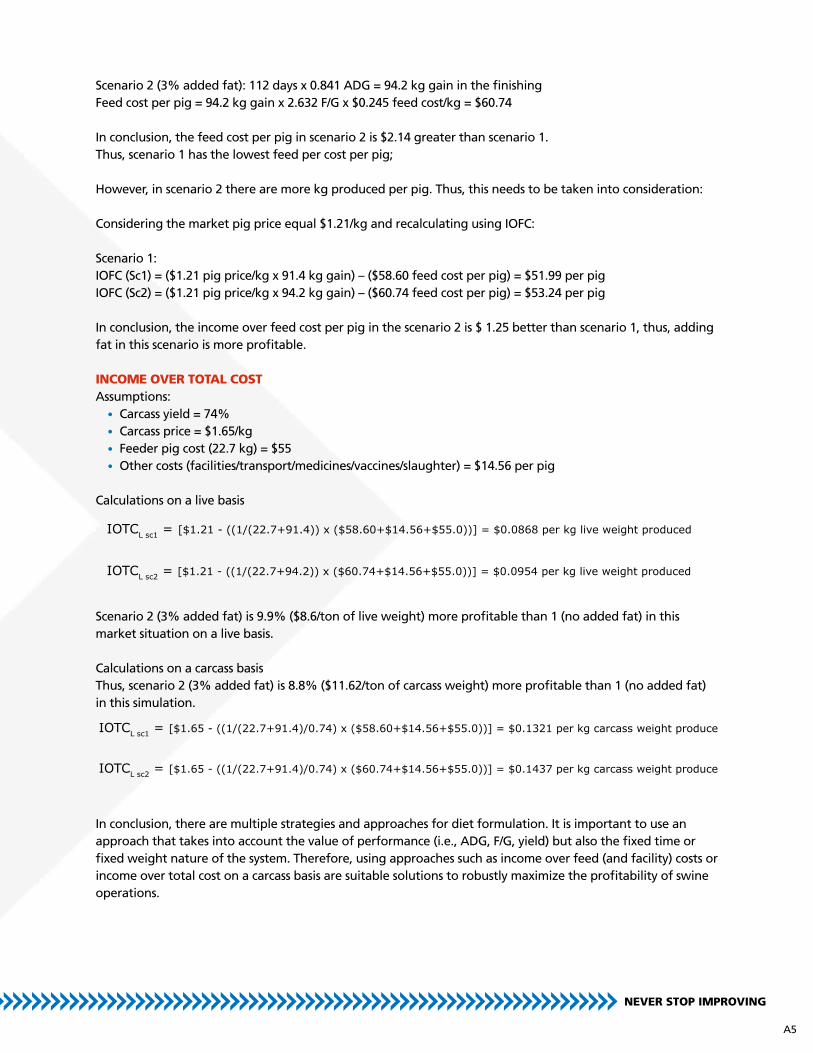
CALCULATIONSSScenario 1 (no added fat): 112 days x 0.816 ADG = 91.4 kg gain in the finishingFeed cost per pig = 91.4 kg gain x 2.80 F/G x $0.229 feed cost/kg = $58.60
IOTCC = [market price per kg - ((1/market weight/% yield) x (feed cost per pig + other costs per pig + feeder pig cost))]
IOTCL = [market price per kg - ((1/market weight) x (feed cost per pig + other costs per pig + feeder pig cost))]
Fixed time/3% added fat diet
0.841
2.632
112
0.245
Assumptions
ADG, kg
F:G
Days on feed
Diet cost, $/kgb
aAssuming each 1% added fat improves gain by 1% and F:G by 2%. This response can vary from system to system and by season.bAssuming costs of soybean meal, corn, and choice white grease at $350/ton, $3.60/bu (25.5 kg), and $0.68/kg, respectively.
Fixed time/no added fat diet
0.816
2.800
112
0.229
SCENARIO 1 SCENARIO 2a
A5
Scenario 2 (3% added fat): 112 days x 0.841 ADG = 94.2 kg gain in the finishingFeed cost per pig = 94.2 kg gain x 2.632 F/G x $0.245 feed cost/kg = $60.74
In conclusion, the feed cost per pig in scenario 2 is $2.14 greater than scenario 1.Thus, scenario 1 has the lowest feed per cost per pig;
However, in scenario 2 there are more kg produced per pig. Thus, this needs to be taken into consideration:
Considering the market pig price equal $1.21/kg and recalculating using IOFC:
Scenario 1:IOFC (Sc1) = ($1.21 pig price/kg x 91.4 kg gain) – ($58.60 feed cost per pig) = $51.99 per pigIOFC (Sc2) = ($1.21 pig price/kg x 94.2 kg gain) – ($60.74 feed cost per pig) = $53.24 per pig
In conclusion, the income over feed cost per pig in the scenario 2 is $ 1.25 better than scenario 1, thus, adding fat in this scenario is more profitable.
INCOME OVER TOTAL COST Assumptions:
• Carcass yield = 74%• Carcass price = $1.65/kg• Feeder pig cost (22.7 kg) = $55• Other costs (facilities/transport/medicines/vaccines/slaughter) = $14.56 per pig
Calculations on a live basis
Scenario 2 (3% added fat) is 9.9% ($8.6/ton of live weight) more profitable than 1 (no added fat) in this market situation on a live basis.
Calculations on a carcass basisThus, scenario 2 (3% added fat) is 8.8% ($11.62/ton of carcass weight) more profitable than 1 (no added fat) in this simulation.
In conclusion, there are multiple strategies and approaches for diet formulation. It is important to use an approach that takes into account the value of performance (i.e., ADG, F/G, yield) but also the fixed time or fixed weight nature of the system. Therefore, using approaches such as income over feed (and facility) costs or income over total cost on a carcass basis are suitable solutions to robustly maximize the profitability of swine operations.
NEVER STOP IMPROVING
IOTCL sc1 = [$1.21 - ((1/(22.7+91.4)) x ($58.60+$14.56+$55.0))] = $0.0868 per kg live weight produced
IOTCL sc2 = [$1.21 - ((1/(22.7+94.2)) x ($60.74+$14.56+$55.0))] = $0.0954 per kg live weight produced
IOTCL sc1 = [$1.65 - ((1/(22.7+91.4)/0.74) x ($58.60+$14.56+$55.0))] = $0.1321 per kg carcass weight produced
IOTCL sc2 = [$1.65 - ((1/(22.7+91.4)/0.74) x ($60.74+$14.56+$55.0))] = $0.1437 per kg carcass weight produced

B1
Section B:
ENERGY
Energy is the most expensive component of the diet, representing about 50% of the total diet cost. Thus, an understanding of its roles on metabolic processes throughout the different phases of production as well as its performance and economic implications is important.
The utilization of dietary energy by pigs is illustrated in Figure B1. Digestible energy (DE) is gross energy (GE) minus the heat of combustion of fecal material. Metabolizable energy (ME) is DE minus the heat of combustion of urine and gas production. Gas production in pigs is below 1% and is generally neglected. Net energy (NE) is ME minus the heat increment (HI), which is the heat of digestion and nutrient metabolism. Net energy is divided into NE for maintenance (NEm) and NE for production (NEp). Net energy for maintenance is the energy needed to sustain life and maintain homeostasis (i.e., body temperature). Net energy for production is the energy used in synthesis of protein, fat, fetal development, and milk synthesis. Thus, NE is the most accurate system to predict growth performance (Nitikanchana et al., 2015).

B2
FIGURE B1. UTILIZATION OF DIETARY ENERGY BY PIGS.
Ingredients with high-fiber (i.e., DDGS, Midds) and/or high-protein (i.e., SBM) generate greater heat increment during digestion (Figure B2), thus having a greater difference between DE or ME and NE compared with ingredients with moderate levels of fiber and protein. However, it is important to take into consideration that heat increment can be used by the pigs as a source of heat when they are below their thermoneutral zone. Thus, high-fiber and high-protein diets are not as detrimental during the winter season or in other situations where environmental controls can keep the growing pigs in their thermoneutral zone.
FIGURE B2. HEAT INCREMENT AS A PERCENTAGE OF METABOLIZABLE ENERGY (ME) FOR PIGS.
Adapted from Noblet & van Milgen (2004) and Rijnen et al. (2003).
NEVER STOP IMPROVING
GROSS ENERGY
DIGESTIBLE ENERGY
METABOLIZABLE ENERGY
NET ENERGY
NET ENERGY FOR PRODUCTION NET ENERGY FOR MAINTENANCE
HEAT INCREMENT
URINE
GASES
FECAL MATERIAL
Protein and fatsynthesis, fetal
development and milksynthesis
Sustain life and maintainbody temperature
Fat
Carbohydrates
Protein
Fiber
11%
18%
43%
46%
Heat incrementas % of ME

B3
THE IMPORTANCE OF ENERGY AND INGREDIENT LOADING VALUESThe ingredient loading values used in diet formulation are of extreme importance. There are many energy systems and it is important to be consistent in the system used in your database. Table B1 shows ME, NE, and SID Lysine (Lys) levels for the same diet using two different ingredients databases: National Research Council (NRC, 2012) and Central Bureau for Livestock Feeding (CVB, 2008). There is a 3.3, 4.2, and 2.2% difference in ME, NE, and SID Lys. These values show the importance of using an ingredient database that accurately describes the specific region but also the importance of knowing locally the energy and nutrient content of the ingredients used in diet formulation. It is also important to know the ingredient loading values used in determining the pigs’ requirements. For example, different lysine loading values used in dose-response experiments will yield different requirements. Finally, it is important to know the moisture of the ingredients when determining energy and nutrient levels.
TABLE B1. SAME DIETS FORMULATED WITH TWO DIFFERENT INGREDIENTS DATABASES (NRC 2012 VS. CVB 2008).
70.99
25.19
1.00
0.95
0.78
0.37
0.17
0.04
0.02
0.50
100
Corn, yellow
Soybean meal, solv. extr., CF<4%, CP<48%
Corn oil
Calcium carbonate
Monocalcium phosphate
Salt (NaCl)
L-Lysine HCI
DL-Methionine
L-Threonine
Vitamin and trace mineral premix
Total, %
ME, MJ/kg
NE, MJ/kg
Standardized Ileal Digestible (SID) Lysine, %
13.99
10.53
0.93
13.53
10.11
0.91
NRC, 2012
DIET
CVB, 2008
PERCENTAGE, %

B4
TABLE B2. DIETS WITH SAME METABOLIZABLE ENERGY (ME) BUT DIFFERENT NET ENERGY (NE) WITH NRC (2012) INGREDIENT VALUES.
Table B2 shows a corn-soybean meal based diet and a high-fiber ingredient based diet formulated to have the same level of ME. Note that even though the diets have same ME, the high fiber ingredient diet has 2.5% less NE. These could result in 2.5% worse F/G (Nitikanchana et al., 2015). Therefore, scenarios where high fiber ingredients are pricing into the diet, the differences in NE should be taken into account when conducting the economic calculations.
NEVER STOP IMPROVING
Corn, yellow
Corn DDGS, <4% oil
Wheat middlings
Soybean meal, solv. extr., CF<4%, CP<48%
Corn oil
Calcium carbonate
Monocalcium phosphate
Salt (NaCl)
L-Lysine HCI
L-Threonine
L-Tryptophan
DL-Methionine
Vitamin and trace mineral premix
Total, %
ME, MJ/kg
NE, MJ/kg
Standardized Ileal Digestible (SID) Lysine, %
70.99
---
---
25.19
1.00
0.95
0.78
0.37
0.17
0.02
---
0.04
0.50
100
13.99
10.53
0.93
37.48
30.00
19.00
7.11
3.52
1.28
---
0.39
0.57
0.10
0.04
0.03
0.50
100
13.99
10.27
0.93
CORN AND SOYBEANMEAL DIET
HIGH FIBERINGREDIENT DIET

B5
RESPONSE TO ENERGY LEVELS IN FINISHING DIETS Below in Table B3 is a summary of growth trials from PIC280, PIC327 and PIC337 sire lines. All sires were bred to PIC Camborough® sows.
Pigs were assigned to a series of high-energy diets (corn, soybean meal, 6% DDGS with 4.5% added fat, NRC ME ranged from 14.27-14.46 MJ/kg, from 27 kg to market) or a series of low-energy diets (corn, soybean meal, 6% DDGS, no fat, 16% wheat midds, NRC ME ranged from 13.19-13.44 MJ/kg from 27 kg to market, respectively. Diets were balanced on a SID Lysine:MJ ME basis according to PIC recommendations. Minimum SID AA ratios of AA were maintained in all diets. Diets are shown in the Appendix A
TABLE B3. RESPONSE TO HIGH- AND LOW-ENERGY DIETSa.
In this trial, feeding a series of high-energy diets resulted in a faster ADG by 3.5% (P < 0.0001), a lower ADFI (P < 0.0001) and improved feed conversion by 11% (P < 0.0001). Lifetime daily carcass gain was increased (P<0.05) in pigs fed high energy vs low energy diets.
However, the caloric efficiency was similar (P > 0.5) among the high-energy (36.73 MJ ME/kg gain) and low-energy (37.01 MJ ME/kg gain) diet series. This information demonstrates that the same daily calories were consumed and the same amount of calories was used to deposit the same amount of weight gain. Though the feed conversion was different, the pigs on the lower energy diets were not necessarily less efficient in energy utilization. There was no sire line x dietary energy interactions in this trial.
The results indicate PIC pigs perform well across a wide range of energy intakes and adjust well to dietary energy level. Results also indicate that PIC pigs also remain very efficient going to heavy market weights as indicated by the growth curve results. The growth curves for each sire can be requested to your account manager.
Target Market Weight of 123 kg
Initial weight, kg
Final weight, kgb
ADG, kg/d
ADFI, kg/d
F/G
Target market weight of 132 kg
Entry weight, kg
Market weight, kgb
ADG, kg/d
ADFI, kg/d
F/G
26.95
125.31
0.909
2.504
2.76
26.90
133.72
0.909
2.545
2.81
P = 0.86
P = 0.27
P = 0.0001
P = 0.0001
P = 0.0001
P = 0.82
P = 0.09
P = 0.0001
P = 0.0001
P = 0.0001
LOW DIETARYENERGY
26.90
124.72
0.940
2.313
2.46
26.90
134.68
0.945
2.363
2.51
HIGH DIETARYENERGY
PROBABILITY,P <ITEM
aPIC Executive Summary 49, 50, 51, 52, 53, 54, 55 (available on request). bPigs fed the lower eergy diet took about 6 days longer to achieve similar market weight.

B6
It is important to note that low energy diets will cause an increase in feed intake up to point where gut capacity becomes a constraint (Figure B3) and energy intake per day is reduced. Additionally, when using low energy diets, it must be communicated to all production personnel so that they can allow for proper feeder/pen space and feeder adjustments to insure the growing pigs can reach these intake levels. Restricting feed intake below this point will reduce pig performance. More information on feeder space can be found in the PIC Wean to Finish Manual at http://na.picgenus.com/resources.aspx.
FIGURE B3. EFFECTS OF NET ENERGY INTAKE PER DAY BASED ON DIFFERENT NET ENERGY PER KG OF DIET (ADAPTED FROM STEIN AND EASTER, 1996) .
To decide on the most economical NE level for a specific production system one needs to consider the changes in performance expected by the changes in NE level and the cost related to those dietary energy changes. It is important to emphasize that a large amount of the value of growth response to energy depends on having adequate levels of amino acids.
NEVER STOP IMPROVING
Net
En
erg
y In
take
, M
J/d
Net Energy, MJ/kg
38
33
29
25
21
24.3
27.1
31.834.0 33.3
7.3 8.4 9.5 10.4 11.4

C1
Section C:
PROTEIN AND AMINO ACIDS
Amino acids are the building blocks of proteins that will, ultimately, allow for high efficient lean growth. PIC pigs have high potential for lean deposition, even at heavy market weights. Thus, an understanding of the impacts of each amino acid in protein deposition as well as other metabolic processes is important to maximize the success with PIC pigs.
Once the most economic energy level is defined, the SID Lys level is specified based on the Lys to Calorie ratio requirement of the pig. To obtain optimum performance, all amino acids must meet the requirement.
EXPRESSING AA REQUIREMENTSAmino acids can be expressed in multiple ways (total AA basis, apparent AA basis, etc). However, since ingredient amino acids differ in their digestibility, standardized ileal digestible (SID) amino acid values are preferred to accurately formulate diets.
FORMULATING TO AN IDEAL AMINO ACID PATTERNThe NRC (2012) has defined essential amino acid recommendations for each physiological phase. NRC served as the basis for PIC recommendations when access to data was limited, but recent research-based modifications have been made based on the research work of PIC, Ajinomoto Heartland, production systems, and universities. Requirements for amino acids other than Lys are normally expressed in relation to the level of lys since it is most likely to be first limiting in the diet. This guide specifies the SID Lys requirement using NRC (2012) ingredient loading values. The suggested ratio of dietary amino acids for each phase is presented in the nutrient specification tables at the end of this manual.
H2N
NH2
O
OH H3C
O
OH
NH2
S
NH2
O
OHH3C
OH
D1
Macro minerals are involved in many processes ranging from structural framework of DNA and RNA to bone development, electrolyte balance, and growth performance. Thus, fine tuning the macro minerals levels in diet formulation is a key aspect of a well-formulated diet.
Macro minerals such as calcium (Ca) and phosphorus (P) are mainly involved in structural functions such as bone development and metabolism but also are involved in other metabolic functions. Typically, the minimum P levels of the diet are defined, and then the Ca level is defined as a ratio to P. It is generally recommended that the total Ca to total P ratio be between 1 to 1.5. The NRC (2012) concluded that a wider ratio lowers P absorption, especially if P is marginal in the diet.
PHOSPHORUS CAN BE EXPRESSED IN MANY WAYS:• Total phosphorus: Total P represents all P that the ingredient contains (including the non-available P);• Bioavailable phosphorus
• Available phosphorus is estimated by using a method called “slope-ratio assay” and estimates the digestible plus post-absorptive utilization of P at the tissue level; however, this method is more expensive and assumes that an inorganic standard is 100% available.
• Digestible phosphorus• Apparent Total Tract Digestible (ATTD) P: estimates the total tract digestibility of P and does not
correct for basal endogenous P losses;• Standardized Total Tract Digestible (STTD) P: estimates the total tract digestibility of P and corrects
for basal endogenous P losses;
Section D:
MACRO MINERALS
NEVER STOP IMPROVING
H2N
NH2
O
OH H3C
O
OH
NH2
S
NH2
O
OHH3C
OH

D2
The STTD P way of expressing phosphorus is becoming more common among researchers and nutritionists around the world. This manual provides requirements in an available P and STTD P basis.
Calcium has been mainly expressed in a total basis until this point. Recent work has been focusing on defining digestible calcium levels from different feed ingredients and this may be used in diet formulation in the years to follow. However, at this point, this manual will focus on total calcium. Another consideration with calcium is that some ingredients and feed additives may contain calcium sources as densifiers or diluents. Many times these sources are not accounted for in diet formulation and may have significant impact on the Ca to P ratio.
Sodium is important for maintaining homeostasis of water and electrolytes and can be easily supplemented by adding salt to the diets. Inadequate water supply can induce “salt poisoning”. Sodium deficiency can reduce feed intake, average daily gain, and worsen feed efficiency. Fraser et al. (1987) have reported that salt deficiency can induce tail biting. Finally, it is important to monitor sodium levels in feed ingredients to ensure that the expected formulated levels are achieved.

E1
Section E:
TRACE MINERALS AND VITAMINS
Adequate supplementation of trace minerals and vitamins is important due to its variety of roles in regulatory functions. Their roles can range from maintaining a strong feet to maximizing reproduction efficiency.
PIC recommendations were established after being extensively compared to the recommendations of universities and major nutrition groups. A systematic allowance was made in relation to the NRC recognizing that this information is based on studies under nearly ideal conditions. The values are micronutrient additions and give no credit for ingredient content.
There are inorganic and organic forms of trace minerals such as zinc, manganese, iron, copper and selenium available in the market with different forms (i.e., chelates, proteinates, etc. for organic and sulfates, oxides, etc. for inorganic forms). These forms may have different bioavailability and this should be taken into account. Vitamin requirements are presented at the nutrient specifications table at the end of this manual. For an in-depth review on vitamins please refer to Matte and Lauridsen (2013) and for a review in minerals please refer to Hill (2013).
NEVER STOP IMPROVING

F1
Water is arguably the most important nutrient for pigs. Limited water availability will reduce feed intake and, thus, have negative effects on growth performance.
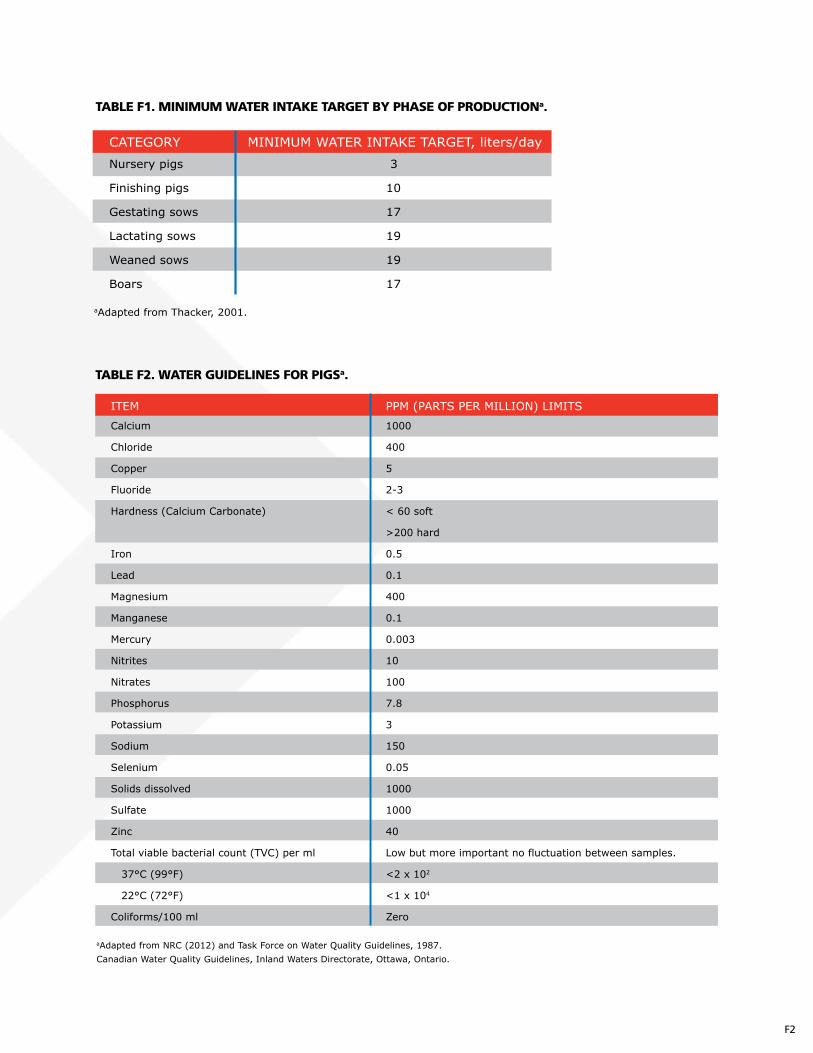
Two key aspects for successful production are water availability (Table F1) and water quality (Tables F2 and F3). Total dissolved solids is not an exact measure of water quality but can be used to estimate water quality. Sulfates are laxative agents and can cause diarrhea, especially in young pigs (NRC, 2012). Different countries may have different water quality standards for pigs. For an extensive review of water in swine nutrition refer to Thacker (2001) and PIC Sow and Gilt management manual at http://na.picgenus.com/resources.aspx.
Section F:
WATER
F2
TABLE F1. MINIMUM WATER INTAKE TARGET BY PHASE OF PRODUCTIONa.
TABLE F2. WATER GUIDELINES FOR PIGSa.
Calcium
Chloride
Copper
Fluoride
Hardness (Calcium Carbonate)
Iron
Lead
Magnesium
Manganese
Mercury
Nitrites
Nitrates
Phosphorus
Potassium
Sodium
Selenium
Solids dissolved
Sulfate
Zinc
Total viable bacterial count (TVC) per ml
37°C (99°F)
22°C (72°F)
Coliforms/100 ml
1000
400
5
2-3
< 60 soft
>200 hard
0.5
0.1
400
0.1
0.003
10
100
7.8
3
150
0.05
1000
1000
40
Low but more important no fluctuation between samples.
<2 x 10²
<1 x 10⁴
Zero
PPM (PARTS PER MILLION) LIMITSITEM
aAdapted from NRC (2012) and Task Force on Water Quality Guidelines, 1987. Canadian Water Quality Guidelines, Inland Waters Directorate, Ottawa, Ontario.
Nursery pigs
Finishing pigs
Gestating sows
Lactating sows
Weaned sows
Boars
3
10
17
19
19
17
MINIMUM WATER INTAKE TARGET, liters/dayCATEGORY
aAdapted from Thacker, 2001.

F3
TABLE F3. EVALUATION OF WATER QUALITY FOR PIGS BASED ON TOTAL DISSOLVED SOLIDS (NRC, 2012).
<1,000
1,000 - 2,999
3,000 - 4,999
5,000 - 6,999
> 7,000
Safe
Satisfactory
Satisfactory
Reasonable
Unfit
No risk to pigs.
Mild diarrhea in pigs not adapted to it.
May cause temporary refusal of water.
Higher levels for breeding stock should be avoided.
Risky for breeding stock and pigs exposed to heat stress.
RATING COMMENTSTOTAL DISSOLVED SOLIDS (mg/L)

G1
Technology advancements and large-scale research under commercial conditions is constantly allowing for evaluating the effects of different feed additives. See below some feed additives available in the market.
PHYTASEExogenous phytase is used as a feed additive to hydrolyze phytic acid (phytate) and increase phosphorus availability in feed ingredients. There are multiple phytase suppliers and a comparison between phytase sources, phytase stability, as well as the effects of superdosing phytases were reviewed by Gonçalves et al. (2016a). It is important that the nutritionist be confident in the release levels associated to phytase in order to avoid Ca and P deficiencies, especially in herds with low feed intake. Heat stable sources are preferred due to increased phytase stability over time and especially in pelleted diets (Sulabo et al., 2011). Additionally, high levels of phytase may need to be used when high levels of zinc oxide are used. There is increasing evidence that increased levels of phytase in nursery diets to those beyond P and Ca release may enhance growth performance (Kies et al., 2006; Walk et al., 2012; Langbein et al., 2013; Koehler et al., 2015). However, the mechanism for such an enhancement in performance remains unclear and the magnitude of impact is dependent on the levels of P, amino acids, and other nutrients in the diet (Adeola and Cowieson, 2011). At this point, there are mixed peer-reviewed research results regarding the impact of phytase on the release of nutrients beyond phosphorus and calcium (Johnston and Southern, 2000; Holloway et al., 2015).
Section G:
FEED ADDITIVES
NEVER STOP IMPROVING

G2
L-CARNITINEEder et al. (2001) supplemented 125 mg per day for sows from weaning to farrowing and observed an improvement of 8% and 7% in litter birth weight of gilts and mature sows, respectively. These results were further supported by later research (Ramanau et al., 2002; Ramanau et al., 2008). More research is needed to validate these effects in large litter sizes.
XYLANASEThere seems to be a reduction in mortality in finishing pigs with the use of commercially available xylanase in high-fiber diets (15% Corn DDGS and 10% wheat middlings). This has been reviewed by Boyd et al. (2015) and further research is warranted.

H1
There is a variety of feed ingredients used around the globe and, with expert advice, successfully meeting the requirements of PIC pigs.
Different feed ingredients can be used up to their upper limit and as long as diets are balanced (Table H1). In certain economic scenarios, it may be more economic going above the upper limits of usage, but this needs to be made with caution, ingredient knowledge, and with expert nutrition advice.
Additionally, it is important that nutritionists understand the impact that high-fiber ingredients may have on carcass yield and revenue when included in the diet. Diet cost savings must outweigh the revenue loss associated with marketing a lighter weight carcass. This topic is discussed in more detail in the carcass quality section.
Section H:
UPPER LIMITS OF USAGE FOR FEED INGREDIENTS
NEVER STOP IMPROVING

H2
TABLE H1. RECOMMENDED UPPER LIMITS OF USAGE (% OF THE DIET) FOR FEED INGREDIENTS IN SWINE DIETS (NATIONAL SWINE NUTRITION GUIDE, 2010).
Careful attention must be used when using by-products. By-product ingredients tend to be highly variable in nutrient content and could possibly contain high levels of mycotoxins. Ingredient samples must be taken and analyzed to determine nutrient levels. A robust monitoring system should be in place to ensure consistency and when dealing with alternative ingredients, producers must keep in mind feed mill storage capability, feed flowability, and carcass traits.
Body weight, kg
Bakery meal
Barley
Beet pulp
Corn DDGS
Peas
Rapeseed (canola) meala
Soy hulls
Sorghum, grain (milo)
Sunflower meal, 42% CP
Triticale (ergot free)
Wheat
Wheat middlingsb
<10
15
*
0
10
15
0
5
*
0
20
*
5
NURSERY10-20
25
*
5
20
30
5
5
*
5
30
*
10
NURSERY20-60
*
*
10
30
40
15
10
*
*
*
*
25
GROWER60-145
*
*
15
20
50
20
10
*
*
*
*
35
FINISHER
*
*
50
40
15
15
25
*
*
*
*
*
GESTATION
*
*
10
20
25
15
5
*
*
40
*
10
LACTATIONPHASE
An * denotes no nutritional limitations in a balances diet. Higher levels may be fed although growth and reproductive performance and carcass composition and quality may be negatively impacted. Economic considerations should influence actual inclusion rates.aIt is important that the nutritionist understand the levels of glucosinolate content of the rapeseed (canola) meal to avoid negative effects on feed intake.bIf used in sow diets it is important to test for ergot alkaloids, as ergot has severe negative impact on sow reproductive performance. Maximum levels in final feed is 200 ppb of ergot alkaloids.

I1
This section will cover basic concepts for feeding PIC pigs during the different phases of production. The nutrient specification tables at the end of this manual provide specific recommendations about nutrient levels of the diets.
MATURE BOARS
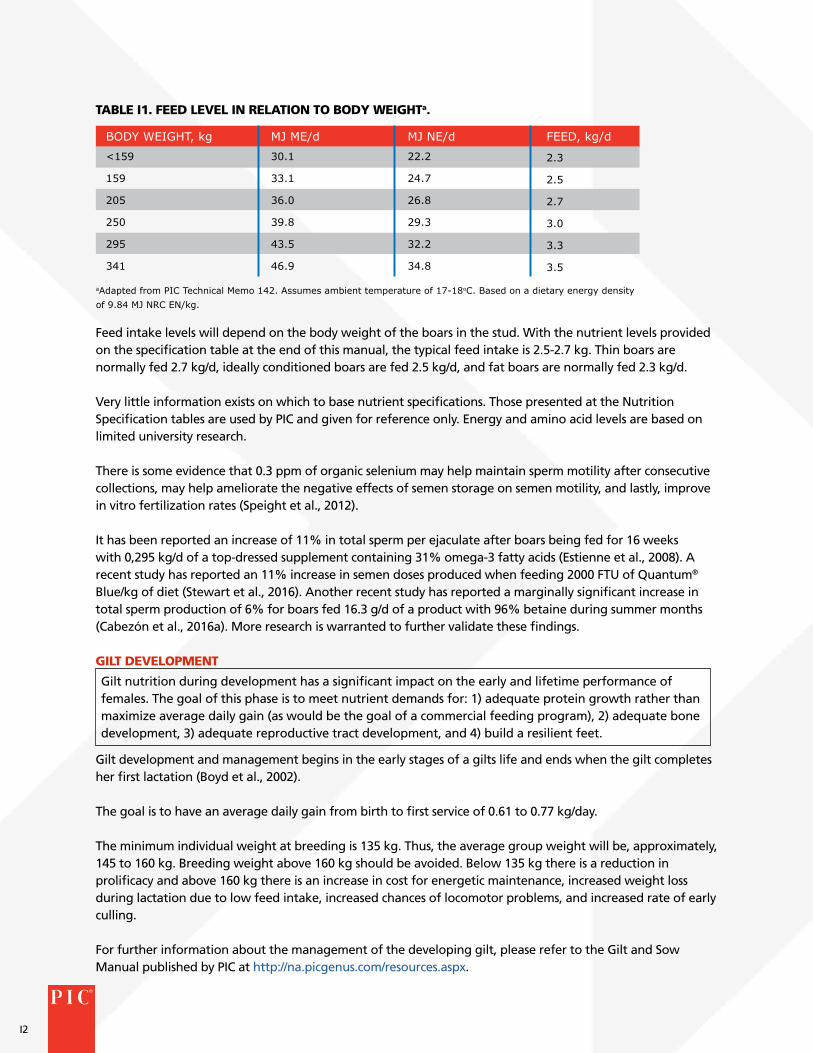
Underfeeding boars can have negative consequences in sperm production (PIC Technical Memo 142). The energy needed to support body condition without compromising sperm output has been calculated and validated in AI studs (Table I1; see PIC Technical Memo 142, available on request).
Section I:
THE BASIC NUTRITION PROGRAM
The goal of boar feeding is to promote adequate growth and to maximize semen output and semen quality, while avoiding locomotor problems and reduce culling rate.
NEVER STOP IMPROVING
I2
Feed intake levels will depend on the body weight of the boars in the stud. With the nutrient levels provided on the specification table at the end of this manual, the typical feed intake is 2.5-2.7 kg. Thin boars are normally fed 2.7 kg/d, ideally conditioned boars are fed 2.5 kg/d, and fat boars are normally fed 2.3 kg/d.
Very little information exists on which to base nutrient specifications. Those presented at the Nutrition Specification tables are used by PIC and given for reference only. Energy and amino acid levels are based on limited university research. There is some evidence that 0.3 ppm of organic selenium may help maintain sperm motility after consecutive collections, may help ameliorate the negative effects of semen storage on semen motility, and lastly, improve in vitro fertilization rates (Speight et al., 2012).
It has been reported an increase of 11% in total sperm per ejaculate after boars being fed for 16 weeks with 0,295 kg/d of a top-dressed supplement containing 31% omega-3 fatty acids (Estienne et al., 2008). A recent study has reported an 11% increase in semen doses produced when feeding 2000 FTU of Quantum® Blue/kg of diet (Stewart et al., 2016). Another recent study has reported a marginally significant increase in total sperm production of 6% for boars fed 16.3 g/d of a product with 96% betaine during summer months (Cabezón et al., 2016a). More research is warranted to further validate these findings.
GILT DEVELOPMENT
Gilt development and management begins in the early stages of a gilts life and ends when the gilt completes her first lactation (Boyd et al., 2002).
The goal is to have an average daily gain from birth to first service of 0.61 to 0.77 kg/day.
The minimum individual weight at breeding is 135 kg. Thus, the average group weight will be, approximately, 145 to 160 kg. Breeding weight above 160 kg should be avoided. Below 135 kg there is a reduction in prolificacy and above 160 kg there is an increase in cost for energetic maintenance, increased weight loss during lactation due to low feed intake, increased chances of locomotor problems, and increased rate of early culling.
For further information about the management of the developing gilt, please refer to the Gilt and Sow Manual published by PIC at http://na.picgenus.com/resources.aspx.
TABLE I1. FEED LEVEL IN RELATION TO BODY WEIGHTa.
Gilt nutrition during development has a significant impact on the early and lifetime performance of females. The goal of this phase is to meet nutrient demands for: 1) adequate protein growth rather than maximize average daily gain (as would be the goal of a commercial feeding program), 2) adequate bone development, 3) adequate reproductive tract development, and 4) build a resilient feet.
<159
159
205
250
295
341
BODY WEIGHT, kg30.1
33.1
36.0
39.8
43.5
46.9
MJ ME/d22.2
24.7
26.8
29.3
32.2
34.8
MJ NE/d
2.3
2.5
2.7
3.0
3.3
3.5
FEED, kg/d
aAdapted from PIC Technical Memo 142. Assumes ambient temperature of 17-18oC. Based on a dietary energy density of 9.84 MJ NRC EN/kg.

I3
As a summary, key differences between a gilt development diet and a market gilt diet are: 1) Vitamins specific for reproduction purposes 2) Vitamin and trace mineral recommendations are higher than commercial recommendations in order to not limit the gilt for reproductive function (see requirement tables). Higher Ca and P levels compared to market gilts.
GESTATING GILT AND SOW
Managing body condition (Figure I1) is a key aspect of a high performance sow farm. An ideally conditioned sow is the one that the back, hip, and rib bones cannot be seen but can be felt when touching the sow. If these bones cannot be felt by touching the sow, then she is over conditioned. The target is to have 90% of the sows in ideal condition.
FIGURE I1. BODY CONDITION SCORE (ADAPTED FROM DISEASE OF SWINE, 2006).
Fat sows at farrowing will likely have low feed intake during lactation, lose more weight (Figure I2), produce less milk, and consequently, may wean lighter piglets. This negative energy balance will then likely influence a reduction in the subsequent litter size.
FIGURE I2. GESTATION AND LACTATION SOW BODYWEIGHT (BW) CHANGES ARE INVERSELY CORRELATED (REN ET AL., 2015).
Thin≤5%
Ideal≥90%
Fat≤5%
The main goal during gestation is to manage body condition to allow for adequate embryonic/fetal and placental development to maximize litter size while not making sows too thin or too fat.
NEVER STOP IMPROVING
Sow
BW
ch
ang
ed
uri
ng
lact
atio
n,
kg
25
0
r = -0.52P < 0.001
Gestation weight change from d 27-109, kg
0 10 20 30 40

I4
A recent descriptive summary of experiments (Table I2) evaluating increased feed intake during late gestation has shown that sow BW is increased by approximately 6.9 kg when bump fed an extra 0.9 kg/d during late gestation. Similarly, the overall effect of bump feeding on piglet birth weight was modest (1 oz or 28 g). This effect is greater and more consistent in gilts (1.1 oz or 31 g) compared to sows (0.4 oz or 11 g). In fact, multiple studies have shown negative effects of bump feeding in sows (Shelton et al., 2009; Soto et al., 2011; Greiner et al., 2016).
TABLE I2. DESCRIPTIVE SUMMARY OF EXPERIMENTS EVALUATING INCREASED FEED INTAKE DURING LATE GESTATION (GONÇALVES, 2015).
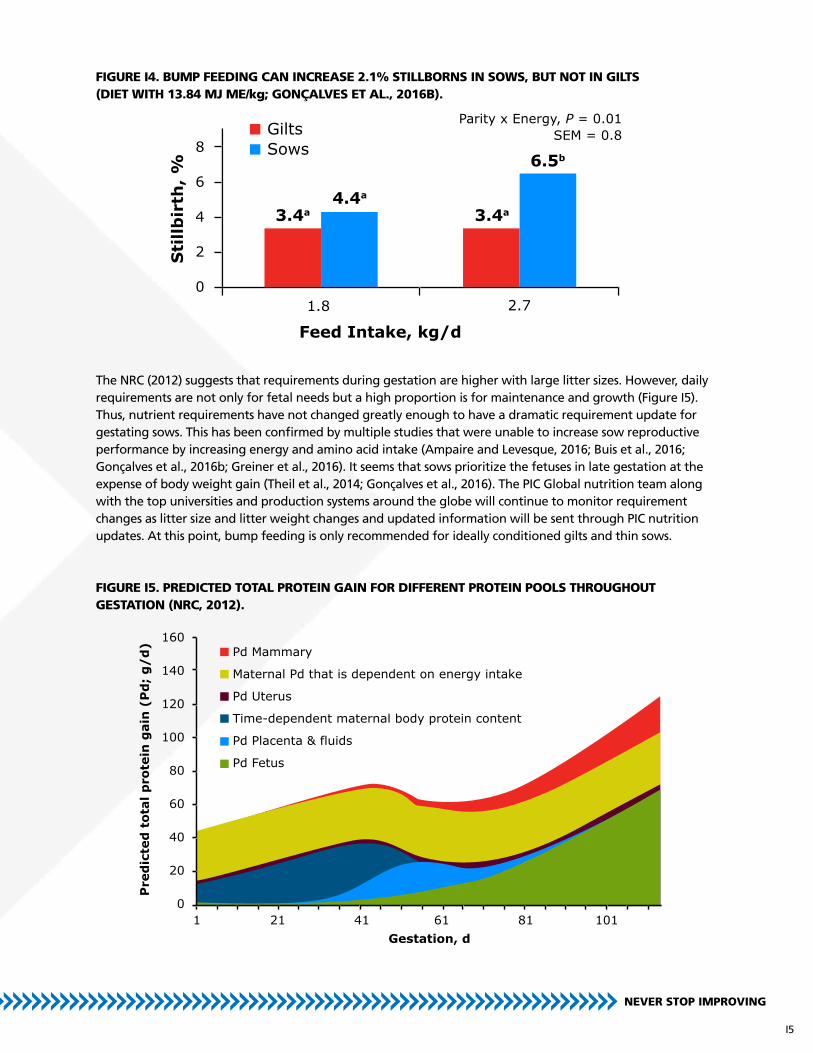
Additionally, a recent study using 1,102 PIC females (14.2 and 15.2 total piglets born for gilts and sows, respectively) where 15,979 piglets were weighed individually at birth in commercial research conditions suggests that the effect on birth weight is driven by energy (Figure I3) from starch rather than amino acid intake (Gonçalves et al., 2016b). In the same study, bump fed sows had an increase of 2.1% stillborn compared to sows that were not bump fed (Figure I4). This negative effect was not observed in gilts.
FIGURE I3. ENERGY WAS THE DRIVER OF THE MODEST INCREASE IN BIRTH WEIGHT OF PIC PIGLETS RATHER THAN AMINO ACID INTAKE (1,102 PIC FEMALES AND 15,979 PIGLETS WEIGHED AT BIRTH; GONÇALVES ET AL., 2016B).
1
2
2
3
3
3
3
4
5
5
Averageb
EXP.
Both
Gilts
Sows
Gilts
Gilts
Sows
Sows
Both
Gilts
Sows
---
TYPE
90
90
90
90
90
90
90
100
100
100
90.6
START, DAY OF GESTATION
540
21
32
371
371
181
181
57
24
51
---
LITTERS PERTREATMENT
10.6
14.3
12.4
14.2
14.2
15.1
15.3
11.2
12.5
12.9
12.6
TOTALBORN
24.3
28.5
33.1
24.7
24.7
24.7
24.7
31.4
29.3
33.1
25.1
CONTROL,MJ ME/d
10.6
11.9
11.9
10.7
20.0
10.7
20.0
10.8
9.8
11.2
13.5
CONTROL,g SID Lys/d
42.7
41.0
47.7
37.3
37.3
37.3
37.3
53.2
54.0
58.2
40.2
INCREASED FEEDINTAKE, MJ ME/d
aAssuming a corn-soybean meal based diet with 10.07 MJ NE/kg, is the amount in kg of BW gain per kg of extra daily feed above the basal level. For example, increasing the amount of daily feed from 1.8 to 2.7 kg in late gestation, the gilt or sow will be, approximately, 6.9 kg heavier at farrowing. (1) Cromwell et al., 1989, (2) Shelton et al., 2009, (3) Gonçalves et al., 2016b, (4) Miller et al., 2000, (5) Soto et al., 2011.bWeighted based on the number of sows in each study.
18.4
17.1
19.9
10.7
20.0
10.7
20.0
18.3
18.2
19.5
16.6
INCREASED FEEDINTAKE, g SID Lys/d
5.7
5.7
5.4
5.6
9.1
9.0
10.8
4.8
---
---
6.9±0.8
FEMALE BW GAIN,kg/kg OF EXTRADAILY FEEDa
40
86
-109
24
28
47
19
10
126
-69
28±20.4
PIGLETBIRTHWEIGHT, g
INCREASED BY TREATMENT
Energy intake, MJ NE/d
Bor
n a
live
pig
let
bir
th w
eig
ht,
kg
1.50
1.45
1.40
1.35
1.30
1.25
1.20
18.8 28.2
1.33a1.36b
+30 g
P = 0.01SEM = 0.008
I5
FIGURE I4. BUMP FEEDING CAN INCREASE 2.1% STILLBORNS IN SOWS, BUT NOT IN GILTS (DIET WITH 13.84 MJ ME/kg; GONÇALVES ET AL., 2016B).
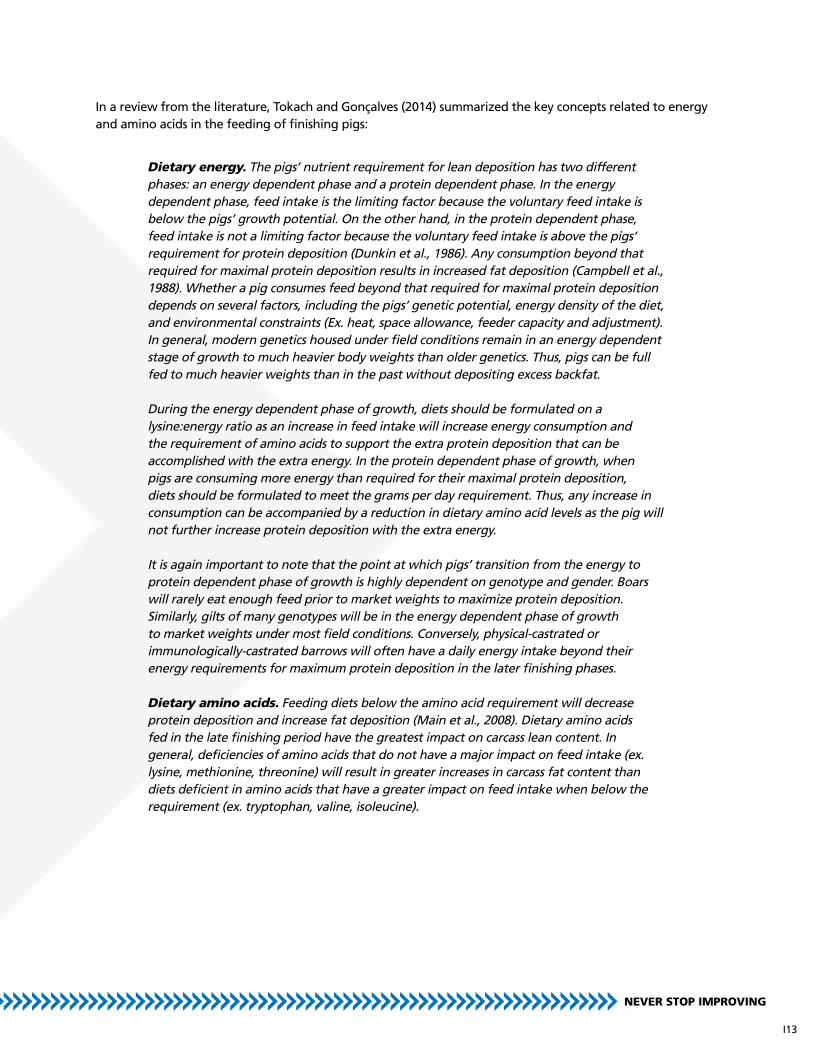
The NRC (2012) suggests that requirements during gestation are higher with large litter sizes. However, daily requirements are not only for fetal needs but a high proportion is for maintenance and growth (Figure I5). Thus, nutrient requirements have not changed greatly enough to have a dramatic requirement update for gestating sows. This has been confirmed by multiple studies that were unable to increase sow reproductive performance by increasing energy and amino acid intake (Ampaire and Levesque, 2016; Buis et al., 2016; Gonçalves et al., 2016b; Greiner et al., 2016). It seems that sows prioritize the fetuses in late gestation at the expense of body weight gain (Theil et al., 2014; Gonçalves et al., 2016). The PIC Global nutrition team along with the top universities and production systems around the globe will continue to monitor requirement changes as litter size and litter weight changes and updated information will be sent through PIC nutrition updates. At this point, bump feeding is only recommended for ideally conditioned gilts and thin sows.
FIGURE I5. PREDICTED TOTAL PROTEIN GAIN FOR DIFFERENT PROTEIN POOLS THROUGHOUT GESTATION (NRC, 2012).
NEVER STOP IMPROVING
Sti
llbir
th,
%
Feed Intake, kg/d
GiltsSows
Parity x Energy, P = 0.01SEM = 0.8
3.4a 3.4a4.4a
6.5b
1.8 2.7
8
6
4
2
0
Pd Mammary
Maternal Pd that is dependent on energy intake
Pd Uterus
Time-dependent maternal body protein content
Pd Placenta & fluids
Pd Fetus
Gestation, d
Pre
dic
ted
tot
al p
rote
in g
ain
(P
d;
g/d
) 160
140
120
100
80
60
40
20
01 21 41 61 81 101

I6
Feeding management during the pre-farrowing period has been an area of increased interest by researchers (Cools et al., 2014; Decaluwe et al., 2014). Cools et al. (2014) showed that providing ad libitum feed prior to farrowing for fat sows reduced weaning weight and piglet growth rate, but no negative effects on sows that were thin or in ideal condition. Anecdotal evidences have made some veterinarians and nutritionists theorize that providing ad libitum feed prior to farrowing, especially in herds with too many fat sows and that induce farrowing may increase the risk of uterine and rectal prolapses. Current views have theorized that long term ad libitum feeding prior to farrowing may have negative effects on the lactating sow and that fat sows may have weakened uterine muscle tone and increased dystocia (Almond et al., 2006). At this point, there is no strong evidence to recommend more than 31.9 MJ ME or 23.7 MJ NE per day prior to farrowing to well-conditioned gilts and sows.
LACTATING SOW
The positive effects of maximizing feed intake in PIC lactating females have been shown in multiples studies to maximize feed intake, milk yield, and piglet weaning weight (Figure I6) while minimizing sow weight loss (JBS United, 2009; Sulabo et al., 2010). Lactation feed intake (Figure I7) and energy intake (Figure I8) curves for different parities are presented below. Additionally, ensuring that the feeder is correctly adjusted and have fresh feed is extremely important (Figures I9 and I10).
The goal during lactation is to maximize sow feed intake to sustain milk production while minimizing body reserves depletion. Thus, sows need to be fed ad libitum (full feeding) from the day of farrowing on.
The factors that can affect lactation feed intake are:
• Environment• Air velocity• Ambient temperature• Evaporative cooling• Humidity• Ventilation rates
• Facilities equipment• Feeder design• Automated vs. hand feeding• Floor surface• Crate design• Water flow
• Gestation feed intake• Body condition at farrowing
• Sow factors• Lactation length• Litter size• Genetics• Parity• Disease
• Management• Feeding frequency• Feed allowance• Feed freshness• Feeder adjustment• Water availability
The farm-specific Lys level for lactation depends on the actual litter growth rate and average lactation feed intake by sows. The daily Lys requirement is driven strictly by rate of litter growth and this can vary with health and thermal stress. This needs to be matched with the level of feed consumed. Table I3 could be used to derive farm-specific lysine needs. Start-up farms may need higher Lys level to maximize second litter size (Boyd et al., 2000). In the absence of other information, a typical starting point would be 1.05 to 1.10% SID Lys for stable herds and 1.15 to 1.25% SID Lys for gilts in start-up farms depending on feed intake. Finally, Table I4 shows that high lactation intake reduces sow body weight loss, increases piglet ADG, and reduces wean-to-estrus interval.

I7
FIGURE I6. SOWS PROVIDED AD LIBITUM FEED DURING LACTATION HAVE INCREASED PIGLET WEANING WEIGHT (SULABO ET AL., 2010).
FIGURE I7. FEED INTAKE DURING LACTATION FOR PIC FEMALES WITH DIFFERENT PARITIES (10.5 MJ NRC NE/kg DIET; CABEZÓN ET AL., 2016B).
NEVER STOP IMPROVING
Wea
nin
g w
eig
ht,
kg
6.2
5.8
5.4
5.0
P = 0.06SEM = 0.18
5.44
5.80
Restricted(25% from Ad. Lib.)
Ad Libitum
Feed
inta
ke,
kg/
d
Day of lactation, days
Parity 1
Parity 2
Parity 3-5
Parity 6+
8.5
7.5
6.5
5.5
4.5
3.5
1 3 5 7 9 11 13 15 17 19 21

I8
FIGURE I8. NET ENERGY INTAKE DURING LACTATION FOR PIC FEMALES WITH DIFFERENT PARITIES (ADAPTED FROM CABEZÓN ET AL., 2016B).
FIGURE I9. CORRECTLY ADJUSTED LACTATION FEEDER WITH FRESH FEED.
FIGURE I10. INCORRECTLY ADJUSTED LACTATION FEEDER WITH MOLDY FEED.
Net
en
erg
y in
take
, M
J/d
Day of lactation, days
Parity 1
Parity 2
Parity 3-5
Parity 6+
84
75
67
59
50
42
1 3 5 7 9 11 13 15 17 19 21

I9
TABLE I3. LACTATION LYSINE LEVELS BASED ON LITTER GROWTH RATE AND SOW FEED INTAKEa.
TABLE I4. EFFECTS OF FEED INTAKE DURING LACTATION ON WEAN-TO-ESTRUS INTERVAL, BODY WEIGHT LOSS, AND PIGLET AVERAGE DAILY GAIN (GREINER ET AL., UNPUBLISHED).
NEVER STOP IMPROVING
49
55
61
67
2.1
2.3
2.6
2.8
aAssumes 21 d of lactation. Based on updated Pettigrew equation (Boyd, et al., 2000) and assumes that lysine need is not strictly related to energy intake. The equation is based on a linear relationship between litter growth rate and lysine needs (g/d) to support milk production. SID lysine is based on 86% of total lysine.
1.19
1.34
---
---
4.11.07
1.20
1.34
---
4.50.97
1.09
1.22
1.34
5.00.89
1.00
1.11
1.23
5.50.82
0.93
1.03
1.13
5.90.77
0.86
0.96
1.05
6.4
LITTER GROWTHRATE, kg/d
SID LYSINE,g/d
AVERAGE FEED INTAKE, kg/d (SID LYSINE, %)
3.2
4.1
5.0
5.9
6.8
8.2
9.1
ADFI, kg
31.5
42
52.5
63
73.5
84
94.5
SID LYS,g/d
-12.0
-10.4
-2.6
4.0
11.3
13.5
12.1
SOW BW DIFFERENCE, kg
-5.1
-4.81
-1.04
2.06
5.41
6.57
5.57
SOW BW DIFFERENCE, %
0.22
0.23
0.25
0.25
0.25
0.26
0.27
PIGLET ADG,kg
6.3
5.0
4.4
4.4
4.2
4.4
4.3
WEAN-TO-ESTRUSINTERVAL, d

I10
WEANED SOW
Feeding management of the weaned sow requires a balance between providing enough fresh feed and avoiding wastage (Figures I11 to I13). Where possible, the weaned sow should be fed 2 to 3 times per day. To maximize feed intake, typically, the wean row would have a water nipple for every sow or shared between two sows.
An internal PIC observational study with 670 sows observed that increasing feeding level from 2.6 to 4.2 kg/d during the wean to service period reduced wean to estrus interval from 5.3 to 4.4 d, increased percentage of sows bred by d 7 from 92.8 to 97.5%, and increased subsequent litter size by a full pig from 12.9 to 13.9. Graham et al. (2015) used 637 sows and fed 2.7, 3.6, or 5.4 kg/d of a diet containing approximately 10.2 MJ NE/kg from weaning to estrus. They achieved NE intakes of 27.2, 36.0, and 52.8 MJ per day. They found no statistical difference in wean to estrus interval (5.1, 5.0, or 5.0 d), conception rate (95.6, 95.6, or 94.7%), farrowing rate (85.4, 87.0, and 82.3%), or born alive (13.1, 12.9, or 12.9) for sows fed the 2.7, 3.6, or 5.4 kg/d, respectively. Parity of the sow did not influence the response to feeding level. Graham et al. had only ideal and fat sows in their study, thus may have limited the benefit of high feed intake, and thin sows may still benefit from higher feeding levels. Ad libitum feed intake vary with season and parity profile of the weaned group, thus, to maximize feed intake, sows in the weaning row are typically fed twice a day. Additionally, there is great variation on voluntary feed intake among weaned sows. Thus, identifying thin sows with high voluntary feed intake and adjust feed drops accordingly is key to meet their daily needs. Given the limited research and conflicting results in this area to this point, current PIC recommendation is to feed thin sows ad libitum and ideal/fat sows a minimum of 3.6 kg until further research.
FIGURE I11. FEEDER IN THE WEANING ROW WITH NOT ENOUGH FEED.
FIGURE I12. FEEDER IN THE WEANING ROW WITH ADEQUATE AMOUNT OF FEED.
FIGURE I13. FEEDER IN THE WEANING ROW WITH FEED WASTAGE.
The goal of the feeding management of the weaned sow is to start the recovery of the body reserves lost during lactation, to maximize ovulation rate, and ensure high litter size in the subsequent farrowing.

I11
NURSERY PIG
The nursery feeding program corresponds to, approximately, 10 to 15% of total feed cost for producing a pig. Due to the high input costs of the dairy products and high-quality protein in early nursery diets, these ingredients must be reduced quickly after weaning.
Ad libitum access to feed and water in the nursery phase from the first hour after placement is essential and can greatly impact the weight at the end of the nursery. Weaned pigs are extremely dependent on energy intake and, thus maximizing feed intake is essential. Increasing feed intake during the first week increases digesta flow and decreases proliferation of bacteria in the gut and reduces the incidence of diarrhea. A large epidemiological study indicated that low feed intake after weaning increases the likelihood of developing diarrhea compared to high feed intake (Madec et al., 1998). Therefore, age at weaning and high feed intake after weaning are critical to maximize performance in the nursery phase. For information on management aspects that can improve feed intake after weaning, please refer to the PIC Wean to Finish Manual at http://na.picgenus.com/resources.aspx.
Phase feedingBased on the development of the digestive system of weaned piglets, typically 3 to 4 diets are fed during the nursery period.
3.5 to 7.5 kg pigsWeaning pigs lighter than 5.5 kg pose a great challenge for the adaptation to the nursery environment and feed and therefore, it is strongly encouraged to develop production flows and systems that do not routinely produce average weaning weights below 5.5 kg. Feeding pigs below 7.5 kg requires a diet designed to maximize feed intake. Therefore, these diets typically have a greater cost per ton compared to the subsequent phases due to greater inclusions of highly digestible carbohydrates and protein sources (i.e., fish meal, animal plasma, enzymatically treated soybean meal, etc.). The most commonly used highly digestible carbohydrates are sources of lactose (dried whey, whey permeate, etc). Other highly digestible carbohydrates sources can replace part of the lactose if input prices offer economic opportunities (i.e., maltose, dextrose, micronized corn, micronized rice, maltodextrin, etc). Care must be taken with the source of lactose and generally, edible-grade lactose sources are the preferred option (Bergstrom et al., 2007). Similarly, there is evidence that different sources of fish meal (i.e., with different crude protein, ash, and oil levels) have different effects on performance (Jones et al., 2015).
The SID lysine in this diet is slightly higher than in the late nursery diets. A standard practice is for a small inclusion of soybean meal to aid in the adaptation of the pigs to a simpler diet in subsequent phases; however, it is important to consider the quality of available soybean meal (i.e., anti-nutritional factors, crude protein levels, and overheating). Research has shown that high inclusion of feed-grade AA (up to 0.50% L-Lysine-HCl) can be used as partial replacement of specialty proteins as long as the requirement of the other essential AA are met (Nemecheck et al., 2011).
The goal of the nursery nutrition program is to maximize feed intake in the first week after weaning with highly digestible diets to ease the transition to simpler diets, such as the finishing diets.
NEVER STOP IMPROVING

I12
7.5 TO 11.5 KG PIGSThis phase has lowering levels of highly digestible protein and carbohydrates sources but increased levels of soybean meal. For lactose sources, dried whey is preferred however high quality whey permeate can partially replace lactose.
11.5 TO 23 KG PIGSThis diet is primarily comprised of a grain source, soybean meal and synthetic amino acids and generally contains very similar ingredients to diets of finishing pigs. It is of extreme importance to adapt the pigs to start the consumption of grain soybean meal-based diets as soon as possible. Minor adjustments in diet formulation of this phase can bring positive economic benefits due to the large impact in the total nursery cost (approximately half of the total nursery feed cost).
FINISHING PIG
The steps in diet formulation of finishing pigs are: 1) Determine the most economical energy level; 2) Determine the lysine:calorie ratio to use for the gender; 3) Determine the ratio for the other amino acids; 4) Determine the available or digestible phosphorus level; 5) Set levels of calcium, vitamins, trace minerals, salt, and other ingredients.
The goal of the finishing phase is to formulate diets that will allow for optimum protein deposition and maximum economic profit.
I13
In a review from the literature, Tokach and Gonçalves (2014) summarized the key concepts related to energy and amino acids in the feeding of finishing pigs:
Dietary energy. The pigs’ nutrient requirement for lean deposition has two different phases: an energy dependent phase and a protein dependent phase. In the energy dependent phase, feed intake is the limiting factor because the voluntary feed intake is below the pigs’ growth potential. On the other hand, in the protein dependent phase, feed intake is not a limiting factor because the voluntary feed intake is above the pigs’ requirement for protein deposition (Dunkin et al., 1986). Any consumption beyond that required for maximal protein deposition results in increased fat deposition (Campbell et al., 1988). Whether a pig consumes feed beyond that required for maximal protein deposition depends on several factors, including the pigs’ genetic potential, energy density of the diet, and environmental constraints (Ex. heat, space allowance, feeder capacity and adjustment). In general, modern genetics housed under field conditions remain in an energy dependent stage of growth to much heavier body weights than older genetics. Thus, pigs can be full fed to much heavier weights than in the past without depositing excess backfat.
During the energy dependent phase of growth, diets should be formulated on a lysine:energy ratio as an increase in feed intake will increase energy consumption and the requirement of amino acids to support the extra protein deposition that can be accomplished with the extra energy. In the protein dependent phase of growth, when pigs are consuming more energy than required for their maximal protein deposition, diets should be formulated to meet the grams per day requirement. Thus, any increase in consumption can be accompanied by a reduction in dietary amino acid levels as the pig will not further increase protein deposition with the extra energy.
It is again important to note that the point at which pigs’ transition from the energy to protein dependent phase of growth is highly dependent on genotype and gender. Boars will rarely eat enough feed prior to market weights to maximize protein deposition. Similarly, gilts of many genotypes will be in the energy dependent phase of growth to market weights under most field conditions. Conversely, physical-castrated or immunologically-castrated barrows will often have a daily energy intake beyond their energy requirements for maximum protein deposition in the later finishing phases.
Dietary amino acids. Feeding diets below the amino acid requirement will decrease protein deposition and increase fat deposition (Main et al., 2008). Dietary amino acids fed in the late finishing period have the greatest impact on carcass lean content. In general, deficiencies of amino acids that do not have a major impact on feed intake (ex. lysine, methionine, threonine) will result in greater increases in carcass fat content than diets deficient in amino acids that have a greater impact on feed intake when below the requirement (ex. tryptophan, valine, isoleucine).
NEVER STOP IMPROVING

I14
Nutrient specifications presented at the end of this manual are for lean growth optimization for market gilts and barrows, respectively. Performance was determined under commercial condition. Lysine specifications are presented as grams per MJ of NRC NE and ME. There are typically two approaches to feed pens of pigs with both gilts and barrows: 1) use an average SID Lys requirement between gilts and barrows, or 2) use the SID Lys requirement for gilts. An example of how to calculate the percent SID lysine level of a diet is provided after each table. When formulating diets of variable energy levels, one should follow the SID lysine:calorie ratio that is provided in the tables. Actual dietary energy levels require a number of considerations that are specific to market and environment (Usry et al., 1997). This was also discussed in the introductory chapters of this manual.
To help prevent vices and to help realize the expected performance, the minimum nutrient specs below should be followed. Typically, nutritional stimulants for vices can be when amino acids, sodium and/or phosphorus levels are not adequate. Feed outages and feed restrictions can also be risk factors for vices. Other environmental conditions can cause vices as discussed in the PIC Wean to Finish Manual at http://na.picgenus.com/resources.aspx.
J1
PIC sows are highly feed efficient females. Overfeeding and underfeeding must be avoided to maximize the success of PIC sows and their offspring.
TABLE J1. SOW FEEDING TARGETSa.
Section J:
SOW FEEDING MILESTONES
Pre-breeding gilt
Gestation: 0 to 28 d
Gilt
Sow
Gestation: 29 to 90b d
Gilt
Sow
Gestation: 90 to 114c d
Gilt
Sow
Regardless of phase of gestation:
Thin sows
Fat sows
Pre-farrow 2 to 4 d
Lactation: 1 d to weaning
Weaning through breeding
Thin sows
Ideal/fat sows
aAssumes 13.52 MJ NRC ME/kg or 10.00 MJ NRC NE/kg for gestation and 14.08 MJ NRC ME/kg or 10.42 MJ NRC NE/kg for lactation diets.bObjective is to reclaim body reserves (fat, protein, bone minerals) by 28 d of gestation.cAverage gestation length, 116d.dFull feeding or having self-feeders in lactation is common in many farms around the world. This allows the lactating female access to feed 24 hours a day. There should be no restriction for a lactating female. As long as gestation body condition is in line, females will eat as much as they want without a reduced feed intake later in lactation.eAfter 170 days of age, gilts can be switched to the gestation diet.fWhere possible, the weaned sow should be fed 2 to 3 times per day; the gestating sow can be fed once or twice daily. Feeding gestating sows once a day may mitigate the inaccuracy of feed boxes and reduce labor when automatic feeding is not available.
Full Feed
1.8
2.3
1.8
1.8
2.7
1.8
3.2
1.6
2.3
Full Feedd
Full Feed
3.6
AMOUNT, kg/d
24.7
30.6
24.7
24.7
36.8
24.7
43.1
21.4
32.4
49.0
NRC MJ ME/d
18.0
22.6
18.0
18.0
27.2
18.0
31.8
15.9
24.0
36.4
NRC MJ NE/dGilt Developere
Gestation
Gestation
Gestation
Gestation
Gestation
Gestation
Gestation
Gestation
Lactation
Lactation
Gestationf
Gestationf
Gestationf
FEED TYPEMILESTONE

K1
Decision making in a swine production system requires an in depth understanding of all key drivers of the production chain. Thus, it becomes essential for nutritionists to have available a set of tools that can help them navigate through these highly dynamic scenarios and make informed decisions.
PIC ADJUSTED CALORIC EFFICIENCY CALCULATOR BY SIRELINEThere are multiple factors that influence feed efficiency of wean to finish pigs. Three major factors affecting feed efficiency are entry and final body weight, dietary energy, and sireline. Most production systems adjust feed efficiency for final weight in the nursery phase and entry and final weight in the finishing phase in order to have a meaningful comparison between close outs. A recent adjustment that has been added in some production systems is for dietary energy (Gaines et al., 2012). A 1% change in net energy of the diet is expected to change feed efficiency by 1% (Euken, 2012). Dietary energy changes through time because of changing ingredient prices. Therefore, adjusting for dietary energy to compare between close outs and to evaluate performance changes overtime becomes important. Finally, different sirelines have different growth rate and feed efficiency. Thus, using sireline-specific coefficients to adjust for entry and final weights is now possible. Download this tool at http://na.picgenus.com/tech_support/nutrition/adjusted_caloric_efficiency_calculator.aspx
ECONOMIC MODEL FOR OPTIMUM TRYPTOPHAN:LYSINE RATIO FOR NURSERY AND FINISHING PIGSThis tool, developed by Kansas State University and Ajinomoto Heartland, calculates the most economical SID tryptophan (Trp) to lysine (Lys) ratio by taking into account information specific to your production system and market price. The underlying models were developed using PIC genetics under commercial conditions. The tool also takes into account if the production system is marketing pigs on a fixed time versus a fixed weight basis and the impact of different SID Trp:Lys to maximize profitability. Download this tool at http://www.lysine.com/en/tech-info/TrpLys.aspx
OPTIMUM CORN DDGS CALCULATORThis calculator developed by Kansas State University attempts to consider economic return per pig from change in diet cost, feed efficiency, and growth rate. It does not account for any economic impact on yield or iodine value. Download this tool at http://www.asi.k-state.edu/research-and-extension/swine/calculators.html
Section K:
DYNAMIC DECISION MAKING TOOLS

L1
Ensuring high carcass yield and pork quality is one of the roles of swine nutrition.
HIGH-FIBER INGREDIENTS ON CARCASS YIELDIt has been shown by multiple studies (Jacela et al., 2010b; Asmus et al., 2014; Coble et al., 2015) that feeding high-fiber ingredients until market can reduce yield. It is recommended that a diet with less than 9% neutral detergent fiber (NDF) be fed for 15 to 20 days prior to market. Figure L1 shows the effects of increasing NDF on carcass yield. This has also been shown to be the most economic approach in multiple economic scenarios; however, there are scenarios when high-fiber ingredients can be cheap enough to economically offset the loss in yield.
Section L:
CARCASS QUALITY
FIGURE L1. EFFECTS OF INCREASING NEUTRAL DETERGENT FIBER ON CARCASS YIELD (COBLE ET AL., 2015).
Whitney et al., 2006
Graham et al., 2014 (1-1)
Graham et al., 2014 (2)
Salyer et al., 2012
Jacela et al., 2011
Graham et al., 2014 (1-2)
Asmus et al., 2014
Goehring et al., 2012
Average slope = 0.162%
0.117%
0.131%0.158%
0.154%
0.162%
0.118%0.229%
0.210%
8.0 12.0 16.0 20.0
76.5
75.5
74.5
73.5
72.5
71.5
NDF, %
Car
cass
Yie
ld,
%

L2
PORK FAT QUALITYThe current “standard” measure of fat firmness is iodine value. Iodine value is a measure of the unsaturation of fats and is expressed in terms of the amount of iodine absorbed by a fat sample. Basically, the iodine value (IV) determines the unsaturation level of the fat through the number of double bonds in the fatty acids. The focal point of nutrition should be on the “complete” diet and not individual ingredients within the diets. There are multiple prediction equations for iodine value of fat carcass available (Wu et al., 2016), the key is to be consistent on the equation used and when comparing estimates. A predicted backfat IV equation was developed for PIC pigs (predicted backfat IV = 0.32 × (IVP) + 52.4; Technical memo 153). Efforts to manage fat quality should be aligned with the expectations set forth by pork processors.
Research has proven that when dietary linoleic (Figure L2) and linolenic acid is increased this will cause IV to increase. Producers must work closely with their nutritionists to implement ingredients with high linoleic acid in their diets.
FIGURE L2. THE EFFECTS OF DIETARY LINOLEIC ACID ON BODY FAT IODINE VALUE (PIC TECHNICAL MEMO 153).
A useful Iodine value prediction spreadsheet is available at http://www.asi.k-state.edu/research-and-extension/swine/calculators.html. For more information access PIC’s summary on pork fat quality at http://www.pic.com/Images/Users/1/SalesPortal/Newsletters/CuttingEdge/CuttingEdge1stQ10New.pdf
For more in-depth information on fat quality please refer to Apple (2013).
Bo
dy
Fat
Iod
ine
Val
ue
Dietary Linoleic Acid, %
88
84
80
76
72
68
64
601.3 1.7 2.1 2.5 2.9 3.3 3.7
Fat IV = 5.49 (diet C18:2) + 58.90r2 = 0.63
18-20 pigs/level

M1
PIC pigs can perform under a variety of environments and production systems with proven performance around the world.
For information regarding feeding PIC pigs under specific programs (requirements of finishing boars, immunocastration, split sex, liquid feeding, feeding under hot environments, outdoor production, Parma and Serrano ham production) please download from http://na.picgenus.com/sites/genuspic_com/Uploads/files/Nutrition/FeedingPICPigs_UK.pdf.
Section M:
FEEDING PIC PIGS UNDER SPECIFIC PROGRAMS
NEVER STOP IMPROVING

N1
A successful nutrition program needs not only an adequate diet formulation but also a high-quality, consistent, feed manufacturing process.
Particle size and feed form are discussed below. For more information regarding feed manufacturing download the “Feed manufacturing guidelines for PIC pigs” at http://na.picgenus.com/sites/genuspic_com/Uploads/files/Nutrition/PICFeedManufacturingGuidelines_Metric.pdf.
PARTICLE SIZEParticle size, depending on the phase of production, can be managed to maximize nutrient digestibility or to maximize longevity. Research has shown that for every 100 micron reduction in grain particle size feed efficiency improves 1.0 to 1.2% (Steinhart, 2011a). Practical particle size recommendations are generally coarser for boars, gilt development, and gestation and finer for lactation, nursery, and finishing. Grain particle size is influenced by testing methodology and therefore, consistent testing practices are a key for successful particle size management.
Boars, gilt development, and gestationA primary focus for boars, gilt development, and gestation is to maximize longevity while achieving good nutrient digestibility. Previous research has shown that reduced or highly variable particle size can increase the incidence of stomach ulcers (Steinhart, 2011a) and potentially mortality (Goodband et al., 2002). Based on the combination of these factors it is important to follow the acceptable range of grain particle size presented in Table N1.
Section N:
FEED MANUFACTURING

N2
TABLE N1: GRAIN PARTICLE SIZE FOR PIC PIGSa.
LactationThe focus of grain particle size for lactating sows is to maximize nutrient digestibility and, thus, milk output. Therefore, particle size should range from 500 to 600 microns on average. For every 100 micron reduction from 1200 to 400 microns, litter weight gain increased 1.3% (Wondra et al., 1995).
Nursery Typically, the grain particle size recommended for the nursery phase is 500 to 600 microns for mash diets and, approximately, 400 microns for pelleted diets. Grain particle sizes in meal diets greater than 600 microns will reduce the digestibility of nutrients and grain particle sizes smaller than 500 microns will decrease feed intake (Woodworth et al., 2015). The response to reducing particle size is similar for corn, sorghum, and wheat (Woodworth et al., 2015).
FinishingFinishing is the phase of production where nutrient digestibility needs to be maximized the most. Most feed mills will grind grain as fine as possible as long as feed can still flow in bins, feed lines, and feeders. Pelleting diets reduces feed flow ability problems. Woodworth et al. (2015) reviewed the literature and concluded that there is little benefit to reduce below 600 microns in high quality pelleted diets; however, lower particle size often is used to improve pellet quality.
Particle size and ground grain storage capabilityAs shown in Table N1, if the feed mill only has one bin for ground grain, a compromise between all phases would be 550 to 650 microns; however, it must be noted that feeding gestating sows with fine grain particle size can negatively impact sow mortality. Thus, two ground grain bins are recommended. Another approach is to limit the ground corn inclusion in the gestation diet by using other ingredients, such as DDGS that mitigate some of the negative effects of finely ground grain.
If the feed mill has two storage bins for ground grain, one bin could store grain at 450 to 600 microns for lactation, nursery, and finisher and the other at 750 to 900 microns for boars, gilt development, and gestating sows.
NEVER STOP IMPROVING
Boars
Gilt Development
Gestation
Lactation
Nurseryb
Finishingb
If only one bin is available for ground grain
If two bins are available for ground grain (preferred)
Boars, gilt development, and gestating sows
Lactation, nursery, and finisher
aIf flow agent is used, the optimum range will be reduced by approximately 50 microns.bIf diets are pelleted, grain micron can be below 500 microns for nursery and finishing pigs to improve pellet quality.
750-900
750-900
750-900
500-600
500-600
450-550
550-650
750-900
450-600
AVERAGE GRAIN MICRON, µPHASE OF PRODUCTION

N3
Evaluating particle size For details about particle size testing methodology (time and whether to use an agitator or flow agent) please refer to Steinhart (2011b) and to Benz and Goodband (2015). For current methodology on particle size evaluation please visit http://www.asi.k-state.edu/research-and-extension/swine/particle-size-information.html.
PELLET VS. MEALPigs fed high-quality pellets will have improved feed efficiency. As pellet quality becomes poorer, the advantage in feed efficiency declines until no difference is found when the feed contains 50% fines or more at the feeder. Diet formulation has a major impact on pellet quality. Equally important is checking the pellet mill temperature, cooled pellet temperature, and pellet durability.
For nursery pigs, feeding pelleted diets in the first phase has been shown to increase feed intake and F/G by, approximately, 8% (Groesbeck et al., 2005) and to improve flow ability of the diets (DeRouchey et al., 2007). However, due to inclusion of high amounts of lactose and specialty protein sources, the inclusion of 2 to 3% fat is needed to facilitate the pelleting process. Diets with high inclusion of lactose sources are difficult to pellet, thus, care must be taken when using high inclusion rate (Leaver, 1988). Furthermore, in Phase 1 diets, pelleting temperatures lower than 170°F are typically used to avoid denaturing proteins from these diets that more typically contain higher levels of animal plasma and milk products (Steidinger et al., 2000). For pelleted diets, it is important to have less than 20% fines or otherwise the positive effects of pelleting are likely lost (Nemechek et al., 2012). A recent summary of experiments concluded that feed efficiency would increase 0.03 for each 10% increase in fines (De Jong, 2015).
PIC has performed a number of large scale trials comparing feed form of meal and pellets on feed efficiency. Trial results typically show that feeding high quality pellets to finishing pigs improve feed efficiency in all sire lines by, approximately, 6% (PIC internal data); however, the improvement of full-value pigs may be higher (1 to 3%) in meal diets for some lines.

O1
Once a diet is correctly formulated and manufactured, the appropriate feeding system and feeder space need to be in place. Similarly, ad libitum water through adequate drinker availability is a must.
For information on feeding systems, feeder space, and drinking systems please refer to PIC management manuals at http://na.picgenus.com/resources.aspx.
Section O:
FEEDING SYSTEMS, FEEDER SPACE, DRINKING SYSTEMS
NEVER STOP IMPROVING

P1
PIC NUTRIENT SPECIFICATIONS FOR SEXUALLY ACTIVE BOARS (AS-FED).This tables are presented in percentage for practical reasons. Nutrients should be considered in grams of intake per day based on farm-specific feed intake.
Section P:
NUTRIENT SPECIFICATION TABLES
NRC NEb
NRC MEEstimated feed intake + 5% wastage Neutral Detergent Fiber (NDF), min.Standardized Ileal Digestible amino acids Lysine Methionine + cysteine:Lysine Threonine:Lysine Tryptophan:Lysine Valine:Lysine Isoleucine:Lysine Leucine:Lysine Histidine:Lysine Phenylalanine + tyrosine:LysineL-Lysine-HCl, max.c
Mineralsd
Total calcium Av. phosphorus STTD phosphoruse
Sodiumf
ChlorideAdded trace minerals Zinc Iron Manganese Copper Iodine Seleniumg
Added vitaminsh,i
Vitamin A Vitamin D Vitamin E Vitamin K (menadione) Cholinej
Niacin Riboflavin Pantothenic acid Vitamin B12 Folic Acid Biotin Thiamin Vitamin B6 (Pyridoxine)Linoleic acid
aThese feed specifications should be used as a guide. They require adjustment for feed intake, local conditions, and markets.bNet energy was estimated using a conversion factor of 0.74 from metabolizable energy. For different diet compositions this may vary (i.e., 0.73 to 0.76) depending on the ingredients used.cL-Lysine-HCl maximum inclusions are recommended based on corn and soybean meal based diets and are to be used as a guideline.dCalcium and phosphorus values are considering release due to phytase; however, release values need to be based on suppliers’ recommendation established from peer-reviewed scientific research.eStandardized total tract digestible phosphorus.fSodium: if sodium levels are not known in major ingredients use at least 80% of sodium coming from sodium chloride.gOrganic selenium is typically used for boars.hBoars tend to be 2.5x NRC for vitamins in general with extra margins set for several micronutrients. Add 5.1 IU of Vitamin E/kg of complete diet for each 1% fat above 3% total dietary fat.iPelleting and (or) expanding decreases vitamin stability by 10-12% and 15-20% respectively. Consult vitamin manufacturer to verify their specific vitamin stability under pelleting conditions so additional fortification can be made as required.jCholine content is based on corn and soybean meal based diets. For other diet compositions, a total level of 1325 mg of choline per kg should be achieved.
MJ/kgMJ/kgkg/day%
%RatioRatioRatioRatioRatioRatioRatioRatio%
%%%%%
PPMPPMPPMPPMPPMPPMper kg dietIU/kgIU/kgIU/kgmg/kgmg/kgmg/kgmg/kgmg/kgmcg/kgmcg/kgmcg/kgmg/kgmg/kg%
UNIT9.6612.922.511
0.62707420675865301140.25
0.800.400.400.220.22
12510050150.620.3
110252000110466044103337165555023.31.90
AMOUNTITEMa
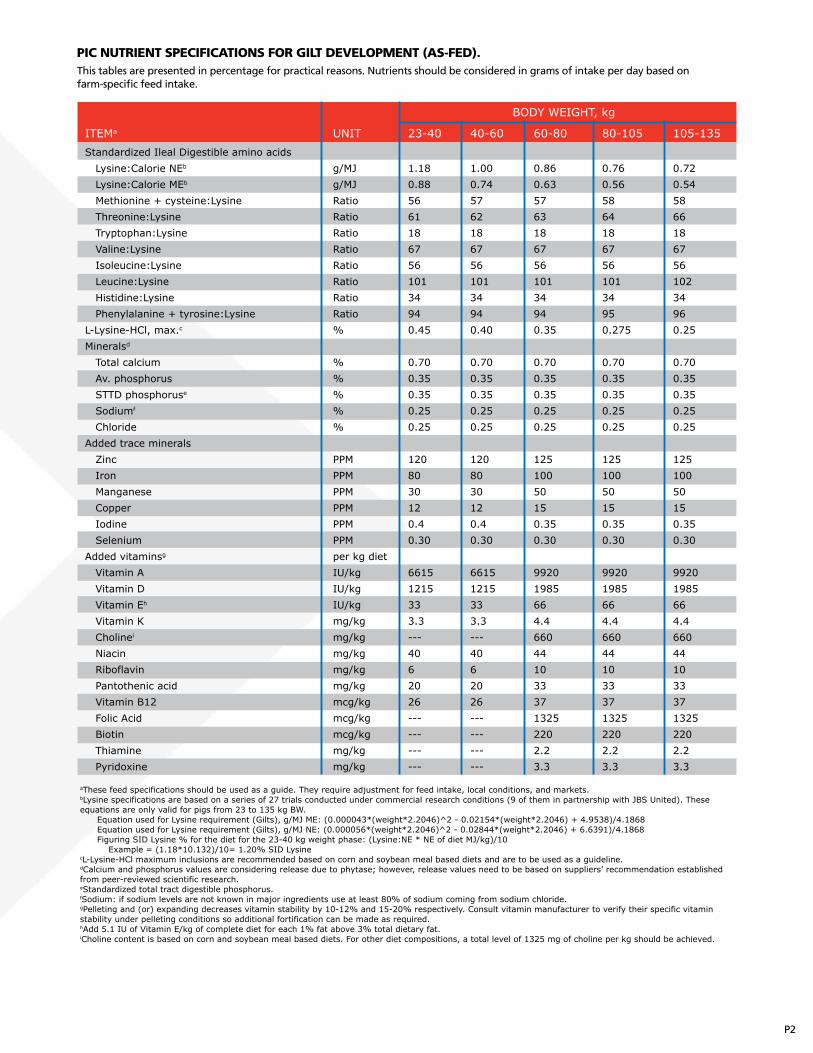
P2
PIC NUTRIENT SPECIFICATIONS FOR GILT DEVELOPMENT (AS-FED).This tables are presented in percentage for practical reasons. Nutrients should be considered in grams of intake per day based on farm-specific feed intake.
Standardized Ileal Digestible amino acids Lysine:Calorie NEb
Lysine:Calorie MEb
Methionine + cysteine:Lysine Threonine:Lysine Tryptophan:Lysine Valine:Lysine Isoleucine:Lysine Leucine:Lysine Histidine:Lysine Phenylalanine + tyrosine:LysineL-Lysine-HCl, max.c
Mineralsd
Total calcium Av. phosphorus STTD phosphoruse
Sodiumf
ChlorideAdded trace minerals Zinc Iron Manganese Copper Iodine SeleniumAdded vitaminsg
Vitamin A Vitamin D Vitamin Eh
Vitamin K Cholinei
Niacin Riboflavin Pantothenic acid Vitamin B12 Folic Acid Biotin Thiamine Pyridoxine
aThese feed specifications should be used as a guide. They require adjustment for feed intake, local conditions, and markets. bLysine specifications are based on a series of 27 trials conducted under commercial research conditions (9 of them in partnership with JBS United). These equations are only valid for pigs from 23 to 135 kg BW. Equation used for Lysine requirement (Gilts), g/MJ ME: (0.000043*(weight*2.2046)^2 - 0.02154*(weight*2.2046) + 4.9538)/4.1868 Equation used for Lysine requirement (Gilts), g/MJ NE: (0.000056*(weight*2.2046)^2 - 0.02844*(weight*2.2046) + 6.6391)/4.1868 Figuring SID Lysine % for the diet for the 23-40 kg weight phase: (Lysine:NE * NE of diet MJ/kg)/10 Example = (1.18*10.132)/10= 1.20% SID LysinecL-Lysine-HCl maximum inclusions are recommended based on corn and soybean meal based diets and are to be used as a guideline.dCalcium and phosphorus values are considering release due to phytase; however, release values need to be based on suppliers’ recommendation established from peer-reviewed scientific research.eStandardized total tract digestible phosphorus.fSodium: if sodium levels are not known in major ingredients use at least 80% of sodium coming from sodium chloride.gPelleting and (or) expanding decreases vitamin stability by 10-12% and 15-20% respectively. Consult vitamin manufacturer to verify their specific vitamin stability under pelleting conditions so additional fortification can be made as required.hAdd 5.1 IU of Vitamin E/kg of complete diet for each 1% fat above 3% total dietary fat.iCholine content is based on corn and soybean meal based diets. For other diet compositions, a total level of 1325 mg of choline per kg should be achieved.
g/MJg/MJ RatioRatioRatioRatioRatioRatioRatioRatio%
%%%%%
PPMPPMPPMPPMPPMPPMper kg dietIU/kgIU/kgIU/kgmg/kgmg/kgmg/kgmg/kgmg/kgmcg/kgmcg/kgmcg/kgmg/kgmg/kg
UNIT
1.180.88566118675610134940.45
0.700.350.350.250.25
1208030120.40.30
66151215333.3---4062026------------
23-40
1.000.74576218675610134940.40
0.700.350.350.250.25
1208030120.40.30
66151215333.3---4062026------------
40-60
0.860.63576318675610134940.35
0.700.350.350.250.25
12510050150.350.30
99201985664.46604410333713252202.23.3
60-80
0.760.56586418675610134950.275
0.700.350.350.250.25
12510050150.350.30
99201985664.46604410333713252202.23.3
80-105
0.720.54586618675610234960.25
0.700.350.350.250.25
12510050150.350.30
99201985664.46604410333713252202.23.3
105-135ITEMa
BODY WEIGHT, kg

P3
PIC NUTRIENT SPECIFICATIONS FOR GESTATING GILTS AND SOWS IN IDEAL BODY CONDITION (AS-FED).This tables are presented in percentage for practical reasons. Nutrients should be considered in grams of intake per day based on farm-specific feed intake.
NRC Net energy (NE) dietc
NRC NE, d 0-28 NRC NE, d 28-90 NRC NE, d 90-112NRC Metabolizable energy (ME) diet NRC ME, d 0-28 NRC ME, d 28-90 NRC ME, d 90-112Estimated feed intake + 5% wastaged,e
Standardized Ileal Digestible amino acids Lysine Methionine + cysteine:Lysine Threonine:Lysine Tryptophan:Lysine Valine:Lysine Isoleucine:Lysine Leucine:Lysine Histidine:Lysine Phenylalanine + tyrosine:LysineL-Lysine-HCl, max.f
Mineralsg
Total calcium Av. phosphorus STTD phosphorush
Sodiumi
ChlorideAdded trace minerals Zinc Iron Manganese Copper Iodine SeleniumAdded vitaminsj,k
Vitamin A Vitamin D Vitamin El
Vitamin K (menadione) Cholinem
Niacin Riboflavin Pantothenic acid Vitamin B12 Folic Acid Biotin Thiamin Vitamin B6 (Pyridoxine)
aThese feed specifications should be used as a guide. They require adjustment for feed intake, local conditions, and markets.bAssumption: Gilt – 135 kg body weight (BW) at breeding and 34 kg net maternal gain, Sow – 180 kg BW at breeding and 9 kg net maternal gain.cNet energy was estimated using a conversion factor of 0.74 from metabolizable energy. For different diet compositions this may vary (i.e., 0.73 to 0.76) depending on the ingredients used.dFor thin sows, provide 42.7 MJ ME or 31.8 MJ NE per day until recovery. For fat sows, provide 21.8 MJ ME or 15.9 MJ NE per day until return to ideal condition.eIf gestating gilts or sows are fed less than the recommended amount of feed per day, the percentage levels need to be adjusted to achieve the minimum amount in grams per day of each nutrient.fL-Lysine-HCl maximum inclusions are recommended based on corn and soybean meal based diets and are to be used as a guideline.gCalcium and phosphorus values are considering release due to phytase; however, release values need to be based on suppliers’ recommendation established from peer-reviewed scientific research.hStandardized total tract digestible phosphorus.iSodium: if sodium levels are not known in major ingredients use at least 80% of sodium coming from sodium chloride.jGilts and sows vitamins tend to be 2.5 x NRC in general.kPelleting and (or) expanding decreases vitamin stability by 10-12% and 15-20% respectively. Consult vitamin manufacturer to verify their specific vitamin stability under pelleting conditions so additional fortification can be made as required.lAdd 5.1 IU of Vitamin E/kg of complete diet for each 1% fat above 3% total dietary fat.mCholine content is based on corn and soybean meal based diets. For other diet compositions, a total level of 1325 mg of choline per kg should be achieved.
MJ/kgMJ/dMJ/dMJ/dMJ/kgMJ/dMJ/dMJ/dkg/day
%RatioRatioRatioRatioRatioRatioRatioRatio%
%%%%%
PPMPPMPPMPPMPPMPPMper kg dietIU/kgIU/kgIU/kgmg/kgmg/kgmg/kgmg/kgmg/kgmcg/kgmcg/kgmcg/kgmg/kgmg/kg
UNIT10.0018.018.027.213.5224.724.736.82.18
0.6070761971589235960.25
0.850.400.440.240.24
12510050150.350.3
99201985664.46604410333713252202.23.3
GILTS10.0022.618.018.013.5230.624.724.72.09
0.6070761971589235960.25
0.850.400.440.240.24
12510050150.350.3
99201985664.46604410333713252202.23.3
SOWS10.00---------13.52---------2.13
0.6070761971589235960.25
0.850.400.440.240.24
12510050150.350.3
99201985664.46604410333713252202.23.3
HERDITEMa,b

P4
PIC NUTRIENT SPECIFICATIONS FOR LACTATING GILTS AND SOWS (AS-FED).This tables are presented in percentage for practical reasons. Nutrients should be considered in grams of intake per day based on farm-specific feed intake.
Net Weight Body Lossb
Fat Loss, Maxb
Litter Growthb
NRC NEc
NRC NENRC MENRC MEAverage Feed Intake (28-d lactation)Standardized Ileal Digestible amino acids Lysine Lysine (28-d lactation) Methionine + cysteine:Lysine Threonine:Lysine Tryptophan:Lysine Valine:Lysine Isoleucine:Lysine Leucine:Lysine Histidine:Lysine Phenylalanine + tyrosine:LysineL-Lysine-HCl, max.d
Mineralse
Total calcium Av. phosphorus STTD phosphorusf
Sodiumg
ChlorideAdded trace minerals Zinc Iron Manganese Copper Iodine SeleniumAdded vitaminsh,i
Vitamin A Vitamin D Vitamin Ej
Vitamin K (menadione) Cholinek
Niacin Riboflavin Pantothenic acid Vitamin B12 Folic Acid Biotin Thiamin Vitamin B6 (Pyridoxine)
aThese feed specifications should be used as a guide. They require adjustment for feed intake, local conditions, and markets.bAssumption: Gilt – 135 kg body weight (BW) at breeding and 34 kg net maternal gain, sow – 180 kg BW at breeding and 9 kg net maternal gain. Assuming 175 kg BW post farrowing, 10 kg weight loss and 2500-2800 g/d litter growth.cNet energy was estimated using a conversion factor of 0.74 from metabolizable energy. For different diet compositions this may vary (i.e., 0.73 to 0.76) depending on the ingredients used.dL-Lysine-HCl maximum inclusions are recommended based on corn and soybean meal based diets and are to be used as a guideline.eCalcium and phosphorus values are considering release due to phytase; however, release values need to be based on suppliers’ recommendation established from peer-reviewed scientific research.fStandardized total tract digestible phosphorus.gSodium: if sodium levels are not known in major ingredients use at least 80% of sodium coming from sodium chloride.hSows tend to be 2.5 x NRC for vitamins in general.iPelleting and (or) expanding decreases vitamin stability by 10-12% and 15-20% respectively. Consult vitamin manufacturer to verify their specific vitamin stability under pelleting conditions so additional fortification can be made as required.jAdd 5.1 IU of Vitamin E/kg of complete diet for each 1% fat above 3% total dietary fat.kCholine content is based on corn and soybean meal based diets. For other diet compositions, a total level of 1325 mg of choline per kg should be achieved.
%mmkg/dMJ/kgMJ/dMJ/kgMJ/dkg/d
g/d%RatioRatioRatioRatioRatioRatioRatioRatio%
%%%%%
PPMPPMPPMPPMPPMPPMper kg dietIU/kgIU/kgIU/kgmg/kgmg/kgmg/kgmg/kgmg/kgmcg/kgmcg/kgmcg/kgmg/kgmg/kg
UNIT<100-22.5010.4254.414.0873.35,49
631.155364196456114401130.45
0.850.400.440.240.24
12510050150.350.3
99201985664.46604410333713252202.23.3
GILTS<100-22.7210.4264.514.0886.76,44
630.985364196456113401120.45
0.850.400.440.240.24
12510050150.350.3
99201985664.46604410333713252202.23.3
SOWS<100-22.6110.4262.414.0884.26,26
631.015364196456114401130.45
0.850.400.440.240.24
12510050150.350.3
99201985664.46604410333713252202.23.3
HERDITEMa,b

P5
PIC NUTRIENT SPECIFICATIONS FOR NURSERY PIGS (AS-FED).This tables are presented in percentage for practical reasons. Nutrients should be considered in grams of intake per day based on farm-specific feed intake.
Growth rateFeed intakeb
Feed:gainNRC NEc,d
NRC MEc
Standardized Ileal Digestible (SID) Amino acidse
Lysine Methionine + cysteine:Lysine Threonine: Lysine Tryptophan: Lysine Valine: Lysine Isoleucine:Lysinef
Leucine:Lysine Histidine:Lysine Phenilalanine+Tyrosine:LysineMineralse,g
Total calcium Available phosphorus STTD phosphorush
Sodiumi
ChlorideAdded trace minerals Zincj
Ironk
Manganese Copperl
Iodine SeleniumAdded vitaminsm,n
Vitamin A Vitamin D Vitamin E Vitamin K Cholineo
Niacin Riboflavin Pantothenic acid Vitamin B12 Folic Acid Biotin Thiamine PyridoxineMaximum specifications Soybean mealp
Total Lysine:CPq
Recommended specifications Highly dig. proteinr
Highly dig. carbohydrates
Added fatt
aThese specifications should be used as a guideline and adapted for local conditions, legislation, and markets. All values using NRC (2012) ingredient loading values.bAverage Intake shown for 11,5-23 kg pig assumes pelleted. Add 5% for grind and mix.cEnergy levels are guidelines and should be adjusted according to market price and specific-farm scenario.dNet energy was estimated using a conversion factor of 0.74 from metabolizable energy. For different diet compositions this may vary (i.e., 0.73 to 0.76) depending on the ingredients used.eNutrients should be factored accordingly when feeding differing energy values. fDiet with < 2% blood cells. If great than 2% blood cells the SID Isoleucine:Lysine should be 0.60.gCalcium and phosphorus values are considering release due to phytase; however, release values need to be based on suppliers’ recommendation established from peer-reviewed scientific research.hStandardized total tract digestible phosphorus.iSodium: if sodium levels are not known in major ingredients use at least 80% of sodium coming from sodium chloride.jMaximum duration from weaning to 11,5 kg BW. High levels of zinc to improve growth performance follow: < 7,5 kg use 3000 PPM; and for 7,5-11,5 kg use 2000 PPM. Different countries have different regulations regarding the use of zinc as growth promoter, follow your country’s regulation.kSupplemental iron are 200 ppm because of the substantial iron content of di-calcium phosphate and because high iron intake encourages E. coli proliferation in the young pig.lHigh levels of copper to improve growth performance is 250 PPM for 11,5-23 kg pigs. Inorganic forms assumed. Different countries have different regulations regarding the use of copper as growth promoter, follow your country’s regulation.mVitamins supplemented at, approximately, 4 x NRC (2012) on average. Add 5,1 IU of Vitamin E/kg of complete diet for each 1% fat above 3% total dietary fat.nPelleting and (or) expanding decreases vitamin stability by 10-12% and 15-20% respectively. Consult vitamin manufacturer to verify their specific vitamin stability under pelleting conditions so additional fortification can be made as required.oCholine content is based on corn and soybean meal based diets. For other diet compositions, a total level of 1325 mg of choline per kg should be achieved. pSuggested levels for commercial production and good to high health. High health pigs can tolerate higher levels of SBM (30% for 7,5-11,5 kg and 32% for 11,5-23 kg BW).qBased on Ratliff et al., 2005.rFor example, high quality fish meal, animal plasma, blood meal, enzymatically treated soybean meal, etc.;sThe most common highly digestible carbohydrate source is edible-grade lactose. Other highly digestible carbohydrates source can replace part of lactose if economical (i.e., maltose, dextrose, micronized corn, micronized rice, maltodextrin, etc).tIf Phase 1 is pelleted, use at least 2 to 3% added fat to facilitate the pelleting process.
kg/dkg/dRatioMJ/kgMJ/kg
%RatioRatioRatioRatioRatioRatioRatioRatio
%%%%%
PPMPPMPPMPPMPPMPPMper kg dietIU/kgIU/kgIU/kgmg/kgmg/kgmg/kgmg/kgmg/kgmcg/kgmcg/kgmcg/kgmg/kgmg/kg
%Ratio
%%%
UNIT---------10.5214.21
1.4658602067551003492
0.850.550.570.35-0.600.35-0.60
15020050180.650.30
110251765855.55957013405510502753.57.0
157.1
8-12202 to 3
3.5-5.50,230,261.1610.5214.21
1.4658602067551003492
0.850.550.570.35-0.400.35-0.40
15020050180.650.30
110251765855.55957013405510502753.57.0
207.1
5-10153 to 5
5.5-7.50,410,541.3110.5214.21
1.4258601967551003492
0.790.400.440.25-0.300.25-0.30
15020050180.650.30
110251765855.55957013405510502753.57.0
287.1
3-57.53 to 5
7.5-11.50,661,001.5210.5214.21
1.3358601967551003492
0.710.370.390.250.25
15020050180.650.30
110251765855.55957013405510502753.57.0
28-327.1
------3 to 5
11.5-23ITEMa
BODY WEIGHT, kg
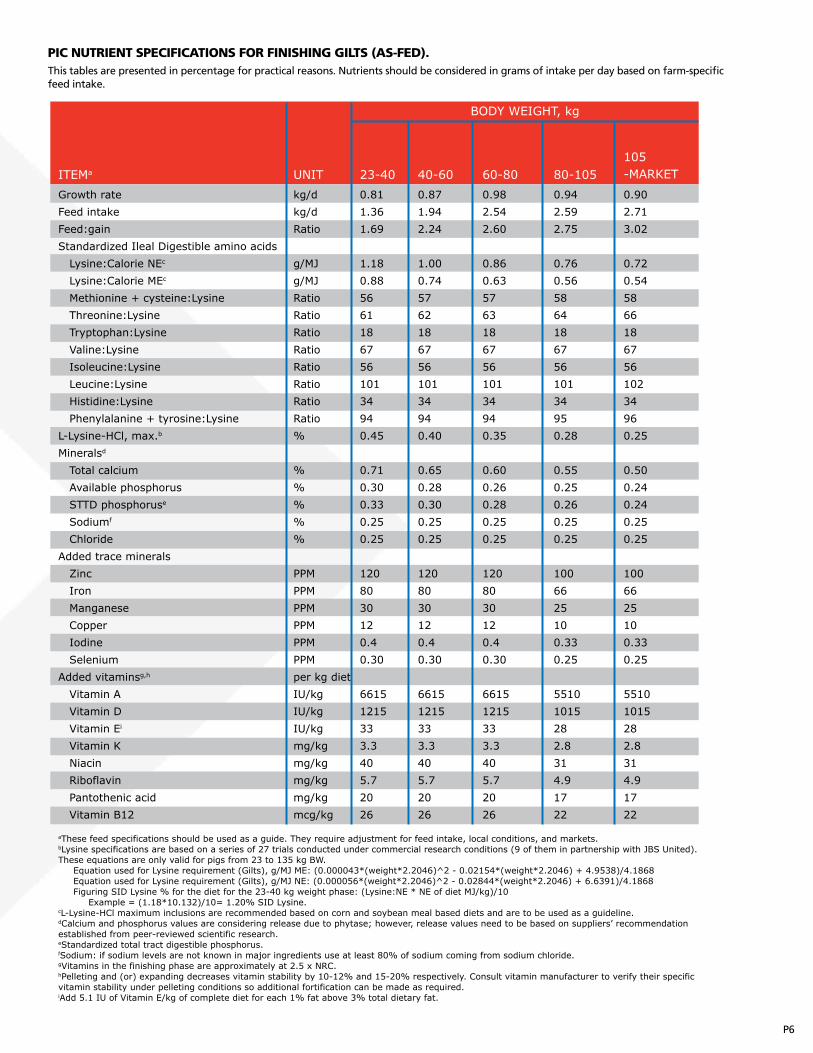
P6
PIC NUTRIENT SPECIFICATIONS FOR FINISHING GILTS (AS-FED).This tables are presented in percentage for practical reasons. Nutrients should be considered in grams of intake per day based on farm-specific feed intake.
Growth rateFeed intakeFeed:gainStandardized Ileal Digestible amino acids Lysine:Calorie NEc
Lysine:Calorie MEc
Methionine + cysteine:Lysine Threonine:Lysine Tryptophan:Lysine Valine:Lysine Isoleucine:Lysine Leucine:Lysine Histidine:Lysine Phenylalanine + tyrosine:LysineL-Lysine-HCl, max.b
Mineralsd
Total calcium Available phosphorus STTD phosphoruse
Sodiumf
ChlorideAdded trace minerals Zinc Iron Manganese Copper Iodine SeleniumAdded vitaminsg,h
Vitamin A Vitamin D Vitamin Ei
Vitamin K Niacin Riboflavin Pantothenic acid Vitamin B12
kg/dkg/dRatio
g/MJ g/MJ RatioRatioRatioRatioRatioRatioRatioRatio%
%%%%%
PPMPPMPPMPPMPPMPPMper kg dietIU/kgIU/kgIU/kgmg/kgmg/kgmg/kgmg/kgmcg/kg
UNIT 23-40 40-60 60-80 80-105105-MARKETITEMa
BODY WEIGHT, kg
aThese feed specifications should be used as a guide. They require adjustment for feed intake, local conditions, and markets.bLysine specifications are based on a series of 27 trials conducted under commercial research conditions (9 of them in partnership with JBS United). These equations are only valid for pigs from 23 to 135 kg BW. Equation used for Lysine requirement (Gilts), g/MJ ME: (0.000043*(weight*2.2046)^2 - 0.02154*(weight*2.2046) + 4.9538)/4.1868 Equation used for Lysine requirement (Gilts), g/MJ NE: (0.000056*(weight*2.2046)^2 - 0.02844*(weight*2.2046) + 6.6391)/4.1868 Figuring SID Lysine % for the diet for the 23-40 kg weight phase: (Lysine:NE * NE of diet MJ/kg)/10 Example = (1.18*10.132)/10= 1.20% SID Lysine.cL-Lysine-HCl maximum inclusions are recommended based on corn and soybean meal based diets and are to be used as a guideline.dCalcium and phosphorus values are considering release due to phytase; however, release values need to be based on suppliers’ recommendation established from peer-reviewed scientific research.eStandardized total tract digestible phosphorus.fSodium: if sodium levels are not known in major ingredients use at least 80% of sodium coming from sodium chloride.gVitamins in the finishing phase are approximately at 2.5 x NRC.hPelleting and (or) expanding decreases vitamin stability by 10-12% and 15-20% respectively. Consult vitamin manufacturer to verify their specific vitamin stability under pelleting conditions so additional fortification can be made as required.iAdd 5.1 IU of Vitamin E/kg of complete diet for each 1% fat above 3% total dietary fat.
0.811.361.69
1.180.88566118675610134940.45
0.710.300.330.250.25
1208030120.40.30
66151215333.3405.72026
0.871.942.24
1.000.74576218675610134940.40
0.650.280.300.250.25
1208030120.40.30
66151215333.3405.72026
0.982.542.60
0.860.63576318675610134940.35
0.600.260.280.250.25
1208030120.40.30
66151215333.3405.72026
0.942.592.75
0.760.56586418675610134950.28
0.550.250.260.250.25
1006625100.330.25
55101015282.8314.91722
0.902.713.02
0.720.54586618675610234960.25
0.500.240.240.250.25
1006625100.330.25
55101015282.8314.91722

P7
PIC NUTRIENT SPECIFICATIONS FOR FINISHING BARROWS (AS-FED).This tables are presented in percentage for practical reasons. Nutrients should be considered in grams of intake per day based on farm-
specific feed intake.
Growth rateFeed intakeFeed:gainStandardized Ileal Digestible amino acids Lysine:Calorie NEb
Lysine:Calorie MEb
Methionine + cysteine:Lysine Threonine:Lysine Tryptophan:Lysine Valine:Lysine Isoleucine:Lysine Leucine:Lysine Histidine:Lysine Phenylalanine + tyrosine:LysineL-Lysine-HCl, max.c
Mineralsd
Total calcium Available phosphorus STTD phosphoruse
Sodiumf
ChlorideAdded trace minerals Zinc Iron Manganese Copper Iodine SeleniumAdded vitaminsg,h
Vitamin A Vitamin D Vitamin Ei
Vitamin K Niacin Riboflavin Pantothenic acid Vitamin B12
aThese feed specifications should be used as a guide. They require adjustment for feed intake, local conditions, and markets.bLysine specifications are based on a series of 27 trials conducted under commercial research conditions (9 of them in partnership with JBS United). These equations are only valid for pigs from 23 to 135 kg BW. Equation used for Lysine requirement (Barrows), g/MJ ME: (0.000031*(weight*2.2046)^2 - 0.0176*(weight*2.2046) + 4.5523)/4.1868 Equation used for Lysine requirement (Barrows), g/MJ NE: (0.000042*(weight*2.2046)^2 - 0.02372*(weight*2.2046) + 6.1452)/4.1868 Figuring SID Lysine % for the diet for the 23-40 kg weight phase: (Lysine:NE * NE of diet/kg)/10 Example = (1.12*10.15)/10= 1.14% SID LysinecL-Lysine-HCl maximum inclusions are recommended based on corn and soybean meal based diets and are to be used as a guideline.dCalcium and phosphorus values are considering release due to phytase; however, release values need to be based on suppliers’ recommendation established from peer-reviewed scientific research.eStandardized total tract digestible phosphorus.fSodium: if sodium levels are not known in major ingredients use at least 80% of sodium coming from sodium chloride.gVitamins in the finishing phase are approximately at 2.5 x NRC.hPelleting and (or) expanding decreases vitamin stability by 10-12% and 15-20% respectively. Consult vitamin manufacturer to verify their specific vitamin stability under pelleting conditions so additional fortification can be made as required.iAdd 5.1 IU of Vitamin E/kg of complete diet for each 1% fat above 3% total dietary fat.
kg/dkg/dRatio
g/MJg/MJ RatioRatioRatioRatioRatioRatioRatioRatio%
%%%%%
PPMPPMPPMPPMPPMPPMper kg dietIU/kgIU/kgIU/kgmg/kgmg/kgmg/kgmg/kgmcg/kg
UNIT0.831.431.73
1.120.83566118675610134940.45
0.700.300.330.250.25
1208030120.40.30
66151215333.3405.72026
23-400.902.062.30
0.960.71576218675610134940.40
0.640.280.300.250.25
1208030120.40.30
66151215333.3405.72026
40-601.022.642.58
0.830.61576318675610134950.35
0.580.260.270.250.25
1208030120.40.30
66151215333.3405.72026
60-800.982.672.73
0.730.54586518675610234950.28
0.530.250.250.250.25
1006625100.330.25
55101015282.8314.91722
80-1050.912.773.05
0.670.49596718675610234960.25
0.480.240.240.250.25
1006625100.330.25
55101015282.8314.91722
105-MARKETITEMa
BODY WEIGHT, kg

Q1
Bibliography
Adeola O., and A. J. Cowieson. 2011. Board-invited review: opportunities and challenges in using exogenous enzymes to improve nonruminant animal production. J Anim. Sci. 89:3189-3218.Almond, G., W. L. Flowers, L. Batista, and S. D’Allaire. 2006. Disease of the reproductive system. In: B. E. Straw, J. J. Zimmerman, S. D’Allaire, and D. J. Taylor, (Eds.), Diseases of swine 9th ed. Blackwell Publishing, Ames, IA. p. 113-147.Ampaire, A., and C. L. Levesque. 2016. Effect of altered lysine:energy ratio during gestation on wean pig growth performance. J. Anim. Sci. 94:121. (Abstr.)Apple, J. K. 2013. Swine Nutrition and Pork Quality.In: L. I. Chiba, editor, Sustainable Swine Nutrition, Blackwell Publishing Ltd., Oxford, UK. p. 413-437.Asmus M. D., J. M. DeRouchey, M. D. Tokach, S. S. Dritz, T. A. Houser, J. L. Nelssen, and R. D. Goodband. 2014. Effects of lowering dietary fiber before marketing on finishing pig growth performance, carcass characteristics, carcass fat quality, and intestinal weights. J Anim Sci. 92:119-128.Benz, C. K., and R. D. Goodband. 2015. Three-sieve particle size analysis procedures. http://www.asi.k-state. edu/species/swine/research-and-extension/particle-size-information.html (Accessed 3rd February 2016.)Bergstrom, J. R., C. N. Groesbeck, J. M. Benz, M. D. Tokach, J. L. Nelssen, J. M. DeRouchey, R. D. Goodband, and S. S. Dritz. 2007. An evaluation of dextrose, lactose, and whey sources in phase 2 starter diets for weanling pigs. In: Swine Day Report of Progress, Manhattan, Kansas. Kansas State University, Agricultural Experiment Station and Cooperative Extension Service. p. 60-65.Boyd, R. D. and C. Rush. 2015. Improving finish pig viability by using the feed enzyme xylanase. Proc. Leman Swine Conference, St. Paul, MN.Boyd, R. D., K. J. Touchette, G. C. Castro, M. E. Johnston, K. U. Lee, and I. K. Han. 2000. Recent advances in amino acid and energy nutrition of prolific sows. Asian Australasian Journal of Animal Sciences. 11:1638- 1652.Boyd, R. D., G. C. Castro, and R. A. Cabrera. 2002. Nutrition and management of the sow to maximize lifetime productivity. Advances in Pork Production. 13:47.Buis, R. Q., D. Wey, and C. F. M. de Lange. 2016. Development of precision gestation feeding program using electronic sow feeders and effects on gilt performance. J. Anim. Sci. 94:122. (Abstr.)Cabezón, F. A., K. R. Stewart, A. P. Schinckel, B. Barnes, R. D. Boyd, P. Wilcock, and J. Woodliff. 2016b. Effect of natural betaine on estimates of semen quality in mature AI boars during summer heat stress. Anim. Reprod. Sci. DOI: http://dx.doi.org/10.1016/j.anireprosci.2016.03.009Cabezón, F. A., A. P. Schinckel, B. T. Richert, K. R. Stewart, M. Gandarillas, and W. A. Peralta. 2016a. Analysis of lactation feed intakes for sows including data on environmental temperatures and humidity. Professional Animal Scientist, submitted.Coble K., J. M. DeRouchey, M. D. Tokach, S. S. Dritz, R. D. Goodband, and J.C. Woodworth. 2015. The importance of implementing a by-product withdraw strategy prior to slaughter in finishing pigs: A review of strategies that mitigate the negative impact on carcass yield. J Anim Sci. 93:48. (Abstr.)Cools, A. D. M., R. Decaluwé, J. Buyse, T. A. T. G. van Kempend, A. Liesegange, and G. P. J. Janssens. 2014. Ad libitum feeding during the peripartal period affects body condition, reproduction results and metabolism of sows. Anim. Reprod. Sci. 145:130-140.Cromwell, G. L., D. D. Hall, A. J. Clawson, G. E. Combs, D. A. Knabe, C. V. Maxwell, P. R. Noland, D. E. Orr, and T. J. Prince. 1989. Effects of additional feed during late gestation on reproductive performance of sows: A cooperative study. J Anim Sci 67:3–14.CVB, 2008. Central Bureau for Livestock Feeding, Lelystad, Netherlands.De Jong, J. 2015. Feed Efficiency Evaluator For Finishing Pigs. http://www.asi.k-state.edu/species/swine/ research-and-extension/FG%20Evaluation%20Tool%20v3_1.xlsm (Accessed 5 December 2016.)Decaluwe, R., D. Maes, A. Cools, B. Wuyts, S. De Smet, B. Marescau, P. P. De Deyn, and G. P. J. Janssens. 2014. Effect of peripartal feeding strategy on colostrum yield and composition in sows. J. Anim. Sci. 92:3557- 3567.
NEVER STOP IMPROVING

Q2
DeRouchey, J. M., S. S. Dritz, R. D. Goodband, J. L. Nelssen, and M. D. Tokach. 2007. Starter Pig Recommendations. Kansas State University Agricultural Experiment Station and Cooperative Extension Service MF-2300. p. 16.Eder, K., A. Ramanau, and H. Kluge. 2001. Effect of L-carnitine supplementation on performance parameters in gilts and sows. J. Anim. Physiol. Anim. Nutr. 85:73–80.Estienne, M. J., A. F. Harper, and R. J. Crawford. 2008. Dietary supplementation with a source of omega-3 fatty acids increases sperm number and the duration of ejaculation in boars. Theriogenology. 70(Suppl. 1):70- 76.Euken, R. M.2012. Swine Feed Efficiency: Effect of dietary energy on feed efficiency. http://www. swinefeedefficiency.com/ (Accessed 5 December 2016.)Fraser, D. 1987. Mineral deficient diets and the pig’s attraction to blood: implications for tail-biting, Can. J. Anim. Sci., 67:909.Gaines, A. M., B. A. Peterson, and O. F. Mendoza. 2012. Herd management factors that influence whole herd feed efficiency. In: J. Patience, editor, Feed efficiency in swine. Wageningen Academic Publishers, Wageningen, The Netherlands. p. 15-39.Gaines, A. M., J. D. Spencer, G. I. Petersen, N. R. Augspurger, and S. K. Kitt. 2007. Effect of corn distiller’s dried grains with solubles (DDGS) withdrawal program on growth performance and carcass yield in grow-finish pigs. J. Anim. Sci. 85 (Suppl. 1): 438. (Abstr.)Gonçalves, M. A. D. 2015. Late gestation lysine and energy effects in sows and dose-responses to tryptophan and valine in finishing pigs. PhD Diss. Kansas State Univ., Manhattan, KS.Gonçalves, M. A. D., S. S. Dritz, M. D. Tokach, J. M. DeRouchey, J. C. Woodworth, and R. D. Goodband. 2016a. Fact sheets – comparing phytase sources for pigs and effects of superdosing phytase on growth performance of nursery and finishing pigs. J. Swine Health Prod. 24:97–101.Gonçalves, M. A. D., K. M. Gourley, S. S. Dritz, M. D. Tokach, N. M. Bello, J. M. DeRouchey, J. C. Woodworth, and R. D. Goodband. 2016b. Effects of amino acids and energy intake during late gestation of high- performing gilts and sows on litter and reproductive performance under commercial conditions. J. Anim. Sci. 94: 1993-2003.Goodband, R. D., M. D. Tokach, M. A. D. Gonçalves, J. C. Woodworth, S. S. Dritz, and J. M. DeRouchey. 2013. Nutritional enhancement during pregnancy and its effects on reproduction in swine. Animal Frontiers, 3: 68-75.Goodband, R. D., M. D. Tokach, and J. L. Nelssen. 2002. The Effects of Diet Particle Size on Animal Performance. Kansas State University, Agricultural Experiment Station and Cooperative Extension Service. p. 6.Graham, A., K. J. Touchette, S. Jungst, M. Tegtmeyer, J. Connor, and L. Greiner. 2015. Impact of feeding level postweaning on wean to estrus interval, conception and farrowing rates, and subsequent farrowing performance. J. Anim. Sci. 93:65. (Abstr.)Greiner, L., A. Graham, K. J. Touchette, and C. R. Neill. 2016. The evaluation of increasing lysine or feed amounts in late gestation on piglet birth weights. J. Anim. Sci. 94:120. (Abstr.)Groesbeck, C. N., M. D. Tokach, R. D. Goodband, J. L. Nelssen, J. M. DeRouchey, and S. S. Dritz. 2005. The effects of meal transition diets on nursery pig growth performance in a commercial environment. Kansas State University Swine Day. p. 104-110.Hill, G. M. 2013. Minerals and mineral utilization in swine. Sustainable Swine Nutrition. p. 173-196.Holloway, C.L., R.D. Boyd, and J.F. Patience. 2015. Improving nutrient utilization through the use of superdosing of phytase in growing pig diets. J Anim Sci. 93:56. (Abstr.).Jacela, J. Y., J. M. DeRouchey, M. D. Tokach, R. D. Goodband, J. L. Nelssen, D. G. Renter, and S. S. Dritz. 2010. Feed additives for swine: fact sheets–high dietary levels of copper and zinc for young pigs, and phytase. J. of Swine Health and Prod. 18: 87-91.Jacela, J. Y., J. M. Benz, S. S. Dritz, M. D. Tokach, J. M. DeRouchey, R. D. Goodband, J. L. Nelssen, and K. J. Prusa. 2010. Effect of dried distillers grains with solubles (DDGS) withdrawal regimens on finishing pig performance and carcass traits. J Anim Sci. 88:53. (Abstr.).JBS United. 2009. Internal data.
Q3
Johnston, S. L., and L.L. Southern. 2000. Effect of phytase addition on amino acid and dry matter digestibilities and growth in pigs. In: Proc. 8th Symp. Digestive Phys. of pigs, Uppsala, Sweden. p. 326-328.Jones, A. M., J. C. Woodworth, R. D. Goodband, M. D. Tokach, S. S. Dritz, and J. M. DeRouchey. 2015. Effect of fish meal source on nursery pig performance.Kansas Agricultural Experiment Station Research Reports. p. 32.Kies, A. K., P. A. Kemme, L. B. J. Šebek, J. T. M. Van Diepen, and A. W. Jongbloed. 2006. Effect of graded doses and a high dose of microbial phytase on the digestibility of various minerals in weaner pigs. J Anim Sci. 84:1169-1175.Koehler, D. D., B. Corrigan, A. J. Elsbernd, S. A. Gould, C. L. Holloway, and J. F. Patience. 2015. Super-dosed phytase improves rate and efficiency of gain in nursery pigs. J Anim Sci. 93:56. (Abstr.).Langbein, K. B., R. D. Goodband, M. D. Tokach, S. S. Dritz, J. M. DeRouchey, and J. R. Bergstrom. 2013. Effects of high levels of phytase (Ronozyme HiPhos) in low-lysine diets on the growth performance of nursery pigs. Kansas State University Agricultural Experiment Station and Cooperative Extension Service. 1092:121:127.Leaver, R. 1988. The Pelleting Process. 2nd. ed. Sprout-Bauer, Mucy, PA.Madec, F., N. Bridoux, S. Bounaix, and A. Jestin. 1998. Measurement of digestive disorders in the piglet at weaning and related risk factors. Prev. Vet. Med. 35:53-72.Main, R. G., S. S.Dritz, M. D. Tokach, R. D. Goodband, and J. L. Nelssen. 2004. Increasing weaning age improves pig performance in a multisite production system. J. Anim. Sci. 82:1499-1507.Matte, J. J., and C. Lauridsen. 2013. Vitamins and vitamins utilization in swine. Sustainable Swine Nutrition. p. 139-172.Miller, H. M., G. R. Foxcroft, and F. X. Aherne. 2000. Increasing food intake in late gestation improved sow condition throughout lactation but did not affect piglet viability or growth rate. J. Anim. Sci. 71:141–148.Nemechek, J. E., E. Fruge, E. Hansen, M. D. Tokach, R. D. Goodband, J. M. DeRouchey, J. L. Nelssen, and S. S. Dritz. 2012. Effect of diet form and feeder adjustment on growth performance of nursery pigs. Kansas State University Swine Day. p. 278-289.Nitikanchana, S, S. S. Dritz, M. D. Tokach, J. M. DeRouchey, R. D. Goodband, B. J. White. 2015. Regression analysis to predict growth performance from dietary net energy in growing-finishing pigs. J Anim Sci. 93:2826-2839.Noblet, J., and J. van Milgen. 2004. Energy value of pig feeds: Effect of pig body weight and energy evaluation system. J. Anim. Sci. 82:229-238.NRC. 2012. Nutrient requirements of swine. 11th rev. ed. Natl. Acad. Press, Washington, DC.PIC Technical memo 142. 1996. Impact of dietary energy intake on sperm output.PIC Technical Memo 153. 1997. Relationship between dietary fatty acid profile and body fat composition in growing pigs.Ramanau, A., H. Kluge, J. Spilke, and K. Eder. 2008. Effects of dietary supplementation of l-carnitine on the reproductive performance of sows in production stocks. Livestock Science. 113:34–42.Ramanau, A., H. Kluge, J. Spilke, and K. Eder. 2002. Reproductive performance of sows supplemented with dietary L-carnitine over three reproductive cycles. Arch. Anim. Nutr. 56:287–296. National Swine Nutrition Guide, 2010. Editors: Reese, D., S. Carter, J,. DeRouchey, D. Meisinger, B. Richert, M. Shannon, H. Stein, J. Patience, R. Thaler, E. van Heugten, M. Whitney, C. Baer. 2010. National Swine Nutrition Guide. U.S. Pork Center of Excellence. Ren, P., X. J. Yang, J. S. Kim, D. Menon, D. Pangeni, H. Manu, A. Tekeste, and S. K. Baido. 2015. Effects of different feeding levels at three periods of gestation on sow and litter performance over two reproductive cycles. In: Proc. Leman Swine Conference, St. Paul, MN.Rijnen, M. W. J. A., M. W. A. Verstegen, M. J. W Heetkamp, and J. W. Schrama. 2003. Effects of two different dietary fermentable carbohydrates on activity and heat production in grouphoused pigs. J. Anim. Sci. 81:1210–1219.Shelton, N. W., C. R. Neill, J. M. DeRouchey, M. D. Tokach, R. D. Goodband, J. L. Nelssen, and S. S. Dritz. 2009. Effects of increasing feeding level during late gestation on sow and litter performance. In: Kansas State University. Agricultural Experiment Station and Cooperative Extension Service. p. 38–50.
NEVER STOP IMPROVING

Q4
Soto, J., L. Greiner, J. Connor, and G. Allee. 2011. Effects increasing feeding levels in sows during late gestation on piglet birth weights. J. Anim. Sci. 89:86. (Abstr.).Speight, S.M., M. J. Estienne, A. F. Harper, R. J. Crawford, J. W. Knight, and B. D. Whitaker. 2012. Effects of dietary supplementation with an organic source of selenium on characteristics of semen quality and in vitro fertility in boars. J. Anim. Sci. 90(Suppl. 3):761-770.Steidinger, M. U., R. D. Goodband, M. D. Tokach, S. S. Dritz, J. L. Nelssen, L. J. McKinney, B. S. Borg, and J. M. Campbell. 2000. Effects of pelleting and pellet conditioning temperatures on weanling pig performance. J. Anim. Sci. 78:3014-3018.Stein, H. H., and R. A. Easter. 1996. Dietary energy concentration effects carcass leanness in finishing hogs. University of Illinois Swine Research Reports, 41.Steinhart, T. 2011a. Swine feed efficiency: influence of particle size. http://www.swinefeedefficiency.com/ factsheets/IPIC25d%20SFE%20Influence%20of%20Particle%20Size.pdf (Accessed 3rd February 2016).Steinhart, T. 2011b. Swine feed efficiency: particle size testing methodology. http://www.swinefeedefficiency. com/factsheets/IPIC25d%20SFE%20Influence%20of%20Particle%20Size.pdf (Accessed 3rd February 2016).Stewart, K. R., C. L. Bradley, P. Wilcock, F. Domingues, M. Kleve-Feld, and J. Hundley. 2016. Superdosing phytase fed to mature boars improves semen concentration and reproductive efficiency. J. Anim. Sci. 94:106. (Abstr.)Straw, B., J. J. Zimmerman, S. D’Allaire, and D. J. Taylor. 2006. Disease of swine. Wiley. p. 1153.Sulabo, R. C., C. K. Jones, M. D. Tokach, R. D. Goodband, S. S. Dritz, D. R. Campbell, B. W. Ratliff, J. M. DeRouchey, and J. L. Nelssen. 2011. Factors affecting storage stability of various commercial phytase sources. J. Anim. Sci. 89:4262-4271.Sulabo, R. C., J. Y. Jacela, M. D. Tokach, S. S. Dritz, R. D. Goodband, Joel M. DeRouchey, and J. L. Nelssen. 2010. Effects of lactation feed intake and creep feeding on sow and piglet performance. J. Anim. Sci. 88: 3145- 3153.Thacker, P.A. 2001. Water in Swine Nutrition. In: A. J. Lewis, editor, Swine Nutrition, 2nd ed. L.L. CRC Press Southern. p. 381-398.Theil, P. K., C. Lauridsen, and H. Quesnel. 2014. Neonatal piglet survival: impact of sow nutrition around parturition on fetal glycogen deposition and production and composition of colostrum and transient milk. Animal. 8:1021–1030.Tokach, M. D., and M. A. D. Gonçalves. 2014. Impact of nutrition and other production factors on carcass quality in pigs. In: Proc. Latin America Pork Expo, Foz do Iguacu, Brazil. p. 9.Usry, J., R. Campbell, and D. Burnham. 1997. Optimizing energy formulation for finishing swine. In: Proc. 13th Annual Carolina Swine Nutrition Conference, Raleigh, NC.Walk, C. L., S. Srinongkote, and P. Wilcock. 2012. Evaluation of a superdose of a novel Escherichia coli phytase and zinc in piglets. J Anim Sci. 90:76 (Abstr.).Wondra, K. J., J. D. Hancock, G. A. Kennedy, R. H. Hines, and K. C. Behnke. 1995. Reducing particle size of corn in lactation diets from 1,200 to 400 micrometers improves sow and litter performance. J. Anim. Sci. 73:421-426.Woodworth, J. C., S. S. Dritz, R. D. Goodband, M. D. Tokach, J. M. DeRouchey, C. R. Stark, and C. K. Jones. 2015. Optimal particle size for grain and other ingredients: What the research is telling us. http://www. swinefeedefficiency.com/icfes.html (Accessed 5th February 2016).

R1
ACKNOWLEDGEMENTS
A special thank you goes to the following swine nutritionists for their help in providing data and research from numerous trials along with review of this nutrition guide:
Antonio PalomoCasey NeilDean BoydFernando BártoliJames UsryJosé CuarónLaura GreinerMalachy YoungMelissa HannasMick HazzledineMike TokachSteve Dritz
Additionally, thank you to Carine Vier for the technical writing review of this manual.
DISCLAIMER
Performance data shown in the nutrient specification tables were obtained in commercial settings and under conditions of thermo-neutral temperature and good management. They are not guaranteed levels of performance. A competent nutritionist should adapt suggested nutrient levels to farm-specific conditions. These concepts are discussed in greater detail in nutrition technical updates for sows, nursery pigs and finishing pigs.
NEVER STOP IMPROVING

PIC North America100 Bluegrass Commons Blvd. | Suite 2200 | Hendersonville, TN 37075 | 800-325-3398 | www.PIC.com
NEVER STOP IMPROVING