phytoplankton species turnover controlled by …...gh z zaz zρ h ()()() where ρ 0 is the density...
TRANSCRIPT

Phytoplankton species turnover controlled byphysical forcing at different time scales
Alexandrine Pannard, Myriam Bormans, and Yvan Lagadeuc
Abstract: Changes in the physical and chemical environment induced by forcing events such as wind and rain cancontrol the short-term dynamics of the phytoplankton community of inland waters. In two temperate reservoirs, speciescomposition, diversity index, and species dynamics were characterized over periods of 3 weeks during different sea-sons, in parallel with changes in the physical and chemical structure of the water column. Dominant species and diver-sity index were shown to be controlled by environmental factors fluctuating on a seasonal and weekly time scale,whereas some rarer species responded to wind events and were indicators of a very short-term environmental change.As a consequence of the response of indicator species, the rate of change in species composition increased followingmeteorological events. Shifts in species composition were observed during each sampling period, except during thestrongest stratification period. The shifts were associated with a modification of resource availability or intensity ofstratification. We found that the resistance of the phytoplankton community to short-term physical forcing by windincreased with intensity of stratification. After the forcing event, the community did not return to its original structurebecause of modifications of the physical and chemical conditions induced by meteorological forcing on a weekly timescale.
Résumé : Cette étude met en évidence la dynamique à court terme des communautés de phytoplancton lacustre enréponse aux modifications de l’environnement physico-chimique induites par des événements de forçage, comme levent et la pluie. Dans deux réservoirs tempérés, l’indice de diversité, la dynamique des espèces et la composition enespèces ont été suivis sur des périodes de 3 semaines à différentes saisons, en parallèle avec les modifications de lastructure physico-chimique de la colonne d’eau. Les espèces dominantes et l’indice de diversité étaient contrôlés à deséchelles de temps saisonnière et hebdomadaire, alors que certaines espèces plus rares indicatrices de changements àtrès court terme ont répondu aux événements de vent. En conséquence de la réaction des espèces indicatrices le tauxde changement des espèces a augmenté après les événements rapides de forçage. Des modifications brutales de lacomposition en espèces ont été observées pendant chaque campagne d’échantillonnage, excepté pendant la période destratification maximale. Ces changements étaient associés à des modifications de la disponibilité des ressources ou del’intensité de la stratification. Nous avons observé que la résistance de la communauté de phytoplancton au forçagephysique à court terme par le vent augmentait avec l’intensité de la stratification. Après les événements de forçage, lacommunauté n’est pas retournée à sa structure initiale, à cause de modifications entre-temps des conditions physico-chimiques, induites par le forçage météorologique sur une échelle de temps hebdomadaire.
Pannard et al. 60
Introduction
The periodicity of phytoplankton community compositionin lakes as a result of seasonal variations in physical forcinghas often been investigated (Lewis 1978b; Noges et al. 1998;Anneville et al. 2002). Seasonal physical forcing is mainlydue to factors such as changes in air temperature and solarradiation (Sommer et al. 1986), which control the verticalstructure of the water column of a lake, water temperature,depth of the mixed layer, intensity of mixing, and conse-quently the nutrients available in the surface layer. The verti-
cal structure of the water column can also be modified on ashorter time scale by forcing events such as wind and rain(Imberger and Parker 1985; MacIntyre et al. 1999). Thesemodifications take place on a time scale of a few days, simi-lar to the time scale of the phytoplankton doubling, and canthus influence the phytoplankton community (Reynolds1984b). Modification of the vertical structure of the watercolumn on different time scales, from seasonal to daily, maythus affect the dynamics of the phytoplankton community.Three time scales are used here, short term (a few days), in-termediate (the sampling period of 3 weeks), and seasonal,
Can. J. Fish. Aquat. Sci. 65: 47–60 (2008) doi:10.1139/F07-149 © 2007 NRC Canada
47
Received 29 September 2006. Accepted 10 July 2007. Published on the NRC Research Press Web site at cjfas.nrc.ca on15 December 2007.J19566
A. Pannard,1 M. Bormans, and Y. Lagadeuc.2 UMR CNRS 6553 Ecobio, FR/IFR CAREN, University of Rennes, campus deBeaulieu, batiment 14b, Av. General Leclerc, Rennes, 35 042, France.
1Present address: Département des sciences biologiques, University of Québec at Montréal (UQÀM), CP 8888, Succ. Centre Ville,Montréal, QC H3C 3P8, Canada.
2Corresponding author (e-mail: [email protected]).

with a focus on the short term, as very few studies have ex-amined the dynamics of phytoplankton at that time scale.
The vertical structure of the water column is a determin-ing factor for the phytoplankton community, as it controlsboth losses by sedimentation rate and growth through nutri-ent and light availability. Meteorological forcing events canmodify this vertical structure in several ways. For example,the mixed-layer depth can be increased, leading to lowerlight availability over the mixed layer (Diehl et al. 2002) anda decrease in sedimentation losses (Ptacnick et al. 2003), aswell as an increase in the intensity of mixing and redistribut-ing phytoplankton populations over depth. Species able toregulate their buoyancy, which therefore become concen-trated during calm periods (Klausmeier and Litchman 2001),may be disadvantaged by this redistribution, as they tempo-rarily lose their vertical position (Huisman et al. 2004). Spe-cies that tend to sink will be mixed through the water columnand their sedimentation loss rate will thus be reduced(Huisman et al. 2002). Lastly, forcing events can modifynutrient availability by breaking down or weakening thenutricline or by modifying external inputs from the drainagebasin. The resulting change in competition between specieswith different nutrient requirements and storage capacity mayaffect phytoplankton community structure (Sommer 1985);therefore meteorological forcing events may induce a short-term variability in the phytoplankton community.
In a previous study, we showed that short-term forcingevents can modify both the size structure of phytoplanktonand losses via sedimentation (Pannard et al. 2007). In thisstudy, we address physical and chemical forcing at differenttime scales, with a focus on time scales of a few days. Weuse diversity index, rate of change of species compositionand species community structure, to examine short-term dy-namics of phytoplankton community during different sea-sons in two temperate reservoirs.
Materials and methods
Study sitesTwo stratified temperate reservoirs located in Brittany,
near Rennes (France), were studied (Fig. 1). La Cheze andRophemel are both drowned river reservoirs. The volume ofLa Cheze is about 15 × 106 m3, with a mean depth of 14 m,whereas the smaller Rophemel reservoir has a volume of 5 ×10⁶ m3 and a mean depth of about 6.5 m (Table 1). The res-ervoirs differ in their exposure to wind in terms of fetch (Ta-ble 1) and orientation to the dominant wind direction(Fig. 1), with La Cheze being more exposed to wind forcingthan Rophemel. The reservoir of La Cheze has a smallercatchment area of about 30 km2, with a lake surface area ofabout 1 km2 and a residence time between 3 months and1 year, whereas Rophemel has a large catchment area(380 km2) with a residence time between 1 and 4 weeks (Ta-ble 1).
SamplingThe reservoir of La Cheze was sampled during three sea-
sons, summer (20 June 2003 – 14 July 2003), autumn(22 September 2003 – 14 October 2003), and early spring(24 March 2004 – 15 April 2004). Rophemel was sampledonly in spring (5 May 2004 – 24 May 2004). For each pe-
riod, sampling was performed in the morning (0900 h), ev-ery 2 or 3 days, a few hundred metres from the outlet of thereservoir and in the vicinity of the old river bed, far awayfrom tributaries. Water samples were collected using a 1 mintegrated vertical sampler (single-valve bailer) at fourdepths (1, 7, 13, and 21 m for La Cheze and 1, 5, 9, and14 m for Rophemel) and analysed for nutrient and phyto-plankton species community structure.
Physical and chemical structureTo characterize the physical forcing, meteorological data
monitored in Rennes by Meteo France were used (Fig. 1).Wind speed and direction (collected 10 m above theground), solar radiation, and mean air temperature were av-eraged daily, whereas rainfall was measured daily.
To determine the water column stratification intensity, thepotential energy (PE), which represents the quantity of en-ergy needed to homogenize the entire water column (Laga-deuc et al. 1997), was calculated (in J·m–3) using theformula
(1) PE1
d0
= −∫hgz z
h
( )ρ ρ
based on the mean density
(2) ρ ρ= ∫1
d0
hz
h
where ρ is the water density at depth z, h is the total depth ofthe water column, and g is the gravitational constant. Agreater amount of potential energy implies greater stabilityof the water column. Water temperature was profiled everymetre with a YSI environmental 6920 probe (Anhydre,Vireux Molhain, France). Surface current velocities weremeasured once per second with a two-dimensional acousticcurrent meter probe (Falmouth Scientific Inc., Cataumet,Mass.) at a depth of about 0.5 m below the surface.
To characterize the influence of wind on the physicalstructure of the water column, and particularly on upwellingof hypolimnetic water, the dimensionless lake number LN(Imberger and Patterson 1990) was calculated as follows:
(3) LH h
u A H hN =
−
−
St T
S3 2
V
( )
( )*/2
where H is the total depth, hT is the height from the bottomof the lake to the seasonal thermocline, hV is the height fromthe bottom of the lake to the center of lake volume, and AS isthe surface area of the lake. The stability St was calculatedas follows:
(4) St1
d0 0
V= −∫ρρg h z z A z z
H
( ) ( ) ( )
where ρ 0 is the density of water, g is the acceleration due togravity, and A(z) and ρ(z) are the area and the water density,respectively, at the height z. The water shear velocity in-duced by the wind u* was calculated as follows:
© 2007 NRC Canada
48 Can. J. Fish. Aquat. Sci. Vol. 65, 2008

(5) uC
U*
/
=
DS
a
0
1 2ρ
ρ
where ρ a is the density of air, C DS is the surface drag coeffi-
cient, and U is the wind speed (m·s–1).Maximal water discharge was estimated from rainfall, mul-
tiplied by the surface of the catchment area. These values areapproximate as they do not take into account evapo-transpiration or infiltration but they give a useful indication ofthe extent of the rain impact on the lake volume.
To characterize the availability of light, daily average so-lar radiation was converted to mean photosynthetically ac-tive radiation (PAR), I0, using a factor of 0.45 (Talling1957). We then calculated the mean daily PAR, I Z M
, re-ceived by the phytoplankton over the mixed layer ZM byintegrating the light profile using the Beer–Lambert law:
(6) IZ
I zK zZ
dZ M
1e d
M
M0
0
= −∫
where Kd is the measured light attenuation coefficient, calcu-lated from an instantaneous irradiance profile measured ev-ery metre with a LiCor PAR sensor (Eurosep Instruments,Cergy Pontoise, France).
To characterize nutrient availability at the four sampleddepths, dissolved nutrient concentrations were also analysed
through colorimetric methods: ammonium (Rossum andVillaruz 1963), nitrite and nitrate (Barnes and Folkard1951), soluble reactive phosphorus (Murphy and Riley1962), and silicon (Rodier 1978). Dissolved inorganic car-bon was measured following filtration through a WhatmanGF/F glass-fibre filter, using a total organic carbon analyser(Shimatzu TOC 5000; Shimatzu France, Champs-sur-Marne,France).
Species compositionTo determine species composition of the phytoplankton
community, subsamples (250 mL) containing cells fromeach of the four depths were concentrated on a 1 µm Poreticspolycarbonate membrane filter, resuspended, and fixed withLugol’s iodine solution (final volume of 1 mL). Diatomchains and colonial chlorophytes were often observed, indi-cating that damage due to the concentration of cells was low.The alga taxa were identified according to standard refer-ences (Bourrelly 1966, 1968, 1970). All cells (both unicellu-lar and cells grouped in filaments or colonies) were counted(magnification 100× to 400×) using a Nageotte chamber, andconcentrations in the water column were expressed as cellsper millilitre. Rare species low in concentration were takeninto account only if the number of cells counted was suffi-cient for statistical significance: a minimum of 50 cells orcolonies were thus counted per species to give confidence
© 2007 NRC Canada
Pannard et al. 49
Fig. 1. Location of the study area and the sampling sites in Brittany, France. The wind rose summarizes local wind direction over fouryears (1999–2002) using Meteo France data.
La Cheze Rophemel
Reservoir volume (106 m3) 14.7 5Surface area (km²) 1.07 0.77Mean depth (m) 13.7 6.5Fetch (m) in predominant wind direction 900 120Catchment area (km²) 30 380Water residence time 3 months to 1 year 1 week to 1 month
Table 1. Drainage basin and morphometric characteristics of the La Cheze and Rophemelreservoirs, France.

limits between 37 and 66 cells (Lund et al. 1958). The diver-sity index, rates of change, and statistical analyses were allbased on data on cell concentrations, as outlined below.
Diversity indexTo characterize the species diversity, the Shannon diver-
sity index H′ was calculated from the number of cells permillilitre, pi, of each species following the widely used for-mula of Shannon (1948):
(7) H p pi
S
i i′ = −=∑ ( log )
12
Species rate of changeTo characterize short-term modifications of the commu-
nity structure, the succession rate of change σ (day–1), alsocalled the summed difference (SD) index, was calculated byadding together changes in proportions of the ith species be-tween times t1 and t2 (Lewis 1978a; Cardoso and Marques2003):
(8) σ =
−
∑ b t
B t
b t
B t
t t
i ii ( )
( )
( )
( )
( )
1
1
2
2
2 1
where bi is the cell concentration of species i and B is thecell concentration per millilitre of the community.
Statistical analysisTo characterize the phytoplankton community according
to seasons, in terms of dominant species and groups, a facto-rial correspondence analysis (CA) was undertaken. The anal-ysis was performed on data from the four sampling periodsusing communities from the different dates and depths. TheCA allowed us to highlight dominant species and gives anindication of the temporal and spatial variability of the com-munity structure at the seasonal time scale.
Principal component analysis (PCA) was performed foreach sampling period, separately on physical and chemicaldata and on species concentrations from each sampled depthand date. These two ordinations of species concentration andphysical and chemical conditions were then compared witheach other. From the results of the two PCA ordinations, aprocrustean superimposition was performed (Dray et al.2003b) to fit the two data sets in a euclidian multivariatespace. The method minimizes a distance, which is the sum-of-squares of the differences between the two data sets interms of variability (Peres-Neto and Jackson 2001). The re-siduals between configurations after optimal fit for eachspecies are represented by the length of the arrows on theprocrustean superimposition. The method thus draws a par-allel between some environmental changes and some speciesconcentration variations, so that it can associate a change inspecies concentration with an environmental change. The or-dinations of the physical and chemical parameters and thespecies concentrations are shown, as well as the procrusteansuperimposition of both ordinations. To simplify figures,only species contributing to more than 1/S, where S is spe-cies richness, are shown, even if all species with statisticallysignificant concentrations were included in the analysis. The
fit between original data and the ordination of the commonprojection is measured by the sum of singular values of pro-crustean analysis (Dray et al. 2003a). A randomization test(the RV test; Heo and Gabriel 1997; Dray et al. 2003b) wasused to evaluate the accuracy of the fit by the procrusteanmethod, by randomly permuting rows and columns of one ofthe PCAs and calculating the new co-structure of the twoPCAs matrices as explained above (1000 permutations). Thebetter the fit, the stronger is the link between the two PCAmatrices. Species that contribute most to the total variabilityof community structure also have the highest contributionsto the axes and are not necessarily dominant species. All sta-tistical analyses were performed using the ADE4 package ofthe R software (Kangas 2004).
TerminologyThree time scales were used: short term, a time scale of 2
or 3 days; intermediate, the 3-week sampling period; andseasonal, a few months.
Dominant species are the most abundant in the phyto-plankton community and are statistically defined by the re-sults of a CA. Rare species are species low in density, buttheir density was statistically significant (more than 50 cellsor colonies counted) at least at a moment in the sampling pe-riod. We consider indicator species to be those for whichcell concentration varies with change in physical or chemicalconditions and can thus be indicative of an environmentalchange or disturbance. Indicator species were identified bythe procrustean analysis.
Results
Physical and chemical forcingThe four sampling periods differed in their physical and
chemical conditions, e.g., stratification intensity, water tem-perature, availability of light, and concentrations of nutrients(Table 2). Critical concentrations were used to characterizeresource conditions above which phytoplankton species areunlikely to be limited by the resource. Below these concen-trations, some of the species, particularly large species, maybe limited, following the size dependance of resource acqui-sition (Irwin et al. 2006). We hypothesized that some rarespecies requiring higher nutrient concentration may increasetheir density in response to sudden nutrient release. Thesecritical values were 10 µg P·L–1, 0.3 mg N·L–1 (Wetzel2001), and 0.5 mg Si·L–1 (Reynolds 1984a). Similarly, lightwas considered as potentially limiting for the growth of someof the phytoplankton species, when the mean light receivedby cells over the mixed layer was lower than 4 to 6 µmolphotons·s–1·m–2 (Millard et al. 1996). A deep, well-mixed,nutrient-rich, and light-limited epilimnion was characteristicof the sampling period of early spring at La Cheze. In latespring, the phytoplankton community at Rophemel was lim-ited neither by nutrient nor by light because of an increaseof solar radiation. A shallow silicon-depleted epilimnioncharacterized the summer period at La Cheze, whereas thephytoplankton community in autumn at the same site waspotentially limited by both nutrients (silicon, nitrate, andphosphorus) and light (data not shown). More details are re-ported in Pannard et al. (2007).
© 2007 NRC Canada
50 Can. J. Fish. Aquat. Sci. Vol. 65, 2008

Temperature and solar radiation also underwent gradualvariations over the 3 weeks of each sampling period becauseof seasonal transitions and meteorological forcing such asatmospheric depression. These variations were reflected inthe evolution of the mean temperature of the mixed layerand the intensity of stratification during the 3-week sam-pling periods and had thus to be taken into account in thephytoplankton response.
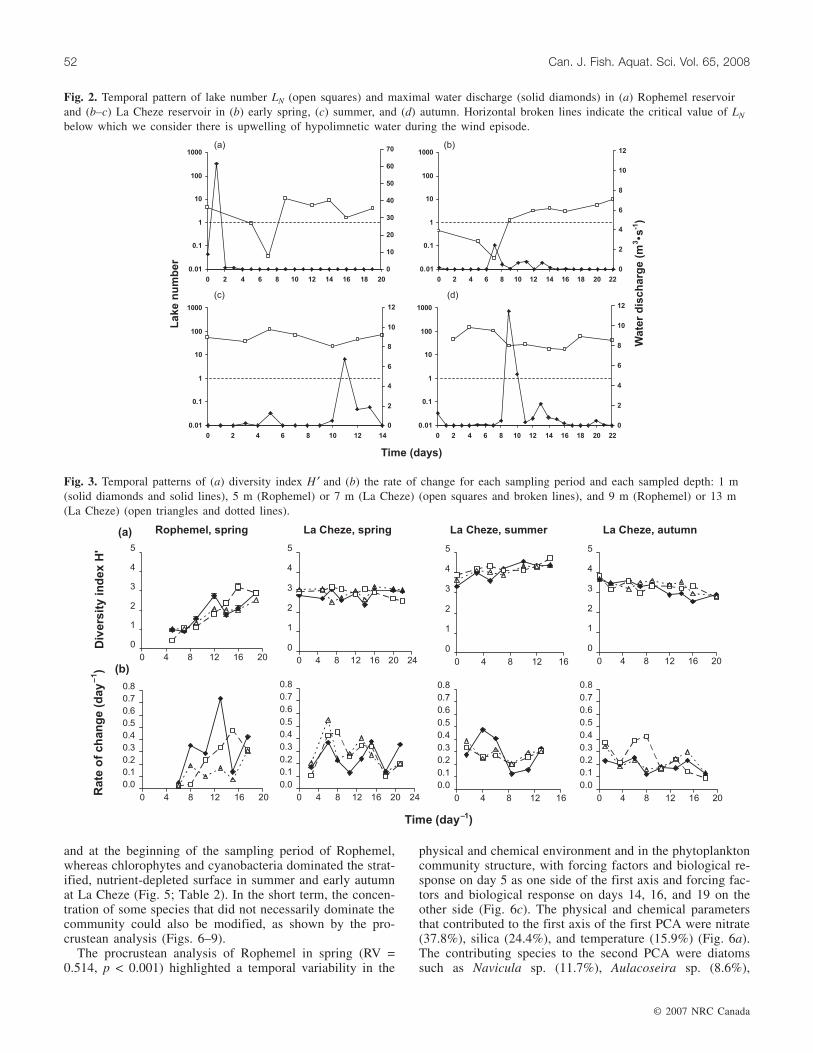
Pannard et al. (2007) demonstrated in the same study thatbetween two and three short-term forcing events occurredper 3-week sampling period, with physical and chemicalmodifications of different intensity. Three main physical andchemical modifications of the environment dominated withinthe sampling periods: an increase of dilution rate, a suddenincrease of stratification intensity due to a spring warming-up (associated with a change in mixed-layer depth), and aninput of potentially limiting nutrients (Pannard et al. 2007).Firstly, the phytoplankton community of Rophemel was ex-posed to heavy rain (Fig. 2a), which increased dilution rateof populations in the reservoir mainly on day 7. Secondly,the early spring community of La Cheze was exposed, par-ticularly on day 10, to a strong wind event (with mean dailywind speed up to 7 m·s–1) associated with higher solar radia-tion, which induced a warming-up of the reservoir and in-creased the stratification intensity, resulting in an increase ofthe lake number above 1 (Fig. 2b). Thirdly, in autumn at LaCheze, a rainfall event on day 7 (Fig. 2d) induced a siliconinput into the mixed layer, increasing it from 0.58 to1.36 mg Si·L–1. A 5-day wind event just followed the rainevent and was associated with a measurable increase in theavailability of phosphorus on days 12 to 16, increasing itfrom below 1 µg P·L–1 to 22 µg P·L–1. However the lakenumber always greatly exceeded the critical value of 1(Fig. 2d). No sudden physical and chemical modification ofthe environment was observed during the fourth samplingperiod, the summer period at La Cheze. The lake number re-mained greatly higher than 1 during the entire period, andonly very little rainfall occurred (Fig. 2c).
Diversity index and rate of change of the phytoplanktoncommunity
Mean values of H′ were calculated for sampling periodand at the top three sampled depths, as we considered that
the vertical structure of diversity could provide informationabout the community response at the water column scale(Fig. 3a). The lowest values were observed at Rophemel,with an average over the 3-week period and the three sam-pled depths of 1.82 ± 0.75 (mean ± standard deviation; n =7), whereas H′ at La Cheze was 2.95 ± 0.14 (n = 8) in April,3.32 ± 0.24 (n = 9) in October, and 4.04 ± 0.20 (n = 7) inJune. These diversity indices increased with the stratificationintensity and the mean temperature of the mixed layer (Ta-ble 2). The diversity indices were also strongly correlatedwith the potential energy during the warming period inRophemel in spring and the cooling period in La Cheze inautumn (Fig. 4). The other two sampling periods showedlower variations (and correlations) of temperature and poten-tial energy (Fig. 4). A positive relation between the diversityindex and the stratification intensity was thus observed ontwo time scales (seasonal and intermediate). However, on adaily time scale, the diversity index H′ changed only gradu-ally (Fig. 3a). The diversity index H′ was thus not sensitiveto physical forcing on a daily time scale but was sensitive toseasonal forcing such as that resulting from stratification andtemperature.
Rates of community change were highly variable on adaily time scale compared with diversity indices, althoughmean values, averaged over dates and depths for each sam-pling period, were very close to one another, between 0.22and 0.3 (Fig. 3b). This rate of change was not influenced byseasonal forcing, but on a daily time scale, it was controlledby the occurrence of forcing events, increasing after distur-bances (Fig. 3b). This increase was sometimes observedonly at the surface, e.g., sampling of Rophemel and LaCheze in June, sometimes at a depth of 7 m, as in October,and sometimes at the top three depths, as in April (Fig. 3b).This parameter was thus a good indicator of rapid changedue to forcing on a daily time scale. We now examine theextent of change in the relative concentrations of species af-ter forcing events.
Community structureOn seasonal and intermediate time scales, dominant spe-
cies differed between the four sampling periods (Fig. 5).Large diatoms such as Aulacoseira sp. dominated the cold,well-mixed, light-limited waters in early spring at La Cheze
© 2007 NRC Canada
Pannard et al. 51
Rophemel La Cheze
Spring Spring Summer Autumn
Physical constraintsPotential energy (J·m–3) (water column) 10.7±3.9 3.5±1.7 55.5±8.5 28.1±5.8Mean temperature (°C) (mixed layer) 15.2±1.8 9.1±0.9 22.5±0.9 16.8±0.9
Resources (mixed layer)Nitrate (mg N·L–1) 4.5±1.9 5.6±1.1 2.6±1.3 0.1±0.1Ammonium (µg N·L–1) 3±4 65±14 93±13 28±13Phosphate SRP (µg P·L–1) 43±19 42±5 16±3 6±9Silica (mg Si·L–1) 3.5±0.6 1.1±0.2 0.3±0.1 0.4±0.2Irradiance (µmol photons·m–2·s–1) 11.6±4.8 2.5±0.9 15.2±7.6 1.3±1.0Chlorophyll a (µg Chl a·L–1) (mixed layer) 13.1±3.7 4.7±1.2 3.9±1.0 6.6±0.5Mean sedimentary fluxes (g·m–2·day–1) 6.4±1.9 2.6±0.7 2.2±1.1 8.3±5.4
Table 2. Physical, chemical, and biological variables for each sampling period (data fromPannard et al. (2007); mean value ± standard deviation).
and at the beginning of the sampling period of Rophemel,whereas chlorophytes and cyanobacteria dominated the strat-ified, nutrient-depleted surface in summer and early autumnat La Cheze (Fig. 5; Table 2). In the short term, the concen-tration of some species that did not necessarily dominate thecommunity could also be modified, as shown by the pro-crustean analysis (Figs. 6–9).
The procrustean analysis of Rophemel in spring (RV =0.514, p < 0.001) highlighted a temporal variability in the
physical and chemical environment and in the phytoplanktoncommunity structure, with forcing factors and biological re-sponse on day 5 as one side of the first axis and forcing fac-tors and biological response on days 14, 16, and 19 on theother side (Fig. 6c). The physical and chemical parametersthat contributed to the first axis of the first PCA were nitrate(37.8%), silica (24.4%), and temperature (15.9%) (Fig. 6a).The contributing species to the second PCA were diatomssuch as Navicula sp. (11.7%), Aulacoseira sp. (8.6%),
© 2007 NRC Canada
52 Can. J. Fish. Aquat. Sci. Vol. 65, 2008
Fig. 2. Temporal pattern of lake number LN (open squares) and maximal water discharge (solid diamonds) in (a) Rophemel reservoirand (b–c) La Cheze reservoir in (b) early spring, (c) summer, and (d) autumn. Horizontal broken lines indicate the critical value of LN
below which we consider there is upwelling of hypolimnetic water during the wind episode.
Fig. 3. Temporal patterns of (a) diversity index H ′ and (b) the rate of change for each sampling period and each sampled depth: 1 m(solid diamonds and solid lines), 5 m (Rophemel) or 7 m (La Cheze) (open squares and broken lines), and 9 m (Rophemel) or 13 m(La Cheze) (open triangles and dotted lines).

Cyclostephanos sp. (6.0%), and Synedra sp. (6.0%),chlorophytes such as Scenedesmus sp. (9.9%), or cyano-bacteria such as Planktothrix sp. (7.4%) (Fig. 6b). All ofthese species decreased following the environmental change,a sudden increase in the water column stratification inten-sity. The contributing species favoured by the environmentalchange were colonial chlorophytes Coelastrum sp. (9.3%)and Pediastrum sp. (5.6%) (Fig. 6b). In the procrusteananalysis, surface communities (1 and 5 m deep representedby the letters A and B, respectively) were on one side of thesecond axis of both PCAs and bottom communities (9 and14 m deep represented by the letters C and D, respectively)were on the opposite side (Fig. 6c). The physical and chemi-cal parameters that contributed to this second axis of thefirst PCA were ammonium (25.6%), light availability (meanPAR) over the mixed layer (23.9%), and temperature(13.5%) (Fig. 6a). Contributing species were the colonialchlorophytes Sphaerocystis sp. (18.4%), Coelastrum sp.(12.5%), and Pediastrum sp. (12.3%) (Fig. 6b). The shift,occurring on day 7 and associated with a dilution induced bya large rain event, led to the disappearance of many species,particularly diatoms, which were replaced by new ones,mainly colonial chlorophytes.
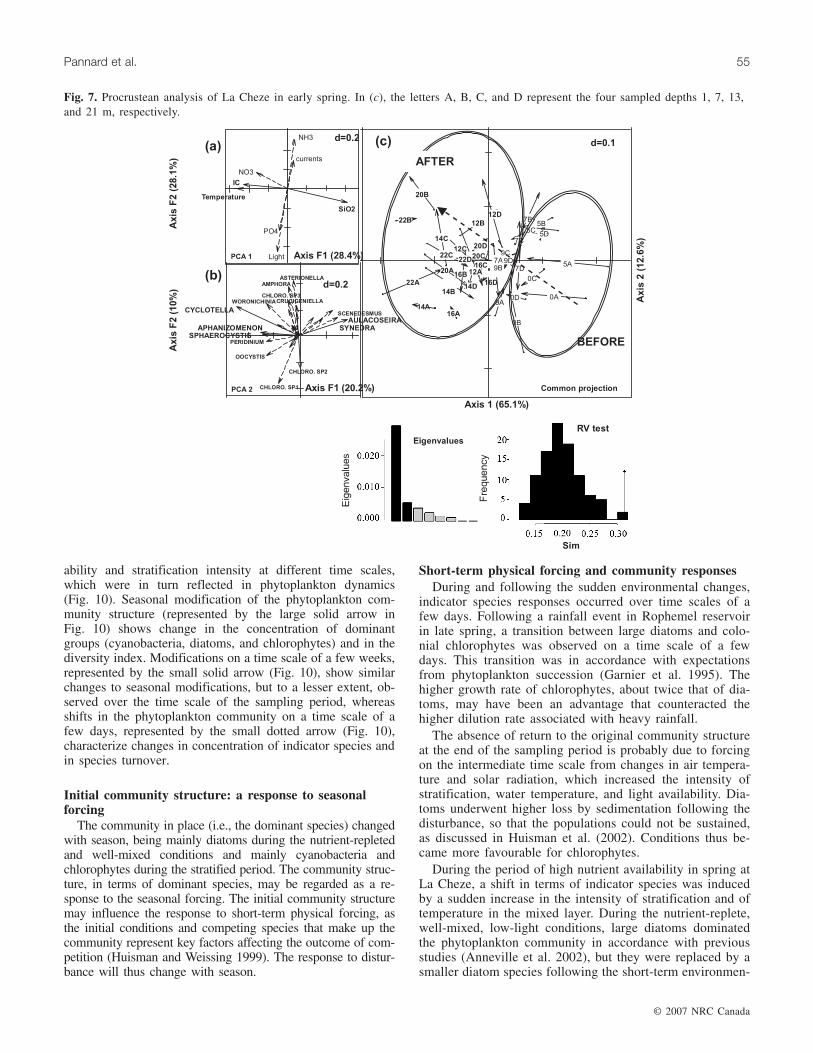
The procrustean analysis for the period of early spring atLa Cheze (RV = 0.313, p = 0.007) also highlighted a tempo-ral variability, observed both in the physical and chemicalenvironment and in the community structure (Fig. 7c). Sam-pling dates before the strongest wind event (day 10) can bedistinguished from sampling dates after the disturbance(Fig. 7c). Silicon (37.8%), temperature (27.4%), inorganiccarbon (21.6%), and nitrate (10.4%) were the main variablescontributing to the first axis of the PCA of the physical andchemical parameters (Fig. 7a). Temperature and nitrate wereincreased following the disturbance. Large diatoms such asAulacoseira sp. (14.4%) and Synedra sp. (9.0%) were re-
placed by smaller diatoms such as Cyclotella sp. (22.9%)(Fig. 7b). Some cyanobacteria and chlorophytes were alsofavoured by the increase in temperature and water columnstratification intensity, e.g., Aphanizomenon sp. (8.4%) andSphaerocystis sp. (7.6%) (Fig. 7b). Surface communitycould not be distinguished from bottom community in theprocrustean analysis, indicating no depth-related variationsin spring.
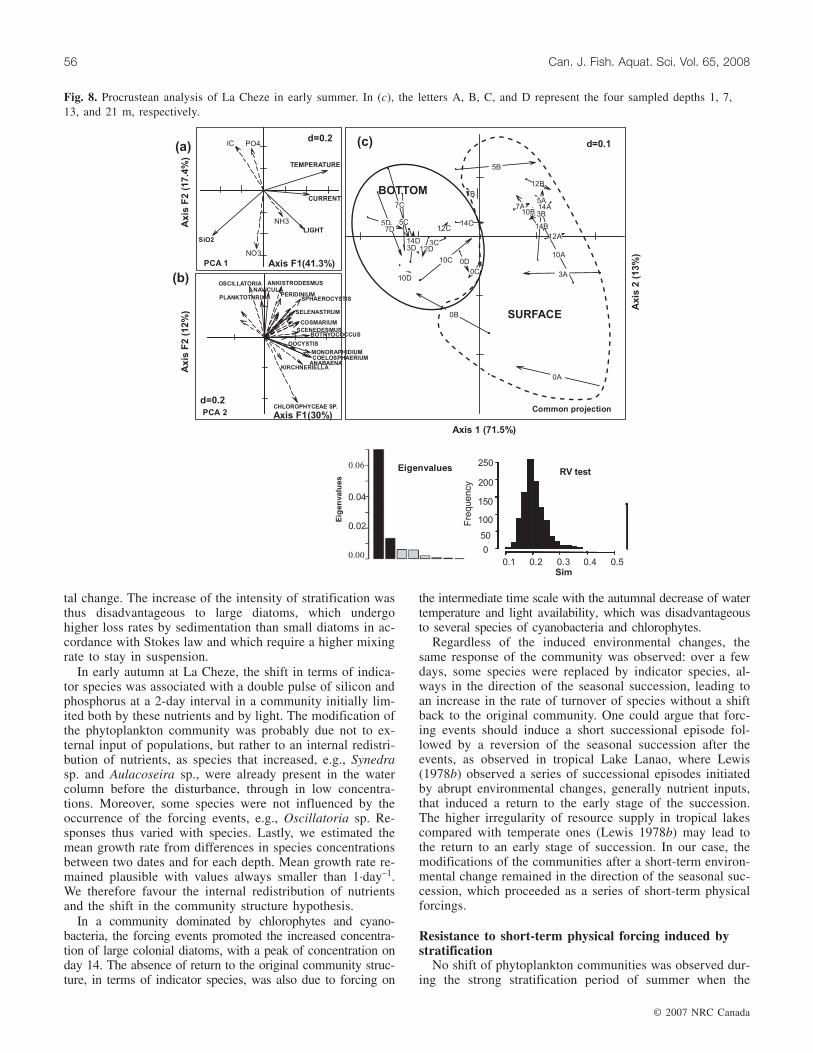
A spatial variability related to depth was observed in theprocrustean analysis for the summer period at La Cheze(RV = 0.547, p < 0.001), with surface samples on the rightside of the graph (depths of 1 and 7 m represented by lettersA and B, respectively) and bottom samples on the left side(depths of 13 and 21 m represented by letters C and D, re-spectively) (Fig. 8c). The vertical structure of phytoplanktoncommunities thus dominated over temporal changes. Physi-cal and chemical parameters that were dependent on depthwere temperature (34.7%), silicon (22.4%), current velocity(17.7%), and light availability over the mixed layer (14%)(Fig. 8a). Contributing species were Anabaena sp. (14.7%),Monoraphidium sp. (14.3%), Botryococcus sp. (12.6%), andCoelosphaerium sp. (9.8%), with higher concentrations inthe surface layer (Fig. 8b). The second axis of the procrus-tean analysis was not linked to time or to the occurrence offorcing events and the inertia of the axis remained low com-pared with the first axis, as shown by its eigenvalue, whichwas five times lower (Fig. 8).
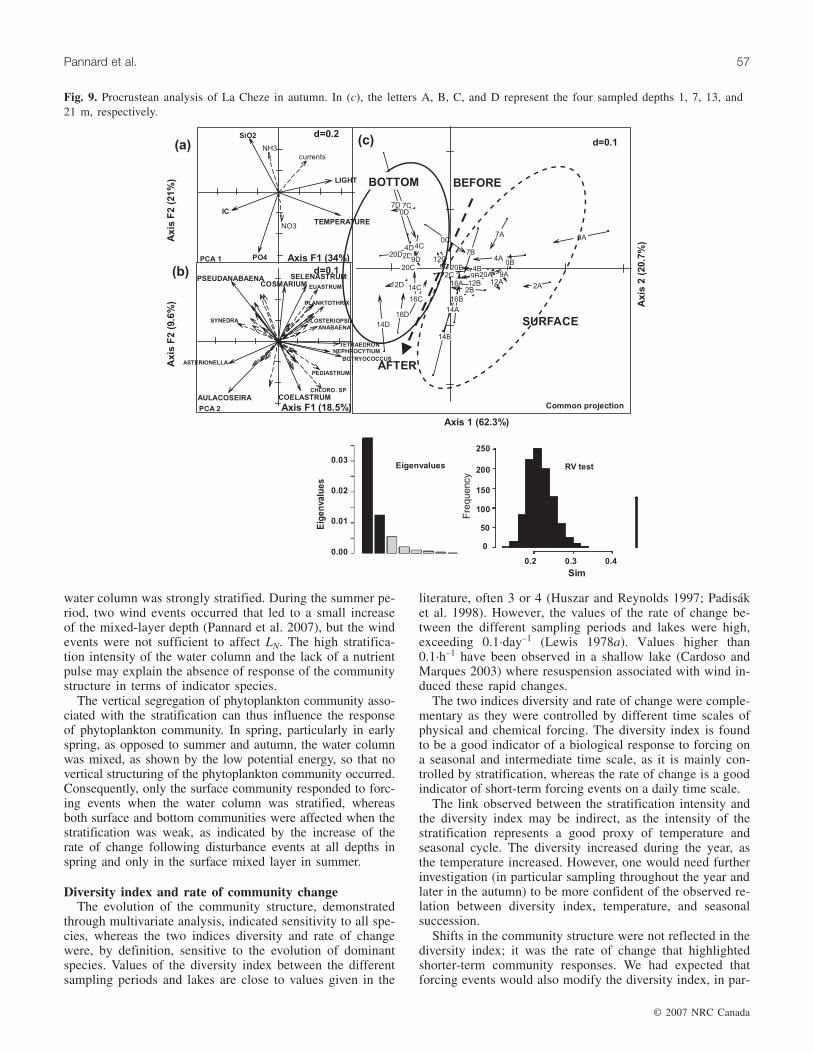
During the autumn period, vertical structuring also domi-nated, as shown by the procrustean analysis (RV = 0.462,p < 0.001), with surface samples (depths of 1 and 7 m repre-sented by letters A and B, respectively) on the right side ofthe graph and bottom ones (depths of 13 and 21 m repre-sented by letters C and D, respectively) on the left side
© 2007 NRC Canada
Pannard et al. 53
Fig. 4. Diversity index H ′ as a function of potential energy foreach sampling period; correlations between both parameters areshown when highly significant.
Fig. 5. Principal component analysis of the species compositionused to highlight dominant species (contributing species to theaxis). The dominant species belong to chlorophytes (Ankist.,Ankistrodesmus; Coel., Coelosphaerium; Scen., Scenedesmus;Sphaer., Sphaerocystis), cyanobacteria (Anab., Anabaena; Limn.,Limnothrix; Micr., Microcystis; Oscill., Oscillatoria; Plank.,Planktothrix; Woro., Woronichinia), and diatoms (Aulac.,Aulacoseira; Cyclos., Cyclostephanos).

(Fig. 9c). The first axis of the PCA of the physical andchemical variables thus coincides with depth, temperature(35.2%), light availability over the mixed layer (25.1%), andinorganic carbon (20.0%), the main contributing physicaland chemical variables (Fig. 9a). Botryococcus sp. (9.4%),Tetraedron sp. (8.7%), Nephrocytium sp. (6.3%), Aulaco-seira sp. (5.9%), and Asterionella sp. (5.7%) were the mainspecies contributing to the first axis of the PCA of commu-nity structure (Fig. 9b). The procrustean analysis also distin-guished sampling dates before the 5-day wind event (highestwind speed on day 12) on the upper side of the second axisand sampling dates after on the bottom side (Fig. 9c). Thesecond axis thus coincides with time and wind disturbance,with phosphorus (32.9%) and silicon (26.3%) as the maincontributors to the short-term environmental change(Fig. 9a). The contributing species, which decreased follow-ing the disturbance, were Pseudanabaena sp. (8.3%), Sele-nastrum sp. (7.3%), and Cosmarium sp. (6.9%). Large
diatoms such as Aulacoseira sp. (6.3%) and chlorophytessuch as Coelastrum sp. (5.7%) were favoured by nutrient in-puts (Fig. 9b). A shift in the community structure was thusobserved in parallel with a change in nutrient availability.
Discussion
Depending on forcing events, modifications of the commu-nity structure were variable and induced by a change in theavailability of resources or in the intensity of stratification.Shifts in the community occurred over a few days, during andfollowing disturbances, and no return to the original commu-nity structure was observed. In several of the sampling peri-ods, a gradual change of physical and chemical conditionsoccurred on a weekly time scale, as shown by Pannard et al.(2007), leading to significant modifications of the phyto-plankton community between the beginning and the end ofthe sampling period. Forcing affected light and nutrient avail-
© 2007 NRC Canada
54 Can. J. Fish. Aquat. Sci. Vol. 65, 2008
Figs. 6–9. Procrustean analysis with (a) PCA of the physical and chemical conditions (temperature, inorganic carbon (IC), silicon(SiO2), phosphorus (PO4), ammonium (NH4), nitrate (NO3), current velocity (currents), and mean irradiance in the mixed layer(Light)), (b) PCA of the species composition, with indicator species written in larger characters than other species, and (c) commonprojection. Solid arrows on the PCA indicate physical and chemical parameters or species, which significantly contribute to one of thetwo axis (compared with dotted arrows). In (a, b, and c), the d value indicates the size of the square for each ordination. In (c), theletters A, B, C, and D represent the four sampled depths (see each figure legend) and are preceded by the time in days from the be-ginning of the period. The small solid arrows in (c) show the change in the location of each date and depth between the structure ofphysical and chemical parameters and the community structure. The large broken arrow in (c) represents the mean modification of thecommunity structure. Circles are used when possible to group together communities from the surface (broken circles), from the bottom(solid circles), or from the same period (double-line circles), with indication of the group nearby. Histograms of eigenvalues are shownin the bottom of the figure, with the first two solid bars representing the first two axes. The results of the randomization test are shown inthe bottom right histogram, with the observed RV coefficient value represented by the vertical line. Fig. 6. Procrustean analysis ofRophemel in spring. In (c), the letters A, B, C, and D represent the four sampled depths 1, 5, 9, and 14 m, respectively.
ability and stratification intensity at different time scales,which were in turn reflected in phytoplankton dynamics(Fig. 10). Seasonal modification of the phytoplankton com-munity structure (represented by the large solid arrow inFig. 10) shows change in the concentration of dominantgroups (cyanobacteria, diatoms, and chlorophytes) and in thediversity index. Modifications on a time scale of a few weeks,represented by the small solid arrow (Fig. 10), show similarchanges to seasonal modifications, but to a lesser extent, ob-served over the time scale of the sampling period, whereasshifts in the phytoplankton community on a time scale of afew days, represented by the small dotted arrow (Fig. 10),characterize changes in concentration of indicator species andin species turnover.
Initial community structure: a response to seasonalforcing
The community in place (i.e., the dominant species) changedwith season, being mainly diatoms during the nutrient-repletedand well-mixed conditions and mainly cyanobacteria andchlorophytes during the stratified period. The community struc-ture, in terms of dominant species, may be regarded as a re-sponse to the seasonal forcing. The initial community structuremay influence the response to short-term physical forcing, asthe initial conditions and competing species that make up thecommunity represent key factors affecting the outcome of com-petition (Huisman and Weissing 1999). The response to distur-bance will thus change with season.
Short-term physical forcing and community responsesDuring and following the sudden environmental changes,
indicator species responses occurred over time scales of afew days. Following a rainfall event in Rophemel reservoirin late spring, a transition between large diatoms and colo-nial chlorophytes was observed on a time scale of a fewdays. This transition was in accordance with expectationsfrom phytoplankton succession (Garnier et al. 1995). Thehigher growth rate of chlorophytes, about twice that of dia-toms, may have been an advantage that counteracted thehigher dilution rate associated with heavy rainfall.
The absence of return to the original community structureat the end of the sampling period is probably due to forcingon the intermediate time scale from changes in air tempera-ture and solar radiation, which increased the intensity ofstratification, water temperature, and light availability. Dia-toms underwent higher loss by sedimentation following thedisturbance, so that the populations could not be sustained,as discussed in Huisman et al. (2002). Conditions thus be-came more favourable for chlorophytes.
During the period of high nutrient availability in spring atLa Cheze, a shift in terms of indicator species was inducedby a sudden increase in the intensity of stratification and oftemperature in the mixed layer. During the nutrient-replete,well-mixed, low-light conditions, large diatoms dominatedthe phytoplankton community in accordance with previousstudies (Anneville et al. 2002), but they were replaced by asmaller diatom species following the short-term environmen-
© 2007 NRC Canada
Pannard et al. 55
Fig. 7. Procrustean analysis of La Cheze in early spring. In (c), the letters A, B, C, and D represent the four sampled depths 1, 7, 13,and 21 m, respectively.
tal change. The increase of the intensity of stratification wasthus disadvantageous to large diatoms, which undergohigher loss rates by sedimentation than small diatoms in ac-cordance with Stokes law and which require a higher mixingrate to stay in suspension.
In early autumn at La Cheze, the shift in terms of indica-tor species was associated with a double pulse of silicon andphosphorus at a 2-day interval in a community initially lim-ited both by these nutrients and by light. The modification ofthe phytoplankton community was probably due not to ex-ternal input of populations, but rather to an internal redistri-bution of nutrients, as species that increased, e.g., Synedrasp. and Aulacoseira sp., were already present in the watercolumn before the disturbance, through in low concentra-tions. Moreover, some species were not influenced by theoccurrence of the forcing events, e.g., Oscillatoria sp. Re-sponses thus varied with species. Lastly, we estimated themean growth rate from differences in species concentrationsbetween two dates and for each depth. Mean growth rate re-mained plausible with values always smaller than 1·day–1.We therefore favour the internal redistribution of nutrientsand the shift in the community structure hypothesis.
In a community dominated by chlorophytes and cyano-bacteria, the forcing events promoted the increased concentra-tion of large colonial diatoms, with a peak of concentration onday 14. The absence of return to the original community struc-ture, in terms of indicator species, was also due to forcing on
the intermediate time scale with the autumnal decrease of watertemperature and light availability, which was disadvantageousto several species of cyanobacteria and chlorophytes.
Regardless of the induced environmental changes, thesame response of the community was observed: over a fewdays, some species were replaced by indicator species, al-ways in the direction of the seasonal succession, leading toan increase in the rate of turnover of species without a shiftback to the original community. One could argue that forc-ing events should induce a short successional episode fol-lowed by a reversion of the seasonal succession after theevents, as observed in tropical Lake Lanao, where Lewis(1978b) observed a series of successional episodes initiatedby abrupt environmental changes, generally nutrient inputs,that induced a return to the early stage of the succession.The higher irregularity of resource supply in tropical lakescompared with temperate ones (Lewis 1978b) may lead tothe return to an early stage of succession. In our case, themodifications of the communities after a short-term environ-mental change remained in the direction of the seasonal suc-cession, which proceeded as a series of short-term physicalforcings.
Resistance to short-term physical forcing induced bystratification
No shift of phytoplankton communities was observed dur-ing the strong stratification period of summer when the
© 2007 NRC Canada
56 Can. J. Fish. Aquat. Sci. Vol. 65, 2008
Fig. 8. Procrustean analysis of La Cheze in early summer. In (c), the letters A, B, C, and D represent the four sampled depths 1, 7,13, and 21 m, respectively.
water column was strongly stratified. During the summer pe-riod, two wind events occurred that led to a small increaseof the mixed-layer depth (Pannard et al. 2007), but the windevents were not sufficient to affect LN. The high stratifica-tion intensity of the water column and the lack of a nutrientpulse may explain the absence of response of the communitystructure in terms of indicator species.
The vertical segregation of phytoplankton community asso-ciated with the stratification can thus influence the responseof phytoplankton community. In spring, particularly in earlyspring, as opposed to summer and autumn, the water columnwas mixed, as shown by the low potential energy, so that novertical structuring of the phytoplankton community occurred.Consequently, only the surface community responded to forc-ing events when the water column was stratified, whereasboth surface and bottom communities were affected when thestratification was weak, as indicated by the increase of therate of change following disturbance events at all depths inspring and only in the surface mixed layer in summer.
Diversity index and rate of community changeThe evolution of the community structure, demonstrated
through multivariate analysis, indicated sensitivity to all spe-cies, whereas the two indices diversity and rate of changewere, by definition, sensitive to the evolution of dominantspecies. Values of the diversity index between the differentsampling periods and lakes are close to values given in the
literature, often 3 or 4 (Huszar and Reynolds 1997; Padisáket al. 1998). However, the values of the rate of change be-tween the different sampling periods and lakes were high,exceeding 0.1·day–1 (Lewis 1978a). Values higher than0.1·h–1 have been observed in a shallow lake (Cardoso andMarques 2003) where resuspension associated with wind in-duced these rapid changes.
The two indices diversity and rate of change were comple-mentary as they were controlled by different time scales ofphysical and chemical forcing. The diversity index is foundto be a good indicator of a biological response to forcing ona seasonal and intermediate time scale, as it is mainly con-trolled by stratification, whereas the rate of change is a goodindicator of short-term forcing events on a daily time scale.
The link observed between the stratification intensity andthe diversity index may be indirect, as the intensity of thestratification represents a good proxy of temperature andseasonal cycle. The diversity increased during the year, asthe temperature increased. However, one would need furtherinvestigation (in particular sampling throughout the year andlater in the autumn) to be more confident of the observed re-lation between diversity index, temperature, and seasonalsuccession.
Shifts in the community structure were not reflected in thediversity index; it was the rate of change that highlightedshorter-term community responses. We had expected thatforcing events would also modify the diversity index, in par-
© 2007 NRC Canada
Pannard et al. 57
Fig. 9. Procrustean analysis of La Cheze in autumn. In (c), the letters A, B, C, and D represent the four sampled depths 1, 7, 13, and21 m, respectively.

ticular when a shift in community structure was observed.However, species that decreased in concentration were re-placed by other species in such a way that all niches were al-ways occupied and, thus, diversity remained about the same.Moreover, we expected the diversity index H′ to showgreater fluctuations, being calculated using cell abundances.Indeed, changes in the concentration of colonial specieswere responsible for high variations of the index and mayhave affected it too strongly (Figueredo and Giani 2001).Despite using cells as the ecological unit, the diversity indi-ces did not show fluctuations, whereas most of the forcingevents induced, at least in the surface layer, an increase ofthe successional rate of change. In several cases, in particu-lar in summer, the rate of change thus increased in the sur-face layer without a change in the species composition interms of indicator species. This discrepancy may be ex-plained by an oversensitivity of the parameter: the rate ofchange is the sum of the differences in the proportion ofeach species between two sampling dates, so that a modifi-cation in the concentration of a dominant species, such aslarge colonial ones, can affect the proportions of all otherspecies. Large colonial species are mainly represented bycyanobacteria, which are disfavoured by mixing (Reynolds1984a). Forcing events may affect populations of colonialspecies, with repercussions on the index rate of change, evenif the community species structure did not really change sig-nificantly.
We demonstrated that wind disturbances can induce modi-fications of phytoplankton community on a daily time scale,both in terms of size structure (Pannard et al. 2007) and spe-cies composition. Through temporal variability of the envi-
ronmental conditions, short-term physical forcing may de-crease competitive exclusion and thus increase speciesdiversity (Grover 1988), even if in our study, the diversityindex was not increased by the occurrence of disturbances.For example, it was demonstrated that disturbances such asan artificial deepening of the mixed layer in enclosures lead-ing to a higher nutrient availability increased the diversity ofphytoplankton in a lake with a very stable stratification, inparticular with a disturbance frequency of 6 days (Flöderand Sommer 1999). In that study, undisturbed communitieswere compared with disturbed ones at different frequencies,where the highest value of H′ was between 2.5 and 3. In ourstudy, the phytoplankton communities changed in responseto a natural pattern of disturbances, with about one forcingevent per week and one large forcing event per sampling pe-riod. Changes in the diversity index may have been maskedby modifications of the community by species replacement.
Forcing events may thus be seen as intermediate distur-bances for the phytoplankton community (Reynolds 1988),sensu Connell’s intermediate disturbance hypothesis (1978).This hypothesis postulates that disturbance opens space forcolonization. On an intermediate frequency of disturbances,the community is composed of a mosaic of patches at differ-ent stages of succession so that species richness at the com-munity level is the highest (Ricklefs and Miller 1999). Withmore frequent disturbances, many populations do not persist,whereas with less frequent disturbances, the mosaic ofpatches disappears, leading to competitive exclusion. How-ever, the phytoplankton communities in our study changeover three time scales in response to physical forcing, from atime scale of a few days to weekly and seasonal time scales.Consequently, successive disturbances affected differentcommunities, and the species that are considered as indica-tors for the following disturbance may be different ones.This is also observable on the seasonal time scale, in whichthe initial composition of the communities is quite different,in particular with respect to the dominant group (diatoms,cyanobacteria). As the phytoplankton community changesfollowing seasonal succession, disturbances by wind or rainevents will accelerate the transitions between dominantgroups, but they will not favor their codominance or increasethe diversity of the community. Therefore such events werenot considered here as intermediate disturbances. In sum, thephytoplankton community is seen to be embedded in a hier-archical pattern of forcing events, with short-term events ac-celerating community changes towards seasonal succession,which in turn responds to forces evolving over a longer timescale.
This study has shown that three time scales of physicaland chemical forcing induced different responses in the phyto-plankton community in terms of diversity, successional rateof community change, dominant species, and indicator spe-cies. The successional rate of change was the most sensitiveresponse parameter to the occurrence of short-term forcingevents, whereas the diversity index was most sensitive toseasonal and intermediate forcing, in particular to the strati-fication intensity. Most of the forcing events, while increas-ing the rate of change, did not induce a change in thephytoplankton community structure or in the concentrationof indicator species. Only multivariate analysis of the com-munity structure revealed that a shift in community had oc-
© 2007 NRC Canada
58 Can. J. Fish. Aquat. Sci. Vol. 65, 2008
Fig. 10. Summary of changes in phytoplankton communities overseasonal, weekly, and daily time scales (the arrows representphytoplankton response to each forcing).

curred. Moreover, the community did not revert to the initialcommunity after the disturbance because of intermediatetime scale forcing having modified the background physicaland chemical conditions. Short-term forcing accelerated spe-cies turnover with shifts in the phytoplankton communityover a few days, always in the direction of the seasonal suc-cession because of the intermediate time scale of forcing.
Acknowledgments
This study was carried out with the financial support of aMinisterial Grant to Alexandrine Pannard and the Contrat dePlan Etat Region (CPER) to Yvan Lagadeuc. We acknowl-edge the General des eaux, the General Council of Ille-et-Vilaine, EDF, and water managers of the city of Rennes fortheir help with access to the reservoirs. We are grateful toDenis Lahaye, Nicolas Clercin, and Guillaume Morillon forhelp with fieldwork and Marie-Paule Briand, NathalieJosselin, and Luc Brient for help with laboratory analyses.We thank David Bird (UQAM) for the English correction ofthe manuscript and three anonymous reviewers for their use-ful comments on the manuscript.
References
Anneville, O., Souissi, S., Ibanez, F., Ginot, V., Druart, J.-C., andAngelli, N. 2002. Temporal mapping of phytoplankton assem-blages in Lake Geneva: annual and interannual changes in theirpatterns of succession. Limnol. Oceanogr. 47(5): 1355–1366.
Barnes, H., and Folkard, A.R. 1951. The determination of nitrite.Analyst, 76: 599–603.
Bourrelly, P. 1966. Les algues d’eau douce. I. Les algues vertes.Boubee & Cie, Paris, France.
Bourrelly, P. 1968. Les algues d’eau douce. II. Les algues jaunes etbrunes. Boubee & Cie, Paris, France.
Bourrelly, P. 1970. Les algues d’eau douce. III. Les algues bleueset rouges. Boubee & Cie, Paris, France.
Cardoso, L.S., and Marques, D.M. 2003. Rate of change of thephytoplankton community in Itapeva Lake (north coast of RioGrande do Sul, Brazil), based on the wind driven hydrodynamicregime. Hydrobiologia, 497(1–3): 1–12.
Connell, J.H. 1978. Diversity in tropical rain forests and coralreefs. Science (Washington, D.C.), 199: 1302–1310.
Diehl, S., Berger, S., Ptacnik, R., and Wild, A. 2002. Phytoplankton,light and nutrients in a gradient of mixing depths. Theor. Ecol.83(2): 386–398.
Dray, S., Chessel, D., and Thioulouse, J. 2003a. Co-inertia analysisand the linking of ecological data tables. Ecology, 84(11): 3078–3089.
Dray, S., Chessel, D., and Thioulouse, J. 2003b. Procrustean co-inertia analysis for the linking of ecological tables. Ecoscience,10: 110–119.
Figueredo, C.C., and Giani, A. 2001. Seasonal variation in the diver-sity and species richness of phytoplankton in a tropical eutrophicreservoir. Hydrobiologia, 445(1–3): 165–174.
Flöder, S., and Sommer, U. 1999. Diversity in planktonic commu-nities: an experimental test of the intermediate disturbance hy-pothesis. Limnol. Oceanogr. 44(4): 1114–1119.
Garnier, J., Billen, G., and Coste, M. 1995. Seasonal succession ofdiatoms and Chlorophyceae in the drainage network of the SeineRiver: observations and modeling. Limnol. Oceanogr. 40(4): 750–765.
Grover, J. 1988. Dynamics of competition in a variable environment:experiments with two diatom species. Ecology, 69(2): 408–417.
Heo, M., and Gabriel, K.R. 1997. A permutation test of associationbetween configurations by means of the RV coefficient. Commun.Stat. Simulation Computation, 27: 843–856.
Huisman, J., and Weissing, F.J. 1999. Biodiversity of plankton by spe-cies oscillations and chaos. Nature (London), 402(6760): 407–410.
Huisman, J., Arrayas, M., Ebert, U., and Sommeijer, B. 2002. Howdo sinking phytoplankton species manage to persist? Am. Nat.159(3): 245–254.
Huisman, J., Sharples, J., Stroom, J., Visser, P., Kardinaal, W.,Verspagen, J., and Sommeijer, B. 2004. Changes in turbulentmixing shift competition for light between phytoplankton spe-cies. Ecology, 85: 2960–2970.
Huszar, V.L.d.M., and Reynolds, C.S. 1997. Phytoplankton period-icity and sequences of dominance in an Amazonian flood-plainlake (Lago Batata, Pará, Brasil): responses to gradual environ-mental change. Hydrobiologia, 346(1–3): 169–181.
Imberger, J., and Parker, G. 1985. Mixed layer dynamics in a lakeexposed to a spatially variable wind field. Limnol. Oceanogr.30(3): 473–488.
Imberger, J., and Patterson, J.C. 1990. Physical limnology. Adv.Appl. Mech. 27: 303–475.
Irwin, A.J., Finkel, Z.V., Schofield, O.M.E., and Falkowski, P.G.2006. Scaling-up from nutrient physiology to the size-structureof phytoplankton communities. J. Plankton Res. 28(5): 459–471.
Kangas, M. 2004. R: a computational and graphics resource forecologists. Front. Ecol. Environ. 2(5): 277–277.
Klausmeier, C.A., and Litchman, E. 2001. Algal games: the verti-cal distribution of phytoplankton in poorly mixed water col-umns. Limnol. Oceanogr. 46(8): 1998–2007.
Lagadeuc, Y., Brylinski, J., and Aelbrecht, D. 1997. Temporal vari-ability of the vertical stratification of a front in a tidal Region OfFreshwater Influence (ROFI) system. J. Mar. Syst. 12: 147–155.
Lewis, W. 1978a. Analysis of succession in a tropical phytoplanktoncommunity and a new measure of succession rate. Am. Nat.112(984): 401–414.
Lewis, W. 1978b. Dynamics and succession of the phytoplankton ina tropical lake: Lake Lanao, Philippines. J. Ecol. 66: 849–880.
Lund, J., Kipling, C., and Cren, E.L. 1958. The inverted micro-scope method of estimating algal numbers and the statistical ba-sis of estimations by counting. Hydrobiologia, 11: 143–170.
MacIntyre, S., Flynn, K.M., Jellison, R., and Romero, J.R. 1999.Boundary mixing and nutrient fluxes in Mono Laka, California.Limnol. Oceanogr. 44(3): 512–529.
Millard, E., Myles, D., Johannsson, O., and Ralph, K. 1996. Sea-sonal phosphorus deficiency of Lake Ontario phytoplankton attwo index stations: light versus phosphorus limitation of growth.Can. J. Fish. Aquat. Sci. 53: 1112–1124.
Murphy, J., and Riley, J.P. 1962. A modified single-solution methodfor the determination of phosphate in natural waters. Anal. Chim.Acta, 27: 31–36.
Noges, T., Kisand, V., Noges, P., Pollumae, A., Tuvikene, L., andZingel, P. 1998. Plankton seasonal dynamics and its controllingfactors in shallow polymictic eutrophic Lake Vortsjarv, Estonia.Int. Rev. Hydrobiol. 83(4): 279–296.
Padisák, J., Krienitz, L., Scheffler, W., Koschel, R., Kristiansen, J.,and Grigorszky, I. 1998. Phytoplankton succession in the oligo-trophic Lake Stechlin (Germany) in 1994 and 1995. Hydro-biologia, 369/370: 179–197.
Pannard, A., Bormans, M., and Lagadeuc, Y. 2007. Short-termvariability in physical forcing in temperate reservoirs: effects onphytoplankton dynamics and sedimentary fluxes. Freshw. Biol.52: 12–27.
© 2007 NRC Canada
Pannard et al. 59

Peres-Neto, P.R., and Jackson, D.A. 2001. How well do multi-variate data sets match? The advantages of a Procrustean super-imposition approach over the Mantel test. Oecologia, 129(2):169–178.
Ptacnick, R., Diehl, S., and Berger, S. 2003. Performance of sink-ing and non-sinking phytoplankton taxa in a gradient of mixingdepths. Limnol. Oceanogr. 48(5): 1903–1912.
Reynolds, C.S. 1984a. The ecology of freshwater phytoplankton.University Press, Cambridge, UK.
Reynolds, C.S. 1984b. Phytoplankton periodicity: the interactionsof form, function and environmental variability. Freshw. Biol.14: 111–142.
Reynolds, C.S. 1988. Concept of ecological succession applied toseasonal periodicity of freshwater phytoplankton. Int. Ver. Theor.Angew. Limnol. 23(2): 683–691.
Ricklefs, R., and Miller, G. 1999. Ecology. 4th ed. Freeman, NewYork.
Rodier, J. 1978. L’analyse de l’eau. Dunod, Paris, France.Rossum, J.R., and Villaruz, P.A. 1963. Determination of ammonia by
the indophenol method. J. Am. Water Works Assoc. 55: 657–658.Shannon, C.E. 1948. A mathematical theory of communication.
Bell Syst. Tech. J. 27: 379–423; 623–656.Sommer, U. 1985. Comparison between steady state and non-steady
state competition: experiments with natural phytoplankton.Limnol. Oceanogr. 30(2): 335–346.
Sommer, U., Gliwicz, Z.M., Lampert, W., and Duncan, A. 1986.The PEG-model of seasonal succession of planktonic events infresh waters. Arch. Hydrobiol. 106(4): 433–471.
Talling, J.F. 1957. Photosynthetic characteristics of some freshwa-ter diatoms in relation to underwater radiation. New Phytol. 56:29–50.
Wetzel, R.G. 2001. Limnology: lake and river ecosystems. 3rd ed.Academic Press, San Diego, California.
© 2007 NRC Canada
60 Can. J. Fish. Aquat. Sci. Vol. 65, 2008