phytoplankton as bioindicators of water quality in
TRANSCRIPT
Original ArticleActa Limnologica Brasiliensia, 2020, vol. 32, e4
https://doi.org/10.1590/S2179-975X3319ISSN 2179-975X on-line version
This is an Open Access article distributed under the terms of the Creative Commons Attribution License, which permits unrestricted use, distribution, and reproduction in any medium, provided the original work is properly cited.
Phytoplankton as bioindicators of water quality in Nasarawa reservoir, Katsina State Nigeria
Fitoplâncton como bioindicadores da qualidade da água do reservatório de Nasarawa, estado de Katsina, Nigéria
Zahraddeen Hassan Yusuf1*
1 Federal College of Education P.M.B 2041, Katsina, Nigeria*e-mail: [email protected]
Cite as: Yusuf, Z.H. Phytoplankton as bioindicators of water quality in Nasarawa reservoir, Katsina State Nigeria. Acta Limnologica Brasiliensia, 2020, vol. 32, e4.
Abstract: Aim: Phytoplankton monitoring as bioindicators to assess the health of the Nasarawa reservoir and also to evaluate the relationship between phytoplankton and reservoir environmental variables. Methods: Phytoplankton and water samples from Nasarawa reservoir (Nigeria) were collected and analysed for ten months (February, 2018 to November, 2018) using standard methods at five sampling sites. Results: A total of 38 genera belonging to five major families such as: Bacillariophyceae (42%), Chlorophyceae (24%) Cyanophyceae (13%), Deemidiaceae (18%) and Euglenophyceae (3%) were recorded. Four Phytoplankton classes; Bacillariophyta, Chlorophyta Cyanophyta, and Desmidiaceae show positive close relation with dissolved oxygen, pH, transparency, and total dissolved solids. The overall phytoplankton density in the reservoir was higher in dry season than the wet season. Palmer pollution index was employed to study the water quality of the reservoir. The total score was calculated to be 25, showing evidence of high organic pollution. Conclusions: The presence of organic pollution indicators Closterium sp, Navicula sp, Nitzschia sp, Synedra sp, Chlamydomonas sp, Cyclotella sp and Anacystis sp is a warning sign of the deteriorating condition of the water quality in the reservoir. Measures need to be enforced to reduce the rate of pollution of the reservoir arising from the human activities in the catchment of the reservoir.
Keywords: bioindicators; pollution; phytoplankton; Nasarawa Reservoir.
Resumo: Objetivo: Monitoramento do fitoplâncton como bioindicador para avaliar a condição do reservatório de Nasarawa e também avaliar a relação entre o fitoplâncton e as variáveis ambientais do reservatório. Métodos: Amostras de fitoplâncton e água do reservatório de Nasarawa (Nigéria) foram coletadas e analisadas de forma padronizada durante dez meses (fevereiro de 2018 a novembro de 2018) em cinco locais de amostragem. Resultados: Foram registrados 38 gêneros pertencentes a cinco principais famílias: Bacillariophyceae (42%), Chlorophyceae (24%) Cyanophyceae (13%), Deemidiaceae (18%) e Euglenophyceae (3%). Quatro classes de fitoplâncton; Bacillariophyta, Chlorophyta Cyanophyta e Desmidiaceae mostram relação positiva com oxigênio dissolvido, pH, transparência e sólidos totais dissolvidos. A densidade total de fitoplâncton no reservatório foi maior na estação seca do que na estação chuvosa. O índice de poluição de Palmer foi empregado para avaliar a qualidade da água do reservatório. A pontuação total foi calculada em 25, mostrando evidências de poluição orgânica elevada. Conclusões: A presença de indicadores de poluição orgânica Closterium sp, Navicula sp, Nitzschia sp, Synedra sp, Chlamydomonas sp, Cyclotella sp e Anacystis sp é um sinal de alerta para a deterioração das condições da qualidade da água do reservatório. Medidas são necessárias para reduzir a taxa de poluição do reservatório decorrente das atividades humanas na bacia hidrográfica do reservatório.
Palavras-chave: bioindicadores; poluição; fitoplâncton; reservatório Nasarawa.
2 Yusuf, Z.H.
Acta Limnologica Brasiliensia, 2020, vol. 32, e4
nutrient enrichment. The influence of environmental factors on the seasonal abundance and diversity of plankton biotypes varies significantly, with physical factors like temperature and light intensity being the most important and chemical factors like dissolved oxygen, pH, salinity, hardness, electrical conductivity and nutrient level being of lesser importance (Reynolds, 1984). As algae have a very broad area of distribution in aquatic environments, they can be very important source of oxygen in these environments, and they are providing food for all other organisms ranging from benthic invertebrates to fish (Round, 1984). However, overpopulation of algae would take place due to discharge of nutrients into aquatic ecosystems (Akköz & Güler, 2004). There is little or no environmental baseline data of Nasarawa reservoir. No effort has been made before for studying the water quality of the reservoir. Therefore, it was felt desirable to undertake study on the monitoring of phytoplankton taxa as bioindicators for assessing the health of Nasarawa reservoir, and also to assess the relationship between phytoplankton and the environmental variables of the reservoir.
2. Materials and Methods
2.1. Study area
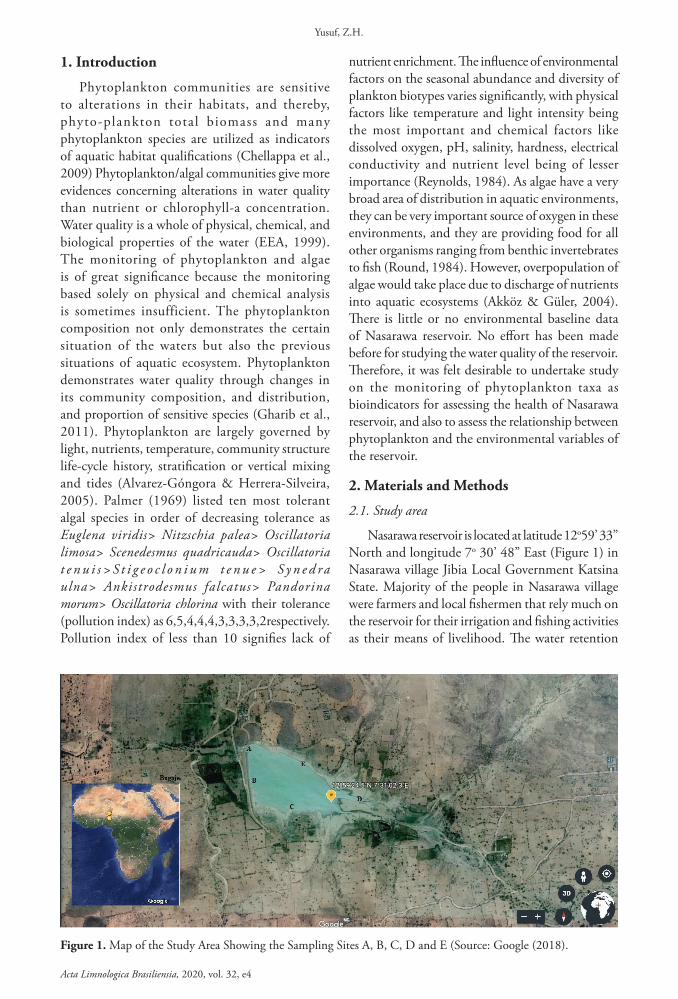
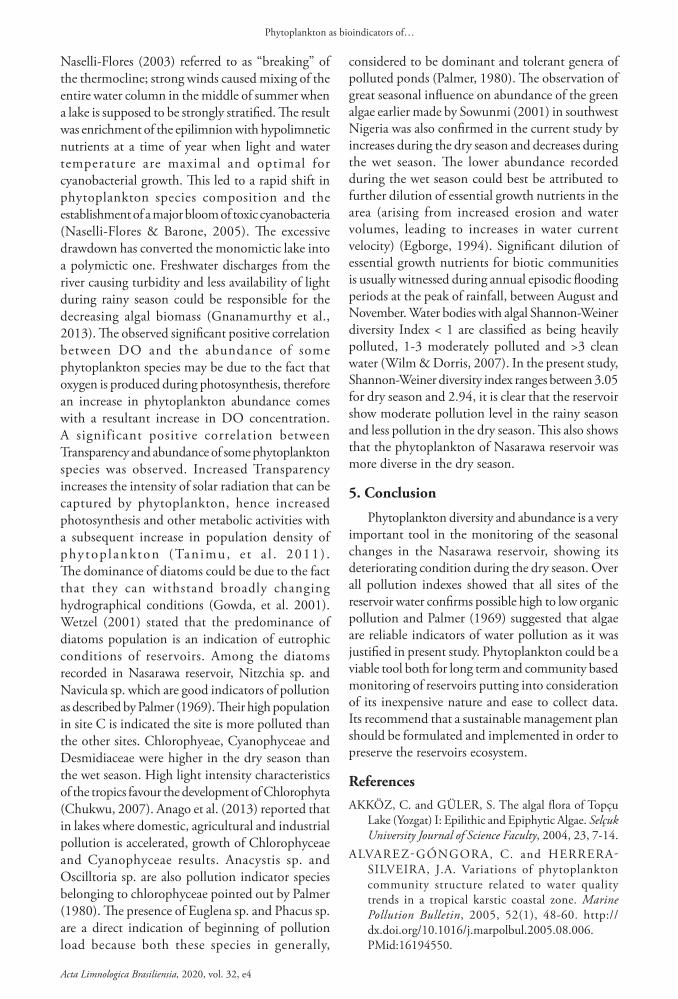
Nasarawa reservoir is located at latitude 12o59’ 33” North and longitude 7o 30’ 48” East (Figure 1) in Nasarawa village Jibia Local Government Katsina State. Majority of the people in Nasarawa village were farmers and local fishermen that rely much on the reservoir for their irrigation and fishing activities as their means of livelihood. The water retention
1. Introduction
Phytoplankton communities are sensitive to alterations in their habitats, and thereby, phyto-plankton total biomass and many phytoplankton species are utilized as indicators of aquatic habitat qualifications (Chellappa et al., 2009) Phytoplankton/algal communities give more evidences concerning alterations in water quality than nutrient or chlorophyll-a concentration. Water quality is a whole of physical, chemical, and biological properties of the water (EEA, 1999). The monitoring of phytoplankton and algae is of great significance because the monitoring based solely on physical and chemical analysis is sometimes insufficient. The phytoplankton composition not only demonstrates the certain situation of the waters but also the previous situations of aquatic ecosystem. Phytoplankton demonstrates water quality through changes in its community composition, and distribution, and proportion of sensitive species (Gharib et al., 2011). Phytoplankton are largely governed by light, nutrients, temperature, community structure life-cycle history, stratification or vertical mixing and tides (Alvarez-Góngora & Herrera-Silveira, 2005). Palmer (1969) listed ten most tolerant algal species in order of decreasing tolerance as Euglena viridis> Nitzschia palea> Oscillatoria limosa> Scenedesmus quadricauda> Oscillatoria t e n u i s > S t i g e o c l o n i u m t e n u e > S y n e d ra ulna> Ankistrodesmus falcatus> Pandorina morum> Oscillatoria chlorina with their tolerance (pollution index) as 6,5,4,4,4,3,3,3,3,2respectively. Pollution index of less than 10 signifies lack of
Figure 1. Map of the Study Area Showing the Sampling Sites A, B, C, D and E (Source: Google (2018).
3 Phytoplankton as bioindicators of…
Acta Limnologica Brasiliensia, 2020, vol. 32, e4
time was between 5–6 months in the raining season, while the water residence time in the dry season was 3-4 months.
2.2. Sampling and analysis
From the results of the preliminary visit to the reservoir, five sampling stations: A, B, C, D and E were selected for the purpose of sample collection (Figure 1). Stratified sampling technique was used to establish the sampling sites. The minimum distance between the sampling stations was 200 meters (Averett & Schroder, 1994). Water samples were collected randomly from February to November, 2018. A water Sampler was used in the collection of water samples between 10 am to 2 pm. The sampler was lowered into the water with aid of a graduated rope. Analysis for the physicochemical parameters of the water samples were carried out following the standard methods for the examination of water and waste water (APHA, 2005). Temperature, pH, electrical conductivity, total dissolved solids were determined using the Hanna instrument of model (H198129). Transparency was determined using Secchi disc painted black and white was tied with strong, thin rope. Dissolved oxygen and Biochemical Oxygen Demand was determined using a dissolved oxygen meter, total alkalinity by titration method using hydrochloric acid and methyl red and brocresol green solutions as indicators, total hardness by ethylene diamino tetra acetic acid (EDTA) titration method using eriochrome black-T dye, nitrate-nitrogen by colorimetric method using phenol di sulphonic acid, phosphate-phosphorous by using stannous chloride method (APHA, 2005).
Phytoplankton samples were collected with square mouthed bolting silk plankton net of 100 nm mesh size sunk beneath the surface of the reservoir and towed for a distance of one meter for each sampling operation. Samples were immediately preserved with Lugol’s solution and then stored for subsequent examination. Species identification was done using keys in Needham & Needham (1975). Numerical estimations of the both phytoplankton was done using the drop method described by Margalef (1974). The relative abundance of the various taxa was calculated for each sample using the formula: N = [a/b] n
Where: N= estimated number of genus per sample, a = volume of water sample in ml, b = volume of sub sample in ml, n = number of organisms in sub sample
Shannon-Weaver & Weaver (1949) diversity index (H) and species evenness was used to
determine the phytoplankton species composition and abundance. Shannon Index (H) = -Σ(pi ln pi)
Where pi = the proportion of the nth species in the sample i.e (Number of Individual Species/Total Number of Individuals in Sample)
H = the Shannon-wiener` index of diversity, S= number of species or species richness
Hmax =Maximum divers i ty poss ible , E = Eveness = 𝐻/𝐻𝑚𝑎𝑥
Palmer pollution index (Palmer, 1969) was used to determine the pollution level of the reservoir based on the algal taxa identified.
2.3. Statistical analysis
Data on temporal and spatial distribution patterns of the physico-chemical parameters and phytoplankton composition were analysed and any significant differences between seasons were tested using T test while spatial and monthly variations were assessed using one way analysis of variance (Graphpad Instat 3). Principal Components Analysis (PCA) was used to determine the relationship between physico-chemical parameters using the PAST software.
3. Results
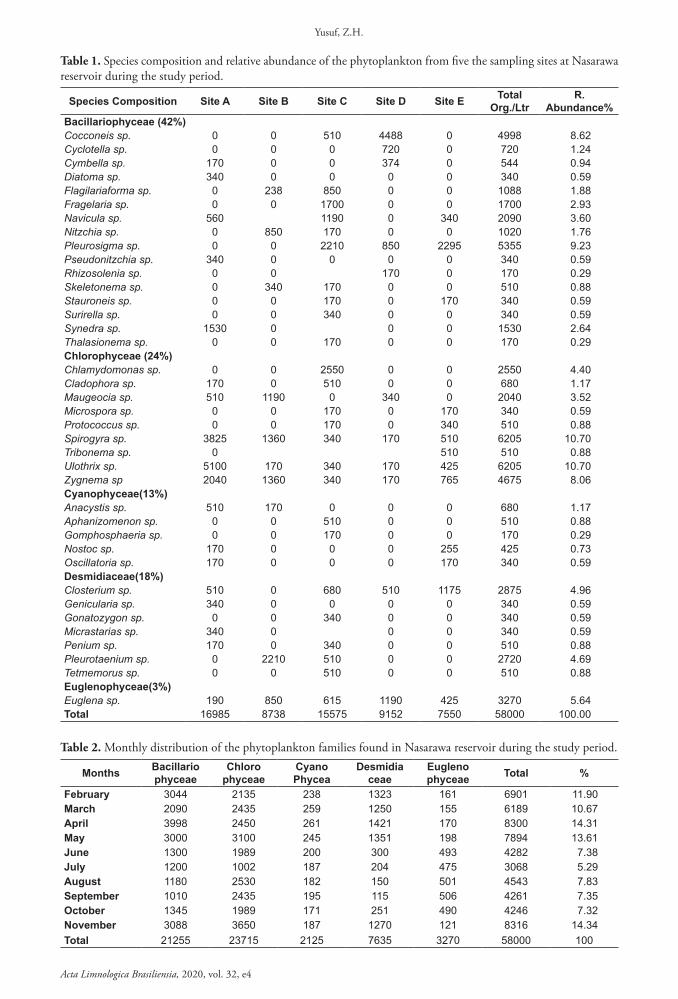
The results revealed the total composition and relative abundance of the phytoplankton species from five of the sampling sites. 58,000 org/l were recorded across the sampling sites through the study period. A total of 38 genera belonging to five classes were recorded in the five sampling sites. A total of 16985, 8738, 15575, 9152, 7550 phytoplankton species were recorded at sites A, B, C, D and E belonging to the following classes: Bacillariophyceae (42%), Chlorophyta (24%) Cyanophyceae (13%), Desmidiaceae (18%) and Euglenophyceae (3%) respectively. Spirogyra sp and Ulothrix sp were the most dominant species 6205 org/l (10.70%) and Rhizosolenia sp, Thalasionema sp,and Gomphosphaeria sp recorded the least species with 178(0.29%) (Table 1). The diatoms were present throughout the year with great abundance during the dry season. A decrease was observed in the class during the rainy periods. Bacillariophyta had its highest mean monthly distribution in the month of April at site C and lowest in December at site B (Table 2). Analysis of variance (P<0.05) of the class showed significant differences in, sampling sites, months and seasons. T test (P<0.01) shows high significant difference between seasons. Mean monthly population of Chlorophyta showed that November had highest number with 1003 org/l at site A and the least
4 Yusuf, Z.H.
Acta Limnologica Brasiliensia, 2020, vol. 32, e4
Table 2. Monthly distribution of the phytoplankton families found in Nasarawa reservoir during the study period.
Months Bacillariophyceae
Chlorophyceae
CyanoPhycea
Desmidiaceae
Euglenophyceae Total %
February 3044 2135 238 1323 161 6901 11.90March 2090 2435 259 1250 155 6189 10.67April 3998 2450 261 1421 170 8300 14.31May 3000 3100 245 1351 198 7894 13.61June 1300 1989 200 300 493 4282 7.38July 1200 1002 187 204 475 3068 5.29August 1180 2530 182 150 501 4543 7.83September 1010 2435 195 115 506 4261 7.35October 1345 1989 171 251 490 4246 7.32November 3088 3650 187 1270 121 8316 14.34Total 21255 23715 2125 7635 3270 58000 100
Table 1. Species composition and relative abundance of the phytoplankton from five the sampling sites at Nasarawa reservoir during the study period.
Species Composition Site A Site B Site C Site D Site E Total Org./Ltr
R. Abundance%
Bacillariophyceae (42%)Cocconeis sp. 0 0 510 4488 0 4998 8.62Cyclotella sp. 0 0 0 720 0 720 1.24Cymbella sp. 170 0 0 374 0 544 0.94Diatoma sp. 340 0 0 0 0 340 0.59Flagilariaforma sp. 0 238 850 0 0 1088 1.88Fragelaria sp. 0 0 1700 0 0 1700 2.93Navicula sp. 560 1190 0 340 2090 3.60Nitzchia sp. 0 850 170 0 0 1020 1.76Pleurosigma sp. 0 0 2210 850 2295 5355 9.23Pseudonitzchia sp. 340 0 0 0 0 340 0.59Rhizosolenia sp. 0 0 170 0 170 0.29Skeletonema sp. 0 340 170 0 0 510 0.88Stauroneis sp. 0 0 170 0 170 340 0.59Surirella sp. 0 0 340 0 0 340 0.59Synedra sp. 1530 0 0 0 1530 2.64Thalasionema sp. 0 0 170 0 0 170 0.29Chlorophyceae (24%)Chlamydomonas sp. 0 0 2550 0 0 2550 4.40Cladophora sp. 170 0 510 0 0 680 1.17Maugeocia sp. 510 1190 0 340 0 2040 3.52Microspora sp. 0 0 170 0 170 340 0.59Protococcus sp. 0 0 170 0 340 510 0.88Spirogyra sp. 3825 1360 340 170 510 6205 10.70Tribonema sp. 0 510 510 0.88Ulothrix sp. 5100 170 340 170 425 6205 10.70Zygnema sp 2040 1360 340 170 765 4675 8.06Cyanophyceae(13%)Anacystis sp. 510 170 0 0 0 680 1.17Aphanizomenon sp. 0 0 510 0 0 510 0.88Gomphosphaeria sp. 0 0 170 0 0 170 0.29Nostoc sp. 170 0 0 0 255 425 0.73Oscillatoria sp. 170 0 0 0 170 340 0.59Desmidiaceae(18%)Closterium sp. 510 0 680 510 1175 2875 4.96Genicularia sp. 340 0 0 0 0 340 0.59Gonatozygon sp. 0 0 340 0 0 340 0.59Micrastarias sp. 340 0 0 0 340 0.59Penium sp. 170 0 340 0 0 510 0.88Pleurotaenium sp. 0 2210 510 0 0 2720 4.69Tetmemorus sp. 0 0 510 0 0 510 0.88Euglenophyceae(3%)Euglena sp. 190 850 615 1190 425 3270 5.64Total 16985 8738 15575 9152 7550 58000 100.00
5 Phytoplankton as bioindicators of…
Acta Limnologica Brasiliensia, 2020, vol. 32, e4
was 117org/l in July at Site E (Table 1 and 2). Chlorophyta abundance was higher in the dry season than in the wet season. Statistically there was no significant difference between seasons (P>0.05). ANOVA at (P<0.05), showed significant differences exists in sampling sites and monthly abundance of Chlorophyta. Cyanophyta were persistently present throughout the year in sites A, B, C, and E with more occurrences in the dry season from February to May and reducing progressively in number from June to the end of the rainy season in October. Cyanophyta was completely absent in site D throughout the period of the study (Table 1 and 2). Cyanophyta revealed more diversity in the wet season than in dry season. Analysis of variance (P<0.05), revealed a significant difference in sampling sites abundance of the class during the study period. T test (P<0.05) showed significant difference the seasonal abundance of Cyanophyta of Nasarawa reservoir. The family Desmidiaceae occurs throughout the year, it was more abundant during the dry season and decrease in abundance for most part of the rainy season in all the stations. Desmidiaceae had its highest mean monthly distribution in the month of February at site C and lowest in September at site E (Table 1 and 2). T test (P<0.05) showed the dry season to had a higher Desmidiaceae cell count than the wet season. ANOVA (P>0.05) revealed no significant difference was found between the sampling sites during the study period. Euglenophyta was represented by Euglena viridis. Mean monthly distribution of Euglenophyta was highest during the month of September and lowest was recorded in January (Table 1 and 2). Site D recorded the highest number of Euglenophyta of 214 org/l and the least was recorded at site A with 8.0 org/l. Seasonal variations showed that abundance of Euglenophyta was highest during wet season and lowest during dry season. Euglenophyta indicated significant difference between seasons at P<0.05. ANOVA also revealed significant difference between sampling sites at (P<0.05). The results of Shannon weiver diversity indices and evenness showed a Shannon (H) value of 3.098, evenness value of 0.58. The pollution tolerant genera belonging to five groups of algae from five sites of Nasarawa was recorded (Table 3).
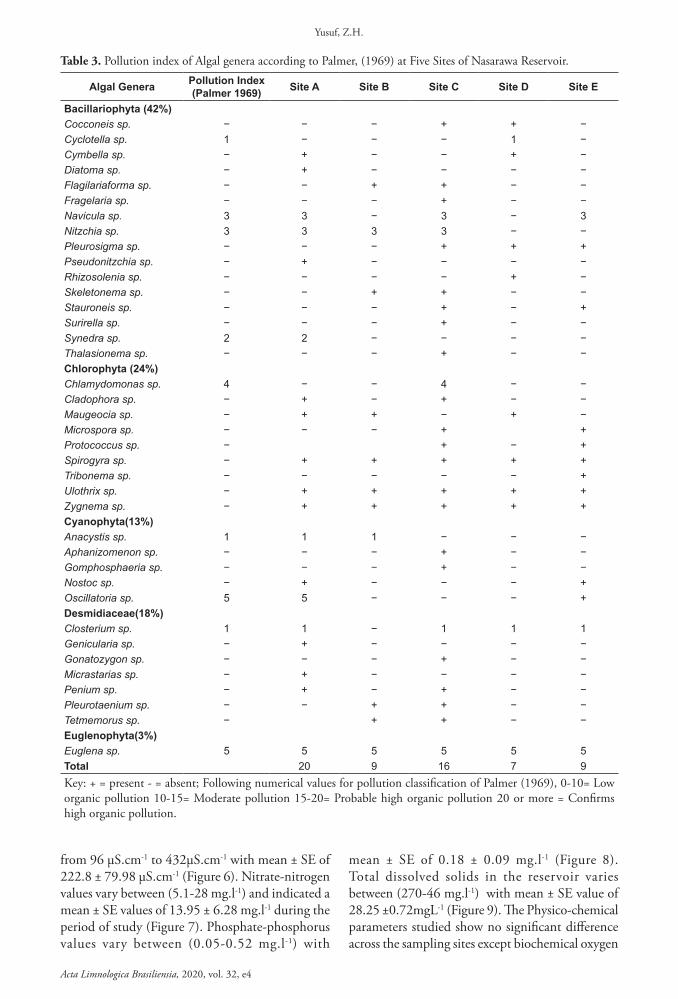
Nine pollution tolerant algal taxa were recorded in Nasarawa reservoir during the period of the study. The overall total score of Algal Genus Pollution Index (Palmer, 1969) of Nasarawa reservoir was calculated to be 25, showing evidence of high organic
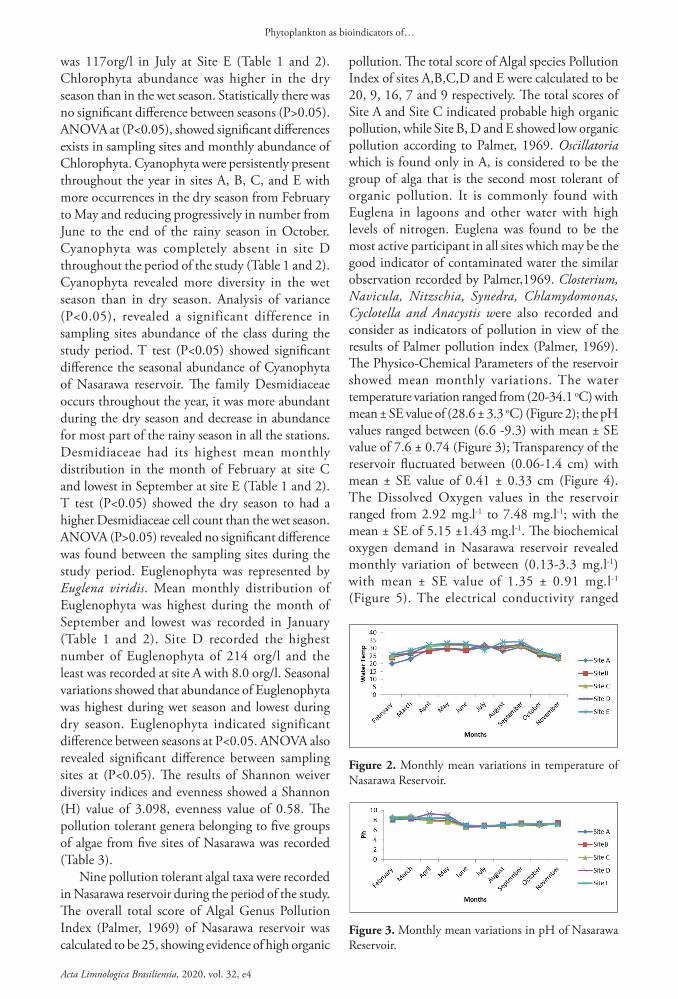
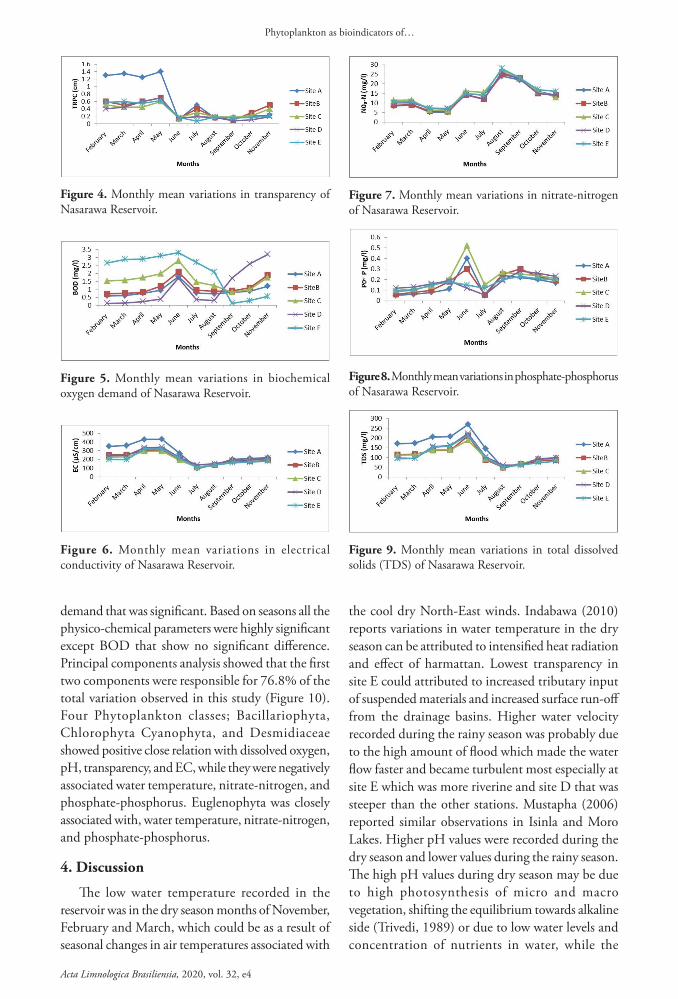
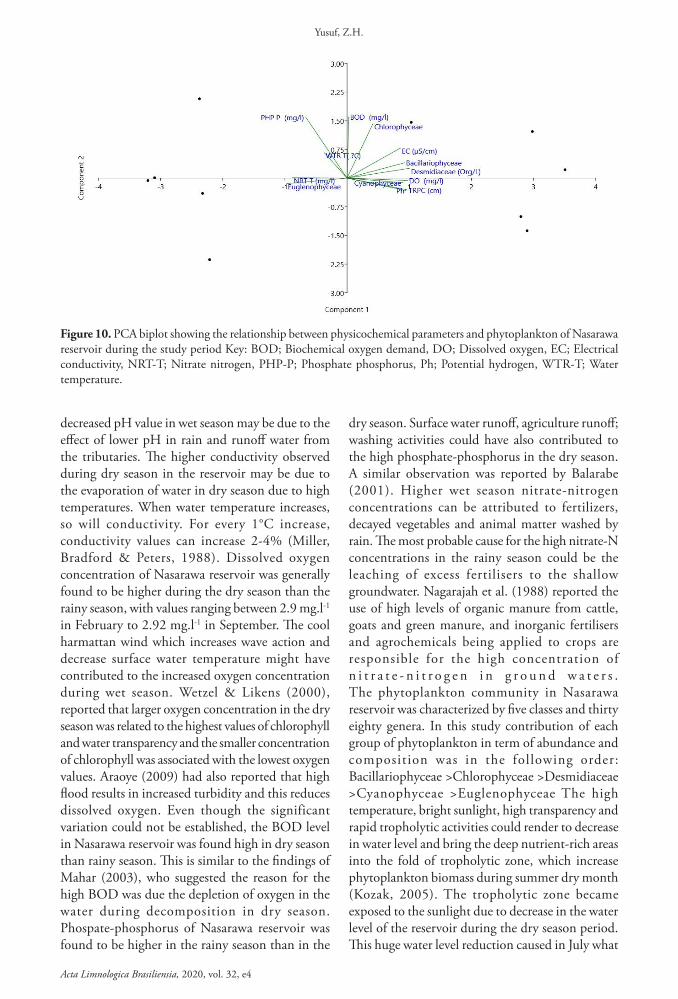
pollution. The total score of Algal species Pollution Index of sites A,B,C,D and E were calculated to be 20, 9, 16, 7 and 9 respectively. The total scores of Site A and Site C indicated probable high organic pollution, while Site B, D and E showed low organic pollution according to Palmer, 1969. Oscillatoria which is found only in A, is considered to be the group of alga that is the second most tolerant of organic pollution. It is commonly found with Euglena in lagoons and other water with high levels of nitrogen. Euglena was found to be the most active participant in all sites which may be the good indicator of contaminated water the similar observation recorded by Palmer,1969. Closterium, Navicula, Nitzschia, Synedra, Chlamydomonas, Cyclotella and Anacystis were also recorded and consider as indicators of pollution in view of the results of Palmer pollution index (Palmer, 1969). The Physico-Chemical Parameters of the reservoir showed mean monthly variations. The water temperature variation ranged from (20-34.1 oC) with mean ± SE value of (28.6 ± 3.3 oC) (Figure 2); the pH values ranged between (6.6 -9.3) with mean ± SE value of 7.6 ± 0.74 (Figure 3); Transparency of the reservoir fluctuated between (0.06-1.4 cm) with mean ± SE value of 0.41 ± 0.33 cm (Figure 4). The Dissolved Oxygen values in the reservoir ranged from 2.92 mg.l-1 to 7.48 mg.l-1; with the mean ± SE of 5.15 ±1.43 mg.l-1. The biochemical oxygen demand in Nasarawa reservoir revealed monthly variation of between (0.13-3.3 mg.l-1) with mean ± SE value of 1.35 ± 0.91 mg.l-1 (Figure 5). The electrical conductivity ranged
Figure 2. Monthly mean variations in temperature of Nasarawa Reservoir.
Figure 3. Monthly mean variations in pH of Nasarawa Reservoir.
6 Yusuf, Z.H.
Acta Limnologica Brasiliensia, 2020, vol. 32, e4
from 96 μS.cm-1 to 432μS.cm-1 with mean ± SE of 222.8 ± 79.98 μS.cm-1 (Figure 6). Nitrate-nitrogen values vary between (5.1-28 mg.l-1) and indicated a mean ± SE values of 13.95 ± 6.28 mg.l-1 during the period of study (Figure 7). Phosphate-phosphorus values vary between (0.05-0.52 mg.l-1) with
mean ± SE of 0.18 ± 0.09 mg.l-1 (Figure 8). Total dissolved solids in the reservoir varies between (270-46 mg.l-1) with mean ± SE value of 28.25 ±0.72mgL-1 (Figure 9). The Physico-chemical parameters studied show no significant difference across the sampling sites except biochemical oxygen
Table 3. Pollution index of Algal genera according to Palmer, (1969) at Five Sites of Nasarawa Reservoir.
Algal Genera Pollution Index (Palmer 1969) Site A Site B Site C Site D Site E
Bacillariophyta (42%)Cocconeis sp. − − − + + −Cyclotella sp. 1 − − − 1 −Cymbella sp. − + − − + −Diatoma sp. − + − − − −Flagilariaforma sp. − − + + − −Fragelaria sp. − − − + − −Navicula sp. 3 3 − 3 − 3Nitzchia sp. 3 3 3 3 − −Pleurosigma sp. − − − + + +Pseudonitzchia sp. − + − − − −Rhizosolenia sp. − − − − + −Skeletonema sp. − − + + − −Stauroneis sp. − − − + − +Surirella sp. − − − + − −Synedra sp. 2 2 − − − −Thalasionema sp. − − − + − −Chlorophyta (24%)Chlamydomonas sp. 4 − − 4 − −Cladophora sp. − + − + − −Maugeocia sp. − + + − + −Microspora sp. − − − + +Protococcus sp. − + − +Spirogyra sp. − + + + + +Tribonema sp. − − − − − +Ulothrix sp. − + + + + +Zygnema sp. − + + + + +Cyanophyta(13%)Anacystis sp. 1 1 1 − − −Aphanizomenon sp. − − − + − −Gomphosphaeria sp. − − − + − −Nostoc sp. − + − − − +Oscillatoria sp. 5 5 − − − +Desmidiaceae(18%)Closterium sp. 1 1 − 1 1 1Genicularia sp. − + − − − −Gonatozygon sp. − − − + − −Micrastarias sp. − + − − − −Penium sp. − + − + − −Pleurotaenium sp. − − + + − −Tetmemorus sp. − + + − −Euglenophyta(3%)Euglena sp. 5 5 5 5 5 5Total 20 9 16 7 9Key: + = present - = absent; Following numerical values for pollution classification of Palmer (1969), 0-10= Low organic pollution 10-15= Moderate pollution 15-20= Probable high organic pollution 20 or more = Confirms high organic pollution.
7 Phytoplankton as bioindicators of…
Acta Limnologica Brasiliensia, 2020, vol. 32, e4
demand that was significant. Based on seasons all the physico-chemical parameters were highly significant except BOD that show no significant difference. Principal components analysis showed that the first two components were responsible for 76.8% of the total variation observed in this study (Figure 10). Four Phytoplankton classes; Bacillariophyta, Chlorophyta Cyanophyta, and Desmidiaceae showed positive close relation with dissolved oxygen, pH, transparency, and EC, while they were negatively associated water temperature, nitrate-nitrogen, and phosphate-phosphorus. Euglenophyta was closely associated with, water temperature, nitrate-nitrogen, and phosphate-phosphorus.
4. Discussion
The low water temperature recorded in the reservoir was in the dry season months of November, February and March, which could be as a result of seasonal changes in air temperatures associated with
the cool dry North-East winds. Indabawa (2010) reports variations in water temperature in the dry season can be attributed to intensified heat radiation and effect of harmattan. Lowest transparency in site E could attributed to increased tributary input of suspended materials and increased surface run-off from the drainage basins. Higher water velocity recorded during the rainy season was probably due to the high amount of flood which made the water flow faster and became turbulent most especially at site E which was more riverine and site D that was steeper than the other stations. Mustapha (2006) reported similar observations in Isinla and Moro Lakes. Higher pH values were recorded during the dry season and lower values during the rainy season. The high pH values during dry season may be due to high photosynthesis of micro and macro vegetation, shifting the equilibrium towards alkaline side (Trivedi, 1989) or due to low water levels and concentration of nutrients in water, while the
Figure 4. Monthly mean variations in transparency of Nasarawa Reservoir.
Figure 5. Monthly mean variations in biochemical oxygen demand of Nasarawa Reservoir.
Figure 6. Monthly mean variations in electrical conductivity of Nasarawa Reservoir.
Figure 7. Monthly mean variations in nitrate-nitrogen of Nasarawa Reservoir.
Figure 8. Monthly mean variations in phosphate-phosphorus of Nasarawa Reservoir.
Figure 9. Monthly mean variations in total dissolved solids (TDS) of Nasarawa Reservoir.
8 Yusuf, Z.H.
Acta Limnologica Brasiliensia, 2020, vol. 32, e4
decreased pH value in wet season may be due to the effect of lower pH in rain and runoff water from the tributaries. The higher conductivity observed during dry season in the reservoir may be due to the evaporation of water in dry season due to high temperatures. When water temperature increases, so will conductivity. For every 1°C increase, conductivity values can increase 2-4% (Miller, Bradford & Peters, 1988). Dissolved oxygen concentration of Nasarawa reservoir was generally found to be higher during the dry season than the rainy season, with values ranging between 2.9 mg.l-1 in February to 2.92 mg.l-1 in September. The cool harmattan wind which increases wave action and decrease surface water temperature might have contributed to the increased oxygen concentration during wet season. Wetzel & Likens (2000), reported that larger oxygen concentration in the dry season was related to the highest values of chlorophyll and water transparency and the smaller concentration of chlorophyll was associated with the lowest oxygen values. Araoye (2009) had also reported that high flood results in increased turbidity and this reduces dissolved oxygen. Even though the significant variation could not be established, the BOD level in Nasarawa reservoir was found high in dry season than rainy season. This is similar to the findings of Mahar (2003), who suggested the reason for the high BOD was due the depletion of oxygen in the water during decomposition in dry season. Phospate-phosphorus of Nasarawa reservoir was found to be higher in the rainy season than in the
dry season. Surface water runoff, agriculture runoff; washing activities could have also contributed to the high phosphate-phosphorus in the dry season. A similar observation was reported by Balarabe (2001). Higher wet season nitrate-nitrogen concentrations can be attributed to fertilizers, decayed vegetables and animal matter washed by rain. The most probable cause for the high nitrate-N concentrations in the rainy season could be the leaching of excess fertilisers to the shallow groundwater. Nagarajah et al. (1988) reported the use of high levels of organic manure from cattle, goats and green manure, and inorganic fertilisers and agrochemicals being applied to crops are responsible for the high concentration of n i t r a t e - n i t r o g e n i n g r o u n d w a t e r s . The phytoplankton community in Nasarawa reservoir was characterized by five classes and thirty eighty genera. In this study contribution of each group of phytoplankton in term of abundance and composition was in the following order: Bacillariophyceae >Chlorophyceae >Desmidiaceae >Cyanophyceae >Euglenophyceae The high temperature, bright sunlight, high transparency and rapid tropholytic activities could render to decrease in water level and bring the deep nutrient-rich areas into the fold of tropholytic zone, which increase phytoplankton biomass during summer dry month (Kozak, 2005). The tropholytic zone became exposed to the sunlight due to decrease in the water level of the reservoir during the dry season period. This huge water level reduction caused in July what
Figure 10. PCA biplot showing the relationship between physicochemical parameters and phytoplankton of Nasarawa reservoir during the study period Key: BOD; Biochemical oxygen demand, DO; Dissolved oxygen, EC; Electrical conductivity, NRT-T; Nitrate nitrogen, PHP-P; Phosphate phosphorus, Ph; Potential hydrogen, WTR-T; Water temperature.
9 Phytoplankton as bioindicators of…
Acta Limnologica Brasiliensia, 2020, vol. 32, e4
Naselli-Flores (2003) referred to as “breaking” of the thermocline; strong winds caused mixing of the entire water column in the middle of summer when a lake is supposed to be strongly stratified. The result was enrichment of the epilimnion with hypolimnetic nutrients at a time of year when light and water temperature are maximal and optimal for cyanobacterial growth. This led to a rapid shift in phytoplankton species composition and the establishment of a major bloom of toxic cyanobacteria (Naselli-Flores & Barone, 2005). The excessive drawdown has converted the monomictic lake into a polymictic one. Freshwater discharges from the river causing turbidity and less availability of light during rainy season could be responsible for the decreasing algal biomass (Gnanamurthy et al., 2013). The observed significant positive correlation between DO and the abundance of some phytoplankton species may be due to the fact that oxygen is produced during photosynthesis, therefore an increase in phytoplankton abundance comes with a resultant increase in DO concentration. A significant positive correlation between Transparency and abundance of some phytoplankton species was observed. Increased Transparency increases the intensity of solar radiation that can be captured by phytoplankton, hence increased photosynthesis and other metabolic activities with a subsequent increase in population density of phytop lankton (Tanimu, e t a l . 2011) . The dominance of diatoms could be due to the fact that they can withstand broadly changing hydrographical conditions (Gowda, et al. 2001). Wetzel (2001) stated that the predominance of diatoms population is an indication of eutrophic conditions of reservoirs. Among the diatoms recorded in Nasarawa reservoir, Nitzchia sp. and Navicula sp. which are good indicators of pollution as described by Palmer (1969). Their high population in site C is indicated the site is more polluted than the other sites. Chlorophyeae, Cyanophyceae and Desmidiaceae were higher in the dry season than the wet season. High light intensity characteristics of the tropics favour the development of Chlorophyta (Chukwu, 2007). Anago et al. (2013) reported that in lakes where domestic, agricultural and industrial pollution is accelerated, growth of Chlorophyceae and Cyanophyceae results. Anacystis sp. and Oscilltoria sp. are also pollution indicator species belonging to chlorophyceae pointed out by Palmer (1980). The presence of Euglena sp. and Phacus sp. are a direct indication of beginning of pollution load because both these species in generally,
considered to be dominant and tolerant genera of polluted ponds (Palmer, 1980). The observation of great seasonal influence on abundance of the green algae earlier made by Sowunmi (2001) in southwest Nigeria was also confirmed in the current study by increases during the dry season and decreases during the wet season. The lower abundance recorded during the wet season could best be attributed to further dilution of essential growth nutrients in the area (arising from increased erosion and water volumes, leading to increases in water current velocity) (Egborge, 1994). Significant dilution of essential growth nutrients for biotic communities is usually witnessed during annual episodic flooding periods at the peak of rainfall, between August and November. Water bodies with algal Shannon-Weiner diversity Index < 1 are classified as being heavily polluted, 1-3 moderately polluted and >3 clean water (Wilm & Dorris, 2007). In the present study, Shannon-Weiner diversity index ranges between 3.05 for dry season and 2.94, it is clear that the reservoir show moderate pollution level in the rainy season and less pollution in the dry season. This also shows that the phytoplankton of Nasarawa reservoir was more diverse in the dry season.
5. Conclusion
Phytoplankton diversity and abundance is a very important tool in the monitoring of the seasonal changes in the Nasarawa reservoir, showing its deteriorating condition during the dry season. Over all pollution indexes showed that all sites of the reservoir water confirms possible high to low organic pollution and Palmer (1969) suggested that algae are reliable indicators of water pollution as it was justified in present study. Phytoplankton could be a viable tool both for long term and community based monitoring of reservoirs putting into consideration of its inexpensive nature and ease to collect data. Its recommend that a sustainable management plan should be formulated and implemented in order to preserve the reservoirs ecosystem.
ReferencesAKKÖZ, C. and GÜLER, S. The algal flora of Topçu
Lake (Yozgat) I: Epilithic and Epiphytic Algae. Selçuk University Journal of Science Faculty, 2004, 23, 7-14.
ALVAREZ- GÓNGORA, C. and HERRERA-SILVEIRA, J.A. Variations of phytoplankton community structure related to water quality trends in a tropical karstic coastal zone. Marine Pollution Bulletin, 2005, 52(1), 48-60. http://dx.doi.org/10.1016/j.marpolbul.2005.08.006. PMid:16194550.
10 Yusuf, Z.H.
Acta Limnologica Brasiliensia, 2020, vol. 32, e4
AMERICAN PUBLIC HEALTH ASSOCIATION – APHA. Standard methods for the examination of water and wastewater. Washington, DC: APHA, 2005.
ANAGO, I.J., ESENOWO, I.K. and UGWUMBA, A.A.A. The Physico-chemical and Plankton Diversity of Awba Reservoir University of Ibadan, Ibadan. Nigeria Research. Journal of Environment and Earth Science, 2013, 5(1), 638-644.
ARAOYE, P.A. The seasonal variation of pH and Dissolved Oxygen (DO2) concentration in Asa lake Ilorin, Nigeria. International Journal of Physical Sciences, 2009, 4(5), 271-274.
AVERETT, R.C. and SCHRODER, L.J. A guide to the design of surface-water-quality studies. Denver: U.S. Geological Survey, 1994 [viewed 14 Dec. 2018]. Available from http://pubs.er.usgs.gov/ publication/ofr93105
BALARABE, M.L. Effect of limnological characteristics on zooplankton composition and distribution in dumbi and kwangila ponds Zaria, Nigeria [Phd Thesis]. Zaria: Department of Biological Sciences, Ahmadu Bello University, 2001.
CHELLAPPA, N.T., CÂMARA, F.R.A. and ROCHA, O. Phytoplankton community: indicator of water quality in the Armando Ribeiro Gonçalves Reservoir and Pataxó Channel, Rio Grande do Norte, Brazil. Brazilian Journal of Biology = Revista Brasileira de Biologia, 2009, 69(2), 241-251. http://dx.doi.org/10.1590/S1519-69842009000200003. PMid:19675924.
CHUKWU, G.O. Land suitability classification of Southeastern Nigeria wetlands for azolla. Scientific Research and Essays, 2007, 2(12), 512-515.
EGBORGE, A.B.M. Water pollution in Nigeria Vol. 1: Biodiversity and chemistry of Warri River. Warri: Ben Miller Books Nig. Ltd., 1994, 313 p.
EUROPEAN ENVIRONMENTAL AGENCY – EEA. Nutrients in European Ecosystems. Environmental Assessment Report No. 4. Copenhagen: European Environmental Agency, 1999, 155 p.
GHARIB, S.M., EL-SHERIF, A.Z.M., ABDEL-HALIM, M. and RADWAN, A.A. Phytoplankton and environmental variables as a water quality indicator for the beaches at Matrouh, south-eastern Mediterranean Sea, Egypt: an assessment. Oceanologia, 2011, 53(3), 819-836. http://dx.doi.org/10.5697/oc.53-3.819.
GNANAMURTHY, P., SUNIL K. S., and ASHOK P. V. Multivariate analysis of Phytoplankton in relation to physicochemical parameters disparity in Parangipettai Waters, Southeast Coast of India. Asian Journal of Biological Sciences, 2013, 43(1), 1-20.
GOOGLE. Nasarawa Dam [online]. (2018). [viewed 20 Feb. 2018]. Available from: https://www.google.com/maps/@13.047042,7.3683719,211 19m/data=!3m1!1e3
GOWDA, G., GUPTA, T.R.C., RAJESH, K.M., GOWDA, H., LINGADHALAND, C. and RAMESH, A.M. Seasonal distribution of phytoplankton in Nethravathi estuary, Mangalore. Journal of the Marine Biological Association of India, 2001, 43(1), 31-40.
INDABAWA, I.I. Studies on Limnological parameters and Phytoplankton dynamic of Nguru lake Yobe state Nigeria. Bioscience Resources Communication, 2010, 21(4), 57-80.
KOZAK, A. Seasonal changes occurring over four years in a Reservoir’s Phytoplankton Composition. Polish Journal of Environmental Studies, 2005, 14(4), 451-465.
MAHAR, M.A. Ecology and Taxonomy of Plankton of Manchhar lake (Distt. Dadu), Sindh, Pakistan [PhD. Thesis]. Pakistan: University of Sindh, 2003. [viewed 12 Dec. 2018]. Available from: http://usindh.edu.pk.mukhatiar.ahmad/Dessertation_mukhatiar, 2003
MARGALEF, R. Estimating quantity and quality of biomass counting. In: R.A. VOLLENWEIDER, ed. A manual on methods for measuring primary production in aquatic environments. Oxford: Blackwell Scientific Publication, 1974, 213 p.
MILLER, R.L., BRADFORD, W.L. and PETERS, N.E. Specific Conductance: Theoretical Considerations and Application to Analytical Quality Control. Denver: U.S. Geological Survey Water-Supply Paper, 1988 [viewed 14 Dec. 2018]. Available from: http://pubs.usgs.gov/wsp/2311/report.pdf
MUSTAPHA, M.K. Effects of human activities on the biodiversity of a tropical man-made lake. Nigerian Journal of Pure and Applied Sciences, 2006, 21, 1960-1968.
NAGARAJAH, S., EMERSON, B.N., ABEYKOON, V., and YOGALINGAM, S. Water quality of some wells in Jaffna and Killinochchi with special reference to nitrate pollution. Tropical Agriculturist, 1988, 44, 61-73.
NASELLI-FLORES, L. and BARONE, R. Water-Level Fluctuations in mediterranean reservoirs: setting a dewatering threshold as a management tool to improve water quality. Hydrobiologi, 2005, 548(1), 85-99. http://dx.doi.org/10.1007/s10750-005-1149-6.
NASELLI -FLORES, L. Man-made lakes in Mediterranean semi-arid climate: The strange case of Dr Deep Lake and Mr Shallow Lake. Hydrobiologia, 2003, 506(1-3), 13-21. http://dx.doi.org/10.1023/B:HYDR.0000008550.34409.06.
NEEDHAM, J.G. and NEEDHAM, P.R. A guide to the study of fresh water biology. San Francisco: Holding-Day Inc., 1975, pp. 1-108.
PALMER, C.M. Algae & Water Pollution. England: Castle House Publishers Ltd, 1980.
11 Phytoplankton as bioindicators of…
Acta Limnologica Brasiliensia, 2020, vol. 32, e4
PALMER, C.M. Composite rating of algae tolerating organic pollution. Journal of Phycology, 1969, 5(1), 78-82. http://dx.doi.org/10.1111/j.1529-8817.1969.tb02581.x. PMid:27097257.
REYNOLDS, C.S. Phytoplankton periodicity: The interactions of form, function and environmental variability. Freshwater Biology, 1984, 14(2), 111-142. http://dx.doi.org/10.1111/j.1365-2427.1984.tb00027.x.
ROUND, F.E. The ecology of algae. Cambridge: CUP Archive, 1984.
SHANNON, C.E. and WEAVER, W. The mathematical theory of communication. Illinois: Urban University, Illinois Press, 1949, pp. 125-126.
SOWUNMI, A.A. The hydrology of Ologe Lagoon and River Owo at Agbara, South-West Nigeria [M.Phil. Thesis]. Nigeria: Department of Zoology, University of Ibadan, 2001, 180 p.
TANIMU, Y., BAKO, S.P., ADAKOLE, J.A. and TANIMU, J. Phytoplankton as bioindicators of water quality in saminaka reservoir, Northern-Nigeria. In: International Symposium on Environmental Science and Technology. Dongguan, Guangdong Province,
China; Environmental Science and Technology, 2011, pp. 83-87.
TRIVEDI, R.K. Limnology of three fresh water ponds in Manglore. In: National Symposium on Advances in limnology conservation of endangered fish species. Srinagar, Garhwal: Narendra Pub. House, 1989, pp. 23-25.
WETZEL, R.G. and LIKENS, G.E. Limnological analysis. 3rd ed. New York: Springer Verlag, 2000, pp. 654-656. http://dx.doi.org/10.1007/978-1-4757-3250-4.
WETZEL, R.G. Limnology: Lake and river ecosystems. 3rd ed. San Diego, CA: Academic Press, 2001.
WILM, J.L. and DORRIS, T.C. Species diversity of benthic macroinvertebrates in a stream receiving domestic and oil refinery effluents. In: S.M. ISLAM. Phytoplankton diversity index with reference to mucalinda serovar Bodh-Gaya, 12th World Lack Conference. Taal, India, American Midland Naturalist, 2007, pp. 427-449.
Received: 22 March 2019 Accepted: 12 December 2019