physiology: the cardiovascular system -...
TRANSCRIPT

Part 3a
Physiology: the cardiovascularsystem
105

106
3a
Part 3a With the exception of systemic arterial pressure, intravascular pressure wave-
forms can be observed during pulmonary artery catheterization. An ECG
trace is shown on figure 84 to relate the pressure waveforms to the cardiac
cycle.
The balloon-tipped catheter is introduced into a central vein and with
appropriate scale adjustment the central venous pressure trace, similar to
the one opposite, can be seen. The A wave corresponds to atrial contraction,
and is followed by the C wave: tricuspid valve closure simultaneous with
ventricular contraction. X descent follows, as the right atrium and central
vein are now empty and ventricular pressure is now indirectly transmitted
across the valve. The right atrium starts filling until the tricuspid valve opens
again. The V wave corresponds to the valve opening, following which central
venous pressure drops momentarily (the Y descent) as the right atrium
empties passively into the right ventricle until the next atrial systole.
The scale is usually adjusted to monitor right ventricular pressures, and
the central venous pressure trace is then an undulating waveform around the
usual 6–8 mmHg. A straight line indicates a technical problem such as wrong
connection or a kinked line.
At 15 cm the balloon is inflated and the catheter advanced downstream.
After 20 cm the catheter should enter the right atrium. Right atrial pressureis related to central venous pressure, their difference being the hydrostatic
pressure difference; in the supine patient this difference is very small.
Right ventricular pressure trace is instantly recognized when the
systolic pressure reaches 20–25 mmHg, while the diastolic pressure should
be close to zero.
At about 30 cm, the catheter tip should pass the pulmonary valve and the
pulmonary artery pressure trace should be seen. Its shape and amplitude
are similar to the ventricular pressure trace; however, the effect of the
pulmonary valve closure can be seen as the pressure trace does not return to
zero, and the diastolic pressure is about 8–12 mmHg.
Intravascular pressure waveformsand the ECG waveform

107
3aIntravascular pressure w
aveforms and the EC
G w
aveform
Figure 84. ECG waveform and intravascular pressure waveforms

After a further 5–10 cm, the balloon occludes the pulmonary artery and a
continuous column of blood should exist between the catheter tip and the left
atrium. A pressure trace now recorded is the pulmonary artery occlusionpressure (‘wedge pressure’). This corresponds to left atrial pressure and left
ventricular filling pressure, provided the following conditions are fulfilled
• The pulmonary intravascular pressure exceeds extravascular pressure, to
obtain a continuous column of blood. This condition is not fulfilled if the
intravascular pressure is low, e.g. when the catheter is lodged in West
zone 1, or if the extravascular pressure is abnormally high, as with the
application of positive end-expiratory pressure.
• The pressure in the left atrium reflects the left ventricular end-diastolic
pressure (LVEDP). In mitral valve disease left atrial pressure can be much
higher than LVEDP. Conversely, in heart failure when sinus rhythm is
preserved, LVEDP may be higher than the mean left atrial pressure: left
atrial pressure increases to the high ventricular level only during the atrial
systole.
Wedging of the pulmonary artery flotation catheter can be seen on the screen
as a sudden decrease in the amplitude of the pressure waveform to < 12
mmHg. (Left heart filling pressure is higher than on the right side.) On
deflation of the balloon, a normal pulmonary artery trace should be seen
again.
Arterial pressure waveform is shown in figure 85 with airway pressure
during intermittent positive pressure ventilation. Blood pressure trace shows
changes in phase with respiration, called the respiratory swing. (For more
details of the effects of intermittent positive pressure ventilation on blood
pressure see next chapter.) As the intrathoraic pressure is only increased
briefly during inspiration, overall effect is a decrease in arterial systolic and
diastolic pressure which lags behind the increase in intrathroacic pressure.
Respiratory swing is pronounced in hypovolaemia, and is a valuable tool in
the estimation of fluid deficit. Notice also that the dicrotic notch is low and
the arterial pressure trace is narrow in hypovolaemia. Many ITU monitors
have different sweep speeds for arterial pressure and for respiration; associ-
ation of blood pressure swing and airway pressure is then not observed on the
monitor.
108
3a
Part 3a

109
3aIntravascular pressure w
aveforms and the EC
G w
aveform
arterialblood pressure
airwaypressure
Figure 85. Arterial blood pressure and respiratory swing

Intermittent positive pressure ventilation causes changes in intrathoracic
pressure and blood volume, which are reflected in the cardiovascular param-
eters. Four phases can be recognized (see figure 86):
• Phase I: blood is forced into the left atrium by the increased
intrathoracic pressure – blood pressure rises and reflex bradycardia
follows.
• Phase IIa: blood pressure falls because of decreased venous return – the
result of the raised intrathoracic pressure.
• Phase IIb: blood pressure is restored to normal by reflex tachycardia.
• Phase III: venous return is decreased on lowering the intrathoracic
pressure as there is now increased venous capacity in the lungs. Blood
pressure falls initially but normalizes soon as reflex tachycardia persists.
• Phase IV: persisting tachycardia results in an overshoot of blood
pressure; heart rate then drops back to normal (baroreceptor reflex) and
blood pressure then also normalizes.
The magnitude of the effect on blood pressure as a result of effects on right
and left ventricular filling depends on blood volume and the integrity ofthe sympathetic nervous system control, i.e. effects will be exaggerated in
the presence of hypovolaemia, sympathetic blockade (this includes general
anaesthesia) or autonomic dysfunction (e.g. diabetic neuropathy), or a
combination of factors (ill patients, e.g. sepsis), as compensation is lost
(‘blocked Valsalva’). The ventilator settings also play a role – fast ventilation
rates with a long inspiratory phase will allow little time for compensation;
high ventilation pressures will cause greater effects.
In patients with pulmonary hypertension (e.g. severe ARDS), increased
airway pressure during intermittent positive pressure ventilation results in
increased pulmonary vascular resistance. Interventricular septum may shift
to the left and compromise the left ventricular filling, and eventually decrease
the stroke volume. Because the lung is leaky in ARDS, inspiration pressure
has to be controlled rather than fluids administered to improve left
ventricular filling.
110
3a
Part 3a
Cardiovascular effects ofintermittent positive pressureventilation

111
3a
SP 120
DP 80
P 40
Figure 86. Arterial blood pressure and pulse during the Valsalva manoeuvreSP, DP – systolic and diastolic pressuresP – pulse
Cardiovascular effects of interm
ittent positive pressure ventilation

112
3a
Part 3a Frank–Starling relationship describes the effect of initial fibre length on the
force of contraction in the heart muscle. Within physiological limits this rela-
tionship is linear (the force of contraction is directly proportional to initial
fibre length). Cardiac output is the product of stroke volume and heart rate.
Both are under the control of the sympathetic system. In addition,
Frank–Starling mechanism ensures that the output (cardiac output) matches
the input (preload), by matching the force of contraction to the preload.
The factors which alter venous return (preload) in effect control cardiac
output. The most important of these are the following:
• Venous tone: any condition associated with sympathetic stimulationwill increase cardiac output as a result of reduced venous capacity and
increased venous return. The peripheral metabolic need alters the
sympathetic tone.
• Blood volume: changes in water and salt intake result in temporary
changes of blood volume and thus cardiac output. Blood volume and
cardiac output are then restored to normal by changes in renal perfusion
(and thus changes in urine output). Blood volume expansion is used to
compensate for the reduced sympathetic tone under general or regional
anaesthesia.
• Posture: pooling of blood in dependent parts of the body results in
reduced venous return in the upright position – anti-Trendelenburg
position also reduces venous return after anaesthesia.
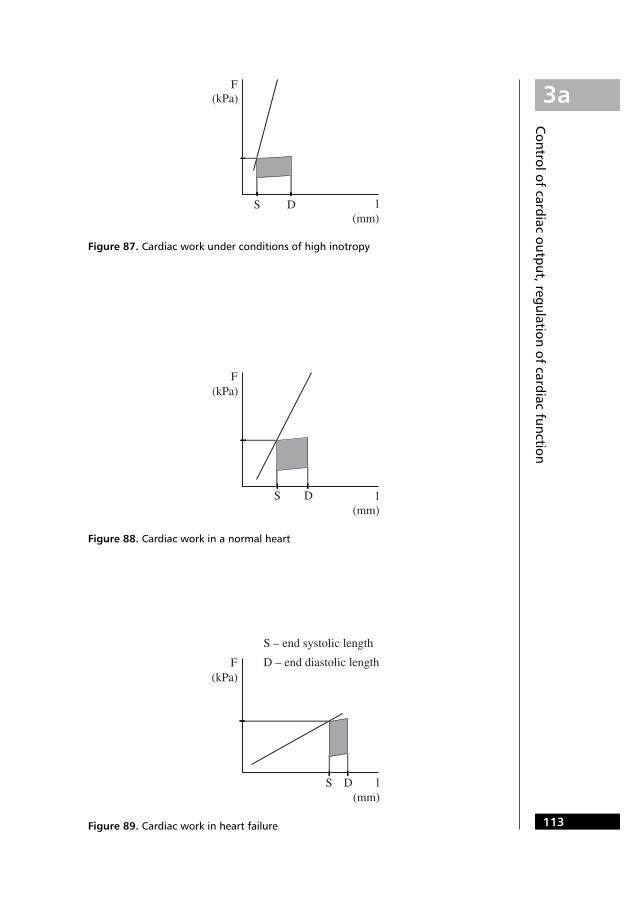
Figures 87–89 show the Frank–Starling relationship under various levels of
inotropy and also cardiac work as a product of the force of contraction and
fibre length (see chapter on simple mechanics). Only the linear part of the
Frank–Starling curve is shown. Cardiac work is the shaded area of the
rectangle showing the tension–fibre length relationship during the cardiac
cycle. D marks the diastolic fibre length and S the systolic fibre length.
Isometric contraction is shown as a rise in tension without a change in length.
It can be seen that a heart with a high level of inotropy operates at low pres-
sures and the contraction (from D to S) results in a large difference in length.
Compare this with a failing heart, which operates at a high pressure, has a
high preload yet contracts poorly – fibre shortening is small, and the bulk of
the work is done by a great increase in force. This then perpetuates heart
failure. Notice that the shaded area of heart work is roughly the same for all
three situations. It can be seen that to improve cardiac function in heart
failure, the slope of the Frank– Starling curve has to be increased rather than
preload. This is achieved by afterload reduction: the ventricle can eject better,
using less force to do the work.
Control of cardiac output,regulation of cardiac function
113
3a
Figure 87. Cardiac work under conditions of high inotropy
Figure 88. Cardiac work in a normal heart
Figure 89. Cardiac work in heart failure
Control of cardiac output, regulation of cardiac function

114
3a
Part 3a The filling pressure – end-diastolic volume
The heart fills during the diastole by venous return, augmented, if the heart is
in sinus rhythm, by atrial contribution. The pressure–volume relationship in
an object being filled is called compliance (dV/dp) – in this case the left
ventricular compliance, left ventricular end-diastolic volume and left
ventricular end-diastolic pressure. When plotting these quantities graphically
(figure 90), the compliance is read as the slope of the volume–pressure rela-
tionship: a highly compliant ventricle will have a steep slope, a stiff ventricle a
slowly rising one. Note that it is the end-diastolic volume that corre-sponds to the initial fibre length of the Frank–Starling relationship during
systole. For a particular left ventricular compliance, the end-diastolic pressure
will increase proportionately with the end-diastolic volume; however, a stiff
ventricle will achieve a smaller end-diastolic volume (thus a shorter end-dias-
tolic fibre length) at any given end-diastolic pressure. This has to be borne in
mind when interpreting the results of cardiac catheterization: the assumption
that left ventricular end-diastolic pressure (estimated from the
pulmonary artery occlusion pressure) corresponds to left ventricularend-diastolic volume only applies provided that left ventricular
compliance remains unaltered.
Volatile anaesthetics decrease left ventricular compliance to various
degrees, and this may be the basis for the extent to which they depress
myocardial function.
The left ventricle maintains flow in the systemic circulation. It is a high-
pressure system and, therefore, the left ventricle is thick walled.
The right ventricle and pulmonary circulation are a low-pressuresystem; the filling pressure is about 5 mmHg, and the systolic pressure about
20 mmHg. The ventricle is much more compliant than the left ventricle and
thus can match left ventricular output at low pressures.
Cardiac cycle: pressure–volumerelationships

115
3a
Figure 90. Left ventricular compliance curves
Cardiac cycle: pressure–volum
e relationships

116
3a
Part 3a
Generated pressure – stroke volume
During the isometric phase of the systole, tension (force) develops in the
muscle fibre, which in the next phase relates to the force of contraction. This
tension is translated into a sharp rise in ventricular pressure. Ventricular
volume during this phase remains essentially constant.
During the isotonic phase of systole, cardiac muscle contracts and blood
is forced out of the ventricle. Ventricular pressure during this phase remains
unaltered; it is the driving pressure for aortic blood flow. During diastole,
ventricular pressure rapidly decreases and it remains practically unaltered
during the filling.
The generated pressure–ventricular volume relationship therefore
follows a loop, the area of which corresponds to the amount of cardiacwork – it is the product of pressure and volume (see the chapter on simple
mechanics). Ventricular volume corresponds to an extent to the muscle fibre
length, and ventricular pressure to the force generated (compare figures
87–89). Figure 91 shows this relationship for different states of contractility. A
normal ventricular outflow tract is assumed (the force of contraction is then
interchangeable with ventricular pressure). The starting point is ED, the end-
diastolic pressure and volume. The isometric and isotonic phases follow in
the direction of the arrows to the end-systolic point (ES), and the loop then
returns to the end-diastolic point as shown by the arrows. The area of the
loop is rectangular and roughly the same for different states of contractility,
but its shape differs: a heart that beats effectively achieves a good stroke
volume for a modest generated pressure. The failing heart compared with the
normal heart does a similar amount of work but less effectively, i.e. it has to
develop a greater force and a greater pressure, but ejects less per beat; it also
operates at higher pressures. Because of the need for more force to eject,
failure is perpetuated. With increased sympathetic drive the heart operates on
the steeper cardiac performance curve; less force is needed to do the same
amount of work and stroke volume is high for a small amount of generated
pressure.

117
3a
Figure 91. Cardiac work during one cycle as a product of pressure and volume
Cardiac cycle: pressure–volum
e relationships
a)
b)
c)

118
3a
Part 3a Following blood loss, the body draws on its reserves to maintain blood flow
and oxygen delivery to the tissues. Initially, water is retained by the kidney
and extracellular fluid is drawn into the intravascular compartment. If blood
loss continues, physiological compensatory mechanisms bring about changes
in other physiological parameters to maintain blood flow to the tissues, and in
a more severe haemorrhage to the vital organs only. Haemorrhage is classified
into four degrees of severity:
• Class I: � 15% or � 750 ml blood loss. Stroke volume may fall minimally
at lower levels of loss, resulting in a minimal tachycardia to maintain cardiac
output. This is the situation induced by venesection in a blood donor.
• Class II: 15–30% or 750–1500 ml blood loss. Tachycardia is noticeable
while systolic blood pressure is still maintained; diastolic pressure,
however, rises due to the higher level of circulating catecholamines. Mean
blood pressure is maintained but flow to the organs without autoregulation
of blood flow is reduced (e.g. muscle, skin). Because of the reduced skin
blood flow, core-to-skin temperature difference starts to rise. Renal blood
flow is minimally affected and urine output is maintained at a physiological
minimum. Cerebral blood flow is maintained due to autoregulation but
anxiety due to the circulating catecholamines is evident.
• Class III: 30–40% or 1500–2000 ml blood loss. The compensatory
mechanisms are being exhausted and circulatory failure starts to develop.
Tachycardia is marked and there is a measurable fall in systolic blood
pressure. Tachypnoea is present due to reduced O2
delivery to the tissues.
Urine output decreases significantly, core-to-skin temperature difference
increases further and mental changes are pronounced.
• Class IV: � 40% or � 2000 ml blood loss results in circulatory failure,
with compromised blood flow even to vital organs. Tachycardia is very
high, systolic blood pressure markedly depressed, while diastolic pressure
is still high; thus pulse pressure is very narrow. Urine output is negligible
or zero, and if mean pressure falls below the autoregulatory level of the
brain, the level of consciousness may be depressed. The skin feels cold
because of vasoconstriction. Blood lactate, not shown in figure 91, is
significantly increased. Loss of � 50% or � 2500 ml blood results in loss
of consciousness and total circulatory failure.
Only some measurable physiological parameters are depicted in figure 92;
other changes such as skin colour and sweating are important in the evalu-
ation of blood loss.
Blood pressure and blood volumerelationship

119
3a
Figure 92. Changes in physiological parameters with blood loss (classes ofhaemorrhage)
Blood pressure and blood volume relationship

120
3a
Part 3a
Normal cerebral blood flow is 54 ml/100g/min (750 ml/min). The formula
for flow indicates that flow is given by the ratio of pressure gradient (in this
case cerebral perfusion pressure, which is the difference between mean
arterial pressure and intracranial pressure), and resistance
Q = ∆p/R = �MAP
R
– ICP�. (1)
Autoregulation exists to maintain, within physiological limits, a constant
blood flow to the brain regardless of variations in arterial blood pressure and
intracranial pressure; this is done by changes in cerebrovascular resistance, or by
changing the perfusion pressure. As shown below, these factors are interrelated.
• Mean arterial pressure: Figure 93 shows how autoregulation maintains
within physiological limits (normally 60–160 mmHg) constant cerebral
blood flow. This is affected by changes in cerebral vascular resistance (see
below). In chronic hypertension (or hypotension), the autoregulatory
limits are moved up or down respectively. Outside the autoregulatory
limits cerebral blood flow is pressure-dependent. When cerebral
perfusion pressure is low due to high intracranial pressure (> 25–30
mmHg), baroreceptor stimulation produces systemic hypertension and
cardioinhibitory centre stimulation produces reflex bradycardia
(Cushing’s reflex).
• Intracranial pressure: the relationship between intracranial fluid
volume and pressure is shown in figure 94 – cerebral elastance (or
‘stiffness’), defined as ∆p/∆V. Since the intracranial pressure is the
dependent variable, it is logical to plot the pressure on the y-axis, and to
use the term ‘elastance’ in this context. Elastance is the inverse of
cerebral compliance, which is defined as ∆V/∆p. In the graph elastance
is given by the slope of the curve at any point, as shown. The skull is a
rigid container filled with brain, cerebrospinal fluid and blood. As fluid is
essentially incompressible, any increment in cerebral volume (e.g. in
cerebral oedema) must be matched by a corresponding decrease of one of
the other fluid components; cerebrospinal fluid can be to a certain extent
pushed out of the foramen magnum, and venous blood is propelled out
as the veins are compressed inside the skull. Since venous blood pressure
is one of the components of intracranial pressure, a fall in the former (as
venous blood is squeezed out) is accompanied by a fall in the latter. Thus,
initially, a small increase in cerebral volume can be accommodated
without a significant rise in intracranial pressure. When the compensatory
limits are over stretched or lost, any small increment of cerebral volume
(e.g. cough, drug or hypercarbia-induced vasodilatation) will be reflected
in a steep rise in intracranial pressure, with a detrimental effect on
cerebral blood flow.
Cerebral blood flow

121
3a
Figure 93. Cerebrovascular autoregulation
Figure 94. Cerebral elastance curve
Cerebral blood flow

122
3a
Part 3a
• Cerebrovascular resistance: the matching of cerebrovascular resistance
to cerebral perfusion pressure is the basis of autoregulation of cerebral
blood flow. The factors determining cerebrovascular resistance are:
1. Partial pressure of CO2: cerebral arteriolar resistance is under the direct
influence of local pCO2
across a wide physiological range. Vasodilatation
under normal intracranial pressure conditions results in a higher blood flow;
this is partly the mechanism of autoregulation: if cerebral blood flow is
reduced or if the cerebral metabolic rate is high, cerebral pCO2
rises and pH
falls, leading to vasodilatation and restoration of blood flow. In head injury, a
mild degree of hypocapnia is preferable when ventilation is controlled under
anaesthesia, provided blood pressure is maintained: intracranial pressure will
fall as a result of venoconstriction and cerebral blood flow will improve.
Very low levels of pCO2
(< 3.4 kPa) lead to symptomatic cerebral ischaemia.
Hypercapnia abolishes cerebrovascular autoregulation: cerebral blood flow is
then directly proportional to mean arterial blood pressure, (as shown in
Figure 95). Conversely, cerebrovascular response to CO2
is blood pressure-
dependent: in severe hypotension cerebral blood flow does not change with
changes in CO2
tension, as shown in figure 96.
2. Oxygen partial pressure in the major cerebral arteries plays a role
outside the physiological range; global cerebral blood flow only starts to
rise when hypoxia is already significant. At the tissue level, however, O2
partial pressure is probably the mechanism regulating local or regional
blood flow in response to hypotension: reduced local blood flow with
resulting tissue hypoxia produces immediate arteriolar vasodilatation.
High levels of pO2
are associated with a mild degree of vasoconstriction,
i.e. reduced cerebral blood flow (as shown in figure 96).
3. Hydrogen ion concentration: the effect is similar to, but independent
of, pCO2; the hydrogen ion is the mediator of flow metabolism coupling
but it is not involved in the response to hypotension.
4. Blood viscosity influences vascular resistance as shown in the
Hagen–Poiseuille formula (see above). The higher flow in haemodilution
compensates (in part only) for otherwise reduced O2
delivery due to the
reduced haemoglobin concentration. This mechanism applies in cerebral
circulation as in any other part of the body.
5. Neurogenic and myogenic control: apart from the humoral factors,
the cerebrovascular tone is under sympathetic nervous control, and the
autoregulation curve is shifted to the left or right according to the
sympathetic tone. Myogenic response (increased tension in response to
increased stretch) probably plays a part similar to other parts of the body.
In head injury, autoregulation is lost and the intracranial pressure may be
elevated due to the presence of haematoma, cerebral oedema or both.
Ventilation may be depressed with resulting hypercapnia: cerebral blood flow is
then pressure-dependent. To prevent secondary brain injury, ventilation must
be controlled and an adequate O2
delivery to the brain ensured. A cerebral
perfusion pressure > 60 mmHg is thought to provide adequate flow. From
formula 1 it is then obvious that the desired mean arterial pressure must be kept
at a level calculated as the sum of intracranial pressure + 60 mmHg.

123
3a
Figure 96. Cerebral blood flow as a function of arterial carbon dioxide tension (PaCO2)and oxygen tension (PaO2)
Figure 95. Autoregulation of cerebral blood flow within physiological limits; it isabolished by hypercapnia
Cerebral blood flow
Myocardial blood flow is 200 ml/min, or 4% of cardiac output, for an organ
weighing only 0.4% of body weight. Oxygen consumption of the heart is also
high, 23 ml/min, or 9% of total. This is for a good reason: the heart is a pump
that perfuses the rest of the body; its work is hard and it needs a constant
energy supply from aerobic metabolism.
The coronary arteries are the first to receive oxygenated blood from the
aorta; their perfusion depends on the pressure gradient generated bythe heart. It is important to remember that coronary arteries run on the
epicardial surface. The coronary arterial pressure gradient is thus from
epicardium to endocardium, while the intramural pressure gradient during
systole is in the opposite direction. Therefore, there is practically no endo-
cardial flow during systole (see figure 97 where coronary artery flow is
plotted against the arterial pressure waveform) while the flow in epicardium
is maintained. To compensate for the lack of perfusion in systole the suben-
docardial arteries are thought to be in a chronic state of dilation during
diastole. At times of increased demand for perfusion, e.g. tachycardia, hyper-
tension, this region is then unable to increase flow further and thus it is more
susceptible to ischaemia.
Autoregulation
Unlike the brain, which at times of need receives a higher perfusion pressure
via baroreceptor stimulation, the heart cannot effectively increase its oxygen
flow by increasing its perfusion pressure since the heart generates the
pressure: myocardial oxygen consumption rises proportionately with
myocardial work. The heart, therefore, regulates its perfusion only via
changes in coronary artery resistance. The oxygen tension in the myocardium
or a related parameter is the governing factor. Autoregulation maintains a
constant blood flow in the coronary circulation within a wide range of pres-
sures, 60–140 mmHg (see figure 98). It must be kept in mind that the aortic
diastolic pressure (not the mean arterial pressure) is the coronary perfusion
pressure.
The sympathetic and parasympathetic nervous system affects the
coronary vascular resistance, but this is modified by autoregulation: �-adren-
ergic stimulation produces coronary vasoconstriction but if coronary blood
flow is compromised autoregulation results in vasodilatation.
Parasympathetic stimulation, if unopposed, results in bradycardia. The
accompanying fall in oxygen demand produces vasoconstriction; however, if
a fast heart rate is maintained, vasodilatation prevails.
124
3a
Part 3a
Coronary circulation

125
3a
Figure 97. Coronary artery flow and arterial blood pressure
Figure 98. Coronary autoregulation
Coronary circulation

Anaesthetic agents depress myocardial performance and oxygen
consumption falls in line with reduced myocardial work (see figure 99).
Coronary blood flow therefore is reduced.
Myocardial ischaemia occurs when myocardial oxygen demand exceeds
supply, i.e. when coronary blood flow and oxygen flow fall below the
minimum required. In a diseased myocardium symptoms of ischaemia occur
at a higher perfusion pressure, inside the lower limit of autoregulation. The
prediction of cardiac events during anaesthesia is difficult but prevention
should be practised: cardiac performance (power) is the product of mean
arterial blood pressure and cardiac output. The output is the product of
stroke volume and heart rate. Stroke volume is not easily assessed by bedside
(or operating tableside) measurements but heart rate and blood pressure are
monitored. Thus the rate–pressure product remains a useful clinical tool
when estimating myocardial oxygen demand, and therapeutic manoeuvres
can be directed at optimizing myocardial performance to maintain oxygen
flow to the systemic circulation (which requires adequate cardiac output and
haemoglobin concentration) while not overloading the heart by excessive
pressures and rates.
126
3a
Part 3a

127
3a
Figure 99. Effect of inhalational anaesthesia with halothane on coronary blood flowand myocardial oxygen consumption
Coronary circulation
