physiological characteristics of fungi …
TRANSCRIPT

PHYSIOLOGICAL CHARACTERISTICS OF FUNGI ASSOCIATED WITH
ANTARCTIC ENVIRONMENTS
by
Priyanka Sushil Kudalkar
A thesis submitted in partial fulfillment
of the requirements for the degree
of
Master of Science
in
Land Resources and Environmental Sciences
MONTANA STATE UNIVERSITY
Bozeman, Montana
April 2016

©COPYRIGHT
by
Priyanka Sushil Kudalkar
2016
All Rights Reserved

ii
DEDICATION
To my dearest Manjiri, Mumma and Pappa, for always believing in me and letting me
follow my dreams.

iii
ACKNOWLEDGEMENTS
First and foremost, I would like to thank my academic advisor Dr. John Priscu,
for accepting me as a graduate student and guiding me through research and thesis work.
Without his valuable guidance, feedback, and unending patience, this project would not
have been possible. I would also like to convey my deepest thanks to my committee
members, Dr. Cathy Cripps and Dr. Gary Strobel for serving on my committee and for
providing me with their valuable inputs. They both have been instrumental in amplifying
my interest in Science since my undergraduate research and have always strived to make
research a wonderful learning experience for all their students. I am grateful to Dr. Lillian
Lin and Christopher Barbour from the Statistical Consulting and Research Service for
providing statistical advice and R code. Thanks to Edward Barge for generously helping
me with the initial DNA sequencing of my samples. I would like to thank my labmates
for all their help, friendship and advice. My sincere appreciation to Dr. Cathy Cripps and
Trista Vick- Majors for providing valuable feedback during earlier iterations of this
thesis. I would also like to thank all my friends from India and Bozeman who have
played such an important role in making sure that I was not alone during this process.
Last but certainly not least, I would like to thank my family for their unconditional love
and support. I would not have come this far without all of you. Thanks to my dearest
cousins, Gurudatta, Amruta and Aditya for the endless laughs during stressful times.
Thank you, Neeraj Gurdasani for always being such a positive influence. My research
was funded by the NSF- PLR grants to J. Priscu. I greatly acknowledge the teaching
assistantship I received from Department of Ecology at Montana State University.

iv
TABLE OF CONTENTS
1. INTRODUCTION .......................................................................................................... 1
Background: The McMurdo Dry Valleys, Antarctica .................................................... 1
Ice-covered Lakes ........................................................................................................... 1
Subglacial Lakes ............................................................................................................. 3
Overview of Antarctic Fungi .......................................................................................... 4
Diversity of Fungi in Icy Ecosystems ............................................................................ 6
Role of Fungi in Icy Ecosystems .................................................................................... 7
2. MATERIAL AND METHODS ...................................................................................... 9
Study Sites ...................................................................................................................... 9
Sample Collection and Processing ............................................................................... 10
Fungal Culturing ........................................................................................................... 11
Microscopic Observations ............................................................................................ 12
DNA Extraction ............................................................................................................ 12
PCR Amplification of the ITS Region ......................................................................... 13
Visualization, Purification and Quantification of PCR Products ................................. 14
DNA Sequencing .......................................................................................................... 14
Temperature Experiments ............................................................................................ 15
Test Organisms to Profile Bioactivity: Fungi and Bacteria ......................................... 16
Bioactivity Profiling Test Organisms ........................................................................... 16
Dual Culture Assay ............................................................................................... 17
Test for Volatile Antimicrobials ........................................................................... 18
Measuring Substrate Utilization Using BIOLOG Plate Assay .................................... 20
Statistical Analyses ....................................................................................................... 22
3. HYPOTHESES ............................................................................................................. 24
4. RESULTS ..................................................................................................................... 26
Isolation, Culturing, and Taxonomic Identification ..................................................... 26
Morphological Description Using Microscopic Observations ..................................... 28
Temperature Experiments ............................................................................................ 32
Biological Effects of Fungal Isolates on Test Organisms ............................................ 36
Dual Culture Assay ............................................................................................... 36
Test for Volatile Organic Compounds .................................................................. 37
Substrate Profiling ........................................................................................................ 38

v
TABLE OF CONTENTS - CONTINUED
5. DISCUSSION ............................................................................................................... 47
Diversity of Fungal Isolates from AntarcticLake Ice
and Subglacial Sediments ............................................................................................. 47
Growth Temperature Preference of Fungal Isolates ..................................................... 50
Biological Inhibition of Fungi by Antarctic Fungal Isolates ........................................ 52
Carbon Substrate Utilization Using Biolog Assay ....................................................... 53
Conclusions .................................................................................................................. 54
REFERENCES CITED ..................................................................................................... 57
APPENDICES .................................................................................................................. 68
APPENDIX A: Growth of Fungal Isolates .................................................................. 69
APPENDIX B: Carbon Guilds Present in Biolog Plates ............................................. 71
APPENDIX C: Heat Maps Of Fungal Isolates ............................................................ 77

vi
LIST OF TABLES
Table Page
1. Summary of Fungal Sequences from BLAST Search
of GenBank . . . . . . . . . . . . . . . . . . . . . . . . . . . . . . . . . . . . . . . . . . . . . . . . . . .26
2. Q10 Values of Isolates . . . . . . . . . . . . . . . . . . . . . . . . . . . . . . . . . . . . . . . . . 34
3. Effects of Bioactive Compounds on Pathogens. . . . . . . . . . . . . . . . . . . . . . . 36
4. ANOVA Showing Transformed Response. . . . . . . . . . . . . . . . . . . . . . . . . . 38
5. ANOVA for Interactions Between Temperature and Isolate,
and Temperature and Group . . . . . . . . . . . . . . . . . . . . . . . . . . . . . . . . . . . . . .39

vii
LIST OF FIGURES
Figure Page
1. Conceptual Model Depicting the Dynamic Equilibrium
of Sediment Inclusions in Antarctic Lake Ice.. .................................................... 2
2. Conceptual Model Depicting the Location of Sediments
in Subglacial Lake Whillans. ............................................................................... 4
3. Maps showing the Locations of Lake Bonney, Lake Chad
in Taylor Valley (TV), and Subglacial Lake Whillans
in West Antarctica. ............................................................................................ 10
4. Bioactivity Test: Petri Plate Assay ..................................................................... 18
5. Bioactivity Test: Gas Assay ............................................................................... 19
6. Petri Plates Supporting The Growth of Mycelial Colonies ................................ 26
7. Phylogenetic Tree showing the Relationship of
T. ellipsoideum to Reference Taxa .................................................................... 29
8. Phylogenetic Tree showing the Relationship of
L. hoffmannii to Reference Taxa....................................................................... 30
9. Effect of Temperature on Growth Rates of Mucor sp. ....................................... 33
10. Effect of Temperature on Growth Rates of
Lecythophora hoffmannii. .................................................................................. 34
11. Effect of Temperature on Growth Rates of
Unidentified Ascomycota. .................................................................................. 34
12. Effect of Temperature on Growth Rates of
Tetracladium ellipsoideum................................................................................. 35
13. Carbon Substrate Utilization by all Four Isolates at 4°C.. ............................... 41
14. Carbon Substrate Utilization by all Four Isolates at 24°C.. ............................. 42

viii
LIST OF FIGURES- CONTINUED
Figure Page
15. Effect of Temperatures on the Growth of Isolates.. ......................................... 43
16. Effect of Temperatures on the Carbon Guild Utilization
by the Four Fungal Isolates…………………………………………………...45

ix
ABSTRACT
The permanent ice covers on the lakes of Antarctica’s McMurdo Dry Valleys
region harbor a diverse group of phototrophic and heterotrophic microorganisms that
metabolize during the short summer months when solar radiation produces melt
inclusions within the ice and provides energy to drive photosynthesis. Laboratory cultures
of fungi were obtained from ice cores taken from Lakes Bonney (east lobe) and Chad,
and sediments collected from Subglacial Lake Whillans (West Antarctica). Using
molecular techniques, the internal transcribed spacer (ITS) region of the ribosomal DNA
(rDNA) was sequenced to identify fungal types and to determine whether they may be
unique to this region. Four axenic fungal cultures, Tetracladium ellipsoideum,
Lecythophora hoffmannii, Mucor sp., and an unidentified Ascomycota were successfully
isolated. These isolates are closely related to organisms that have been previously
reported in Antarctica and other cold habitats. The isolates were tested for growth
characteristics under various temperature and nutrient regimes. Temperature response
experiments revealed that all the isolated fungi were psychrotolerant and growth rates
were greatest at 25°C. Of major significance in evaluating the potential of Antarctic fungi
as a bioresource is their ability to produce bioactive compounds. Two out of four isolated
organisms exhibited antimicrobial activity against several plant pathogens. The metabolic
potential and preferred substrate utilization was examined by exposing fungal isolates to
a variety of substrates in a 96 well “Biolog” plate. A strong correlation was found among
substrate utilization, isolates, temperature and the different carbon substrates. This
experiment revealed that the isolated fungi have preferences for different labile carbon
substrates at 4°C and 24°C which may imply different physiologies at different times of
year in the lake ice-covers. Results from my studies will help understand the role of fungi
in lake ice and subglacial lake sediment ecosystems, and the physiology of fungi living in
cold environments.

1
INTRODUCTION
Background: The McMurdo Dry Valleys, Antarctica
The McMurdo Dry Valleys region (MDV) located in southern Victoria Land,
Antarctica represents some of the most extreme microbial habitats present on the planet
(Priscu et al., 1998). The MDV is the largest (~4800 km2) ice free area on the continent
of Antarctica (Levy, 2012) and is comprised of dry soils, ephemeral glaciers, streams and
perennially ice-covered lakes (Moorhead & Priscu, 1998; Priscu et al., 1998). In winter, it
experiences sub-zero temperatures ranging from near -20°C to -50°C (Doran et al., 2002)
and low snowfall less than 50 mm (water equivalent) per year (Fountain et al., 2010)
making the MDV region one of the driest and coldest deserts on Earth.
Ice-covered Lakes
There are more than 20 perennially ice-covered lakes and ponds in the MDV’s
(Doran et al., 1994; McKay et al., 1985) that are distinct in their physical parameters in
terms of elevation, depth, lake and drainage type, and salinity (Doran 1994, and
references therein). The thickness of the ice cover in the larger lakes is typically 3 to 6 m
(Priscu et al., 1998) and limits the amount of light that that penetrates the water column
(Palmisano & Simmons, 1987; Wharton et al., 1989; Lizotte and Priscu, 1992). The ice
cover also limits gas exchange between the atmosphere and water column ( Priscu et al.,
1996; Wharton, et al., 1986) thus reducing the interaction between the surrounding
atmosphere and the lake system. The ice cover represents a dynamic equilibrium between

2
the upward movement of ice due to ablation losses at the ice surface and new ice
formation at the bottom, caused by seasonal freezing of lake water (Priscu et al. 1998)
(Figure 1).
Figure 1. Conceptual model depicting the dynamic equilibrium of sediment inclusions in
Antarctic lake ice. Modified from “Permanent Ice Covers of the McMurdo Dry Valley
Lakes. Antarctica: Liquid Water Contents,” by Fritsen, C. H., Adams, E. E., McKay, C.
P. (1998).
The strong and persistent katabatic winds arising from the Polar Plateau result in
aeolian deposition of sediments (sand and gravel) on the surface of the permanent ice
covers (Fritsen et al., 1998; Šabacká et al., 2012). For about 9 months of the year, solar
energy is inadequate to melt these sediments down into the ice (Fritsen et al., 1998).
However during the austral summer, these dark sediments absorb solar radiation which

3
allows them to melt (Jepsen et al., 2010) eventually reaching a depth where solar
radiation can no longer supply adequate energy to generate melt (Priscu et al., 2005). The
downward movement of sediments from summer melting is balanced by the upward
movement of the ice cover that results from the winter freeze-on of new ice at the bottom
of the ice cover. The balance between downward melt and upward movement caused by
new ice formation at the bottom results in a dynamic equilibrium where the sediment
aggregates accumulate at a depth of ~ 2 m in the ice (Fritsen et al., 1998; Jepsen et al.,
2010).
Subglacial Lakes
The subglacial lakes that were first speculated to exist in the 1960s (Robinson
1964) are another underexplored component of the microbial habitat. These subglacial
lakes are located hundreds to thousands of meters beneath the surface of the ice sheet
(Dowdeswell & Siegert, 2003). Currently, 379 perennial subglacial lakes have been
identified beneath the Antarctic ice sheets (Wright & Siegert, 2012). I obtained samples
of benthic sediments from Subglacial Lake Whillans (SLW), which lies 800 m beneath
the surface of the Whillans Ice Stream in West Antarctica (Figure 2). SLW has recently
been shown to harbor an active microbial ecosystem (Christner et al., 2014) that has been
isolated from the atmosphere for many thousands of years (Priscu et al., 2010).

4
Figure 2. Conceptual model depicting the location of sediments in Subglacial Lake
Whillans. Modified from www.antarcticglaciers.org/modern-glaciers/subglacial-lakes.
Overview of Antarctic Fungi
Lakes of the MDVs have been the focus of intensive studies on phytoplankton,
Bacteria, and Archaea investigated primarily for the presence of bacteria and Archaea
(Vick & Priscu, 2012), with little attention given to fungi (Broady & Weinstein, 1998;
Ma et al., 1999). Although Antarctic fungi occupy various ecological niches, their
significance in terms of physiology and ecosystem processes is not fully understood
(Bridge & Spooner, 2012). After decades of investigations, it has been possible to at least
partially identify the diversity of fungi for continental Antarctica which includes species
belonging to phyla Chytridiomycota, Ascomycota, Zygomycota and Basidiomycota
(Onofri et al., 2005; Onofri et al., 2006). A higher diversity of fungal species are recorded
from maritime and sub Antarctic terrestrial habitats, mostly associated with particular

5
substrates such as mosses, mud, algae, microbial mats, rocks, lichens, lake sediments,
glaciers, soil, and animals and bird droppings. In Continental Antarctica, around 250
fungal species have been reported, primarily anamorphic Ascomycota and Basidiomycota
yeasts from terrestrial habitats (Onofri et al, 2007).
According to Vishniac (1996), fungi are low in abundance and widely spread
across Antarctica. Research conducted by Connell et al. (2006) on the distribution and
abundance of fungi present in the soils of MDV showed that filamentous fungi are most
closely tied to habitats with a higher pH and soil moisture. These close associations were
not observed for yeast and yeast-like fungi, demonstrating that the yeast-like fungi utilize
a broader range of habitats. Fungi have been identified from a wide range of Antarctic
habitats including cryptoendolothic (inside rock) communities at high elevations in
Victoria Land to sub-Antarctic soils (Vishniac, 1996). An early study found 27
filamentous species comprising 17 genera in air and soil samples taken from different
locations around Antarctica, particularly near the established campsites (Sun et al., 1978).
Several mycorrhizal fungal species associated with mosses and liverworts have been
found in Victoria Land (Tosi et al., 2002; Williams et al., 1994). Additionally, species of
Cadophora that decay (soft rot) artifacts and wooden structures were found in the historic
huts on Ross Island in Southern Victoria Land (Blanchette et al., 2004). According to
Tosi et al. (2001), most of the yeasts and filamentous fungi reported are cosmopolitan
species, but some are indigenous. The presence of cosmopolitan fungal species is likely a
result of propagules transported to Antarctica; they have been isolated from the areas
associated with human activity and from lakes of MDV (Baublis et al., 1991).

6
In the MDVs, many studies have focused on cryptoendolithic fungi that occur in
microbial communities within rocks (Selbmann et al., 2005). These particular
communities are thought to be the most psychrotolerant microorganisms on earth;
therefore, they have been proposed as a model group of organisms for exobiological
investigations (Onofri et al., 2004).
Diversity of Fungi in Icy Ecosystems
Icy ecosystems are defined as environments containing ice or snow crystals as a
characteristic component that is in contact with liquid water, or liquid water in a
supercooled state (Psenner et al., 2003). Icy ecosystems are present at altitudes and
latitudes that experience permanent or seasonal existence of snow or ice (Psenner et al.,
2003). Ma et al. (2000) and Taylor et al. (1997) detected and characterized fungi
entrapped in glacial ice from Greenland. This work has been further extended to fungal
recovery in Antarctic ice, demonstrating that most of the fungi recovered were similar to
contemporary fungi and revealing the presence of a higher number of ascomycetes than
basidiomycetes (Patel, 2006). Fungi have been reported from ancient glacial layers of
Lake Vostok core where fungal mycelia and yeasts of genus Rhodotorula and
Cryptococcus were identified using molecular methods (Abyzov et al., 2004). Fungi have
been isolated and characterized from Lake Vostok accretion and glacial ice; a total of 270
fungal colonies were cultured from the accretion ice and 14 from the glacial ice present
immediately above the accretion ice (Elia et al., 2009). The length of isolation from the
atmosphere and the extreme conditions make results from this study interesting. Similar

7
studies have reported the presence of fungi in Lake Vostok accretion ice (Poglazova et
al., 2001). While there are numerous studies on fungi in the lake water column, glaciers,
and accretion ice, only Mosier et al., (2007) reported a diverse range of Eukarya present
at all depths in the ~20 thick ice cover of Lake Vida in the MDV.
Role of Fungi in Icy Ecosystems
Fungi are regarded as one of the most diverse, resilient, and vital kingdoms of
eukaryotes. They are major contributors to biodiversity and greatly influence the
biogeochemical processes in many ecosystems. Some fungi can be mediators of primary
production and are mutually symbiotic in nature (Dighton, 2003) and others are important
decomposers and pathogens. Fungi can also greatly influence the dynamics of icy
ecosystems (Godinho et al., 2013) by providing important ecosystem services, such as
mineralization, nutrient immobilization and decomposition of organic matter (Cantrell et
al., 2011). Therefore factors that affect the activity of these fungi consequently affect the
entire ecosystem (Kerry, 1990).
Some Antarctic fungi have shown resistance to low temperatures, high UV and IR
radiation, (Ruisi et al., 2007) and high salinity (Gunde-Cimerman et al., 2003). Several
physiological survival mechanisms for withstanding freezing in fungi have been reported,
and it is possible that Antarctic fungi employ a combination of strategies such as
antifreeze production, anoxia tolerance, and high super cooling activity to survive
(Robinson, 2001).

8
Fungi recovered from the permanently ice covered lakes ice of the MDVs have
over time developed mechanisms to withstand the harsh environment and low nutrient
availability (Onofri et al., 2007). A majority of microorganisms found in Antarctica are
psychrotolerant (Azmi & Seppelt, 1997; Kerry, 1990; Zucconi et al., 1996). The optimum
temperatures for growth of psychrotolerant organisms are typically between 20°C and
40°C but they are also capable of growth at 0°C. Some fungi are true psychrophiles and
these do not grow when exposed to temperatures above 20°C and exhibit an optimum
growth temperature (OGT) of ≤ 15°C and maximum growth temperature (MGT) of ≤
20°C (Morita, 1975; Wang et al., 2015). In the studies conducted by Kerry (1990) on
leaves and soil samples collected from subantarctic Macquarie Island and Australia’s
Casey Station, respectively, it was observed that temperature affected the rate at which
fungal spores germinated and also the rate at which mycelium grows.
The potential of extremophilic fungi as a bioresource is not well known, although
they have been researched for anti-freeze compounds (Tsuji et al., 2013). However, fungi
are also capable of producing a wide spectrum of other complex molecules, including
volatile organic compounds (VOCs) that belong to different chemical classes like
alcohols, ketones, aldehydes, benzene and naphthalene derivatives and terpenoids (Mends
et al., 2012; Strobel et al., 2008; Tomsheck et al., 2010; Ul-Hassan et al., 2012). These
gaseous compounds can possess specific or non-specific antimicrobial activities that are
capable of killing or inhibiting microorganisms (Ul-Hassan et al., 2012b; Wheatley,
2002).

9
MATERIAL AND METHODS
Study Sites
I isolated and studied fungi collected from two different regions in Antarctica.
The MDV region is an ice-free polar desert in Antarctica with a combined area of
approximately 4800 km2 making it the largest ice-free area on the continent (Levy, 2012).
The Taylor Valley (TV) located at 77° 45’ – 77° 30’ S– 163°40’ E, lies in the middle of
the MDVs (Figure 3). There are four main lakes in TV, the east and west Lobes of Lake
Bonney, Fryxell and Hoare, along with other smaller lakes and ponds. The samples for
the study were retrieved from east lobe Bonney (ELB) and Lake Chad, one of the smaller
lakes. Lake Bonney is a narrow lake (7 km long) located at the head of Taylor Valley,
southern Victoria Land, Antarctica (77° 43’ S, 162° 23’ E) and has a perennial ice cover
with a thickness of approximately 4m. The ice thickness varies spatially and seasonally
from ~3.5 m to ~ 4.5 m (Fritsen et al., 1998; Priscu et al., 1998)
The other study site was Subglacial Lake Whillans (SLW) that lies 800 m beneath
the surface of the Whillans Ice Stream in West Antarctica (84.240 °S, 153.694 °W). SLW
had a shallow water column at the time of sampling (~2 m deep; Christner et al., 2014)
and is considered to be an ‘active’ lake that drains and refills regularly (Fricker et al.,
2007). The surficial sediments of SLW contain active microorganisms that are
phylogenetically distinct from the water column and drilling water (Christner et al., 2014)

10
Figure 3. Map showing the location of Lake Bonney and Lake Chad in the Taylor Valley
(TV) (Blue star = TV, 77° 43’S, 162° 23’E) and Subglacial Lake Whillans (Orange star =
SLW, 84.237°S, 153.614°W) in West Antarctica.
Sample Collection and Processing
The sediment sample from Subglacial Lake Whillans (SLW) was collected in
January 2013 using a microbiologically clean, hot water drilling system that created a
~0.6 m diameter borehole through the West Antarctic Ice Sheet (WAIS) above SLW and
frozen immediately until further processing (Priscu et al., 2013; Tulaczyk et al., 2014).
The ice core samples were collected during the 2012-2013 summer season from the
permanent ice covers of ELB and Lake Chad in the McMurdo Dry Valleys (Figure 3).
The ice cores were collected from 0.5- 2m depths using a SIPRE coring device which is
3-inch in diameter and is equipped with a Badger power head. The ice cores were placed
into clean polyethylene bags, kept frozen (-20°C) and shipped via a sea going vessel to
the United States, then over land to Montana State University. On arrival, they were
placed in a -20°C freezer until processing. Contaminants originating from sources like

11
drilling, handling, transporting, storage and processing are always present on the outside
of the ice core sections (Castello & Rogers, 2005), so ice cores were decontaminated in a
cold clean room prior to processing. The ice cores were warmed at 4°C in the Cold Clean
Room for at least an hour before starting the decontamination protocol. Surface
sterilization of ice cores was carried out following the protocol developed by Christener
et.al (2005) where scraped ice samples were cut using a band saw, and then transferred
into a sterile funnel and thoroughly washed with 95% autoclaved ethanol and rinsed with
MilliQ water inside a sterile Class II hood of a biologically-clean environment (Christner
et al., 2005). Following surface sterilization, another ~5 mm layer of the ice core was
removed using a band saw. Four agar plates containing potato dextrose agar, nutrient
agar, yeast peptone dextrose agar and yeast extract agar were placed in the laminar flow
hood as controls to monitor the air quality inside of the laminar flow hood during ice core
handling. The ice cores were positioned on a sterile glass funnel and melted at room
temperature (24°C) with controls set up alongside. The meltwater corresponding to the
outer portion and sequentially interior portion of the ice core was collected. This
meltwater along with the sedimentary inclusions were used to carry out culturing,
microscopic and molecular studies.
Fungal Culturing
Lake ice sediments and meltwater were plated on a variety of agars, including
potato dextrose agar (0.4% potato starch, 2% dextrose, 1.5% agar [pH 5.6]), nutrient agar
(0.3% beef extract, 0.5% peptone, 1.5% agar [pH 6.8]), yeast extract agar (3% yeast

12
extract, 3% malt extract, 0.5% peptone, 1% dextrose, 2% agar [pH 6.2]) and yeast
peptone dextrose agar (2% yeast extract, 3% peptone, 1% dextrose. 2% agar [pH 6.5]. All
the media components were obtained from Difco, USA. In order to suppress bacterial
growth, 0.25 mg ml-1 chloramphenicol and 0.1 mg ml-1ampicillin antibiotics were added
to the agar after autoclaving. The plates were incubated under ambient light at 24°C.
During storage, the plates were examined every 24 hours for growth and bacterial
contamination. The fungal isolates were preserved for the long-term at -80°C in cryovials
with sterile 15% glycerol.
Microscopic Observations
Slides of each isolate prepared by mounting fungal hyphae in methylene blue
were examined under a light microscope (Zeiss). In some cases, the fungal material was
also stained using Calcoflour White Stain and observed under UV light to highlight chitin
cell walls.
DNA Extraction
A pure culture of each isolate, grown on PDA, was used as a source of DNA after
incubation at 25°C. Squares of the cultured mycelia (0.5cm2, approximately 100 mg)
were cut from 3-week-old-cultures. In cases where the mycelium was firmly attached to
the agar, the topmost layer of mycelium was scraped to exclude as much agar as possible.
The mycelium was rinsed thoroughly in sterile double distilled water and the excess
water was drained off aseptically. The mycelium was added to a 2.0 mL screw cap

13
microcentrifuge tube containing two 5 mm diameter sterile glass beads. Next, 400 µL
AP1 buffer and 4 µL RnaseA enzyme was added to this tube. The sample tubes were
disrupted using a Mini-Beadbeater (Biospec Products, USA) at the lowest (2500 rpm)
speed settings for one minute. This step was repeated once or twice if necessary to ensure
complete homogenization of the tissue. Tubes containing the samples were incubated at
65°C in a water bath for 10 minutes. During incubation, the tubes were inverted 2 - 3
times. The lysate was then centrifuged for 5 min. at 14000 rpm. DNA was extracted
following the manufacturer’s guidelines provided in Dneasy Plant Mini Kit (Qiagen).
PCR Amplification of the ITS Region
The ITS regions of the fungal DNA were amplified using the universal ITS
primers, ITS1-F and ITS4 (White et al. 1990). The ITS region is the most widely
sequenced DNA locus and is considered to be a universal DNA barcode marker for fungi
(Nilsson et al., 2008). The primer sequences used were: ITS1-F (5’-TCC GTA GGT
GAA CCT GCG G-3’) and ITS4 (5’-TCC TCC GCT TAT TGA TAT GC-30) (Integrated
DNA Technologies). Polymerase Chain Reaction (PCR) was performed in a 25 µL
reaction mix containing 1 µL template DNA extracted from the fungal culture, 1 µL
primer ITS1-F (10 µM), 1 µL primer ITS4 (10 µM), and 12.5 µL REDtaq ReadyMix
(Sigma-Aldrich). The final volume (25 µL) was adjusted using PCR- grade sterile
ddH2O. The PCR conditions used were as follows: initial denaturation at 94°C for 2 min.,
followed by 30 cycles of 94°C for 30 sec., 55°C for 60s, 72°C for 1 min. and a final
extension at 72°C for 5 min. (Barge, 2015).

14
Visualization, Purification and
Quantification of PCR Products
The amplified PCR products were examined using gel electrophoresis and
visualized on 1.5% agarose gels with 0.003% ethidium bromide in order to confirm the
presence of a single amplified band of approximately 600 bp. The amplicons (5 µL) were
purified using QIAquick PCR Purification Kit (Qiagen) following the instructions
provided by the manufacturer. DNA concentration in purified PCR products was
measured using a NanoDrop 2000 spectrophotometer (Thermo Scientific).
The gels were run for 35 min at 140V with 1X TBE buffer in GelXLUltra V-2
(OWL EasyCast Separation Systems, Inc. Portsmouth, NH, USA) electrophoresis
chamber. Gel imaging was performed under UV light in a bio-imaging system (UV
Kodak High Performance Ultraviolet Transilluminator). Approximately 600-bp PCR
products were purified using QIAquick PCR Purification Kit (Qiagen) according to the
manufacturer’s instructions. DNA concentration in purified PCR products was measured
using a NanoDrop 2000 spectrophotometer (Thermo Scientific).
DNA Sequencing
Purified products were sent to Functional Biosciences (Madison, WI) for direct
PCR sequencing. The amplified products were sequenced and aligned with the sequences
in GenBank by the BLASTN program (Altschul et al., 1997) in order to ascertain the
sequence homology with closely related organisms. Phylogenetic trees were generated by
Charles River (Newark, DE). The program called SeqTrace v.0.8.1 was used to

15
automatically align and calculate consensus sequences from matching forward and
reverse reads. Unreliable base calls were eliminated manually throughout the sequences
and replaced with N’s and the ends of poor nucleotide sequences were trimmed (Stucky,
2012).
Temperature Experiments
Growth of isolates was tested on PDA medium (pH 5.6) because this medium
yielded the highest fungal growth. Fungal isolates selected from Lake Chad, Lake
Bonney and Subglacial Lake Whillans were placed on PDA plates. A square of the
cultured mycelium (0.5cm2) was cut from actively growing colonies of each test isolate
and placed in the center of a fresh agar plate for growth. Triplicates of each plate were
incubated at 0°C, 4°C, 7.5°C, 10°C, 15°C, 20°C, and 25°C under ambient light to check
for temperature tolerance of the organisms.
Growth was calculated as the average increase in diameter (cm) for each day that
fungal colonies were on the agar surface during the exponential phase of growth (Kerry,
1990). The average of three diameters, taken at right angles and passing through the point
of inoculation at the center of the plate, was calculated. The Q10 values were calculated
the factor by using the following formula:
Q10 = (R2 / R1) 10/ (T
2 – T1)
Where Q10 represents the factor by which the growth rate (R) increases when the
temperature (T) is raised by 10 degrees. R1 is the measured growth rate at temperature T1
(where T1 < T2), R2 is the measured growth rate at temperature T2 (where T2 > T1), T1 is

16
the temperature at which growth rate R1 is measured, and T2 is the temperature at which
growth rate R2 is measured. The Q10 values helped determine the adaptation of fungi to
growth at low temperatures and also the amount of psychrotolerance exhibited by fungi.
The Q10 values were the factor by which growth rate at 25°C exceeded that at 15°C and
growth rate at 15°C exceeded that at 4°C. The method followed by Kerry (1990) is based
on the assumption that the linear growth on the surface of the agar is proportional to the
total volume of mycelium produced. Hence, careful observations were made to observe
and record any aerial growth.
Test Organisms to Profile Bioactivity:
Fungi and Bacteria
Plant pathogens that were used in the bioactivity profiling test were obtained from
D. Mathre of the MSU Department of Plant Sciences. The plant pathogens used were
Pythium ultimum (Oomycota), Phytophthora cinnamonmi (Oomycota), Sclerotinia
sclerotiorum (Ascomycota) and Fusarium solani (Ascomycota). Two bacterial strains
were isolated from the meltwater of the ice core from ELB and lake sediments from
Subglacial lake Whillans. These two bacterial strains that were tested against the fungal
isolates from the same habitat for bioactivity did not show any growth on the control
plates. All fungi and bacteria were grown on PDA at 25°C.
Bioactivity Profiling Test Organisms
Screening for antimicrobial activity was carried out using two techniques, dual
culture assay and gas test. The gas test was conducted if the dual culture assay showed

17
positive results in which the fungal isolate inhibited the growth of pathogen or bacterial
test strain.
Dual Culture Assay
All four fungal cultures were incubated at 25°C for 12 days or as mentioned
otherwise on PDA media. A dual culture assay was carried out to detect any bioactivity
against the plant pathogens by following protocols developed by (Jayaswal et al.,1990).
In this technique, an agar block (5 mm diameter) of a 10 day old culture of the selected
fungal isolate was placed in the center of the Petri plate containing PDA media. Plant
pathogens were inoculated 2 cm away from the fungus and tested for bioactivity (Figure
4). A loopful of bacteria was streaked 3 cm away from the test fungus present on the
same dish. Plates were wrapped with Parafilm and incubated at 25°C for 10 days.
Appropriate controls were set up in which the plant pathogen or bacterium was subjected
to the same procedure without the fungal isolate on the center of the Petri plate. The
experiment was repeated twice to compare results with three replicates of each treatment.
Percent growth inhibition (PGI) was determined after 48 hours incubation at 25°C by
using the formula of Skidmore & Dickinson (1976):
PGI (%) = Kr – r1 x 100
Kr
Where Kr represents the distance (measured in cm) of the control pathogens
growth from the point of inoculation to the edge of the colony on the plates, and r1 the
distance of pathogen’s growth towards the test fungus.

18
Figure 4. A 9 cm wide Petri dish plated with the fungus and test pathogens placed in
periphery.
Test for Volatile Antimicrobials
Isolates were tested for the productions of antimicrobial VOCs (volatile organic
compounds) by following protocols developed by (Strobel et al., 2001). Briefly,
antifungal and antibacterial activities of each fungal isolate was assessed against all four
plant pathogens, Pythium ultimum, Phytophthora cinnamonmi, Sclerotinia sclerotiorum,
Botrytis cinerea and two bacterial strains isolated from the same lake ice cover and
subglacial lake sediments as the respective fungus. To determine if VOCs were being
produced by the fungal isolates from the ice cores, an agar strip of 2 cm was removed
from the mid-portion of the plate. Removing the strip ensures that inhibitory compounds
are VOCs and not diffusible secondary metabolites. The fungal isolate of interest was
inoculated on the half-moon of the agar plate and cultivated for 10 days to optimize the

19
potential production of VOCs at room temperature (24°C). Plugs (5 mm) of test
organisms consisting of plant pathogens were each placed on the other half of the plate
(Figure 5).
Figure 5. A 9cm wide Petri dish plated with the fungi (left) and the pathogen (right) to
check for inhibitory bioactivity of the fungal isolate.
Essentially the organisms are allowed to grow in the artificial atmosphere that is
produced by any VOCs that may be present. This enables them to grow under the
artificial atmosphere that is produced by the VOCs. The plates were wrapped with
Parafilm and incubated for 12 days. Bacterial cultures were streak-inoculated on the other
half of the same plate. The plates were wrapped in double layer of Parafilm to ensure that
any VOCs produced did not escape from the plate and were incubated at 24°C. Controls
were set up in which the plant pathogen or bacterium was subjected to the same
procedure without the presence of fungal isolate in the plate.
Growth of test pathogens was recorded as the average increase in diameter (cm)
after 48 hours of exposure to the pathogens. Growth was reported as percent inhibition as

20
compared to relevant control plates without the test organism. The bacterial and yeast
cultures were visually estimated for the amount of colony growth and inhibition.
Measuring Substrate Utilization
Using BIOLOG Plate Assay
The Biolog technique is a redox system where microorganisms, are incubated
across a range of oxidize substrates present in a 96 well plate and respiratory potential is
measured as the rate of reduction of a colorless tetrazolium dye to a violet formazan,
which is then measured spectrophotometrically at 490 nm (Stefanowicz, 2006). The
Biolog® substrate utilization test was first used by Garland and Mills to estimate the
metabolic potential of isolates and to characterize the use of various substrates by
filamentous fungi (Garland & Mills, 1991, Stefanowicz, 2006, FF MicroplateTM
Instructions for Use). Since then, this approach has been repeatedly applied in
understanding community-level physiology (Weber & Legge, 2010). The FF
(Filamentous Fungi) Microplates that have been recently introduced by Biolog contain a
set of 95 varied carbon substrates and utilize reductions and/or turbidity of tetrazolium
dye to indicate substrate utilization activity. It employs the same redox technique as seen
in other Biolog plates where the colorless tetrazolium redox dye turns purple if the added
microorganisms utilize that carbon substrate (Pohland & Owen, 2009). Different groups
of microorganisms utilize substrates at different rates which results in variability in the
rate of color development and the intensity that depends on the fungal isolate present
(Stefanowicz, 2006).

21
The FF Microtiter plate contains 95 varied carbon substrates, one in each well,
and a control well without any substrate. The plate was prepared by following the
instructions provided in the FF Microplate ( FF MicroplateTM Instructions for Use). Pre-
made FF Microplates (Biolog catalog # 1006) containing 95 different carbon substrates
one in each well, and a control well without any substrate were purchased from Biolog
(2114 Cabot Blvd, Hayward, CA) and stored at 4°C until needed. The MicroPlates were
prewarmed for one hour before use. Pre-made FF-IF (Biolog catalog # 72106) sterile
borosilicate test tubes containing 16 ml of sterile ‘gelling’ inoculating fluid 0.25%,
Phytagel and 0.03% Tween 40 were used; the tubes were inverted to resuspend the
gelling agent before use. Pure cultures of the fungi were first grown on PDA medium as
it supported the best growth of the isolates. Cultures were incubated at 25°C under
ambient light for 5-10 days. Turbidity range was established using the FF turbidity
standard tube which gave 75% transmittance. The spectrophotometer (Milton Roy
Spectronic 20) was blanked (100% transmittance) using a clean tube containing
uninoculated FF fluid. Once the fungal colony had reached the desired size, the mycelium
of each pure culture was lightly scraped using a sterile swab under a type II biological
safety hood. This swab was then dipped into the FF-IF tube and gently twirled against the
inside of the tube on the dry glass above the fluid line. This ensures the separation of any
conidia present and release of cells to prepare a uniform suspension of the inoculum. The
tube was gently but thoroughly mixed to ensure a homogenous mixture. At the same
time, precaution was taken to ensure that bubbles were not introduced into the tube since
they interfere with the absorbance reading.

22
Each cell suspension was inoculated into the microplate within 10 minutes of
preparation. This step prevents strains from losing their metabolic activity because of
being suspended in the inoculating fluid without nutrients. Next, each well of the
Microplate was inoculated with 100 µL of the prepared suspension and incubated at 4°C
and 24°C. The Microplates were set up in replicates of three for each isolate. Absorbance
at 490 nm was measured on the FL 600 Microplate Fluorescence Reader at 24, 48, 72, 96,
120, 144 and 168 hours of incubation.
The substrate utilization profiles of the four isolates at 4°C and 24°C for the 92
carbon substrates were compared to investigate dependence of temperature on growth
and to understand the preferred carbon substrate utilized by the organisms at the two
temperatures. The optical density (ODi) value from each well was corrected by
subtracting the value for the least used substrate. The absorbance value of the control
well was inexplicably higher than the absorbance values of some substrates and was not
used as a subtraction value (Hitzl et al., 1997). In addition, carbon substrates were
divided into 6 substrate guilds 1) amines/ amides 2) amino acids 3) carbohydrates 4)
polymers 5) carboxylic acids and 6) other miscellaneous substrates, as suggested by
Dobranic and Zak (1999) (Appendix A.1).
Statistical Analyses
Metabolic rate data from the 95 different carbon sources were examined
simultaneously using the Biolog FF Microplate assay. The absorbance variables such as
isolates, temperature, and substrate groups were managed and analyzed using Minitab 17

23
and R software package (http://www.r-project.org/). A Linear Model was used to
investigate the relationships between temperature, isolates and groups. Analysis of
Variance (ANOVA) F-tests were used to examine evidence of differences among levels
of each factor. Tukey’s Honest Significance Difference (HSF) test was conducted to
examine pairwise differences within factors which showed evidence of a significant
difference.
The statistical analyses were carried out as previously described by Buyer et al.,
(1999). Substrates divided into the 6 substrate guilds described above (Zak et al., 1994)
and the average absorbance within each guild was calculated for all the wells. The
integral approach helps detect difference among isolates in wells where growth
responded- both slow and fast to the organic substrate (Garland, 1999).

24
HYPOTHESES
There is a great interest in discovering new species and their physiological
capacity in extreme environments (Wang et al., 2015). My study addresses the
physiology and function of fungi in the lake ice cover of east lobe Bonney and Lake
Chad, and in subglacial lake sediments from Subglacial Lake Whillans to help provide a
better understanding of the role of fungi in icy and sub-ice environments. The
overarching theme of my study is fungi play important roles in the solid ice and sub-ice
ecosystems. Within this overarching theme, I tested the following specific hypotheses
which addressed selected aspects of the physiology, temperature response, bioactive
properties, metabolic potential and substrate utilization of fungi present in the icy
ecosystem.
Hypothesis 1: Viable fungi are present in the lake ice cover and subglacial lake
sediments that can be cultured. To address this hypothesis, fungi retrieved from the lake
ice cover and subglacial lake sediments were isolated and cultured using conventional
practices. Molecular methods were used to identify the fungi and to help determine if
they are novel.
Hypothesis 2: Fungi in lake-ice ecosystems and subglacial lake sediments are
cold-adapted. To address this hypothesis, laboratory cultures obtained from ice cores
taken from ELB, Lake Chad, and sediments from Subglacial Lake Whillans (SLW) were
tested for growth and activity under various temperature and nutrient regimes. Growth
and activity at different temperatures provides an insight into the ecological and

25
physiological mechanisms important in fungal survival in the lake ice and subglacial lake
sediments.
Hypothesis 3: Fungi isolated from MDV and sediment sample from SLW are
capable of producing bioactive volatile organic compounds. This hypothesis was tested
by with an in-vitro dual culture assay. Briefly, each isolate was cultured and placed with
plant pathogens or prokaryotes test organisms on the same petri plate for 48 hours to
determine whether the isolate exhibited any bioactivity by inhibiting the growth of the
test organisms. In a second assay, an agar strip was removed from the mid-portion of the
plate to determine if VOCs were being produced.
Hypothesis 4: Fungal isolates have specific preferences for labile carbon
substrates and this preference is a function of temperature. BIOLOG plates specific for
fungi (FF MicroplateTM) were used to examine the preferred carbon substrates by each
fungal isolate at 4°C and 24°C .

26
RESULTS
Isolation, Culturing, and Taxonomic Identification
Three fungal species were isolated from three different ice cores retrieved from
the lake ice covers of ELB and Lake Chad, and one fungus was retrieved from a sediment
sample taken from Subglacial Lake Whillans. Attempts were made at culturing meltwater
from the ELB ice core on PDA, but this resulted in only bacterial growth on the petri
plate. There was no fungal growth in the meltwater inoculation. Culturing the sediment
rich ice cover resulted in fungal growth on petri plates with PDA medium (Figure 6).
Figure 6. Mycelial colonies of 10 day old axenic cultures of fungi isolated from various
sites. A) Younger culture of Tetracladium ellipsoideum from Lake Chad, B) Older
culture of Tetracladium ellipsoideum from Lake Chad C) Younger culture of
Lecythophora hoffmannii from SLW D) Older culture of Lecythophora hoffmannii from
SLW E) Unidentified Ascomycota (Helotiales) isolate from ELB, and F) Mucor sp. from
ELB

27
Sequence analysis of the ribosomal ITS region was conducted on four fungal
cultures to identify them. The ITS regions of the isolates from Subglacial Lake Whillans
and the isolate from Lake Chad were successfully amplified using Polymerase Chain
Reaction (PCR) with fungal primers ITS 1-F and ITS 4 followed by DNA sequencing.
Phylogenetic analysis of fungal isolates was performed after acquisition of the ITS- 5.8 S
ribosomal gene sequence. BLAST searches of GenBank indicated that the two
successfully amplified fungal cultures were members of the phylum Ascomycota. The
isolate from of Sublglacial Lake Whilllans was identified as Lecythophora hoffmanni and
the isolate from Lake Chad as Tetracladium ellipsoideum. Attempts to amplify the ITS
regions for the other two isolates were unsuccessful. The isolate from east lobe Bonney
was identified as a Zygomycota and a member of the Mucor sp. based on its morphology
and the isolate from East Lobe Bonney remains unidentified to species but belongs to the
phylum Ascomycota (Helotiales) (Table 1).
Table 1: Summary of fungal sequences from BLAST search of GenBank

28
Morphological Description Using Microscopic Observations
Morphological and microscopic observations were conducted on individual
culture plates. Culturing the sediment inclusions from the ice core samples resulted in
four isolates.
1. Tetracladium ellipsoideum (Wang et al., 2015)
(Lake Chad ice cover)
Description: Younger cultures pale yellow, flat to slightly raised with no aerial hyphae;
makes concentric rings in ambient light on PDA; margin uneven; reverse of culture is
yellow in color. Older cultures light pink (Figure 6 B). Hyphae narrow, hyaline, thin-
walled, about 1-2 µm wide, some arranged in parallel strands of hyphae and coiled;
immature conidiophores observed early on but not recorded in later stages.
Comments: DNA analysis was successful for this isolate and showed a 100% match in
BLAST search of GenBank. This species has been reported earlier in polar regions
(Wang et al., 2015). The first sequence mentioned in the phylogenetic tree (Figure 7) is
the T. ellipsoideum isolate that was isolated and cultured in this study. The remaining
were reference isolates used to determine the position of T. ellipsoideum. The taxon name
for this isolate was determined by using the best GenBank accession number match.
According to the phylogenetic tree, the isolate was closest match to T. ellipsoideum,
however, there was 2.7% distance between the two isolates.

29
Figure 7: Phylogenetic tree showing the relationship of T. ellipsoideum to reference taxa
generated by Charles River (Newark, DE).
2. Lecythophora hoffmannii (W. Gams and McGinnis, Mycologia 75:985, 1983)
(Subglacial Lake Whillans sediments)
Description: Younger cultures pale orange to salmon, relatively flat, less floccose with
slight aerial mycelium; margin sharp and slightly lobed with a few radial folds; reverse of
the culture is dark brown; exudates turn the agar pale orange to salmon (Figure 6 C). In
older cultures, margins have tufts of brown hyphae reaching into agar, and exudates turn
the agar pale brownish with slight orange tint (Figure 6 D). Reverse is then dark brown.
Hyphae narrow, hyaline, about 2- 2.5 µm wide, regularly septate with some septa
showing constrictions. Conidia present in masses. Conidia mostly long, elliptical, a few
slightly curved and hyaline, approximately 3- 4 x 1.5 - 2.0 µm; Q = 1.8 cm. Many
individual swollen end cells with a darker pigmented granular interior present. Although
a few hyphal-like phialides with expanded lips were possibly observed projecting at right
angles to main hyphal branches, these were not distinct.

30
Comments: Obsolete synonyms of this species are Margarinomyces hoffmannii and
Phialophora hoffmannii (Weber, 2002). Conniochaeta is the sexual stage. DNA analysis
was successful for this isolate and showed a percent similarity of 100% in BLAST search
of GenBank. According to Weber et al. (2002), L. hoffmannii is phylogenetically distinct
from the other species present in the genus. Lecythophora lignicola is the only species of
Lecythophora that has been previously reported in Antarctica and was retrieved from the
mud ponds in Victoria Land (Corte and Gestro, 1994). No slimy heads were evident for
the L. hoffmannii conidia as mentioned by Gams & McGinnis (1983). The first sequence
in the phylogenetic tree (Figure 8) is the L. hoffmannii isolate that was isolated and
cultured in this study. The others are reference sequences used to determine the
phylogenetic position of L. hoffmannii.
Figure 8: Phylogenetic tree showing the relationship of L. hoffmannii to reference taxa
generated by Charles River (Newark, DE).

31
3. Mucor sp. (Zygomycota, Mucorales)
(Lake East Lobe Bonney)
Description: Colonies on PDA growing rapidly, covering the whole petri plate in 7 days
at 24°C. Colony light greyish (Figure 6 E), a low turf, some aerial mycelium in center,
composed of tall and short sporangiophores, with sympodial branching, up to 20 µm in
diameter, with encrusted walls near the apex. Sporangia typically 40-60 µm in diameter
but up to 80 µm and rarely to 100 µm. Sporangia yellow, pale yellow, or brown, and
globose; walls of the sporangia are minutely echinulate; smaller sporangia are present on
shorter slightly curved branches; columella are light-colored, slightly elliptical, and up to
50 µm each way; the small collarette indistinct; sporangiospores ellipsoidal, smooth,
approximately 6-8 x 4-6 µm. Zygospores not present.
Comments: DNA analysis was not successful for this isolate which was identified to the
order level on morphology alone. Several species of the Mucorales genus have been
reported from Antarctica, including Mucor circinelloides Tiegham f. circelloides, M.
circinelloides f. janssenii (Lendn.) Schipper, M. flavus Bainier, M. heimalis Wehmer, M.
mucedo L., M. piriformis A. Fisch., M. plumbeus Bonord., M. racemosus Fresen,
and M. racemosus f. shaerosporus (Hagem) and Schipper (Tosi). Most of these species
can be ruled out on sporangiospore size and shape alone; however some such as M.
circinelloides (including forme circinelloides) that possess small ellipsoid spores, pale
sporangia, and minutely echinulate sporangia remain as possible taxa (Shipper 1976,
1978).

32
4. Unidentified Ascomycota (Helotiales)
(Lake East Lobe Bonney)
Description: Younger cultures white turning yellow, radially tufted; hyphae in bundles,
hyaline, smooth-walled, about 1.5–2 µm wide, arranged in paralled hyphal strands, more
aerial hyphae in the center, some densely coiled hyphae, some hyphae up to 50 µm wide.
Comments: DNA analysis did not give sequence information for definitive identification. It
was identified on the basis of closest match in the BLAST search that showed a 99% match
with an unidentified uncultured fungal clone that was collected from Arctic soil samples
(Timling et al., 2014). However, it could be determined that this fungus is an Ascomycete
and that it is the Helotiales clade. It is possibly another Tetracladium species.
Temperature Experiments
Growth rates were determined for fungal cultures growing on PDA plates
incubated at 0°C, 4°C, 7.5°C, 10°C, 15°C, 20°C, and 25°C under ambient light to test for
temperature tolerance. The maximum diameter (in cm) reached by each fungal isolate and
the corresponding time required (in days) at each of the seven temperatures are presented
in Appendix A.1. and figures 9-12. Standard deviations of the means were low, the
highest being 0.156 for a mean colony diameter of 8.08 cm for Mucor sp.
Temperature response experiments revealed that isolated fungi were
psychrotolerant and growth rates were greatest at 25°C (Figure 9 - 12). As compared to
the other three isolates, the Mucor species isolated from East Lobe Bonney showed
greatest dependence on temperature (Figure 9). At 25°C it covered the entire area of petri

33
plate (~ 8.05 cm) within a period of 3 days (Appendix A.1., Figure 9). Lecythophora
hoffmannii, isolated from Subglacial Lake Whillans was the only isolate that showed no
growth at 0°C (Appendix A.1., Figure 10). Lecythophora hoffmannii and the unidentified
Ascomycota sp. from East lobe Bonney, showed very similar temperature preferences at
24°C with doubling time of 0.008 cm d-1 and 0.004 cm d-1, respectively (Appendix A.1.,
Figure 11). Growth response for the two isolates from east lobe Bonney at 25°C showed
different temperature responses. Mucor sp. and the unidentified Ascomycota isolate
showed growth rates of 0.08 cm d-1 and 0.004 cm d-1 respectively. Tetracladium
ellipsoideum showed an increase in growth rate at 7.5°C and a slight decrease in growth
at 10°C (Appendix A.1., Figure 12).
Figure 9. Effect of temperature on growth rates of Mucor sp. The error bars represent the
average value of five replicated test plates.

34
Figure 10. Effect of temperature on growth rates of Lecythophora hoffmannii. The error
bars represent the average value of five replicated test plates.
Figure 11. Effect of temperature on growth rates of Unidentified Ascomycota. The error
bars represent the average value of five replicated test plates.

35
Figure 12. Effect of temperature on growth rates of Tetracladium ellipsoideum. The error
bars represent the average value of five replicated test plates.
In the lower temperature range (from 4°C to 15°C), the Q10 values for T.
ellipsoideum, L. hoffmannii, Mucor sp. and the unidentified Ascomycota all doubled. On
the other hand, in the higher temperature range (15°C - 25°C), out of the four isolates
only L. hoffmannii doubled when the temperature was increased by 10°C (Q10 = 2.63)
(Table 2).
Table 2. Q10 values for four fungal isolates at three temperatures.
Isolate
Q10 values
Lower
temperature Higher temperature
4°C - 15°C 15°C - 25°C
Tetracladium ellipsoideum
2.07 1.42
Lecythophora hoffmannii
1.98 2.63
Mucor sp.
2.57 1.86
Unidentified Ascomycota
2.27 1.17

36
Biological Effects of Fungal Isolates on Test Organisms
Dual Culture Assay
Five plant pathogens obtained from Plant Bioscience department of MSU and two
bacteria from the lake ice cover of ELB and sediment of SLW were used as test
organisms in the dual culture assay. The test organisms selected were plant pathogens,
Pythium ultimum, Phytophthora palmivora, Sclerotinia sclerotiorum, Fusarium solani,
and Botrytis cinera. The Antarctic fungal isolates were first grown for 10 - 15 days at
25°C on PDA, except for Mucor sp. which was grown for 24 - 35 hours due to its greater
dependence on temperature (Figure 9). The test organisms were then exposed to the
fungal isolates for 48 hours to determine if the fungus inhibited the test organisms.
Percent inhibition was measured relative to the growth of the control plate containing the
pathogen alone. The unidentified Acomycota and Mucor sp. did not inhibit any of the test
organisms (Table 3). Lecythophora hoffmannii inhibited the test organism Pythium
ultimum 93% (p < 0.05), moderately inhibited both Sclerotinia sclerotiorum 30% (p <
0.05) and Fusarium solani 31% (p < 0.05), and Phytophthora palmivora 21% (p <
0.05). Tetracladium ellipsoideum inhibited both Phytophthora palmivora 96% (p < 0.05)
and Sclerotinia sclerotiorum 97% (p < 0.01) (Table 3).

37
Table 3. Effects of the bioactive compounds produced by the fungal isolates on pathogens
and bacteria from SLW and ELB. The inhibition values were calculated as percentage
growth inhibition as compared to untreated control. The tests were carried out in
triplicates.
Isolates
Inhibition (%) after 48 h exposure to plant pathogens
Pythium
ultimum
Phytophthora
palmivora
Sclerotinia
sclerotiorum
Fusarium
solani
L. hoffmannii 93.05 (p < 0.05) 20.65 (p < 0.05) 30.32 (p < 0.05) 30.41 (p < 0.05)
T. ellipsoideum 14.96 (p < 0.05) 95.67 (p < 0.05) 96.98 (p < 0.01) 0
Mucor sp. 0 0 0 0
Unidentified
Ascomycota
0 0 0 0
0 indicates that no inhibition on test organism was observed.
Test for Volatile Organic Compounds
The fungal isolates that showed positive results for the dual culture assay were
tested for production of VOCs. These were L. hoffmannii and T. ellipsoideum, and they
were tested against the same five plant pathogens as in the first test. Lecythophora
hoffmannii was the only isolate that produced volatile compounds. It inhibited the growth
of P. palmivora by 62.35% (p < 0.05) and S. sclerotiorum by 30.05% (p < 0.05). No
other test organisms were inhibited. The susceptibility of the plant pathogens to the
VOCs of L. hoffmannii was dependent upon the age of the L. hoffmannii culture. The
peak of effective VOC production by L. hoffmannii was between 11-15 days after
inoculation of the test plate.

38
Substrate Profiling
The FF (Filamentous Fungi) Biolog Microplates were used to evaluate
quantitatively the physiological profile of fungi present in the Antarctic lake ice cover
and sediment samples. For each of the combinations of isolates, temperature, and
substrate groups, the average values of metabolic activity (i.e. absorbance at 490 nm)
across all of the 4 - 7 days, depending on the isolate, was taken as the response variable.
Figures 13 and 14 show the average values of absorbance at 4°C and 24°C respectively.
ANOVA (Analysis of Variance) was used to analyze the carbon substrate
utilization among the four isolates. The model incorporates main effects for isolate,
temperature, replicates, and substrate guilds. Interactions between temperature and
isolate, temperature and substrate guilds, and isolate and substrate guilds were also
considered. Diagnostic plots showed an increase in variability of the residuals as the
fitted values increase. Hence, a square-root transformation was performed on the
response variable in order to normalize variability in the residuals. After transformation,
other than a few observations with large residuals, the assumption of normally distributed
errors was reasonable.
Results from ANOVA showed that all main effects such as isolate (F3, 128 = 18.37,
p-value < 0.001), temperature (F1, 128 = 102.34, p-value < 0.001), substrate guilds (F6, 128 =
15.70, p-value < 0.001) and replicates (F2, 128 = 3.56, p-value < 0.05) had significant
impact on the mean square-root absorbency. Also, there was strong evidence of an
interaction between temperature and isolate (F3, 128 = 9.26, p-value < 0.001), and
temperature and substrate guilds (F6, 128 = 9.47, p-value < 0.001). However, there was no

39
strong evidence of an interaction between the four isolates and substrate guilds (F18, 128 =
0.9946, p-value = 0.47). Hence, the interaction between isolate and substrate guilds was
not considered in the model.
Table 4. ANOVA for transformed response.
Source df
Sum of
Squares
Mean
Square F p
Replicate 2 0.015 0.007 3.568 < 0.05
Temperature 1 0.225 0.225 102.341 < 0.001
Isolate 3 0.121 0.04 18.372 < 0.001
Group 6 0.207 0.034 15.707 < 0.001
Temperature : Isolate 3 0.061 0.02 9.265 < 0.001
Temperature : Group 6 0.125 0.002 9.472 < 0.001
Isolate : Group 18 0.039 0 0.994 0.4703
Residuals 128 0.282 0.002
Results from the final ANOVA showed that after accounting for the effects of
replications, temperatures, and isolates, a strong evidence (F 6, 146 = 15.71, p-value <
0.001) for differences in mean square-root absorbency across the different isolates was
observed. After accounting for effects of replications, temperature, isolates, and substrate
guilds, there was strong evidence (F 3, 146 = 9.27, p-value < 0.001) that the effects of
isolates on mean square-root absorbency differ across temperature. Thus, all main effects
such as isolate (F3, 146 = 18.38, p-value < 0.001), temperature (F1, 146 = 102.41, p-value <
0.001), substrate guilds (F6, 146 = 15.71, p-value < 0.001) and replicates (F2, 128 = 3.57, p-
value < 0.05) have significant impact on the mean square-root absorbency.

40
Table 5. ANOVA for interactions between temperature and isolate, and temperature and
group
Source df
Sum of
Squares
Mean
Square F p
Replicate 2 0.015 0.007 3.568 < 0.05
Temperature 1 0.225 0.225 102.341 < 0.001
Isolate 3 0.121 0.04 18.372 < 0.001
Group 6 0.207 0.034 15.707 < 0.001
Temperature : Isolate 3 0.061 0.02 9.265 < 0.001
Temperature : Group 6 0.125 0.002 9.472 < 0.001
Residuals 146 0.321 0.002
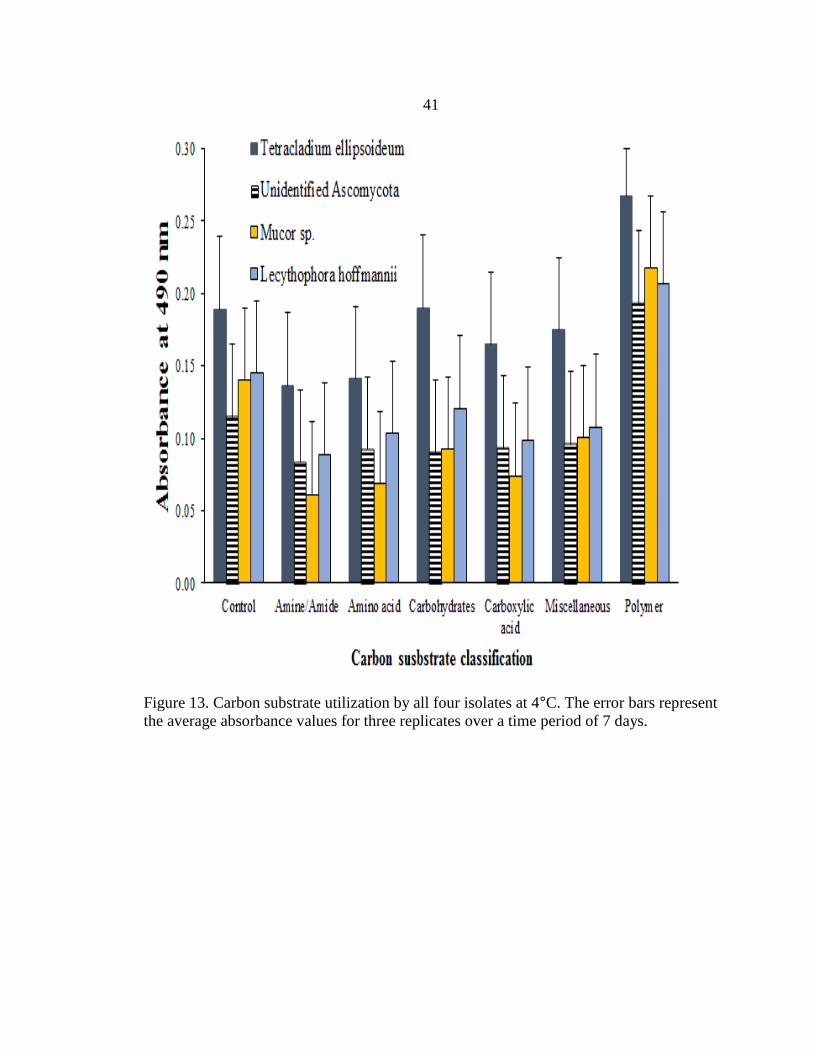
Carbon substrate utilization, assessed via Biolog FF Microplates, showed that at 4
°C, all four isolates showed maximum preference for polymers (Figure 13). The overall
substrate utilization (absorbancy) was greater when the isolates were incubated at 24°C
(Figure 14). At 24°C the isolates T. ellipsoideum, the unidentified Ascomycota and
Mucor sp. showed maximum utilization of polymers (specifically a- cyclodextrin), amino
acids, and carbohydrates as compared to other carbon guilds. All the four fungal isolates
however, showed a preference for amino acids and carbohydrates over polymers at 24°C.
41
Figure 13. Carbon substrate utilization by all four isolates at 4°C. The error bars represent
the average absorbance values for three replicates over a time period of 7 days.

42
Figure 14. Carbon substrate utilization by all four isolates at 24°C. The error bars
represent the average absorbance values for three replicates over a time period of 7 days.
The overall absorption, as noted earlier, was significantly higher (p < 0.05) at
24°C (0.43, p < 0.05) than at 4°C (0.35, p < 0.05) irrespective of the different substrate
guilds, isolates and replicates. Effect plots for the model factors display the estimated
effects on mean square-root absorbency across the different factors considered. One such
plot (Figure 15) displays the effects of isolate and temperature conditioned on substrate
groups and replication. By conditioning on replicates and substrate guilds, the effects of
these variables were effectively averaged and deviations from this mean value for isolate
and temperature combinations were considered. This makes it possible to consider
deviations from this mean value for isolate and temperature interactions. From figure 15,
it is evident that the unknown Ascomycota, Mucor sp. and L. hoffmannii have different
effects on metabolic rate depending on the temperature at which they were inoculated.

43
However, T. ellipsoideum showed approximately similar substrate utilization response at
both 4°C and 24°C without showing any apparent temperature dependence. Substrate
utilization of all 95 substrates is higher when inoculated at 24°C whereas lower when
inoculated at 4°C.
Figure 15: Effect of temperatures on the growth of isolates. The error bars represent
the average absorbance values for three replicates over a time period of 7 days.
The post-hoc test was conducted using Tukey’s HSD test to investigate if there
was a significant difference between the substrate utilization of the four isolates at two

44
temperatures. At 4°C, substrate utilization for T. ellipsoideum was significantly higher (p
< 0.05) than the unknown Ascomycota, Mucor sp. and L. hoffmannii. Substrate utilization
for Mucor sp. and L. hoffmannii were also significantly higher (p < 0.05) than that of the
unknown Ascomycota (Figure 15). At 24°C, the absorbance of the unknown Ascomycota
and L. hoffmannii were significantly different than T. ellipsoideum. There was no
significant difference between substrate utilization of T. ellipsoideum and Mucor sp. (p >
0.05) at 24°C (Figure 15).
Figure 16 displays the effect of temperature and substrate groups conditioned on
isolates and replication. At both 4°C and 24°C, the polymers are the most utilized
substrate guild amongst all six guilds across the four isolates and replicates (Figure 16).
The post-hoc test was conducted using Tukey’s HSD test to find whether temperature had
a significant effect on different substrate guilds. At 4°C there was a significant difference
(p < 0.05) among the square-rooted absorbance values of amines/amides and amino acid,
carbohydrate, carboxylic acid, polymers and the miscellaneous group. At 24°C, there was
no significant difference (p > 0.05) between absorbance of amino acid and carboxylic
acid. There was a significant difference in substrate utilization among carbohydrates and
carboxylic acid, polymers and the miscellaneous group.

45
Figure 16: Effect of temperatures on the carbon guild utilization by the four fungal
isolates. The error bars represent the average absorbance values for three replicates over a
time period of 7 days.
A detailed comparison of the carbon substrates utilized by each of the four fungal
isolates was investigated using heatmaps reflecting the absorbance values without
statistical transformation (Appendix C). Results from heat map showed that at 4°C all
four isolates had maximum substrate utilization of polymers (a- cyclodextrin) as shown in
Appendix C. However, at 24°C the results from the heat map contradicted the Effect
plots, where all four isolates had maximum preference for carbohydrates (Appendix C.1,

46
C.3, C.5, and C.7). At both the temperatures, T. ellipsoideum (Appendix C.1 and 2) and
unidentified Ascomycota isolate (Appendix C.3 and 4) had maximum substrate utilization
of sebacic acid. At 4°C, Mucor sp. had maximum substrate utilization for polymer a-
cyclodextrin and poorly utilized N-acetyl-D-glucosamine (Appendix C.5). However at
24°C, the substrate utilization of N-acetyl-D-glucosamine was maximum (Appendix
C.6). The overall substrate utilization of L. hoffmannii at 4°C was relatively low
(Appendix C.7) compared to utilization at a higher temperature (Appendix C.8).

47
DISCUSSION
Fungi have been isolated from cold environments and have also been investigated
to determine their adaptive strategies to withstand low nutrient availabilities and cold
temperatures (Ruisi et al., 2007). They constitute a conspicuous portion of the microbiota
in Antarctica. Lake ice cover and sediments from the subglacial environment provide a
unique opportunity to investigate the microbiology of icy ecosystems that have remained
isolated from the atmosphere for significant periods of time.
Diversity of Fungal Isolates from Antarctic
Lake Ice and Subglacial Sediments
Fungal biodiversity in continental Antarctica has been widely investigated by
isolating, culturing, and identifying fungal strains from samples collected in different
habitats of the continent (Onofri, 2005b); Onofri et al. (2005b, 2006) reported that 99.4%
of fungi present in continental Antarctica are true fungi that includes yeasts and
filamentous fungi, which together comprise species belonging to the phyla Ascomycota,
Basidiomycota, Zygomycota, and Chytridiomycota. In spite of the evidence that fungi
comprise an important part of these habitats, the mycological component of ice
communities is often overlooked (D’Elia, 2008). The findings from this section of the
thesis targeted the isolation and characterization of fungi present in the permanent lake
ice cover and sediments of subglacial Lake Whillans.
Phylogenetic analysis was carried out by sequencing the ITS 5.8S ribosomal
gene sequence since this region has been successfully used in the past to resolve

48
phylogenetic relationships of fungi at inter- and intraspecific level (Egger & Sigler, 1993;
Lee & Taylor, 1992). Axenic cultures of Tetracladium ellipsoideum from Lake Chad,
Mucor sp. and an unidentified Ascomycota sp from East lobe Bonney were obtained from
the permanent lake ice covers. An axenic culture of Lecythophora hoffmannii was also
retrieved from the sediment sample of Subglacial Lake Whillans. Three of the four fungal
cultures, Tetracladium ellipsoideum, Lecythophora hoffmannii and the unidentified
Ascomycota isolate grouped phylogenetically with Ascomycota. Mucor sp.was identified
based on its morphology and is included in phylum Zygomycota.
The ITS sequence analysis of the fungal culture Tetracladium ellipsoideum that
was retrieved from Lake Chad showed similarity with cultures that have been previously
isolated from cold environments, such as permafrost soil and streams of alpine glacier
(Kuhnert et al., 2012; Robinson et al., 2000), implying that it may be cold-adapted. Eight
species of Tetracladium have been reported in the genus and are known to be distributed
worldwide in lotic (Shearer, 2007) and aquatic habitats (Read et al.1992). An endophytic
strain that was recovered from riparian plant roots from a freshwater stream of Nanital in
Himalaya, India was recognized as a Tetracladium species called T. nainitalense (Sati,
Arya, & Belwal, 2009). In the samples obtained from soils and lake sediments in the
Skarvsnes ice-free area of Antarctica, 9.9% of the dominant isolates belonged to the
genera Tetracladium (Tsuji et al., 2013). In a study conducted by Arenz & Blanchette
(2010), an uncultured Tetracladium clone was retrieved from soil samples collected from
the Antarctic Peninsula. The Tetracladium elliposideum isolate that showed a 100%
match in the BLAST search to my sample also matched up with a newly generated

49
sequence that was isolated from the soil samples of glacier on the Qinghai- Tibet Plateau
(Wang et al., 2015).
Lecythophora hoffmanni has been previously isolated from weathered wood and
results in soft-rot decay in historic huts and artifacts (Bugos, Sutherland, & Adler, 1988);
it has also been isolated as an endophytic fungus from Bryophytic samples collected on
Barton Peninsula of King George Island in maritime Antarctica (Yu et al., 2013). Some
species of this genus also are known to be pathogens of woody hosts (Damm et al., 2010)
and have also been involved in human diseases associated with cases of sinusitis,
peritonitis, subcutaneous infections, and canine osteomyelitis (Perdomo et al., 2011).
Lecythophora lignicola has been reported from mud ponds in Victoria Land (Corte &
Gestro, 1994),
The Mucor species retrieved from ELB in this study was identified based on its
morphology. Amongst the Mucorales, Mortierellaceae and Mucoraceae are the most
frequently recorded families in Antarctica. Genera in these families are known to produce
a large number of mitotic spores that are resistant reproductive structures that enhance
survival opportunities (Onofri et.al, 2006). They have a worldwide distribution and are
regarded as psychrotolerant organisms (Onofri et.al, 2006).
Isolation, culturing and identification of fungi from the lake ice cover and
subglacial lake sediments add new evidence to range of the existing microbial diversity
and support the likelihood of the existence of a complex ecosystem within subglacial
lakes. This analysis further supports the hypothesis stated in this study that at least some

50
fungi present in the lake ice cover and subglacial lake sediments are viable and can be
cultured.
Growth Temperature Preference
of Fungal Isolates
Antarctica exhibits some of the most extreme conditions on Earth. Cold
adaptation is the most investigated aspect of fungi in Antarctica (Zucconi et al., 1996).
The objective of this experiment was to investigate and compare the effects of
temperature on fungal growth. The results of the growth experiments inform the
discussion of fungal ecology in ice and sub-ice environments. Fungi have evolved
mechanisms that enable them to withstand the low temperatures and nutrient
availabilities (D’Amico et al., 2006; D’Elia et al., 2009; Ruisi et al., 2007), which allow
them to persist in the Antarctic. Fungi that are capable of growing at or below 0°C have
optimum growth temperatures (OGT) of ≤ 15°C and maximum growth temperatures
(MGT) of ≤ 20°C are considered psychrophilic; those capable of growing close to 0°C,
have OGT >15°C and MGT > 20°C are considered psychrotolerant (Morita, 1975).
All four fungal isolates grew well in the 15 - 25°C range on PDA medium. They
also grew at temperature near 4°C identifying them as psychrotrophs (L. hoffmannii, T.
ellipsoideum and unknown Ascomycete isolate) or cold tolerant mesophiles (Mucorales
sp.) that are capable of growing at low temperatures but have OGT of 15°C and MGT of
20°C, respectively. Lecythophora hoffmannii isolated from lake sediments of SLW grew
to 0.04 cm in diameter at 4°C in a period of 13 days and showed no growth at 0°C. The

51
Mucor species that was isolated from ELB grew the fastest with doubling time of 0.085
cm d-1 at 25°C on PDA medium. Previous studies have recorded Mucor species to have
rapidly growing colonies and also regarded as a psychrotolerant thermophile with OGT
being 35 - 37°C and MGT at 45°C (Domsch, 1980).
The Q10 values for T. ellipsoideum, Mucor sp., the unidentified Ascomycota and
L. hoffmannii doubled between 4°C – 15°C. Results of this study were in agreement with
the growth studies at different temperatures where L. hoffmannii showed no growth at
0°C (Figure 12). This shows that an increase in temperature by ± 10°C at a low
temperature could have a greater effect on the growth of an organism as compared to
increasing the temperature by 10°C in the higher temp range. Environmental temperatures
in the area from where these fungal isolates were collected fluctuate between - 4°C to
7°C. Hence it is difficult to relate these Q10 values to the environment.
None of the isolates tested could be defined as psychrophilic because they were
all capable of growth at temperatures > 20°C (Morita, 1975), but the growth temperature
experiments showed that all four isolates in this study were psychrotolerant. This is in
agreement with the previous studies that state microfungi from Antarctica are mostly
psychrotolerant mesophiles capable of growing over wide temperature ranges (Kerry,
1990; Zucconi et al., 1996). All four isolates had optimum growth temperature of 20°C or
25°C which is a lower range than most mesophiles. The four psychrotolerant fungal
isolates reported in this study have been collected from Antarctica and some other cold
habitats in the past.

52
Biological Inhibition of Fungi by
Antarctic Fungal Isolates
Antarctica is characterized by some of the main environmental stressors found on
Earth, such as low temperatures, UV-radiation, desiccation, varying light conditions,
salinity, nutrient concentration and freeze thaw-cycles. This infrequent combination of
selection pressures has resulted in the evolution of novel biochemical and novel
adaptations, and possibility of autochthonous species (Ellis-Evans & Walton, 1990;
Vincent, 2000). In recent decades, there has been an increase in studies investigating the
metabolic potential of Antarctic microbes in production of secondary antimicrobial
compounds (Bull et al., 2000; Nichols et al., 1999). In a study conducted by Marinelli et
al. (2004), 29% of the microfungal species collected from benthic mats of lakes in
Antarctica showed antimicrobial activities. Brunati et al. (2009) reported new antibiotics
produced by fungi that were also from the microbial mats from Antarctic lakes.
This study reports bioactivity in fungi associated with the Antarctic lake ice cover
and sediments from a subglacial lake. Four fungal isolates were screened for antagonistic
activity against five plant pathogens. Neither the Mucor sp. nor the unidentified
Ascomycota isolated from ELB inhibited the growth of the pathogens in dual culture
assay. Lecythophora hoffmannii inhibited radial growth of the plant fungal pathogen
Pythium ultimum (Oomycota) by establishing a clear zone of inhibition in a dual culture
test. It significantly inhibited (p < 0.05) the growth of Phytophthora cinnamomi
(Oomycota), Sclerotinia sclerotiorum (Ascomycota) and Fusarium solani (Ascomycota),
by 20.65%, 30.32%, and 30.41% , respectively. Tetracladium ellipsoideum isolated from

53
Lake Chad showed approximately 97% inhibition against P. palmivora and S.
sclerotiorum.
VOCs were only produced by L. hoffmannii, and these VOCs significantly
inhibited two of the pathogens Phytophthora palmivora by 62.35% (p < 0.05) and
Sclerotinia sclerotiorum by 30.05% (p < 0.05). L. hoffmannii produced maximum VOCs
after 12 days of growth; however as the culture grew older, the percent growth inhibition
for the pathogens started to decline (data not shown).
Two fungal isolates, T. ellipsoideum from Lake Chad and L. hoffmannii from
SLW possessed antifungal activity against known plant pathogens which has not been
previously reported for fungi isolated from Antarctic lake ice. This could have promising
applications in biotechnology, and possibly relates to the isolates ability to compete with
other fungi in the environment.
Carbon Substrate Utilization
Using Biolog Assay
The Biolog method was used to compare the substrate utilization of fungal
isolates collected from the ice cores and lake sediments of McMurdo Dry Valley and
Subglacial Lake Whillans region, respectively. This method was initially introduced to
obtain physiological profiles of the entire microbial communities (Garland, 1997). Most
research carried out using the Biolog Microplate focuses on community analyses,
taxonomic richness or diversity (Zak, Willing, Moorhead, & Wildman, 1994). However,
this study uses the Biolog plate to investigate the physiology of individual fungal isolates
based on the respiratory potential and utilization of specific carbon guild by each fungus.
54
Each substrate on the FF Biolog plate was characterized on the basis of its chemical
nature thus making it possible to sort the 95 different substrates into six main chemical
groups such as amines/amides, carbohydrates, carboxylic acids, polymers and
miscellaneous. The types of substrates utilized by the fungal isolates, as well as the levels
of activities on various substrates assessed the ecological diversity of the isolates.
The FF MicroPlate profile revealed that there was a significant increase (p < 0.05)
in substrate utilization patterns at 24°C as compared to 4°C (Figure 14) across all carbon
guilds, isolates and replicates. This result is in agreement with the results from the
temperature experiment where all four isolates were psychrotolerant and optimal growth
was observed at 25°C as compared to 4°C (Figure 9-12). This indicates that both, growth
rates and respiratory potential of these four isolates were dependent on temperature.
Interestingly, the Mucor species which showed the fastest growth rate (0.85cm d -1) did
not show a higher utilization of carbon substrates in the BiologPlate assay at either
temperature. Although, it has a faster growth rate, it does not produce a dense mycelium.
Conclusions
Within the Antarctic environment, the lake ice cover represents a relatively
unexplored habitat in terms of fungal diversity and ecology. This study addresses the
physiology of fungi present in lake ice cover and subglacial lake sediments. According to
Ellis-Evans (1996), not much is known about the fungal communities in Antarctic lakes
and, until now, only a few genera have been described. Based on the molecular
characterization, the results showed that axenic cultures of Tetracladium ellipsoideum

55
from Lake Chad, Mucor sp. and an unidentified Ascomycota isolate from East lobe
Bonney were successfully obtained from the lake ice cover. Lecythophora hoffmannii
was obtained from the sediments of Subglacial Lake Whillans. All the isolates that were
identified have been previously reported in Antarctica and are related to taxa from several
different cold habitats. Most studies report fungi in soil, lake water column, and glaciers
only Mosier et al., (2007) reported Eukarya present in the lake ice cover of Lake Vida.
Temperature experiments revealed that these organisms were psychrotolerant and
showed an optimum growth at 25°C. All the fungal isolates grew optimally in the 15°C -
25°C range. From the ITS sequence analysis, morphology, and psychrotolerant
characteristics of these four isolates, it can be confirmed that at least three of these
isolates are likely members of the Antarctic mycoflora and not modern contaminants. The
Mucor sp. remains unsubstantiated. The isolation of the fungi from the lake ice covers
and sediments of subglacial lakes further supports that these habitats may harbor a
diverse set of microorganisms and complex ecosystems.
Two out of four isolates, T. ellipsoideum and L. hoffmanni showed antifungal
activity against some of the most detrimental plant pathogens such as Pythium ultimum,
Phytophtora palmivora and Sclerotinia sclerotiorum. L. hoffmanni inhibited P. ultimum
(94%, p < 0.05) and T. ellipsoideum inhibited P. palmivora (96%, p < 0.05) and S.
scletiorum (97%, p < 0.01). Lecythophora hoffmannii produced bioactive organic
compounds that inhibited the growth of S. sclerotiorum by 30.05% (p < 0.05) and P.
palmivora by 62.35% (p < 0.05). It can be concluded that isolates from Antarctic lakes

56
are a potentially rich source of fungal strains that produce novel bioactive metabolites
with promising applications in the field of agriculture and medicine.
To date, no extensive physiological investigations have been conducted on fungal
isolates present in the solid ice or sub-ice habitats. Results from Biolog experiment
confirm that the isolates have a preference for labile carbon substrates. The rationale
behind conducting the BiologPlate assay at 4°C and 24°C was to understand the
metabolism and substrate utilization of the fungal isolates at the given temperatures. At
4°C, the two isolates, L. hoffmannii and T. ellipsoideum which both belong to phylum
Ascomycota showed differences in their substrate utilization profiles. Lecythophora
hoffmannii is a slow growing isolate that did not grow at 0°C. For the BiologPlate assay,
L. hoffmannii at 4°C showed lower absorbance (0.34) than T. ellipsoideum (0.43). At 24
°C, however, the difference between the absorbance values of the two isolates was not
significant (p > 0.05). At 24°C, L. hoffmannii showed higher substrate utilization for
amino acids followed by carbohydrates (Figure 14). In fungi, carbohydrates are primarily
present as polysaccharides (Griffin, 1996). Also, it should be noted that although the
substrate utilization was highest for polymers, there is a broad range of carbon sources
that are utilized especially at 24°C by these four fungal isolates. This might contribute to
the reason why some of these isolates can be found on varied substrates and cold habitats.

57
REFERENCES CITED

58
Abyzov, S. S., Hoover, R. B., Imura, S., Mitskevich, I. N., Naganuma, T., Poglazova, M.
N., & Ivanov, M. V. (2004). Use of different methods for discovery of ice-
entrapped microorganisms in ancient layers of the Antarctic glacier. Advances in
Space Research, 33(8), 1222–1230. doi:10.1016/j.asr.2003.08.033
Altschul, S. F., Madden, T. L., Schäffer, A. A., Zhang, J., Zhang, Z., Miller, W., &
Lipman, D. J. (1997). Gapped BLAST and PSI-BLAST: A new generation of
protein database search programs. Nucleic Acids Research, 25(17), 3389–3402.
doi:10.1093/nar/25.17.3389
Arenz, B. E., & Blanchette, R. A. (2010). Distribution and abundance of soil fungi in
Antarctica at sites on the Peninsula, Ross Sea Region and McMurdo Dry Valleys.
Soil Biology and Biochemistry, 43(2), 308–315. doi:10.1016/j.soilbio.2010.10.016
Azmi, O. R., & Seppelt, R. D. (1997). Fungi of the Windmill Islands, continental
Antarctica. Effect of temperature, pH and culture media on the growth of selected
microfungi. Polar Biology, 18(2), 128–134. doi:10.1007/s003000050167
Barge, E. G. (2015). Systematics of Lactarius in the Rocky Mountain alpine zone
(Thesis). Montana State University - Bozeman, College of Agriculture. Retrieved
from http://scholarworks.montana.edu/xmlui/handle/1/9032
Baublis, J. A., Wharton, R. A., & Volz, P. A. (1991). Diversity of micro-fungi in an
Antarctic dry valley.
Blanchette, R. A., Held, B. W., Jurgens, J. A., Mcnew, D. L., Harrington, T. C., Shona,
M., … Duncan, S. M. (2004). Wood-Destroying Soft Rot Fungi in the Historic
Expedition Huts of Antarctica Applied and Environmental Microbiology, 70(3),
1328–1335. doi:10.1128/AEM.70.3.1328
Bridge, P. D., & Spooner, B. M. (2012). Non-lichenized Antarctic fungi: transient visitors
or members of a cryptic ecosystem? Fungal Ecology, 5(4), 381–394.
doi:10.1016/j.funeco.2012.01.007
Broady, P. a., & Weinstein, R. N. (1998). Algae, lichens and fungi in La Gorce
Mountains, Antarctica. Antarctic Science, 10(04), 376–385.
doi:10.1017/S0954102098000467
Brunati, M., Rojas, J. L., Sponga, F., Ciciliato, I., Losi, D., Göttlich, E., … Marinelli, F.
(2009). Diversity and pharmaceutical screening of fungi from benthic mats of
Antarctic lakes. Marine Genomics, 2(1), 43–50.
doi:10.1016/j.margen.2009.04.002
Bugos, R. C., Sutherland, J. B., & Adler, J. H. (1988). Phenolic Compound Utilization
by. Mycologia, 54(7), 1882–1885.

59
Bull, A. T., Ward, A. C., & Goodfellow, M. (2000). Search and discovery strategies for
biotechnology: the paradigm shift. Microbiology and Molecular Biology
Reviews : MMBR, 64(3), 573–606. doi:10.1128/MMBR.64.3.573-606.2000
Buyer, J. S., Roberts, D. P., & Russek-Cohen, E. (1999). Microbial community structure
and function in the spermosphere as affected by soil and seed type. Canadian
Journal of Microbiology, 45(2), 138–144. doi:10.1139/w98-227
Cantrell, S. a, Dianese, J. C., Fell, J., Gunde-Cimerman, N., & Zalar, P. (2011). Unusual
fungal niches. Mycologia, 103(6), 1161–74. doi:10.3852/11-108
Castello John, & Rogers Scott. (2005). Life in ancient ice . (Castello John & Rogers
Scott, Eds.). Princeton University Press. Retrieved from pup.princeton.edu
Christner, B. C., Mikucki, J. a., Foreman, C. M., Denson, J., & Priscu, J. C. (2005).
Glacial ice cores: A model system for developing extraterrestrial decontamination
protocols. Icarus, 174(2), 572–584. doi:10.1016/j.icarus.2004.10.027
Christner, B. C., Priscu, J. C., Achberger, A. M., Barbante, C., Carter, S. P., Christianson,
K., … Tulaczyk, S. (2014). A microbial ecosystem beneath the West Antarctic ice
sheet. Nature, 512(7514), 310–313. doi:10.1038/nature13667
Connell, L., Redman, R., Craig, S., & Rodriguez, R. (2006). Distribution and abundance
of fungi in the soils of Taylor Valley, Antarctica. Soil Biology and Biochemistry,
38(10), 3083–3094. doi:10.1016/j.soilbio.2006.02.016
Corte, A., & Gestro, C. (1992). Fungi from mud of Antarctic ponds. Edizioni
Universitarie Patavine.
D’Amico, S., Collins, T., Marx, J.-C., Feller, G., & Gerday, C. (2006). Psychrophilic
microorganisms: challenges for life. EMBO Reports, 7(4), 385–9.
doi:10.1038/sj.embor.7400662
Davies, B. "Antarctic Subglacial Lakes." AntarcticGlaciersorg Subglacial Lakes
Comments. N.p., 22 Feb. 2014. Web. 15 Mar. 2016.
D’Elia, T., Veerapaneni, R., & Rogers, S. (2009). Isolation of fungi from Lake Vostok
accretion ice. Applied and Environmental Microbiology, 101(6), 2009.
doi:10.1128/AEM.02501-07
Damm, U., Fourie, P. H., & Crous, P. W. (2010). Coniochaeta (Lecythophora),
collophora gen. nov. and phaeomoniella species associated with wood necroses of
prunus trees. Persoonia: Molecular Phylogeny and Evolution of Fungi, 24, 60–80.
doi:10.3767/003158510X500705
60
Doran, P. T., McKay, C. P., Clow, G. D., Dana, G. L., Fountain, A. G., Nylen, T., &
Lyons, W. B. (2002). Valley floor climate observations from the McMurdo dry
valleys, Antarctica, 1986-2000. Journal of Geophysical Research: Atmospheres,
107, 1–12. doi:10.1029/2001JD002045
Doran, P. T., Wharton, R. A., & Lyons, W. B. (1994). Paleolimnology of the McMurdo
Dry Valleys, Antarctica. Journal of Paleolimnology, 10, 85–114.
doi:10.1007/bf00682507
Dowdeswell, J. A., & Siegert, M. J. (2003). The physiography of modern Antarctic
subglacial lakes. Global and Planetary Change, 35(3-4), 221–236.
doi:10.1016/S0921-8181(02)00128-5
Egger, K. N., & Sigler, L. (1993). Relatedness of the Ericoid Endophytes Scytalidium
vaccinii and Hymenoscyphus ericae Inferred from Analysis of Ribosomal DNA.
America, 85(2), 219–230.
Elia, T. D., Veerapaneni, R., Theraisnathan, V., & Rogers, S. O. (2009). Isolation of
fungi from Lake Vostok accretion ice. Mycologia, 101(6), 751–763.
Ellis-Evans, J. C. (1996). Microbial diversity and function in Antarctic freshwater
ecosystems. Biodiversity and Conservation, 5, 1395–1431.
doi:10.1007/BF00051985
Ellis-Evans, J., & Walton, D. (1990). The process of colonization in Antarctic terrestrial
and freshwater ecosystems. Polar Biol, 3, 151–163.
Fountain, A. G., Nylen, T. H., Monaghan, A., Basagic, H. J., & Bromwich, D. (2010).
Snow in the Mcmurdo Dry Valleys, aNtarctica. International Journal of
Climatology, 30(5), 633–642. doi:10.1002/joc.1933
Fricker, H., Scambos, T., Bindschadler, R., & Padman, L. (2007). An active subglacial
water system in West Antarctica mapped from space. Science, 315(March), 1544–
1548. doi:10.1126/science.1136897
Fritsen, C. H., Adams, E. E., McKay, C. P., & Priscu, J. C. (1998). Permanent Ice Covers
of the McMurdo Dry Valley Lakes. Antarctica: Liquid Water Contents.
Gams, W., & McGinnis, M. (1983). Phialemonium, a New Anamorph Genus
Intermediate between Phialophora and Acremonium. Myco, 75(6), 977–987.

61
Garland, J. L. (1997). Analysis and interpretation of community level physiological
profiles in microbial ecology. FEMS Microbiology Ecology, 24, 289–300.
doi:10.1017/CBO9781107415324.004
Garland, J. L. (1999). Potential and limitations of BIOLOG for microbial community
analysis. In In Proceedings of the 8th International Symposium on Microbial
Ecology Atlantic Canada Society for Microbial Ecology (pp. 1–7).
Garland, J. L., & Mills, a. L. (1991). Classification and characterization of heterotrophic
microbial communities on the basis of patterns of community-level sole-carbon-
source utilization. Applied and Environmental Microbiology, 57(8), 2351–2359.
Godinho, V. M., Furbino, L. E., Santiago, I. F., Pellizzari, F. M., Yokoya, N. S., Pupo,
D., … Rosa, L. H. (2013). Diversity and bioprospecting of fungal communities
associated with endemic and cold-adapted macroalgae in Antarctica. The ISME
Journal, 1434–1451. doi:10.1038/ismej.2013.77
Griffin, D. (1996). Chemistry of the Fungal Cell. In Fungal Physiology (p. 53).
Gunde-Cimerman, N., Sonjak, S., Zalar, P., Frisvad, J. C., Diderichsen, B., & Plemenitaš,
a. (2003). Extremophilic fungi in arctic ice: a relationship between adaptation to
low temperature and water activity. Physics and Chemistry of the Earth, Parts
A/B/C, 28(28-32), 1273–1278. doi:10.1016/j.pce.2003.08.056
Hitzl, W., Rangger, A., Sharma, S., & Insam, H. (1997). Separation power of the 95
substrates of the Biolog system determined in various soils. FEMS Microbiology
Ecology, 22, 167–174. doi:10.1007/s13398-014-0173-7.2
Jayaswal, R. K., Fernandez, M. a., & Schroeder, R. G. (1990). Isolation and
characterization of a Pseudomonas strain that restricts growth of various
phytopathogenic fungi. Applied and Environmental Microbiology, 56(4), 1053–
1058.
Jepsen, S. M., Adams, E. E., & Priscu, J. C. (2010). Sediment Melt-Migration Dynamics
in Perennial Antarctic Lake Ice. Arctic, Antarctic, and Alpine Research, 42(1),
57–66. doi:10.1657/1938-4246-42.1.57
Kerry, E. (1990). Effects of temperature on growth rates of fungi from subantarctic
Macquarie Island and Casey, Antarctica. Polar Biology, 10(4), 293–299.
doi:10.1007/BF00238428
Kuhnert, R., Oberkofler, I., & Peintner, U. (2012). Fungal Growth and Biomass
Development is Boosted by Plants in Snow-Covered Soil. Microbial Ecology,
64(1), 79–90. doi:10.1007/s00248-011-0001-y

62
Lee, S., & Taylor, J. (1992). Phylogeny of five fungus-like protoctistan Phytophthora
species, inferred from the internal transcribed spacers of ribosomal DNA. Mol.
Biol. Evol., 9(4), 636–653. Retrieved from
http://mbe.oxfordjournals.org/cgi/content/long/9/4/636
Levy, J. (2012). How big are the McMurdo Dry Valleys? Estimating ice-free area using
Landsat image data. Antarctic Science, 25(01), 119–120.
doi:10.1017/S0954102012000727
Lizotte, M. P., Sharp, T. R., & Priscu, J. C. (1996). Phytoplankton dynamics in the
stratified water column of Lake Bonney, Antarctica: I. Biomass and productivity
during the winter-spring transition. Polar Biology, 16(3), 155–162.
doi:10.1007/s003000050040
Ma, L., Catranis, C. M., Starmer, W. T., & Rogers, S. O. (1999). Revival and
characterization of fungi from ancient polar ice. Mycologist, 13(2), 70–73.
doi:10.1016/S0269-915X(99)80012-3
Ma, L.-J., Rogers, S. O., Catranis, C. M., & Starmer, W. T. (2000). Detection and
characterization of ancient fungi entrapped in glacial ice. Mycologia, 92(2), 286–
295. doi:10.2307/3761562
McKay, C. P., Clow, G. D., Wharton, R. A., & S, S. W. (1985). Thickness of ice on
perrenially frozen lakes. Nature, 318(14), 162–163. doi:10.1038/314731a0
Mends, M. T., Yu, E., Strobel, G., Syed, R., Booth, E., Geary, B., … Hadi, M. (2012). An
Endophytic Nodulisporium sp. Producing Volatile Organic Compounds Having
Bioactivity and Fuel Potential.
Moorhead, D. L., & Priscu, J. C. (1998). The McMurdo Dry Valley Ecosystem:
Organization, Controls and Linkages.
Morita, R. (1975). Psychrophilic bacteria. Bacteriological Reviews, 39(2), 144–167.
doi:10.1016/S0140-6736(59)91597-1
Mosier, A. C., Murray, A. E., & Fritsen, C. H. (2007). Microbiota within the perennial
ice cover of Lake Vida, Antarctica. FEMS Microbiology Ecology, 59(2), 274–
288. doi:10.1111/j.1574-6941.2006.00220.x
Nichols, D., Bowman, J., Sanderson, K., Nichols, C. M., Lewis, T., McMeekin, T., &
Nichols, P. D. (1999). Developments with Antarctic microorganisms: Culture
collections, bioactivity screening, taxonomy, PUFA production and cold-adapted
enzymes. Current Opinion in Biotechnology, 10(3), 240–246. doi:10.1016/S0958-
1669(99)80042-1

63
Nilsson, R. H., Kristiansson, E., Ryberg, M., Hallenberg, N., & Larsson, K. H. (2008).
Intraspecific ITS variability in the Kingdom Fungi as expressed in the
international sequence databases and its implications for molecular species
identification. Evolutionary Bioinformatics, 2008(4), 193–201.
doi:10.4137/EBO.S653
Onofri, S., Selbmann, L., De Hoog, G. S., Grube, M., Barreca, D., Ruisi, S., & Zucconi,
L. (2007). Evolution and adaptation of fungi at boundaries of life. Advances in
Space Research, 40(11), 1657–1664. doi:10.1016/j.asr.2007.06.004
Onofri, S., Selbmann, L., Zucconi, L., & Pagano, S. (2004). Antarctic microfungi as
models for exobiology. Planetary and Space Science, 52(1-3), 229–237.
doi:10.1016/j.pss.2003.08.019
Paerl, H. W., & Priscu, J. C. (1998). Microbial phototrophic, heterotrophic, and
diazotrophic activities associated with aggregates in the permanent ice cover of
Lake Bonney, Antarctica. Microbial Ecology, 36(3), 221–230.
doi:10.1007/s002489900109
Palmisano, A. C., & Simmons, G. M. (1987). Spectral downwelling irradiance in an
Antarctic lake. Polar Biology, 7(3), 145–151. doi:10.1007/BF00259202
Patel, A. (2006). Identification and comparison of fungi from different depths of ancient
glacial ice.
Perdomo, H., Sutton, D. A., Garcia, D., Fothergill, A. W., Gene, J., Cano, J., … Guarro,
J. (2011). Molecular and phenotypic characterization of phialemonium and
lecythophora isolates from clinical samples. Journal of Clinical Microbiology,
49(4), 1209–1216. doi:10.1128/JCM.01979-10
Poglazova, M. N., Mitskevich, I. N., Abyzov, S. S., & Ivanov, M. V. (2001).
Microbiological characterization of the accreted ice of subglacial Lake Vostok,
Antarctica. Mikrobiologiia, 70(6), 838–46. Retrieved from
http://www.ncbi.nlm.nih.gov/pubmed/11785141
Pohland, B., & Owen, B. (2009). TAS Technical Bulletin, 1–3.
Priscu, J., Achberger, A. M., Cahoon, J. E., Christner, B. C., Edwards, R. L., Jones, W.
L., … Vick-Majors, T. J. (2013). A microbiologically clean strategy for access to
the Whillans Ice Stream subglacial environment. Antarctic Science, 25(05), 637–
647. doi:10.1017/S0954102013000035

64
Priscu, J., Fritsen, C. H., Adams, E. E., Giovannoni, S. J., Paerl, H. W., McKay, C. P., …
Pinckney, J. L. (1998). Perennial Antarctic Lake Ice: An Oasis for Life in a Polar
Desert. Science (New York, N.Y.), 280(5372), 2095–2098.
doi:10.1126/science.280.5372.2095
Priscu, J., Wolf, C. F., Mikucki, J. A., Adams, E. E., Paerl, H. W., Fritsen, C. H., …
Lisle, J. T. (2005). Perennial Antarctic lake ice: A refuge for cyanobacteria in an
extreme environment. Life in Ancient Ice, (April), 22–49.
doi:10.1017/CBO9781107415324.004
Priscu, J., Powell, R., & Tulaczyk, S. (2010). Probing Subglacial Environments Under
the Whillans Ice Stream. Eos, Transactions American …, 91(29), 253–254.
doi:10.1126/science
Psenner, R., Willie, A., Priscu, J. C., Felip, M., Wagenbach, D., & Sattler, B. (2003).
Extremophiles: ice ecosystems and biodiversity. In Knowledge for sustainable
development. An insight into the Encyclopaedia of Life Support Systems (pp. 573–
598).
Robinson, C. H. (2001). Cold adaptation in Arctic and Antarctic fungi. New Phytologist,
151, 341–353. Retrieved from
http://www.jstor.org/stable/3697263\npapers2://publication/uuid/BA97B894-
9F3B-4A89-B87A-07FF2BE67EFB
Robinson, C. T., Gessner, M. O., Callies, K. a, Jolidon, C., & Ward, J. V. (2000). Larch
needle breakdown in contrasting streams of an alpine glacial floodplain. Journal
of the North American Benthological Society, 19(2), 250–262.
doi:10.2307/1468068
Ruisi, S., Barreca, D., Selbmann, L., Zucconi, L., & Onofri, S. (2007). Fungi in
Antarctica. Reviews in Environmental Science and Biotechnology, 6, 127–141.
doi:10.1007/s11157-006-9107-y
Šabacká, M., Priscu, J. C., Basagic, H. J., Fountain, A. G., Wall, D. H., Virginia, R. A., &
Greenwood, M. C. (2012). Aeolian flux of biotic and abiotic material in Taylor
Valley, Antarctica. Geomorphology, 155-156, 102–111.
doi:10.1016/j.geomorph.2011.12.009
Sati, S. C., Arya, P., & Belwal, M. (2009). Tetracladium nainitalense sp nov., a root
endophyte from Kumaun Himalaya, India. Mycologia, 101(5), 692–695. doi:Doi
10.3852/08-192

65
Selbmann, L., De Hoog, G. S., Mazzaglia, A., Friedmann, E. I., & Onofri, S. (2005).
Fungi at the edge of life: cryptoendolithic black fungi from Antarctic desert. Stud
Mycol, 51, 1–32.
Singh, M. P. (2009). Application of Biolog FF MicroPlate for substrate utilization and
metabolite profiling of closely related fungi. Journal of Microbiological Methods,
77(1), 102–108. doi:10.1016/j.mimet.2009.01.014
Skidmore, A., & Dickinson, H. (1976). Colony interactions and hyphal interference
between Septoria nodorum and phylloplane fungi. Transactions of the British
Mycological Society, 66(1), 57–64. doi:10.1016/S0007-1536(76)80092-7
Stefanowicz, A. (2006). the Biolog Plates Technique as a tool iin ecological studies of
microbial communities. Polish Journal of Environmental Studies, 15(5), 669–676.
Strobel, G. A., Dirksie, E., Sears, J., & Markworth, C. (2001). Volatile antimicrobial
from a novel endophytic fungus. Microbiology, 147(2001), 2943–2950.
Strobel, G. a., Knighton, B., Kluck, K., Ren, Y., Livinghouse, T., Griffin, M., … Sears, J.
(2008). The production of myco-diesel hydrocarbons and their derivatives by the
endophytic fungus Gliocladiurn roseum (NRRL 50072). Microbiology, 154(11),
3319–3328. doi:10.1099/mic.0.2008/022186-0
Stucky, B. J. (2012). SeqTrace: A Graphical Tool for Rapidly Processing DNA
Sequencing Chromatograms. Journal of Biomolecular Techniques : JBT, 23(3),
90–93. doi:10.7171/jbt.12-2303-004
Taylor, K. C., Mayewski, P. A., Alley, R. B., Brook, E. J., Gow, A. J., Grootes, P. M., …
Zielinski, G. A. (1997). The Holocene-Younger Dryas Transition Recorded at
Summit, Greenland. Science, 278(5339), 825–827.
doi:10.1126/science.278.5339.825
Timling, I., Walker, D. A., Nusbaum, C., Lennon, N. J., & Taylor, D. L. (2014). Rich and
cold: Diversity, distribution and drivers of fungal communities in patterned-
ground ecosystems of the North American Arctic. Molecular Ecology, 23(13),
3258–3272. doi:10.1111/mec.12743
Tomsheck, A. R., Strobel, G. a, Booth, E., Geary, B., Spakowicz, D., Knighton, B., …
Ezra, D. (2010). Hypoxylon sp., an endophyte of Persea indica, producing 1,8-
cineole and other bioactive volatiles with fuel potential. Microbial Ecology, 60(4),
903–14. doi:10.1007/s00248-010-9759-6
Tosi, S., Casado, B., Gerdol, R., & Caretta, G. (2002). Fungi isolated from Antarctic
mosses. Polar Biology, 25(4), 262–268. doi:10.1007/s00300-001-0337-8

66
Tsuji, M., Fujiu, S., Xiao, N., Hanada, Y., Kudoh, S., Kondo, H., … Hoshino, T. (2013).
Cold adaptation of fungi obtained from soil and lake sediment in the Skarvsnes
ice-free area, Antarctica. FEMS Microbiology Letters, 346(2), 121–130.
doi:10.1111/1574-6968.12217
Tulaczyk, S., Mikucki, J. A., Siegfried, M. R., Priscu, J. C., Barcheck, C. G., Beem, L.
H., … Schwartz, S. Y. (2014). WISSARD at Subglacial Lake Whillans, West
Antarctica: scientific operations and initial observations. Annals of Glaciology,
55(65), 51–58. doi:10.3189/2014AoG65A009
Ul-Hassan, S. R., Strobel, G., Booth, E., Knighton, B., Floerchinger, C., & Sears, J.
(2012a). Modulation of volatile organic compound formation in the Mycodiesel-
producing endophyte Hypoxylon sp. CI-4. Microbiology, 158(2012), 465–73.
doi:10.1099/mic.0.054643-0
Ul-Hassan, S. R., Strobel, G., Booth, E., Knighton, B., Floerchinger, C., & Sears, J.
(2012b). Modulation of volatile organic compound formation in the Mycodiesel-
producing endophyte Hypoxylon sp. CI-4. Microbiology, 158(2012), 465–73.
doi:10.1099/mic.0.054643-0
Vick, T., & Priscu, J. (2012). Bacterioplankton productivity in lakes of the Taylor Valley,
Antarctica, during the polar night transition. Aquatic Microbial Ecology, 68, 77–
90. doi:10.3354/ame01604
Vincent, W. F. (2000). Evolutionary origins of Antarctic microbiota: invasion, selection
and endemism. Antarctic Science, 12(03), 374–385.
doi:10.1017/S0954102000000420
Vishniac, H. S. (1996). Biodiversity of yeasts and filamentous microfungi in terrestrial
Antarctic ecosystems. Biodiversity and Conservation, 5(11), 1365–1378.
doi:10.1007/BF00051983
Wang, M., Jiang, X., Wu, W., Hao, Y., Su, Y., Cai, L., … Liu, X. (2015). Psychrophilic
fungi from the world’s roof. Persoonia, 100–112.
Weber, K. P., & Legge, R. L. (2010). Bioremediation, 599, 263–281. doi:10.1007/978-1-
60761-439-5
Wharton, R. A., McKay, C. P., Simmons, G. M., & Parker, B. C. (1986). Oxygen budget
of a perennially ice-covered Antarctic lake. Limnology and Oceanography, 31(2),
437–443.

67
Wharton, R. A., Simmons, G., & McKay, C. P. (1989). Perennially ice-covered Lake
Hoare, Antarctica: physical environment, biology and sedimentation.
Hydrobiologia, 172, 305–20. doi:10.1007/bf00031629
Wheatley, R. E. (2002). The consequences of volatile organic compound mediated
bacterial and fungal interactions. Antonie van Leeuwenhoek, International Journal
of General and Molecular Microbiology, 81(1-4), 357–364.
doi:10.1023/A:1020592802234
Williams, P. G., Roser, D. J., & Seppelt, R. D. (1994). Mycorrhizas of hepatics in
continental Antarctica. Mycological Research, 98(1), 34–36. doi:10.1016/S0953-
7562(09)80332-8
Wright, A., & Siegert, M. (2012). A fourth inventory of Antarctic subglacial lakes.
Antarctic Science, 24(06), 659–664. doi:10.1017/S095410201200048X
Yu, N. H., Kim, J. A., Jeong, M.-H., Cheong, Y. H., Hong, S. G., Jung, J. S., … Hur, J.-
S. (2013). Diversity of endophytic fungi associated with bryophyte in the
maritime Antarctic (King George Island). Polar Biology, 37(1), 27–36.
doi:10.1007/s00300-013-1406-5
Zak C J., Willig R. M., M. L. D., & H., W. G. (1994). Functional Diversity of Microbial
Communities: A Quantative Approach. Soil Biology and Biochemistry, 26(9),
1101–1108. doi:10.1016/0038-0717(94)90131-7
Zak, J., Willing, M., Moorhead, D., & Wildman, H. (1994). Functional Diversity of
Microbial Communities: A Quantative Approach. Soil Biology and Biochemistry,
26(9), 1101–1108. doi:10.1016/0038-0717(94)90131-7
Zucconi, L., Pagono, S., Fenice, M., Selbmann, L., Tosi, S., & Onofri, S. (1996). Growth
temperature preferences of fungal strains from Victoria Land, Antarctica. Polar
Biology, 16(1), 53–61. doi:10.1007/BF02388735

68
APPENDICES

69
APPENDIX A
GROWTH OF FUNGAL ISOLATES

70
Table A 1. Growth of four fungal isolates at seven different temperatures. Average (+/-
s.d.; n= 4) maximum diameter (cm) and the number of days required to reach this size are
shown for each isolate.

71
APPENDIX B
CARBON SUBSTRATE GUILDS

72
Table B.1. Carbon substrates found in the FF microtitre plates from BIOLOG, divided
into the substrate guilds suggested by Dobranic and Zak.
Number of
substrates
Wells Chemical guild Substrate Chemical
formula
1 H8 Amines/amides 2-Amino
ethanol
C2O7NO
2 B11 D-Glucosamine C6H13NO5
3 C2 Glucuronamide C6H11NO6
4 G7 L-Alaninamide C3H8N2O
5 H9 Putrescine C4H12N2
6 G3 Succinamic acid C4H7NO3
7 F1 Amino acids γ-Amino
butyric acid
C4H9NO2
8 H1 Glycyl-L-
glutamic acid
C7H12N2O5
9 G8 L-Alanine C3H7NO2
10 G9 L-Alanyl-
glycine
C5H10N2O3
11 G10 L-Asparagine C4H8N2O3
12 G11 L-Aspartic acid C4H7NO4
13 G12 L-Glutamic acid C5H9NO4
14 H2 L-Ornithine C5H12N2O2
15 H3 L-
Phenylalanine
C9H11NO2
16 H4 L-Proline C5H9NO2
17 H5 L-Pyroglutamic
acid
C5H7NO3
18 H6 L-Serine C3H7NO3

73
Table B.1. Continued
19 H7 L-Threonine C4H9NO3
20 B12 Carbohydrates α-D-Glucose C6H12O6
21 C8 α-D-Lactose C12H22O11
22 D5 α-Methyl-D-
galactoside
C7H14O6
23 D6 β-Methyl-D-
galactoside
C7H14O6
24 D7 α-Methyl-D-
glucoside
C7H14O6
25 D8 β-Methyl-D-
glucoside
C7H14O6
26 A6 Adonitol C5H12O5
27 A11 Arbutin C12H6O7
28 A8 D-Arabinose C5H10O5
29 A10 D-Arabitol C5H12O5
30 A12 D-Cellobiose C12H22O11
31 B5 D-Fructose C6H12O6
32 B7 D-Galactose C6H12O6
33 D1 D-Mannitol C6H14O6
34 D2 D-Mannose C6H12O6
35 D3 D-Melezitose C18H36O16
36 D4 D-Melibiose C12H22O11
37 D10 D-Psicose C6H12O6
38 D11 D-Rafinose C18H32O16
39 E1 D-Ribose C5H10O5
40 E4 D-Sorbitol C6H14O6

74
Table B.1. Continued
41 E8 D-Tagatose C6H12O6
42 E9 D-Trehalose C12H22O11
43 E12 D-Xylose C5H10O5
44 B9 Gentiobiose C12H22O11
45 B4 i-Erythritol C4H10O4
46 C9 Lactulose C12H22O11
47 A9 L-Arabinose C5H10O5
48 B6 L-Fucose C6H12O5
49 D12 L-Rhamnose C6H12O5
50 E5 L-Sorbose C6H12O6
51 C10 Maltitol C12H24O11
52 C11 Maltose C12H22O11
53 C12 Maltotriose C18H32O16
54 C6 m-Inositol C6H12O6
55 A3 N-Acetyl-D-
galactosamine
C8H15NO6
56 A4 N-Acetyl-D-
glucosamine
C8H15NO6
57 A5 N-Acetyl-D-
mannosamine
C8H15NO6
58 D9 Palatinose C12H22O11
59 E3 Sedoheptulosan C7H12O6
60 E6 Stachyose C24H42O21
61 E7 Sucrose C12H22O11
62 E10 Turanose C12H22O11

75
Table B.1. Continued
63 E11 Xylitol C5H12O5
64 F4 Carboxylic
acids
β-Hydroxy
butyric acid
C4H8O3
65 F5 γ-Hydroxy
butyric acid
C4H8O3
66 F7 α-Keto glutaric
acid
C5H8O5
67 C7 2-Keto-D-
gluconic acid
C6H9O7
68 B8 D-Galacturonic
acid
C6H10O7
69 B10 D-Gluconic
acid
C6H12O7
70 C3 D-Glucuronic
acid
C6H10O7
71 F10 D-Malic acid C4H6O5
72 G1 D-Saccharic
acid
C6H10O8
73 F3 Fumaric acid C4H4O4
74 F9 L-Lactic acid C3H6O3
75 F11 L-Malic acid C4H6O5
76 G6 N-Acetyl-L-
glutamic acid
C7H11NO5
77 F6 p-Hydroxy
phenylacetic
acid
C8H8O3
78 F12 Quinic acid C7H12O6
79 G2 Sebacic acid C10H18O4

76
Table B.1. Continued
80 G4 Succinic acid C4H6O4
81 H10 Miscellaneous Adenosine C10H13N5O4
82 A7 Amygdalin C20H27NO11
83 H12 Adenosine-5P-
monophosphate
C10H14N5O7P
84 F2 Bromo succinic
acid
C4H5O4Br
85 F8 D-Lactic acid
methyl ester
C4H8O3
86 C1 Glucose-1-
phosphate
C6H13O9P
87 C4 Glycerol C3H8O3
88 E2 Salicin C13H18O7
89 G5 Succinic acid
mono-methyl
ester
C5H8O4
90 H11 Uridine C9H12N2O6
91 B1 Polymers α-Cyclodextrin C36H60O30
92 B2 β-Cyclodextrin C42H70O35
93 B3 Dextrin C6H10O5
94 C5 Glycogen (C6H10O5)n
95 A2 Tween 80

77
APPENDIX C
HEAT MAPS OF FUNGAL ISOLATES

78
1 2 3 4 5 6 7 8 9 10 11 12
A 0.189 0.231 0.211 0.283 0.256 0.324 0.280 0.349 0.322 0.288 0.138 0.175
B 0.419 0.165 0.285 0.189 0.223 0.311 0.317 0.227 0.115 0.080 0.088 0.171
C 0.197 0.155 0.166 0.185 0.202 0.181 0.245 0.226 0.265 0.140 0.135 0.132
D 0.153 0.162 0.146 0.152 0.133 0.143 0.126 0.241 0.249 0.084 0.083 0.135
E 0.292 0.157 0.140 0.175 0.160 0.149 0.148 0.096 0.147 0.130 0.118 0.219
F 0.146 0.147 0.148 0.143 0.143 0.127 0.140 0.135 0.129 0.092 0.109 0.112
G 0.194 0.420 0.158 0.174 0.135 0.150 0.128 0.143 0.148 0.123 0.119 0.118
H 0.163 0.154 0.196 0.152 0.143 0.124 0.105 0.198 0.094 0.312 0.114 0.084
Figure C.1. Heat map for T. ellipsoideum at 4°C at 490nm
1 2 3 4 5 6 7 8 9 10 11 12
A 0.146 0.228 0.223 0.210 0.187 0.166 0.155 0.230 0.206 0.129 0.103 0.018
B 0.238 0.223 0.276 0.186 0.202 0.215 0.178 0.160 0.165 0.166 0.128 0.097
C 0.186 0.224 0.223 0.248 0.254 0.229 0.240 0.212 0.192 0.188 0.158 0.118
D 0.162 0.230 0.253 0.219 0.213 0.222 0.195 0.194 0.177 0.163 0.135 0.109
E 0.262 0.197 0.238 0.287 0.262 0.237 0.262 0.229 0.233 0.184 0.173 0.183
F 0.168 0.207 0.201 0.205 0.195 0.219 0.224 0.194 0.179 0.172 0.144 0.104
G 0.155 0.428 0.216 0.178 0.208 0.195 0.173 0.184 0.173 0.172 0.130 0.098
H 0.146 0.121 0.247 0.232 0.287 0.182 0.205 0.279 0.173 0.210 0.144 0.100
Figure C.2. Heat map for T. ellipsoideum at 24°C at 490nm
More respiration to less respiration

79
1 2 3 4 5 6 7 8 9 10 11 12
A 0.127 0.157 0.150 0.133 0.116 0.077 0.070 0.123 0.094 0.079 0.074 0.101
B 0.369 0.124 0.147 0.068 0.075 0.095 0.083 0.033 0.069 0.028 0.018 0.115
C 0.147 0.115 0.134 0.124 0.133 0.106 0.107 0.083 0.097 0.086 0.043 0.079
D 0.102 0.088 0.092 0.109 0.077 0.082 0.096 0.101 0.069 0.053 0.032 0.064
E 0.185 0.123 0.100 0.115 0.099 0.074 0.070 0.077 0.063 0.067 0.061 0.085
F 0.107 0.083 0.073 0.095 0.076 0.065 0.084 0.058 0.057 0.064 0.045 0.048
G 0.163 0.309 0.097 0.105 0.116 0.084 0.059 0.081 0.076 0.070 0.055 0.058
H 0.139 0.097 0.146 0.109 0.105 0.081 0.072 0.141 0.060 0.096 0.076 0.067
Figure C.3. Heat map for Unknown Ascomycota at 4°C at 490nm
1 2 3 4 5 6 7 8 9 10 11 12
A 0.121 0.155 0.181 0.186 0.156 0.126 0.120 0.176 0.170 0.095 0.081 0.019
B 0.242 0.147 0.258 0.155 0.158 0.157 0.140 0.119 0.146 0.123 0.101 0.090
C 0.176 0.186 0.180 0.197 0.236 0.197 0.228 0.179 0.164 0.151 0.109 0.073
D 0.150 0.179 0.142 0.177 0.168 0.191 0.169 0.143 0.154 0.134 0.113 0.062
E 0.204 0.190 0.178 0.172 0.210 0.180 0.176 0.187 0.190 0.172 0.172 0.090
F 0.119 0.166 0.176 0.171 0.174 0.175 0.187 0.130 0.147 0.135 0.121 0.050
G 0.180 0.393 0.168 0.161 0.178 0.175 0.156 0.150 0.135 0.124 0.095 0.027
H 0.128 0.148 0.198 0.145 0.157 0.133 0.135 0.193 0.098 0.118 0.072 0.048
Figure C.4. Heat map for Unknown Ascomycota at 24°C at 490nm
More respiration to less respiration

80
1 2 3 4 5 6 7 8 9 10 11 12
A 0.140 0.152 0.152 0.184 0.089 0.085 0.070 0.130 0.111 0.099 0.101 0.120
B 0.345 0.119 0.173 0.050 0.098 0.085 0.078 0.043 0.090 0.059 0.031 0.158
C 0.135 0.065 0.078 0.114 0.233 0.100 0.167 0.117 0.095 0.080 0.087 0.101
D 0.071 0.145 0.062 0.101 0.079 0.089 0.048 0.058 0.057 0.053 0.041 0.093
E 0.153 0.097 0.069 0.100 0.099 0.076 0.097 0.077 0.084 0.062 0.038 0.082
F 0.079 0.070 0.053 0.068 0.076 0.082 0.072 0.035 0.033 0.031 0.032 0.055
G 0.097 0.213 0.059 0.050 0.057 0.053 0.074 0.056 0.046 0.062 0.048 0.056
H 0.069 0.078 0.141 0.081 0.059 0.059 0.057 0.059 0.078 0.266 0.061 0.067
Figure C.5. Heat map for Mucor at 4°C at 490nm
1 2 3 4 5 6 7 8 9 10 11 12
A 0.154 0.316 0.222 0.683 0.135 0.165 0.187 0.164 0.212 0.199 0.337 0.351
B 0.257 0.118 0.275 0.091 0.214 0.136 0.308 0.053 0.279 0.117 0.074 0.386
C 0.310 0.161 0.137 0.264 0.248 0.164 0.305 0.166 0.173 0.148 0.260 0.155
D 0.189 0.306 0.151 0.190 0.150 0.165 0.097 0.193 0.147 0.126 0.094 0.150
E 0.265 0.271 0.136 0.273 0.275 0.197 0.151 0.136 0.346 0.128 0.228 0.358
F 0.140 0.128 0.261 0.108 0.200 0.140 0.373 0.149 0.268 0.211 0.197 0.130
G 0.196 0.401 0.166 0.230 0.116 0.167 0.197 0.445 0.304 0.199 0.213 0.333
H 0.270 0.150 0.248 0.155 0.101 0.139 0.170 0.148 0.201 0.080 0.092 0.115
Figure C.6. Heat map for Mucor at 24°C at 490nm
More respiration to less respiration

81
1 2 3 4 5 6 7 8 9 10 11 12
A 0.145 0.248 0.176 0.181 0.142 0.107 0.083 0.177 0.131 0.091 0.091 0.099
B 0.340 0.112 0.228 0.073 0.119 0.091 0.077 0.025 0.098 0.027 0.044 0.167
C 0.148 0.090 0.115 0.195 0.144 0.105 0.161 0.117 0.118 0.093 0.120 0.117
D 0.111 0.174 0.152 0.116 0.091 0.117 0.085 0.115 0.110 0.057 0.043 0.112
E 0.197 0.112 0.095 0.143 0.131 0.108 0.130 0.127 0.147 0.080 0.073 0.170
F 0.112 0.096 0.100 0.079 0.080 0.060 0.102 0.074 0.091 0.050 0.050 0.093
G 0.165 0.286 0.123 0.089 0.082 0.105 0.101 0.104 0.085 0.046 0.070 0.075
H 0.125 0.130 0.169 0.134 0.108 0.104 0.082 0.104 0.068 0.152 0.077 0.061
Figure C.7. Heat map for L. hoffmannii at 4°C at 490nm
1 2 3 4 5 6 7 8 9 10 11 12
A 0.106 0.571 0.161 0.509 0.125 0.114 0.208 0.235 0.357 0.148 0.398 0.494
B 0.109 0.168 0.286 0.112 0.268 0.085 0.213 0.168 0.269 0.152 0.135 0.419
C 0.197 0.083 0.248 0.428 0.321 0.219 0.173 0.206 0.127 0.243 0.383 0.499
D 0.282 0.307 0.288 0.134 0.116 0.239 0.118 0.287 0.265 0.180 0.070 0.296
E 0.266 0.303 0.151 0.335 0.350 0.161 0.167 0.163 0.489 0.165 0.199 0.595
F 0.231 0.150 0.171 0.170 0.307 0.176 0.189 0.184 0.193 0.131 0.106 0.591
G 0.148 0.355 0.274 0.184 0.237 0.194 0.247 0.465 0.183 0.266 0.335 0.519
H 0.141 0.205 0.233 0.206 0.518 0.155 0.220 0.208 0.172 0.139 0.134 0.117
Figure C.8. Heat map for L. hoffmannii at 24°C at 490nm
More respiration to less respiration