physioex: visual analysis of physiological event...
TRANSCRIPT

PhysioEx: Visual Analysis of
Physiological Event Streams
Rishi Kamaleswaran1,2, Christopher Collins1, Andrew James2, Carolyn McGregor1
1University of Ontario Institute of Technology, Canada2The Hospital for Sick Children, Canada
@rkamaleswaran
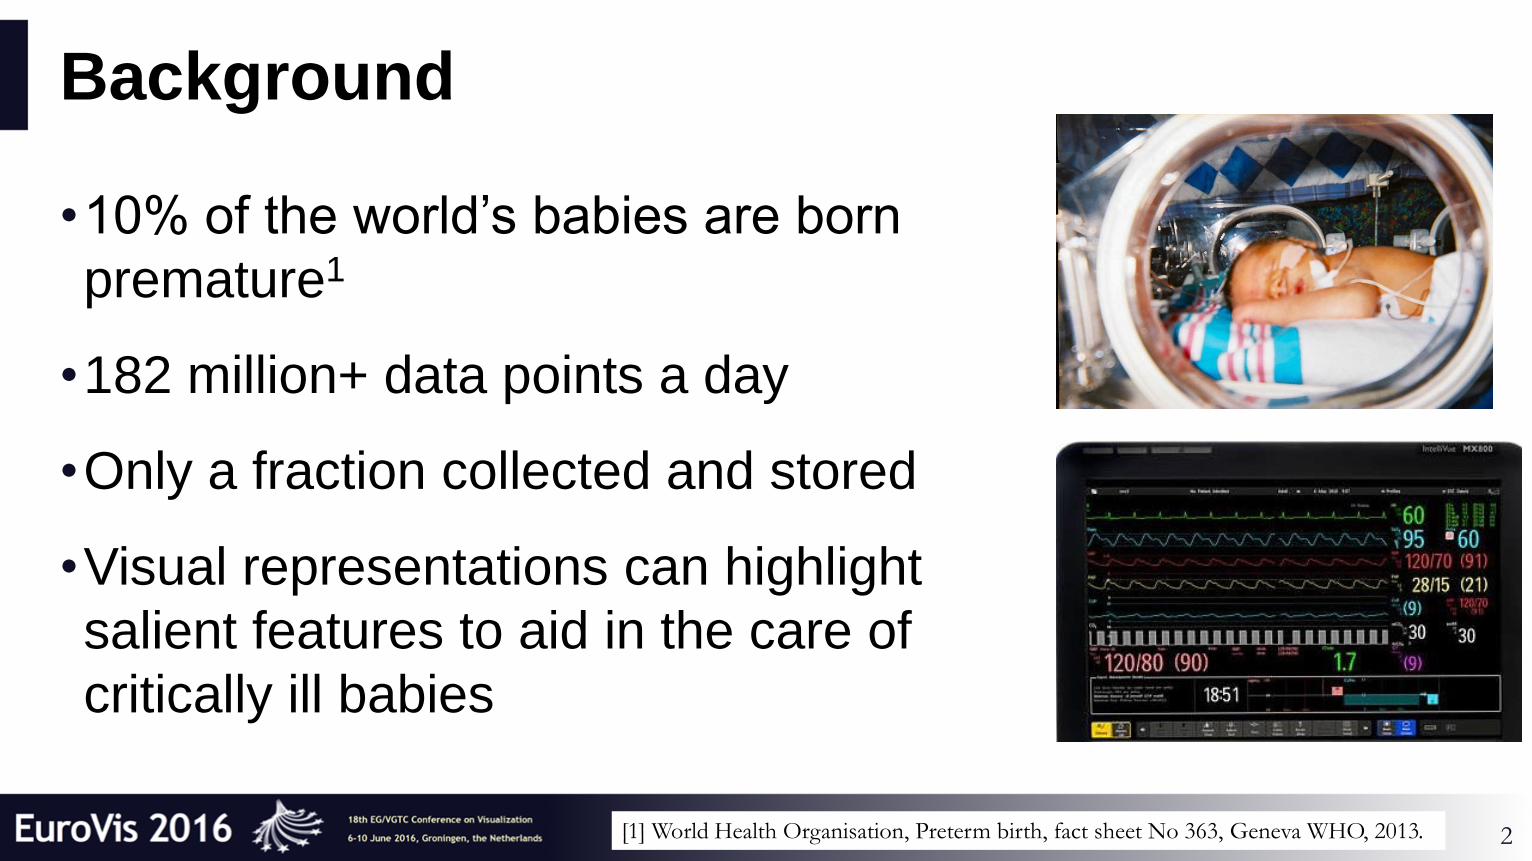
Background
•10% of the world’s babies are born
premature1
•182 million+ data points a day
•Only a fraction collected and stored
•Visual representations can highlight
salient features to aid in the care of
critically ill babies
2[1] World Health Organisation, Preterm birth, fact sheet No 363, Geneva WHO, 2013.

Artemis Platform
3
1089 patients recruited (~3 trillion samples)

Problem Characterization
• Apnoea of prematurity: Gap in breathing of more than 20 seconds2
• Hard to know that a baby is apnoeic
• Bed-side staff broadly classify any cardiorespiratory event as a “spell”
• Specialists and extensive monitoring required to diagnosis
• An algorithm was developed that automated the classification of neonatal spells3
• Neonatal Sepsis is infection acquired in the hospital
• Interest in predicting sepsis using neonatal spells data
4[2] Thommandram A, Pugh JE, Eklund JM, McGregor C, James AG. Classifying neonatal spells using real-time temporal analysis of
physiological data streams: Algorithm development. Point-of-Care Healthcare Technologies (PHT), 2013 IEEE. 2013. p. 240–3.

Related Work
5
Identifying correlations across three physiologic data streams3
[3] Pugh E, Thommandram A, Ng E, McGregor C, Eklund M, Narang I, et al. Classifying neonatal spells using real-time temporal
analysis of physiological data streams—algorithm development. Journal of Critical Care. 2013;28(1):e9.

Absolute Relative
Heart Rate < 100 (Preterm)
< 80 (Term)
> 10% fall from 30s baseline
Respiratory Rate > 20 seconds Pause greater than two
breaths
Saturation < 80% (Preterm)
< 92% (Term)
> 10% fall from 30s baseline
Event Classification Algorithm
6

Events as Sequences
7
1 2 3 4 5
Central ↓ Resp. ↓ Heart Rate ↓ O2 ↑ Resp. ↑ Heart Rate
Vagal↓ Resp.
↓ Heart Rate
↓ O2 ↑ Resp.
↑ Heart Rate
Obstructive↓ Heart Rate
(Incremental)↓ O2 ↑ Heart Rate
Obstructive
Central
↓ Heart Rate
(Incremental)↓ O2 ↓ Resp. ↑ Resp. ↑ Heart Rate
Central
Obstructive↓ Resp. ↓ Heart Rate ↓ O2 ↑ Resp. ↓ Heart Rate
Desaturation ↓ O2
Bradycardia ↓ Heart Rate

Task Analysis
8
[T1]• Identify the Point of Suspicion of Infection (PSI)
[T2]• Identify events in the respiratory physiologic signal before PSI
[T3]• Analyse events across heart rate and oxygen (SpO2) streams
[T4]• Identify abnormal events
[T5]• Create mental temporal map of underlying physiology
Domain experts with at least five years of neonatal experiences were solicited.

Design of PhysioEx
9

Kernel Density Estimation
10
Kernels are aggregated and used to determine vertical binning
Frequency score generated for each vertical bins, and used to control opacity
Horizontal stacking for each hour of data
De
nsity
Length

KDE Histogram to Temporal Intensity Maps
11
t0 graph
t0 map
t0 t1 t2 … tn
0 10 20 30 40 50
Pause Lengths
01
02
03
04
05
0
Pa
use
Le
ng
ths
Time

Temporal Intensity Maps
12[4] Kamaleswaran R, et al. IEEE EHRVis. 2014.
Highlight salience in physiologic events4

13
Da
te (
Da
y,
Mo
nth
)
Hour

14
Du
rati
on
in
Se
co
nd
s
Time

15
2
1
3

Expert Evaluation
• Participants: 4 domain experts
• Tasks: Exploratory Comparisons
• Treatment: PhysioEx and Stacked Bar Display
• Data Collection: Observation, Semi-structured interviews
16

Expert Evaluation
Generated counter evidence about the relationship between neonatal spells and sepsis.
Subjective Feedback:
• Greater advantage to explain neonatal spells behaviour than the alternative.
“now inclined to invest a day in training a neonatal fellow so they would be better able to describe physiological behaviour of spells”
• SequenceGraph provided a unique ability to recognize patterns that commonly occur at various times of the day– novel insight generated.
• Raw Data View closed the loop.
17

Limitations:
• Tested PhysioEx with four domain experts.
• Results extend to a single tertiary teaching hospital in North America.
• Did not integrate clinical contextual data (nursing notes, dx histories).
Future Work:
• Develop an automated adaptive KDE algorithm to automate bandwidth and threshold selections.
• Evaluate PhysioEx in other case studies involving larger participant groups.
18

Take home message
• Interpreting non stationary and heavy-tailed waveform data streams is an open challenge.
• One method is to use adaptive nonparametric models like KDE to expose density.
• The Temporal Intensity Map was more descriptive than stacked bar.
• ‘Closing the loop’ a factor when novel tools introduced.
• PhysioEx is a step towards addressing these problems.
19

Thank you!
20
@rkamaleswaran
Funding Support:
Contacts:
linkedin.com/in/rkamaleswaran
Special thanks to our
anonymous clinical experts!
Acknowledgements:

Temporal Intensity Maps (construction)
21