physics results with polarized electrons at slac*
TRANSCRIPT
SLAC-PUB-6998
March 1996
V/E)
PHYSICS RESULTS WITH POLARIZED ELECTRONS AT SLAC*
Charles Y. Prescott
Stanford Linear Accelerator Center Stanford University, Stanford CA 94309
e-mail: [email protected]
ABSTRACT Performance of the polarized electron source at SLAC is briefly summa-
rized. Recent results for the spin structure of the nucleon and for electroweak asymmetries in the SLD detector are reported.
1 Introduction
Polarized electron beams can play an important role in the dynamics of in- teractions at high energies. P o arized 1 electron beams at SLAC have been an important part of the physics program since 1970, when they were first pro- posed for use in testing the spin structure of the proton. Since 1992, the SLAC linear accelerator and the SLC have operated solely with polarized electrons, providing data for tests of QCD in studies of the spin structure of the nucleon and tests of the electroweak sector of the Standard Model. In the following sections, the performance of the source is summarized, and some of the recent results using the polarized beams are discussed.
2 The Performance of the Polarized Electron Source
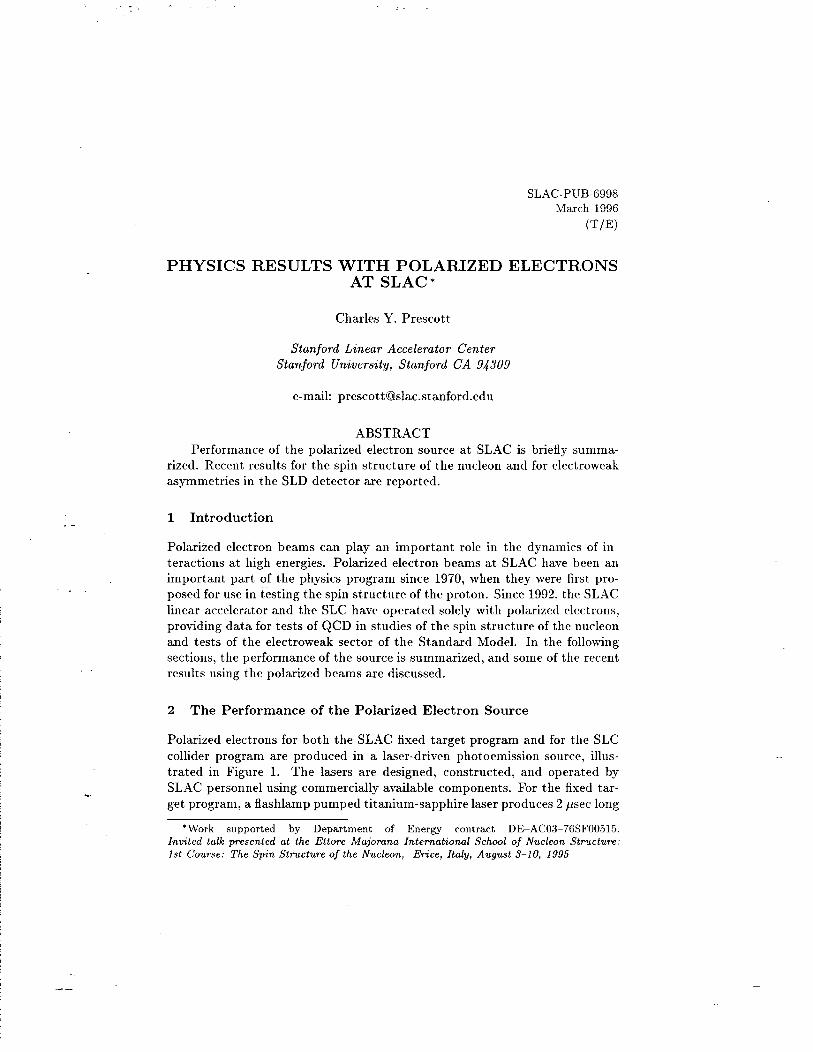
Polarized electrons for both the SLAC fixed target program and for the SLC collider program are produced in a laser-driven photoemission source, illus- trated in Figure 1. The lasers are designed, constructed, and operated by SLAC personnel using commercially available components. For the fixed tar- get program, a flashlamp pumped titanium-sapphire laser produces 2 psec long
*Work supported by Department of Energy contract DE~AC03~76SF00515.
Invited talk presented at the Ettore Majomna International School of Nucleon Structure:
1st Course: The Spin Structure of the Nucleon, Erice, Italy, August 3-10, 1995
YAG-pumped Ti:S
’ i65-650nm Left or Right
Circular Polarizer Circularly Polarized Light
1-, Lens for Focusing
and Steering Beam
Thermionic Gun P lunoolarized)
1
Linearly Polarized \ Light Laser Pulse
Chopper 2 ns or Tophat Laser
Pulse Shaper ,1.2 w
%4 Accelerate/r Section
Figure 1: The layout of the lasers and the polarized electron gun at the accelerator injector is shown schematically. Two types of lasers are used, one for the SLC, which produces two 2
nsec pulses separated by 61 nsec, and one for the fixed target experiments, which produces a 2 pet long pulse.
pulses, while for the SLC operations, two 2 nsec long pulses, separated by 61 nsec, are produced. The lasers operate at at X = 850 nm and 120 Hz. Circular polarization is achieved with a Pockels cell which provides + or - helicity in a randomized pattern at the 120 Hz rate. An optical transport system delivers the laser beam onto a gallium arsenide cathode inside the gun structure. Pho- toemitted electrons, longitudinally polarized, exit the gun at 120 KeV kinetic energy and are deflected onto the axis of the accelerator by a bending magnet.
The development of gallium arsenide (GaAs) for use as a cathode in a po- larized electron source originated in ETH Ziirich’ and has been developed over a number of years at SLAC and elsewhere? Several types of GaAs-related cath- ode materials have been used with good results. In 1991, advent of the strained GaAs materials significantly improved the electron polarization for photoemis- sion at long wavelengths, X M 850 nm? At SLAC, three cathodes types have been used for physics runs; (i) bulk GaAs; (ii) Al-GaAs, and (iii) strained
2
0 ’ / I I I I
600 700 800
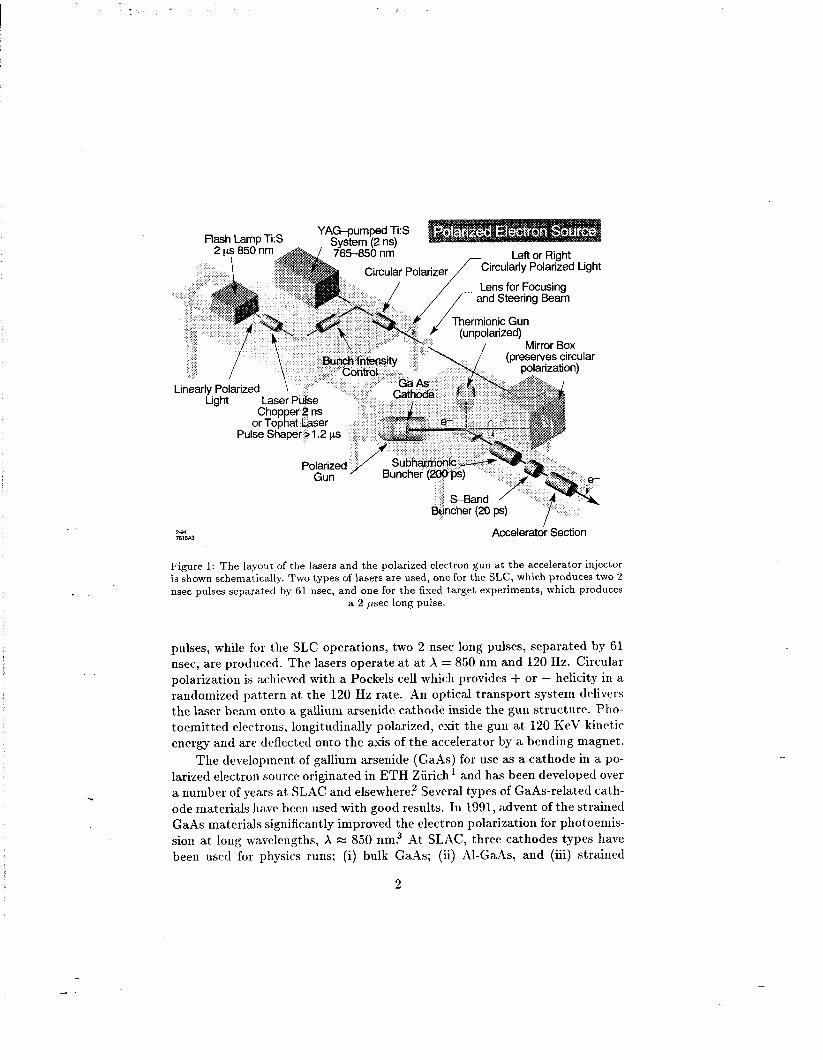
Figure 2: The polarization versus wavelength for three different cathodes that have run on the SLAC accelerator. The bulk GaAs cathode delivered beam to the SLC in 1992. The
AlGaAs cathode was used for a fixed target experiment in 1992. The strained GaAs cathode
has been used for both fixed target running and SLC since 1993.
GaAs. Figure 2 shows the polarization versus wavelength of the (circularly- polarized) laser light for these cathodes.
Strained GaAs cathodes consist of a thin layer of ordinary GaAs deposited (by the MBE or MOCVD process4) on a thick layer of GaAsP. The lattice spacing of these two materials differ by about 1%. The thin GaAs surface layer is compressed and distorted by the thicker GaAsP underlayer. Internal fields in the compressed GaAs lattice perturb the energy levels and break a degeneracy in the level structure of the valence band. The result for polarization is seen in Figure 2, where a rapid increase in polarization occurs for X beyond 800 nm. The SLAC lasers are tuned to 850 nm to give optimal polarizations of M 80%.
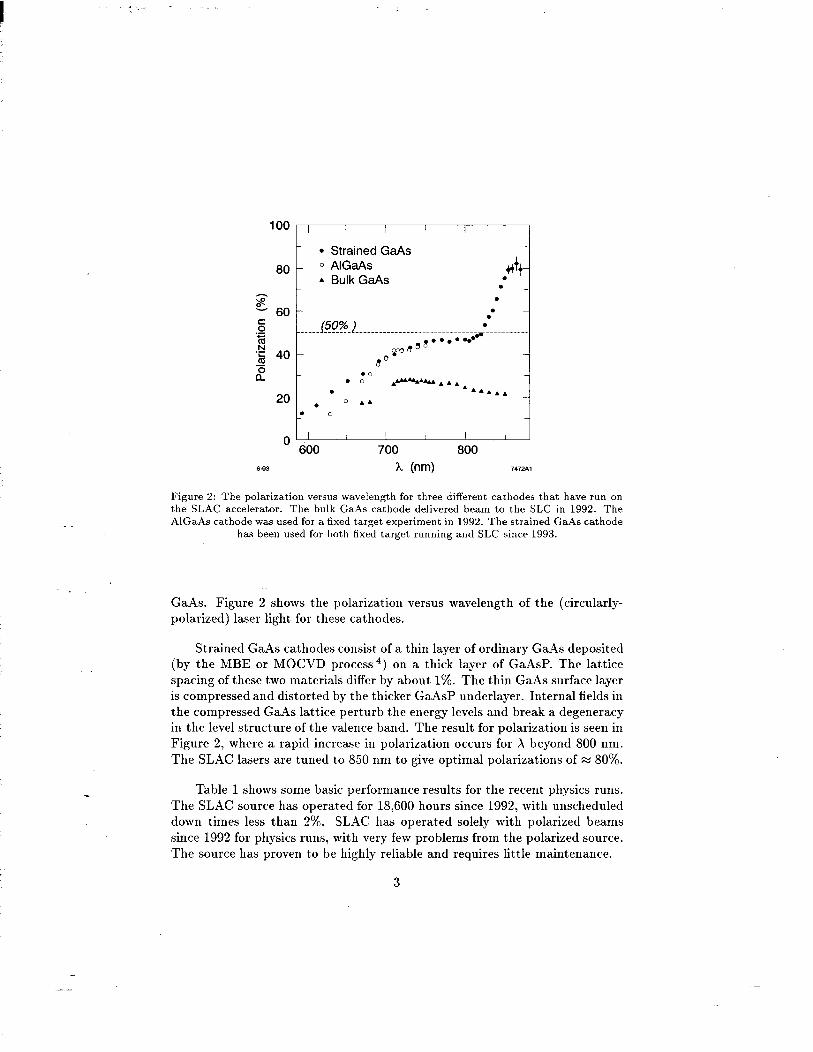
Table 1 shows some basic performance results for the recent physics runs. The SLAC source has operated for 18,600 hours since 1992, with unscheduled down times less than 2%. SLAC has operated solely with polarized beams since 1992 for physics runs, with very few problems from the polarized source. The source has proven to be highly reliable and requires little maintenance.
3
--
. -
Table 1: Performance Summary for the SLAC Polarized Electron Source
Year 1 Experiment 1 Cathode Material 1 Polarization (%) 1 Hours* 1
1992 SLD Ga-As 22 I 4000 I 1992 El42 (n) Al-Ga-As 40 1100
1993 SLD strained Ga -As 63 5300 1993/1994 El43 (p/d) strained Ga-As 84 2200 1994/1995 SLD strained Ga-As 77 6000
Total 18,600
* availability 2 98 %
3 QCD Physics: The Spin Structure of the Nucleon
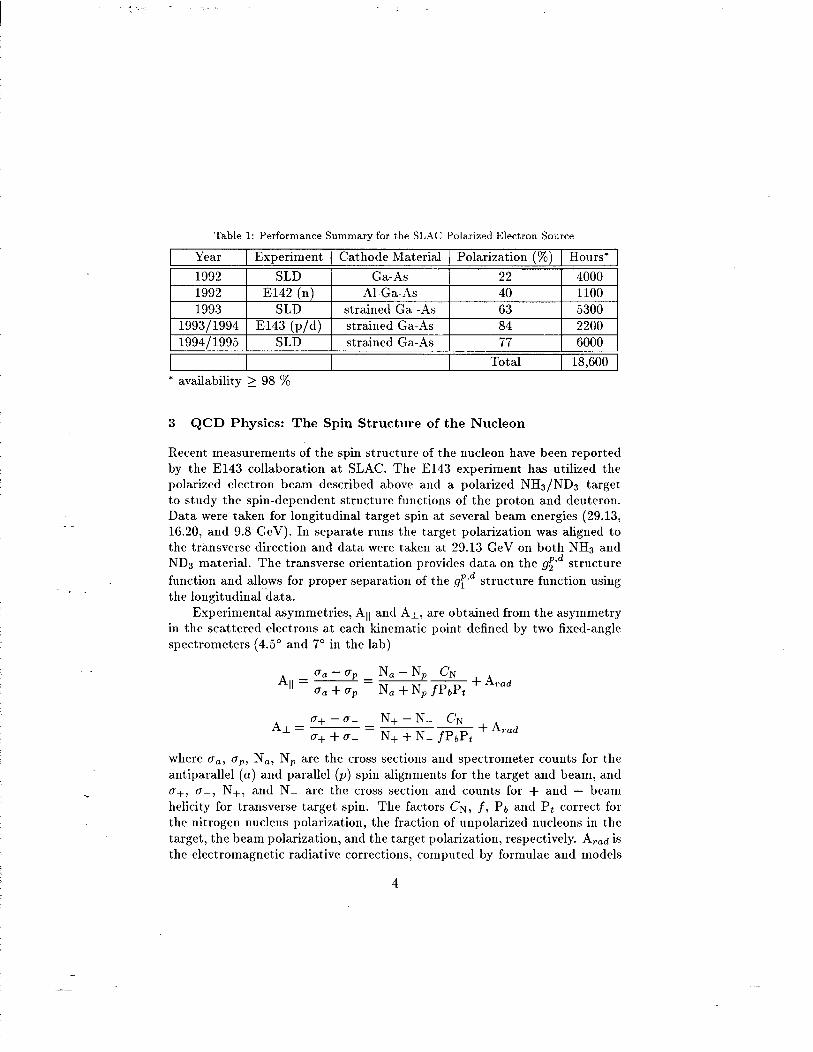
Recent measurements of the spin structure of the nucleon have been reported by the El43 collaboration at SLAC. The El43 experiment has utilized the polarized electron beam described above and a polarized NHa/NDa target to study the spin-dependent structure functions of the proton and deuteron. Data were taken for longitudinal target spin at several beam energies (29.13, 16.20, and 9.8 GeV). In separate runs the target polarization was aligned to the transverse direction and data were taken at 29.13 GeV on both NH3 and ND3 material. The transverse orientation provides data on the &‘I” structure
function and allows for proper separation of the &ld structure function using the longitudinal~data.
Experimental asymmetries, All and Al, are obtained from the asymmetry in the scattered electrons at each kinematic point defined by two fixed-angle spectrometers (4.5” and 7” in the lab)
u, - up _ N, - N, A,, = - -
CN
ga + ap - + &ad
N, + N, fpd’t
Al= CL+ - u- N+-N- CN
‘T+ +a- - + &ad
= N+ + N- fPbPt
where era, ap, N,, N, are the cross sections and spectrometer counts for the antiparallel (u) and p arallel (p) spin alignments for the target and beam, and o+, g--, N+, and N- are the cross section and counts for + and - beam helicity for transverse target spin. The factors CN, f, Pb and P2 correct for the nitrogen nucleus polarization, the fraction of unpolarized nucleons in the target, the beam polarization, and the target polarization, respectively. Arad is the electromagnetic radiative corrections, computed by formulae and models
4
z 0.2 *- a
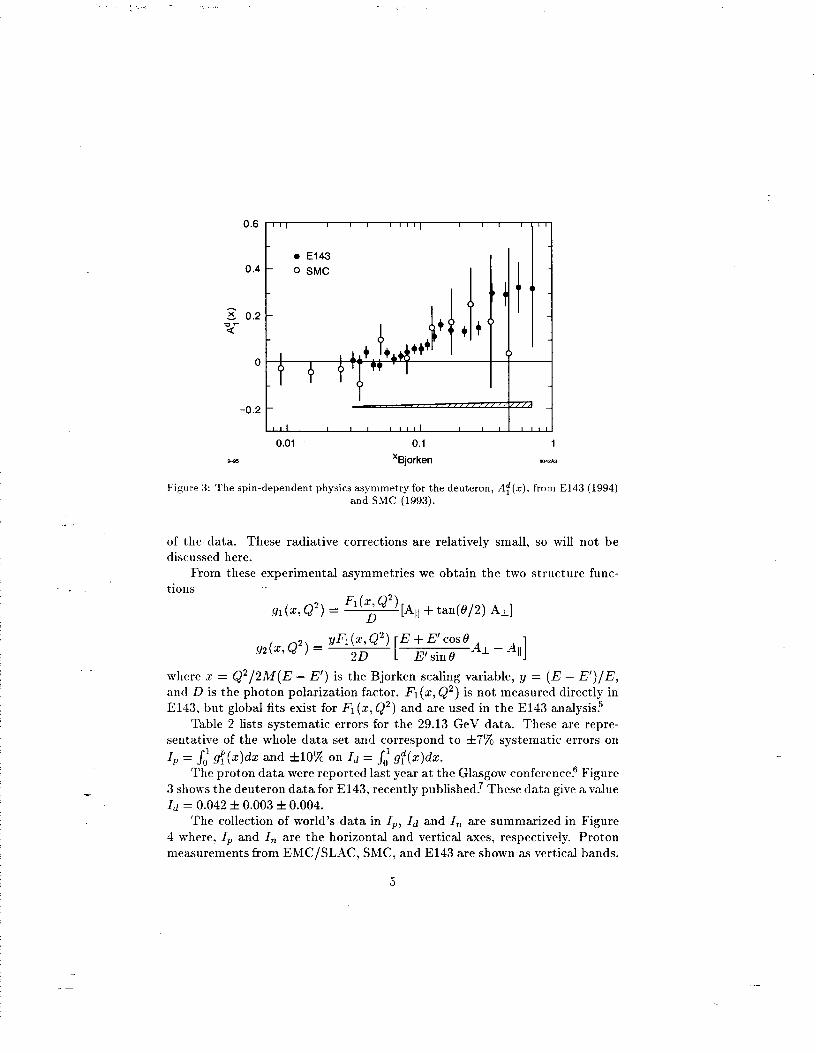
Figure 3: The spin-dependent physics asymmetry for the deuteron, A!(z), from El43 (1994) and SMC (1993).
. -
of the data. These radiative corrections are relatively small, so will not be discussed here.
Frorn these experimental asymmetries we obtain the two structure func- tions
gr (2, Q2) = F1(>Q2) [All + tan(8/2) Al]
gz(z, Q2) = yFl(z,Q2) E + E’cosB
20 [ E’ sin 0 -41 - Ail]
where 5 = Q2/2M(E - E’) is the Bjorken scaling variable, y = (E - E/)/E,
and D is the photon polarization factor. F~(z, Q2) is not measured directly in E143, but global fits exist for Fl(z, Q2) and are used in the El43 analysis?
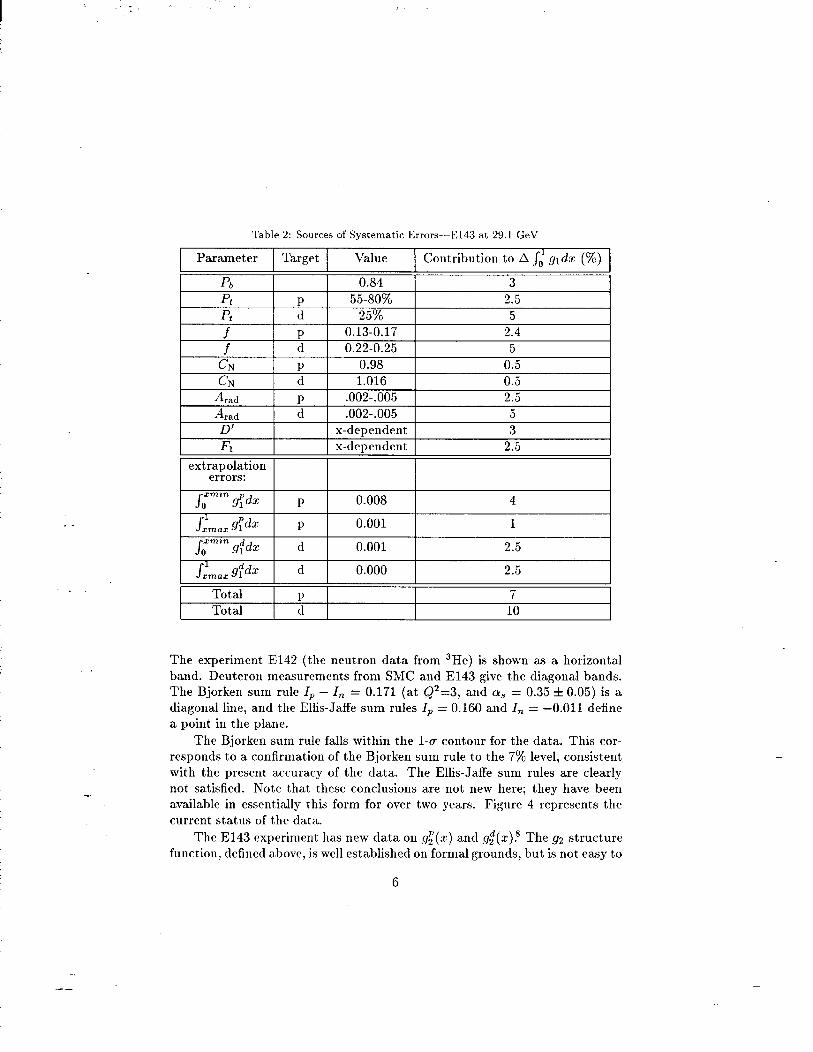
Table 2 lists systematic errors for the 29.13 GeV data. These are repre- sentative of the whole data set and correspond to f7% systematic errors on
Ip = Jo1 g:(z)& and &lo% on Id = &‘g~($)&r. The proton data were reported last year at the Glasgow conference.6 Figure
3 shows the deuteron data for E143, recently published: These data give a value Id = 0.042 f 0.003 f 0.004.
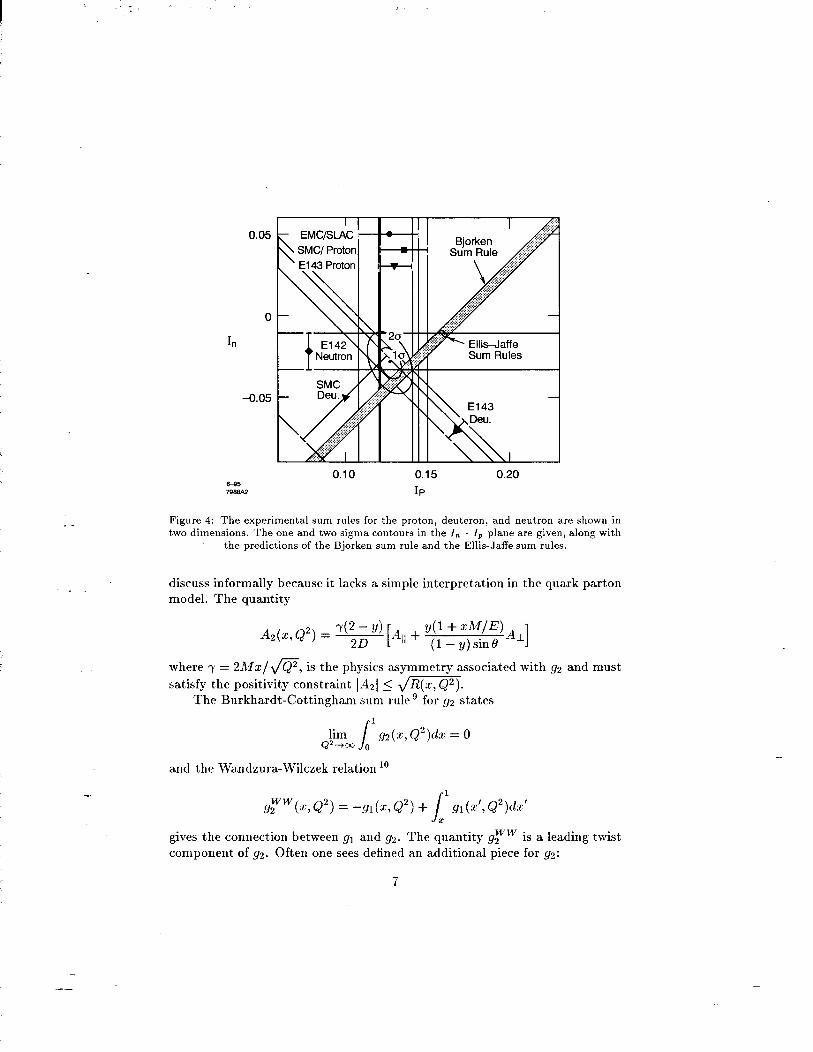
The collection of world’s data in Ip, Id and I, are summarized in Figure
4 where, Ip and In are the horizontal and vertical axes, respectively. Proton measurements from EMC/SLAC, SMC, and El43 are shown as vertical bands.
5
. -
Table 2: Sources of Systematic Errors---E143 at 29.1 GeV
Parameter Target Value Contribution to A si grdz (%)
pb 0.84 3
pt 55-80% 2.5
Pt 5; 25% 5
f i;
0.13-0.17 2.4 f 0.22-0.25 5 d I I I
CN I P I 0.98 0.5
CiU I il I 1.016 0.5 A rad 1 p 1 .002-.oo 5 1 2.5
I Ararl I d I .002-.005 1 5 D’
FI
extrapolation
x-dependent x-dependent
errors:
Sfmzn gfdz p 0.008 4
d
0.001 1
0.001 2.5
s,‘,,, ddx d 0.000 2.5
Total ~- 7 Total t; 10
The experiment El42 (the neutron data from 3He) is shown as a horizontal band. Deuteron measurements from SMC and El43 give the diagonal bands. The Bjorken sum rule Ip - I, = 0.171 (at Q2=3, and (Y, = 0.35 f 0.05) is a diagonal line, and the Ellis-Jaffe sum rules Ip = 0.160 and I, = -0.011 define a point in the plane.
The Bjorken sum rule falls within the l-a contour for the data. This cor- responds to a confirmation of the Bjorken sum rule to the 7% level, consistent with the present accuracy of the data. The Ellis-Jaffe sum rules are clearly not satisfied. Note that these conclusions are not new here; they have been available in essentially this form for over two years. Figure 4 represents the current status of the data.
The El43 experiment has new data on g$‘(~) and g;(x).8 The gz structure function, defined above, is well established on formal grounds, but is not easy to
6
. -
0
In
-0.05
6-95 79W
0.15
IP
0.20
Figure 4: The experimental sum rules for the proton, deuteron, and neutron are shown in
two dimensions. The one and two sigma contours in the I, - IP plane are given, along with
the predictions of the Bjorken sum rule and the Ellis-Jaffe sum rules.
discuss informally because it lacks a simple interpretation in the quark parton model. The quantity
A2(x,Q2) = ‘(“,, ‘) [A,, + ‘;;‘;;“~‘;)AL] sm
where y = 2Mz/@, is the physics asymmetry associated with g2 and must
satisfy the positivity constraint iA21 5 dm. The Burkhardt-Cottingham sum rule’ for g2 states
s
1
lim Q’--- 0
gz(x, Q2)da: = 0
and the Wandzura-Wilczek relation lo
92 ww(x, Q2) = -gl(x, Q2) + J’ gl (x’, Q2)dx’ I
gives the connection between gr and g2. The quantity gzww is a leading twist component of 92. Often one sees defined an additional piece for g2:
7
92 = gzww + 92.
The term 92 contains higher twist parts. The structure function gz is regarded to be a good place to look for higher twist effects in deep inelastic scattering.
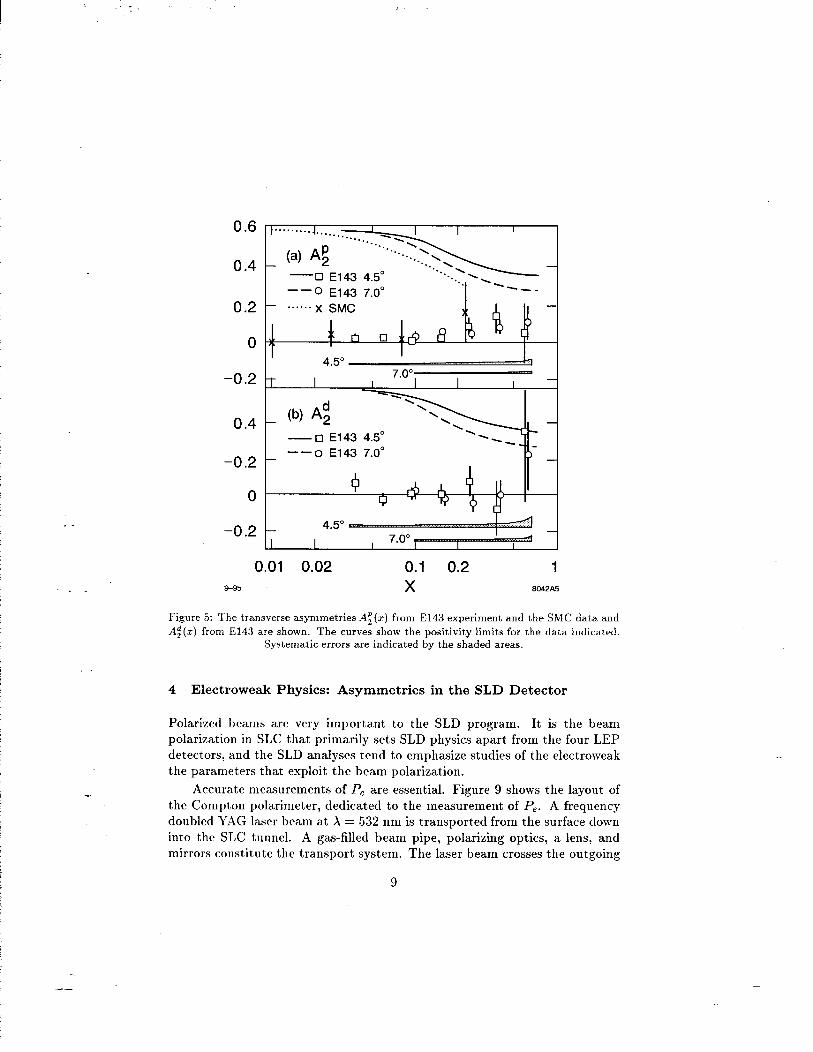
Figure 5 shows A2 for p and d. The At data show clear evidence for non- zero values, particularly at high x, while the A$ data are consistent with 0 within errors.
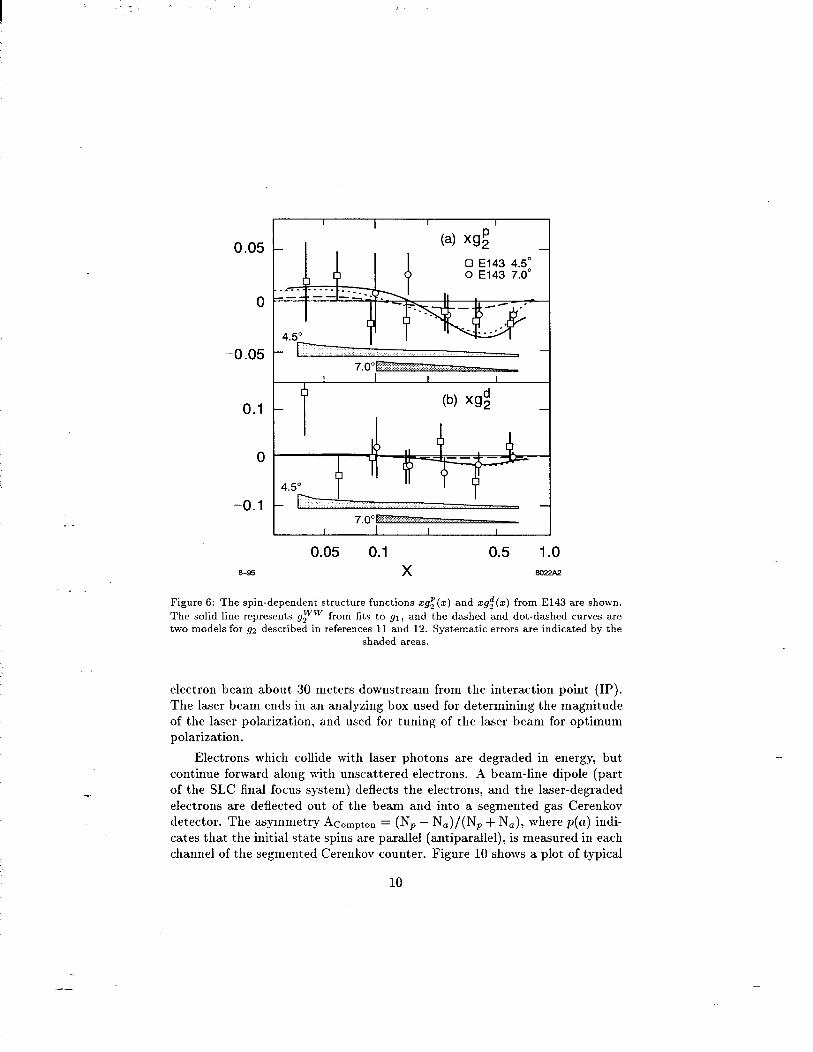
Figure 6a and 6b show gg and g.$ data with a line for g2ww and dashed curves for two bag models. 11,12 Within the present errors, gZww is a good description of the data. The two bag models are not excluded by these data, so believers in higher twist can still fit models within the data. The deuteron data have larger errors, so are less conclusive. Clearly higher precision data would be valuable for studying higher twist effects in g2.
The El43 experiment also has new data on p and d targets for lower beam energies, 16.20 and 9.8 GeV. El43 uses these data to study the Q2 dependence of gi .13
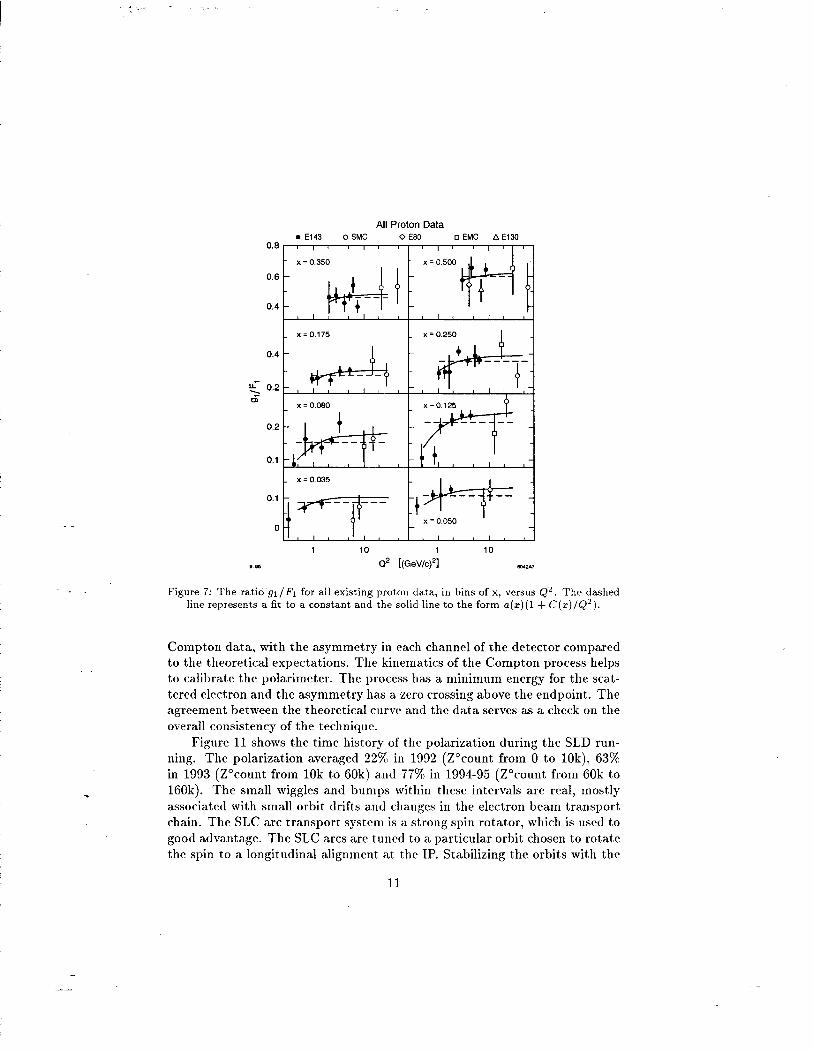
A-Q2 dependence in the data is expected to exist, as has been seen clearly in the behavior of the Fl and F2 structure functions. These dependencies are characterized by logarithmic variations in Q2 as predicted by the Gribov- Lipatov-AlterelhParisi equations. Higher twist effects manifest themselves as additional Q2 dependencies in the form of (1/Q2)” terms. El43 chooses to fit the data, gl(x,Q2)/Fl(z,Q2), t o a higher-twist inspired form a(~)(1 + C(x)/Q2). El43 emphasizes that by fitting gl/Fl, any Q2 dependence common in Fl and gi will result in a constant value for the ratio; additional terms that show up in the fits will represent additional Q2 terms in gr beyond those seen in Fl.
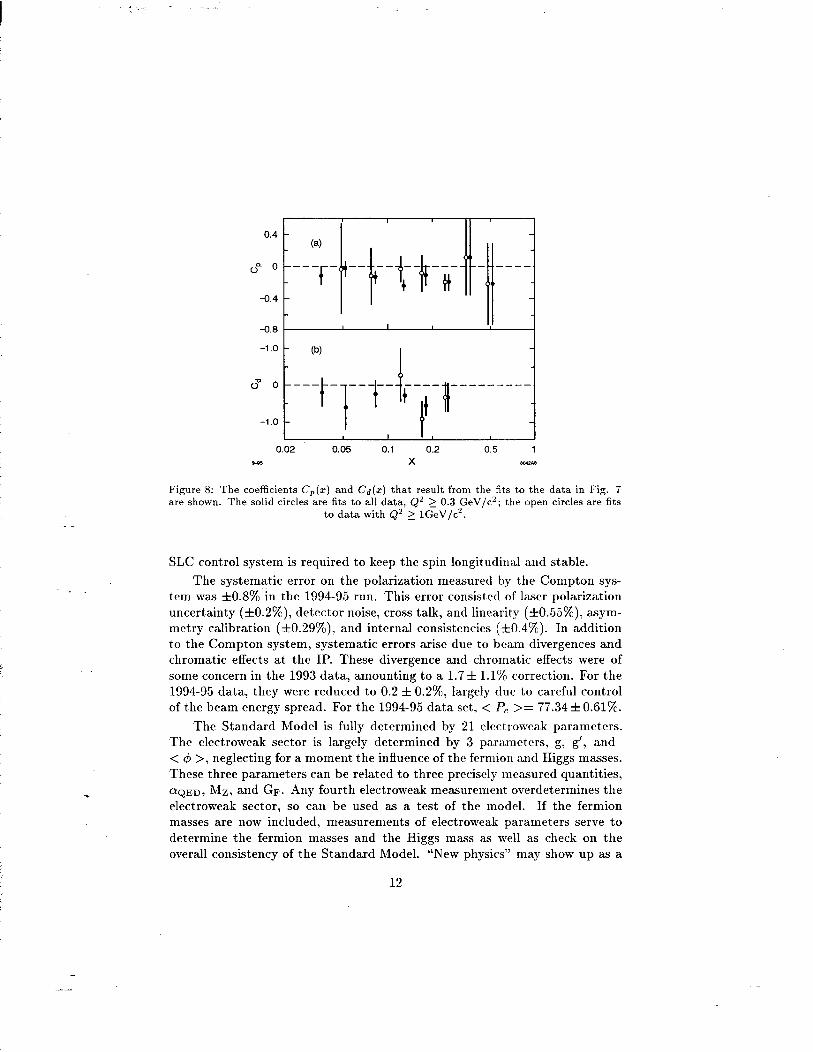
Figure 7 shows all of the proton data binned into 8 x bins. The low Q2 data points from El43 show a tendency to drop off for Q2 5 1 GeV/c2. The inclusion of a l/Q’ form improves the fit from x2/dof = 80/56 (for a fit with C(Z) = 0) to x2/cZof = 46/55 for C(Z) set free to float. Figure 8 shows the coefficients C,(X) and Cd(x). Clearly a small negative C(Z) is preferred for the proton data. If the data below Q2 = 1 are excluded from the fit, the fits still prefer a small negative value for C(r), but C(r) = 0 is not ruled out. El43 concludes that a small higher twist component may be allowed, but is not required for good fits at the level of the present precision in the data.
The deuteron data show a similar tendency but the significance is smaller.
8
--
. -
0.6 1 t.........J.............' -A I I V.7 c -0 El43 4.5”
---0 El43 7.0” 0.2 . . . . . . )( c&lC
-0.2
0.4
-0.2
0
4.5” - +I
T I 7.0°- _
I I
_ (b) A; - •I El43 4.5” ---0 El43 7.0”
-0.2
0.01 0.02 0.1 0.2 1 9-95 -. X 8042A5
Figure 5: The transverse asymmetries A;(z) from El43 experiment and the SMC data and
At(z) from El43 are shown. The curves show the positivity limits for the data indicated.
Systematic errors are indicated by the shaded areas.
4 Electroweak Physics: Asymmetries in the SLD Detector
Polarized beams are very important to the SLD program. It is the beam polarization in SLC that primarily sets SLD physics apart from the four LEP detectors, and the SLD analyses tend to emphasize studies of the electroweak the parameters that exploit the beam polarization.
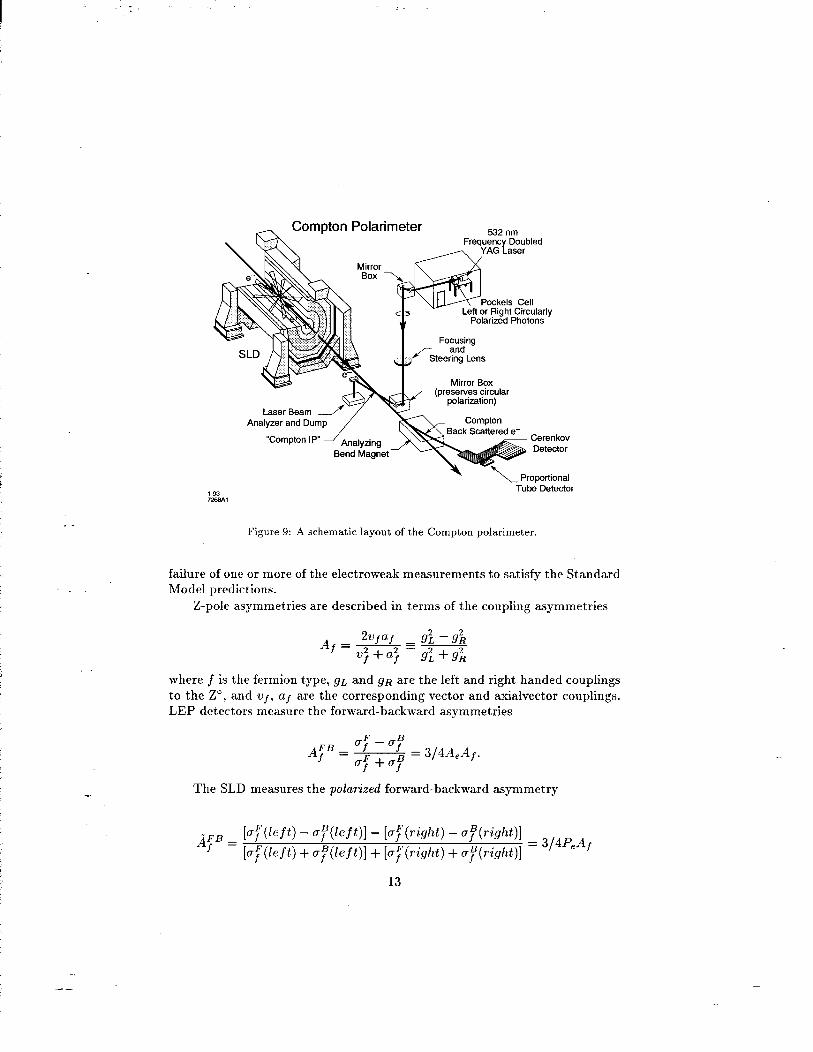
Accurate measurements of P, are essential. Figure 9 shows the layout of the Compton polarimeter, dedicated to the measurement of P,. A frequency doubled YAG laser beam at X = 532 nm is transported from the surface down into the SLC tunnel. A gas-filled beam pipe, polarizing optics, a lens, and mirrors constitute the transport system. The laser beam crosses the outgoing
9
--
. -
0.1
0
-0.1
L I I I I 1
0.05 0.1 0.5 1.0 a-95 X 8022A2
Figure 6: The spin-dependent structure functions zgi(z) and zg,“(z) from El43 are shown.
The solid line represents g2 ww from fits to 91, and the dashed and dot-dashed curves are
two models for g2 described in references 11 and 12. Systematic errors are indicated by the
shaded areas.
electron beam about 30 meters downstream from the interaction point (IP). The laser beam ends in an analyzing box used for determining the magnitude of the laser polarization, and used for tuning of the laser beam for optimum polarization.
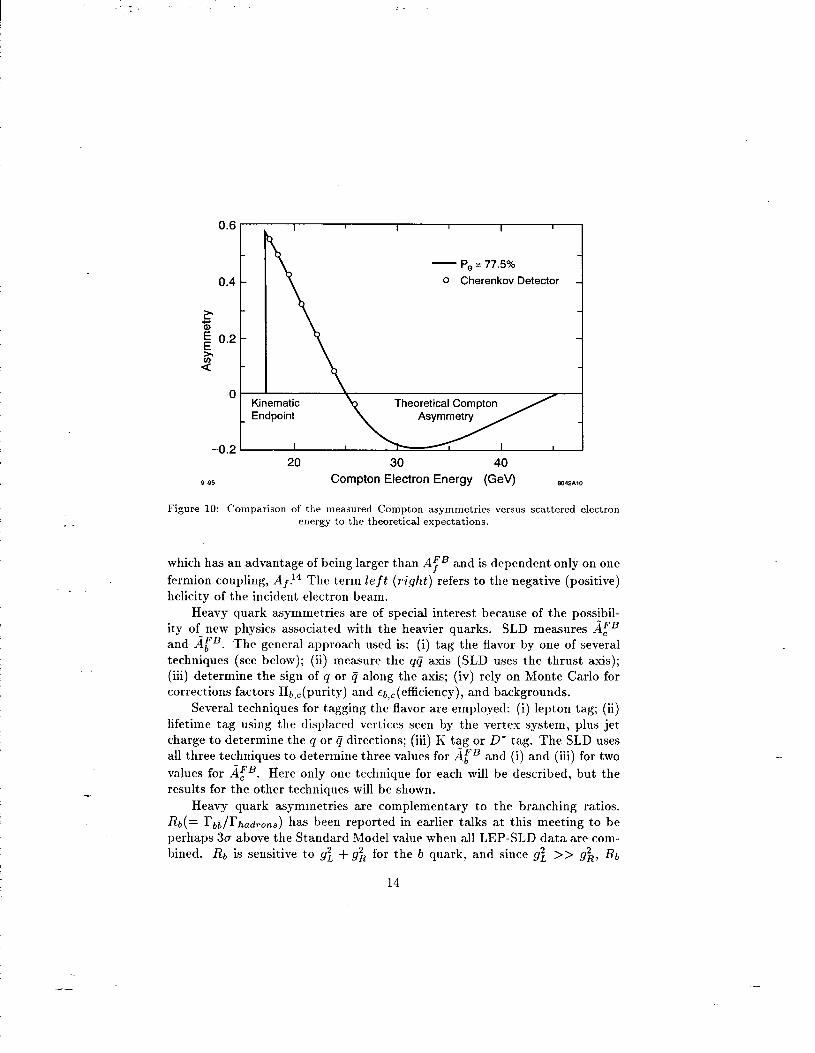
Electrons which collide with laser photons are degraded in energy, but continue forward along with unscattered electrons. A beam-line dipole (part of the SLC final focus system) deflects the electrons, and the laser-degraded electrons are deflected out of the beam and into a segmented gas Cerenkov detector. The asymmetry Acompton = (NP - N,)/(NI, + N,), where p(u) indi- cates that the initial state spins are parallel (antiparallel), is measured in each channel of the segmented Cerenkov counter. Figure 10 shows a plot of typical
10
. -
All Proton Data . El43 0 SMC 0 EBO q EMC AE130
0.81 I , , I , I I , I , I I , I, I ,
_ x=0.175 L x= 0.250 I
,,!I +yF+ , c , , ,, , , ,
- -
< 0.2
6; x = 0.080 x=0.125
0.2 - 1 I --- -
1 10 1 10
c-05 0’ [(GeV/c)*] e42.47
Figure 7: The ratio’gl /Fl for all existing proton data, in bins of x, versus Q2. The dashed
line represents a fit to a constant and the solid line to the form a(~)(1 + C(z)/&*).
Compton data, with the asymmetry in each channel of the detector compared to the theoretical expectations. The kinematics of the Compton process helps to calibrate the polarimeter. The process has a minimum energy for the scat- tered electron and the asymmetry has a zero crossing above the endpoint. The agreement between the theoretical curve and the data serves as a check OIL the overall consistency of the technique.
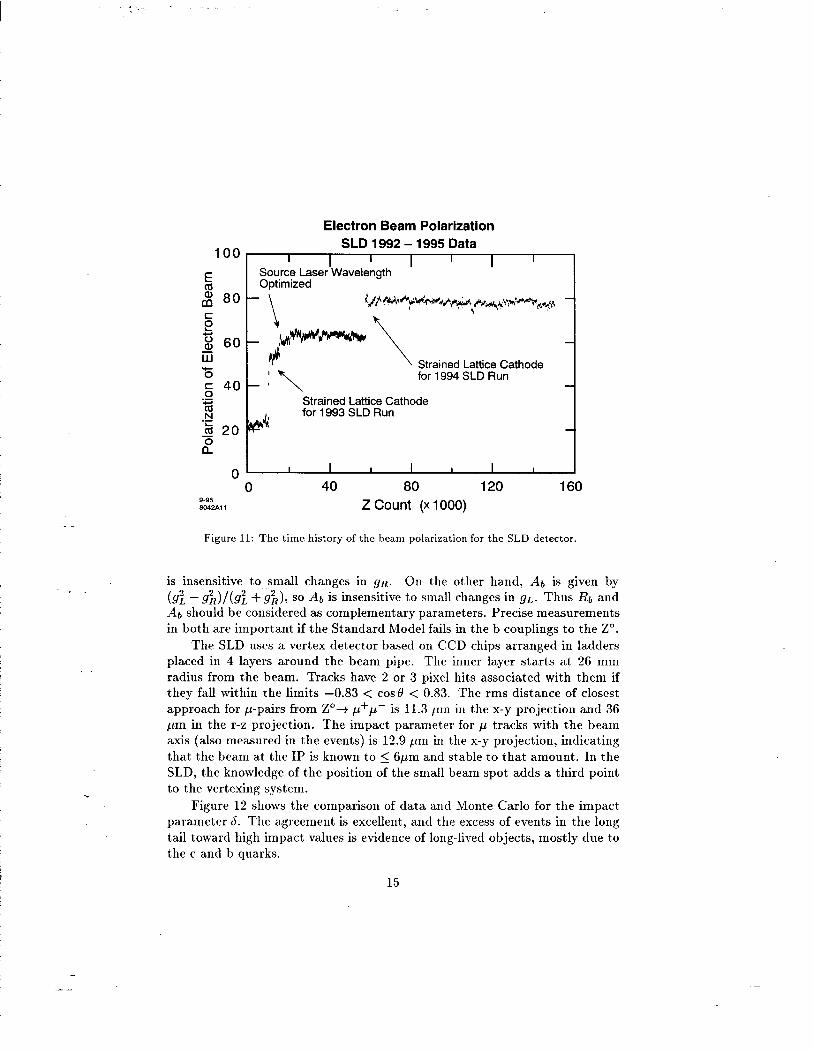
Figure 11 shows the time history of the polarization during the SLD run- ning. The polarization averaged 22% in 1992 (2”count from 0 to lOk), 63% in 1993 (Z”count from 10k to 6Ok) and 77% in 1994-95 (Z’count from 60k to 160k). The small wiggles and bumps within these intervals are real, mostly associated with small orbit drifts and changes in the electron beam transport chain. The SLC arc transport system is a strong spin rotator, which is used to good advantage. The SLC arcs are tuned to a particular orbit chosen to rotate the spin to a longitudinal alignment at the IP. Stabilizing the orbits with the
11
I
0.4 - _ (a)
0" 0 ----
! f
-0.4
- ti -- -- +I --
+ ------ rxllI ---- 0)
-1.0 t
03
Figure 8: The coefficients C,(z) and C,(z) that result from the fits to the data in Fig. 7 are shown. The solid circles are fits to all data, Q2 2 0.3 GeV/c’; the open circles are fits
to data with Q2 1 1GeV/c2.
SLC control system is required to keep the spin longitudinal and stable.
The systematic error on the polarization measured by the Compton sys- tem was f0.8% in the 1994-95 run. This error consisted of laser polarization uncertainty (&O.Z%), detector noise, cross talk, and linearity (f0.55%), asym- metry calibration (f0.29%), and internal consistencies (f0.4%). In addition to the Compton system, systematic errors arise due to beam divergences and chromatic effects at the IP. These divergence and chromatic effects were of some concern in the 1993 data, amounting to a 1.7 f 1.1% correction. For the 1994-95 data, they were reduced to 0.2 f 0.2%, largely due to careful control of the beam energy spread. For the 1994-95 data set, < P, >= 77.34 f 0.61%.
The Standard Model is fully determined by 21 electroweak parameters. The electroweak sector is largely determined by 3 parameters, g, g’, and < 4 >, neglecting for a moment the influence of the fermion and Higgs masses. These three parameters can be related to three precisely measured quantities, QQED, Mz, and GF. Any fourth electroweak measurement overdetermines the electroweak sector, so can be used as a test of the model. If the fermion masses are now included, measurements of electroweak parameters serve to determine the fermion masses and the Higgs mass as well as check on the overall consistency of the Standard Model. ‘&New physics” may show up as a
12
I :.
. -
Compton Polarimeter 532 nm Frequency Doubled
YAG Laser
Polarized Photons
I Focusing
Steering Lens
Mirror Box
~Compto” IP” ‘-(,ha,yzing Bend Magnet
Back Scattered e- Cerenkov
Detector
. \ Proportional
l-93 -1
Tube Detector
Figure 9: A schematic layout of the Compton polarimeter.
failure of one or more of the electroweak measurements to satisfy the Standard Model predictions.
Z-pole asymmetries are described in terms of the coupling asymmetries
2Uf ar Y”t - s; Afz7=- u;+af -gi+g&
where f is the fermion type, gL and gR are the left and right handed couplings to the Z”, and us, af are the corresponding vector and axialvector couplings. LEP detectors measure the forward-backward asymmetries
AFB = +CJ 7- f u,F+u,B -
3/4A,Af.
The SLD measures the podarited forward-backward asymmetry
[$(left) + +(Zeft)] + [afF(right) + afB(r+ght)]
--
--
- Pe = 77.5% - Pe = 77.5%
0 Cherenkov Detector - 0 Cherenkov Detector -
30 40
Compton Electron Energy (GeV)
Figure 10: Comparison of the measured Compton asymmetries versus scattered electron energy to the theoretical expectations.
which has an advantage of being larger than Atf”” and is dependent only on one
fermion coupling, Af .r4 The term left (right) re f ers to the negative (positive) helicity of the incident electron beam.
Heavy quark asymmetries are of special interest because of the possibil- ity of new physics associated with the heavier quarks. SLD measures AFB and AFB The general approach used is: (i) tag the flavor by one of several techniques (see below); (ii) measure the qq axis (SLD uses the thrust axis); (iii) determine the sign of Q or g along the axis; (iv) rely on Monte Carlo for corrections factors &&XIrity) and Eb,c(effiCienCy), and backgrounds.
Several techniques for tagging the flavor are employed: (i) lepton tag; (ii) lifetime tag using the displaced vertices seen by the vertex system, plus jet charge to determine the q or 4 directions; (iii) K tag or D* tag. The SLD uses all three techniques to determine three values for AfB and (i) and (iii) for two
values for AFB. Here only one technique for each will be described, but the results for the other techniques will be shown.
Heavy quark asymmetries are complementary to the branching ratios.
Rb(= rb&/rhadrons ) has been reported in earlier talks at this meeting to be perhaps 3a above the Standard Model value when all LEP-SLD data are com- bined. & is sensitive to gi + g:2 for the b quark, and since gi >> gk, &,
14
Electron Beam Polarization
SLD 1992 - 1995 Data
. -
. -- I I ’ I ’ I ’
5 Source Laser Wavelength Optimized
z80-1
t/Y- ~~~~~I~~~~~~~~~.~~,~~~~~.~~~ - c
s b 2 60
- g4+@+w~49P W 3 \ 75
Strained Lattice Cathode
‘\ for 1994 SLD Run
g 40-l ‘.i= w
Strained Lattice Cathode
m$4@4 for 1993 SLD Run
‘Es 20
2
0 I I I I I I I
0 40 80 120 160 9-95 8042A11 Z Count (x 1000)
.Figure 11: The time history of the beam polarization for the SLD detector.
iS hX!nSitiVe tom Small changes in gR. On the other hand, Ab is given by
(sz, - &MS2 +&A so At, is insensitive to small changes in gL. Thus &, and & should be considered as complementary parameters. Precise measurements in both are important if the Standard Model fails in the b couplings to the Z”.
The SLD uses a vertex detector based on CCD chips arranged in ladders placed in 4 layers around the beam pipe. The inner layer starts at 26 mm radius from the beam. Tracks have 2 or 3 pixel hits associated with them if they fall within the limits -0.83 < cos0 < 0.83. The rms distance of closest approach for p-pairs from Z”-+ p+p- is 11.3 pm in the x-y projection and 36 pm in the r-z projection. The impact parameter for p tracks with the beam axis (also measured in the events) is 12.9 pm in the x-y projection, indicating that the beam at the IP is known to 5 61-1”’ and stable to that amount. In the SLD, the knowledge of the position of the small beam spot adds a third point to the vertexing system.
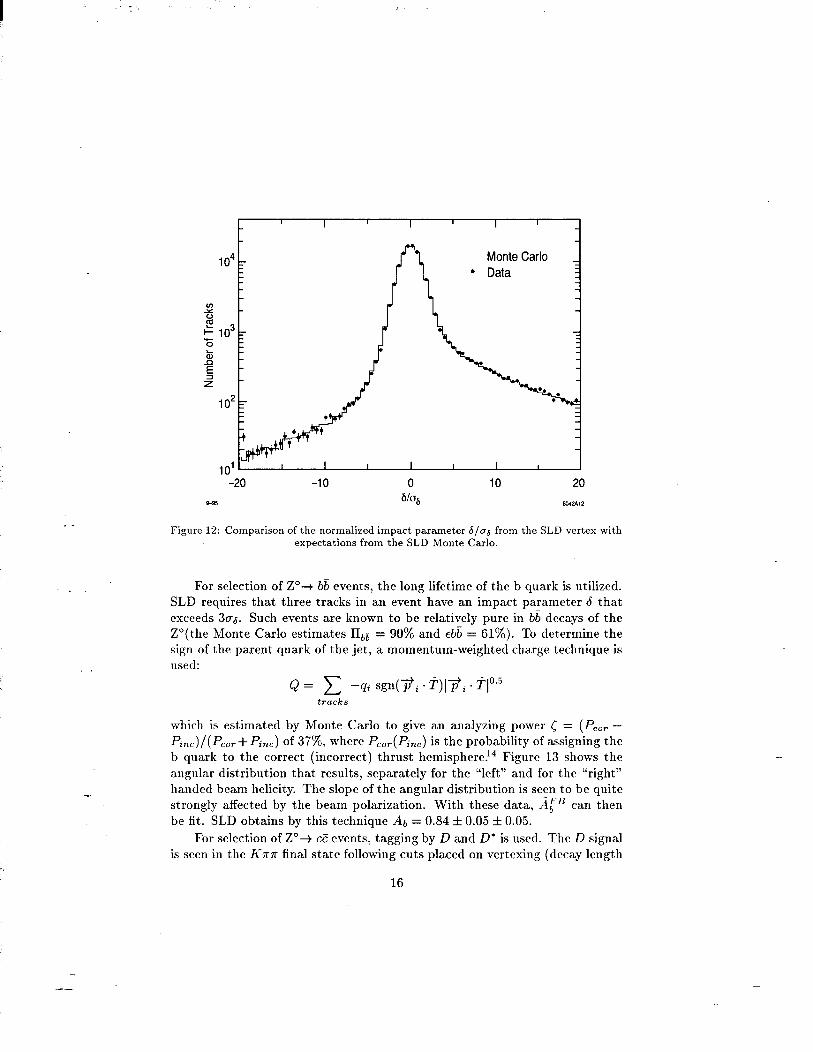
Figure 12 shows the comparison of data and Monte Carlo for the impact parameter 6. The agreement is excellent, and the excess of events in the long tail toward high impact values is evidence of long-lived objects, mostly due to the c and b quarks.
15
--
. -
Monte Carlo
l Data
Figure 12: Comparison of the normalized impact parameter 6/u, from the SLD vertex with expectations from the SLD Monte Carlo.
For selection of Z”+ bb events, the long lifetime of the b quark is utilized. SLD requires that three tracks in an event have an impact parameter 6 that exceeds 3~6. Such events are known to be relatively pure in bb decays of the Z”(the Monte Carlo estimates D&J = 90% and ebb = 61%). To determine the sign of the parent quark of the jet, a momentum-weighted charge technique is used:
tracks
which is estimated by Monte Carlo to give an analyzing power 5 = (P,,, -
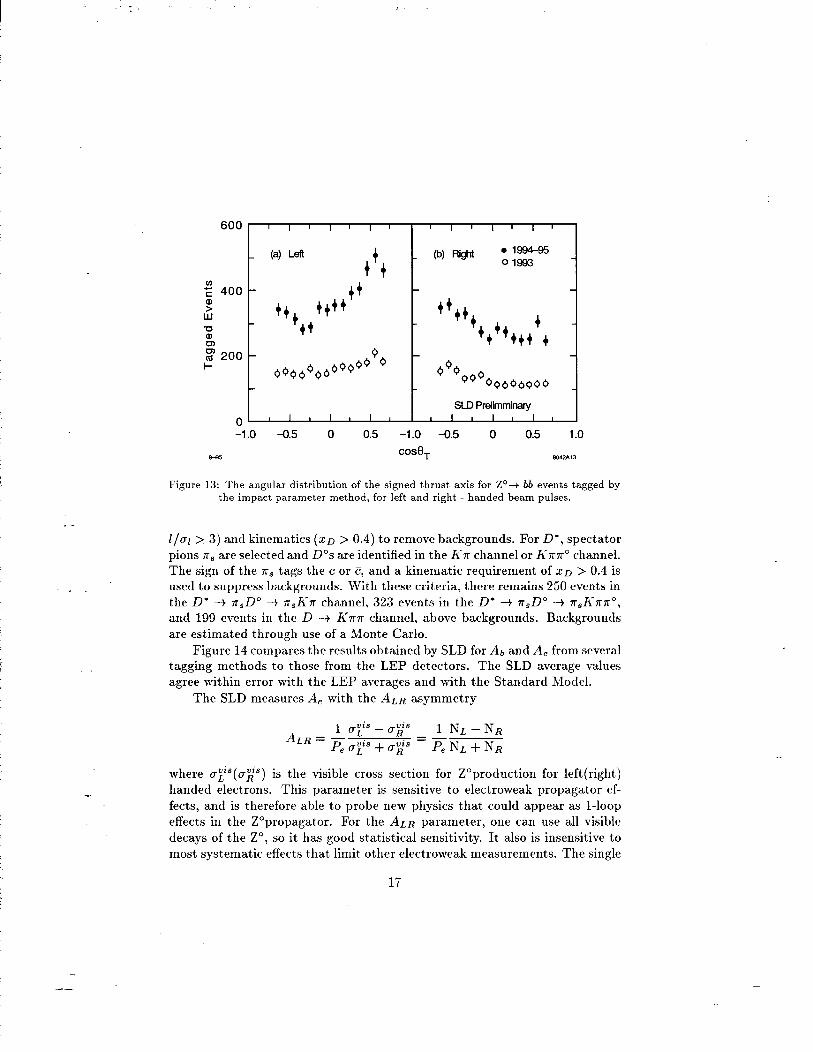
Enc)/(~cor + kc) of 379’ O, w h ere P,,,(Pi,,) is the probability of assigning the b quark to the correct (incorrect) thrust hemisphere.r4 Figure 13 shows the angular distribution that results, separately for the “left” and for the “right” handed beam helicity. The slope of the angular distribution is seen to be quite strongly affected by the beam polarization. With these data, AFB can then be fit. SLD obtains by this technique Ab = 0.84 f 0.05 f 0.05.
For selection of Z”+ CF events, tagging by D and D* is used. The D signal is seen in the K7r7r final state following cuts placed on vertexing (decay length
16
t (4 Left _ @) RW 0 1994-95
+ + + 01993
g 400
: W
I
++t
t+++
++
+++t
-0
EY
+t ++t++t+t++
p 200 0 l- 6Q&b0QQQQ 6 6%
QQoQooQ~oQO _
SLD Prelimminary
0 I I I I I I I I I I I I I
-1.0 a.5 0 0.5 -1.0 -0.5 0 0.5 1.0
EC95 COSOT muA
Figure 13: The angular distribution of the signed thrust axis for Z”+ bb events tagged by the impact parameter method, for left and right - handed beam pulses.
Z/al > 3) and kinematics (XD > 0.4) to remove backgrounds. For D”, spectator pions ns are selected and DOS are identified in the Iix channel or KxrO channel. The sign of the rr, tags the c or I?, and a kinematic requirement of XD > 0.4 is used to suppress-backgrounds. With these criteria, there remains 250 events in the D* -+ ?rgDO + 7~Jin channel, 323 events in the D* + nsDo -+ r91<mr0, and 199 events in the D -+ KKK channel, above backgrounds. Backgrounds are estimated through use of a Monte Carlo.
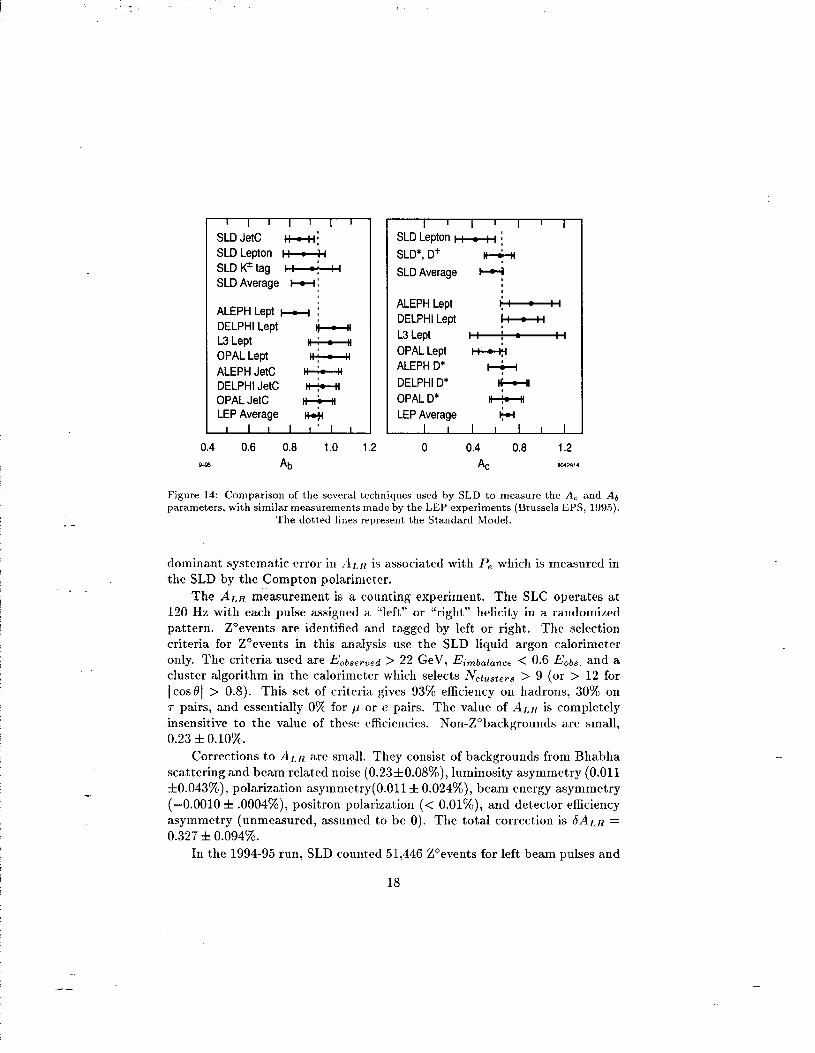
Figure 14 compares the results obtained by SLD for Ab and A, from several tagging methods to those from the LEP detectors. The SLD average values agree within error with the LEP averages and with the Standard Model.
The SLD measures A, with the ALR asymmetry
where crg’( g$‘) is the visible cross section for Z”production for left(right) handed electrons. This parameter is sensitive to electroweak propagator ef- fects, and is therefore able to probe new physics that could appear as l-loop effects in the Z”propagator. For the A LR parameter, one can use all visible
decays of the Z”, so it has good statistical sensitivity. It also is insensitive to most systematic effects that limit other electroweak measurements. The single
17
’ I ’ I ’ I ’
SLD JetC mi SLD Lepton K = 24 SLD @tag l-+-h SLD Average cc( j
ALEPH Lept w : DELPHI Lept i-- L3 Lept II:- II OPALLept I+: = H
ALEPH JetC I&=-H DELPHI JetC I&-H OPALJetC ki-d LEP Average &I
I ’ I ’ I ’ I SLD Lepton 1-1 i
SLD*, D+ * SLD Average e
ALEPH Lept DELPHI Lept
L3 Lept
OPAL Lept ALEPH D*
DELPHI D*
OPAL D*
LEP Average
0.4 0.6 0.8 1.0 1.2
%% ‘h
0 0.4 0.8 1.2
AC K!&?A14
Figure 14: Comparison of the several techniques used by SLD to measure the A, and Aj, parameters, with similar measurements made by the LEP experiments (Brussels EPS, 1995).
The dotted lines represent the Standard Model.
dominant systematic error in ALL is associated with P, which is measured in the SLD by the Compton polarimetcr.
The ALR measurement is a counting experiment. The SLC operates at 120 Hz with each pulse assigned a “left” or “right” helicity in a randomized
pattern. ZOevents are identified and tagged by left or right. The selection criteria for Z”events in this analysis use the SLD liquid argon calorimeter only. The criteria used are &bserved > 22 GeV, Eimbalan,-e < 0.6 &,bs. and a cluster algorithm in the calorimeter which selects Nclusters > 9 (or > 12 for 1 cos6’1 > 0.8). Th is set of criteria gives 93% efficiency on hadrons, 30% on 7 pairs, and essentially 0% for 1-1 or e pairs. The value of ALR is completely insensitive to the value of these efficiencies. Non-Z”backgrounds are small, 0.23 f 0.10%.
Corrections to ALR are small. They consist of backgrounds from Bhabha
scattering and beam related noise (0.23*0.08%), luminosity asymmetry (0.011 f0.043%), polarization asymmetry(0.011 f 0.024%), beam energy asymmetry (-0.0010 f .00040/o), positron polarization (< O.Ol%), and detector efficiency asymmetry (unmeasured, assumed to be 0). The total correction is ~ALR = 0.327 f 0.094%.
In the 1994-95 run, SLD counted 51,446 Z’events for left beam pulses and
18
--
. -
0.240
0.235
0.225
0.220 ^_
o SLD l ALEPH A DELPHI l L3 . OPAL
FT- World Average 0.23129’
1( QFB
SLD * LEP t
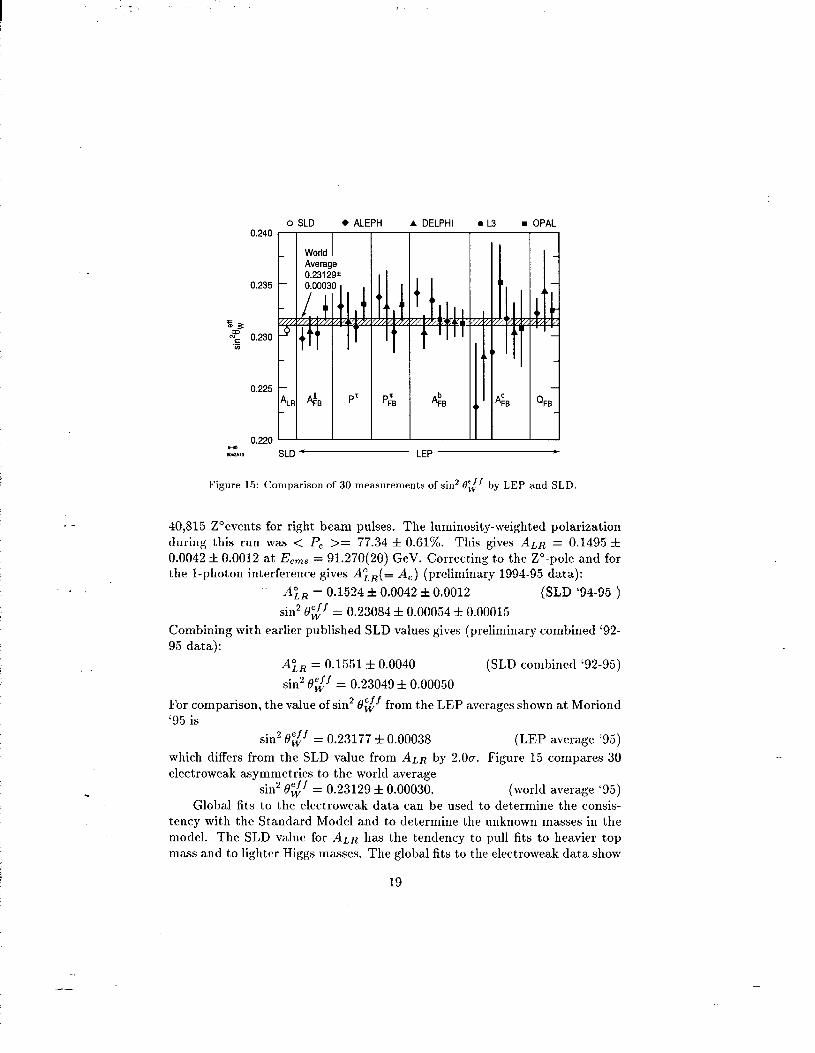
Figure 15: Comparison of 30 measurements of sin* Ogf by LEP and SLD.
40,815 ZOevents for right beam pulses. The luminosity-weighted polarization during this run was < P, >= 77.34 f 0.61%. This gives ALR = 0.1495 f 0.0042 f 0.0012 at E,,, = 91.270(20) GeV. Correcting to the Z”-pole and for the l-photon interference gives A& = (- A,) (preliminary 1994-95 data):
AiR = 0.1524 f 0.0042 f 0.0012 (SLD ‘94-95 )
sin2 t$’ = 0.23084 f 0.00054 f 0.00015
Combining with earlier published SLD values gives (preliminary combined ‘92- 95 data):
AiR = 0.1551 f 0.0040 (SLD combined ‘92-95)
sin2 e$f = 0.23049f 0.00050
2 For comparison, the value of sin 8, ef f from the LEP averages shown at Moriond ‘95 is
sin2 t9gf = 0.23177 f 0.00038 (LEP average ‘95)
which differs from the SLD value from A LR by 2.0~. Figure 15 compares 30 electroweak asymmetries to the world average
sin2 Ogf = 0.23129 f 0.00030. (world average ‘95)
Global fits to the electroweak data can be used to determine the consis- tency with the Standard Model and to determine the unknown masses in the model. The SLD value for ALR has the tendency to pull fits to heavier top mass and to lighter Higgs masses. The global fits to the electroweak data show
19
preference for a light Higgs mass, around 100 GeV. However within the 2a bounds of the fits, the Higgs mass is yet unconstrained by the data.
5 Conclusion
In conclusion, polarized electron beams have operated successfully for many years at SLAC. The polarized electron beams have become a reliable and pow- erful tool for the study of physics at high energies.
6 References
1. E. L. Garwin et al., Helv. Phys. Acta 47, 393 (1974). 2. R. Alley et ad., SLAC-PUB-95-6489, Nucl. Instrum. and Meth., A365,
1 (1995). 3. T. Maruyama et al., Phys. Rev. Lett. 66, 2376 (1991), T. Nakanishi
et al., Nagoya University preprint DPNU-91-23 (1991), T. Maruyama et
al., Phys. Rev. B46, 4261 (1992). 4. see for example A. Y. Chao and J. R. Arthur, Progress in Solid-State
Chemistry 10, 157 (1975). 5. NMC Collaboration, P. Amaudruz et al., Phys. Lett. B295, 159 (1992)
and L. W. Whitlow et al., Phys. Lett. B250, 193 (1990). 6. K. Abe et al., Phys. Rev. Lett. 74, 346-350 (1995). 7. K. Abe et aZ., Phys. Rev. Lett. 75, 25-28 (1995). 8. K. Abe et -al., SLAC-PUB-95-6982, to be published. 9. H. Burkhardt and W. N. Cottingham, Ann. Phys. (N. Y.) 56, 453
(1970). 10. S. Wandzura and F. Wilczek, Phys. Lett. B72, 195 (1977). 11. X. Song and J. S. McCarthy, Phys. Rev. D49,3419 (1994), ERRATUM
ibid. D50, 4718 (1994), and private communication for values at Q2 = 5
GeV/c2. 12. M. Stratmann, Z. Phys. C60, 763 (1993), and private communications
for values at Q2 = 5 GeV/c2. 13. K. Abe et al., SLAC-PUB-95-6997, to be published. 14. The SLD Collaboration, K. Abe et al., Phys. Rev. Lett. 74, 2890 (1995).
20
--