physical properties of functional fermented milk produced
TRANSCRIPT

Physical Properties of Functional
Fermented Milk Produced with
Exopolysaccharide-Producing
Strains of Streptococcus
thermophilus
A thesis submitted for the degree of
Doctor of Philosophy
By
Umi Purwandari
M.App.Sc.
2009
School of Biomedical and Health Sciences
Victoria University, Werribee Campus, VIC, Australia

ii
Dedication
“Say: Truly, my prayer and my service of sacrifice, my life and
death are (all) for Allah, The Cherisher of the Worlds”
Al Qur’an 6:1

iii
Abstract
This thesis focused on the study of the influence of different exopolysaccharide
types produced by two strains of Streptococcus thermophilus on the physical
properties of fermented milk. First, the fermentation factors affecting EPS
production were studied to ascertain required carbon source and environmental
conditions which would support their production. Higher fermentation
temperature (42°C) resulted in a greater cell growth and EPS production. EPS
production was growth associated in glucose or lactose-containing M17 medium.
The examined strains appeared to be able to utilize galactose for the EPS
assembly and produced comparable amounts of EPS, albeit restrictive cell growth.
The EPS production of the two strains was comparable, ranging from ~100 to
~600 mg/L. Secondly, the EPS were rheologically characterized to show their
resistance to deformation. Influence of temperature, pH and concentration on the
flow behaviour of these EPS was also assessed. Under acidic conditions, capsular-
ropy EPS was less responsive to temperature with a higher zero shear viscosity ηo
(14.36 to 150.82 mPa s) than capsular EPS (93.72 to 9.24 mPa s), and slightly
higher relaxation time τ (0.43 to 15.82 s for capsular-ropy EPS and 0.72 to 9.36 s
for capsular EPS). The opposite behavior was observed under neutral pH. EPS
concentration did not give significant effect (P>0.05) on ηo and τ.
The second study examined the effects of types of EPS on yoghurt texture
under selected conditions. Fermented milk made using capsular-ropy EPS showed
greater resistance to flow with less solid-like behaviour. It also had greater water
holding capacity although the milk gel was less compact and brittle compared to
fermented milk with capsular EPS. The EPS production in milk during
fermentation between the two strains was comparable with maximum
concentration was 840+47.5 mg EPS/kg fermented milk. Syneresis was lower in
fermented milk incubated in low temperature, was ranging from 4.1-2.4 g/100 g
fermented milk with capsular-ropy-EPS, and 10.9-26.6 g/100 g in fermented milk

iv
with capsular EPS. G’ was 23.8-365.1 Pa and 57.6-1040 Pa for fermented milk
with capsular ropy and capsular EPS, respectively.
The third study examined the involvement of EPS in the texture creation of
fermented milk supplemented with calcium and/or sucrose, or calcium and whey
proteins. Calcium addition to milk base resulted in increased acidity and greater
syneresis (~20-30 g/100 g in fermented milk with capsular-ropy EPS and ~30-50
g/100 g in fermented milk with capsular EPS) and thixotropy of fermented milk,
as compared to fermented milk without added calcium. Sucrose affected the
parameters in opposite manner. EPS production did not differ from that of the
control fermented milk. Storage modulus (G’) was 96-230.4 Pa, and 502.8-1143.5
for fermented milk with capsular ropy and capsular EPS, respectively.
The effect of heat-untreated whey protein isolate or whey protein
concentrate on calcium-fortified fermented milk was studied using capsular ropy
EPS producer. Result showed that combined effect of both supplement was
detrimental to texture of fermented milk to make it resemble that of drinking
yoghurt. Syneresis was up to ~50 g/100 g, while G’ was only around 4 mPa.
The next experiment studied the effect of heat-treated whey protein isolate
addition on fermented milk texture. Results showed that heat-treatment applied to
added whey protein preserved the G’ and syneresis with the values close to those
of normal fermented milk. However, at high concentration of added heat-treated
whey protein (whey protein:casein 3:1), the texture became very hard with 0 m2
permeability. Gelation was started very early in fermented milk added with heat-
denatured whey protein. Whey protein addition induced the beginning of gelation.
Supplemented fermented milk made using capsular-ropy EPS producer
consistently showed lower G’, lower syneresis, and more shear-resistant compared
to that made using capsular EPS.
In conclusion, capsular ropy EPS, both in dispersion and in fermented milk
with or without different supplementation, exhibited less solid-like properties and
more shear-resistant behavior compared to capsular EPS.

v
Declaration
“I, Umi Purwandari, declare that the PhD thesis entitled “Physical Properties of
Functional Fermented Milk Produced with Exopolysaccharide-Producing Strains
of Streptococcus thermophilus” is no more than 100,000 words in length
including quotes and exclusive of tables, figures, appendices, bibliography,
references and footnotes. This thesis contains no material that has been submitted
previously, in whole or in part, for the award of any other academic degree or
diploma. Except where otherwise indicated, this thesis is my own work”.
Signature: Date: 13 April 2009
m urwan ar

vi
Acknowledgements
I would like to acknowledge significant supports from several parties, given to me
during completion of my PhD study. Without them this work would never have
been accomplished. They are:
1. Dr. Todor Vasiljevic, my Principal Supervisor, for his continuing support
throughout my study. Toward my ups and downs during the 3.5 years, his
empathy and help has made my academic life much easier. His patience in
dealing with me, and his prompt help with methodology and manuscripts is
greatly acknowledged. I only regret for not being able to return his jokes
which are sometimes too hard to swallow.
2. Prof. Nagendra P. Shah, my Co-Supervisor.
3. Former Head of School of Molecular Sciences, Prof. Stephen Bigger and
recent Acting Head of School, Assoc. Prof. Grant Stanley, for providing all
facilities needed to conduct this research.
4. Dr. Tim Kealy, for his help in operating Haake rheometer. Mr. Michael
Kakoullis of RMIT, Dr. Frank Sherkat, Sayyed Ali Jakfar of RMIT and other
research students at RMIT who were a great support during my work there.
5. AusAid and Government of Indonesia for supporting with funding and all
facilities. AusAid Manager in Jakarta Office, Mr. David Spiller, and his staff
who have been a great support from the start till the end. Also AusAid Liaison
Officer at Victoria University: Esther Newcastle, Margaret Jones, and David
Sharma.
6. Dr. Marlene Cran, who helped with EndNote and Words skills essential for
the last stage of thesis editing. Also thank to Mattew Stewart for his help with
final formatting.
7. Dr. Gwyn Jones who kindly assists with proof-reading, inspite of his hectic
schedule and health recovering. Lisana Shidqina, also for reading the thesis.
8. Other staff in the school whose support made my staying here very motivating
from day to day: Prof. John Orbell, Assoc. Prof. Suku Bhaskaran, Assoc. Prof.

vii
Kees Sonneveld, Assoc. Prof. Mary Millikan, Assoc. Prof. Vijay Mishra, Dr.
Sarah Fraser, Dr. Sandra Mc. Kechnie, Dr. Joshua Johnson, Dr. Lawrence
Ngeh, Dr. Dominico Caridi, Dr. Rohani Paimin, and other staff members
which cannot be mentioned in this very limited space.
9. Mr. Dale Tomlinson, laboratory manager and all laboratory technical staff,
especially Mr. Joseph Pelle whose genuine passion for HPLC and other
laboratory instruments assures perfect peaks and results. Ms. Ira Prasatya, Ms.
Stacey Lloyd, Mr. Michael Rogerson, Ms. Min Nguyen, Ms. Thien Anh, and
Ms. Marry-Anne whose help is always available.
10. Ir. Asfan, MP (former Dean of the Faculty of Agriculture), and Prof. Dr.
Iksan Semaoen (former Rector), of Trunojoyo University for their support to
pursue this study. Ir. M. Fakhry, MP (current Dean) and Prof. Dr. Ariffin
(current Rector), who assist in any way possible.
11. All my fellow research students: Veeranie Ariyadasa, Bogdan Zisu, Paul
Capela, Osaana Donkor, Daniel Otienno, Rupika Liyana-Arachchi Herath,
Wun-Keat Ding, Lydia Ong, Min-Tze Liong, Shruti Harnal, Sudinna
Hewakapuge, Anne-Lise Tang Fook Cheung, Santosh Kumar Kundaboina,
Christopher Collins, Belinda Davis, Chanun Radrinyom, Michelle Vaughn,
Chutima Kongjaroon, Natalie Nemaza, Yogesh Mistry, Nayana and Ajith
Bandara, Sanja, Dana Stanley; brothers: Idris Mohammed, Midhat Fazlic, and
Abdihakim Ali; Aida Zilic and Rodi Sferopoulos, Hien Van Dao, Lata
Ramchandran, Thuy Thi Pham, Muditha Dissanayake, Danusha Kalinga, Ria
Aprianita, Murad Yusuf and Archana Kolasani. There could be some more
which are out of my memory. Other students: Evan, Mine Esser, Maria and
Basel Abdul Kader, Laura Medenieks, Laura Baker, Katrina Murrell, Felicia,
Alto, Pris, Srinivas, Sam, Amir and Ismahan, Aysha, Tahani, Zeynab Ahmad,
Muhammad and others.
12. Victoria University Library staff: Brian Tyrrell, Sue, Emily Wark, Angeera,
Panga, Suzzane and others who have been a great help with providing
references.
13. All Indonesian students and their families in Canberra, Sydney and Melbourne
who have been a great support to my kids and I: Adek Wahidah, Maria

viii
Anityasari, Koesrianti, tante Srie, Ayu Rouf, Imam Dewanto, Evi Vileta
Lanasier who has been a shoulder to cry on, Dwi Amiarsih Sudarto, Alawiyah
Yudhie, Diah Arimbi, Aminah Wahyu, Grace Ika Yuwono and Ayu Zaafri,
Indira Prabasari who kindly provided temporary accommodation in
Melbourne, Raihani, Nevi Danila, Anni Aryani and Syurkani.
14. My greatest gratitude goes to my husband, Slamet Supriyadi, who always
gives so much space for my personal development. His leadership in the
family provides a very fertile ground for our kids and me to grow and flourish.
His sacrifice is beyond compare.
15. My deepest thank and love goes to other great blessings: our Lisana and Aliya,
for being so brave, patient, helpful, and independent. Their lack of complaints
through even a very difficult moment is gratefully appreciated. Their
excellence at school, their discipline, good manners and respected behaviour,
despite my frequent absence is a very rare achievement for such young souls.
They are always the constant great entertainers for me, even with Aliya’s
occasional tantrums. Their big patience in dealing with my frustration is
amazing.
16. I would thank my parents: Ibu and Bapak –Tarmiyatun and Subiyono- who
always support me and sacrifice so much, my younger brother, dik Adi, and
sisters Ery, Indah and Ofita and their families, and the big family in
Tulungagung.
17. Husniyah, Banun Diyah Probowati, and Kaswan Badami for their help with
looking after my promotion back home; Elyati Marhali, Dr. Amina Rawal in
Maribyrnong, who always worries about my family and I. Pri Haruwarta and
ibu Siti Khatijah, Kak Nora Hassan-Simkin, Brother Madjid, Banch -Sammy’s
Mom-, and Richard, Julie Royes, Nicola Newell in Hoppers Crossing who
treated my family like their own family members. Big family of Kyoku-shin
Kai karate: Neil Birch and Wendy Walsh, Simon, Garry in Point Cook, for
always making themselves available for Lisana. Teachers of Randwick Girls
Technology High School and Rainbow Street Public School in Sydney,
Hoppers Crossing Secondary College and Mossfiel Primary School in
Hoppers Crossing, who provided good education for my kids. Large

ix
community members in Wyndham, including Margaret Campbell, who gave
so much encouragement and opportunity to my kids to improve their talents in
writing and arts. Pepen, for being so encouraging. Om Roni and Fasa for their
help. We also thank Dejan Deki and Ivana for their special occasional
company, their presence is always a big fun for us.
18. Prof. Amiruddin Arief (1934-1997) and Ustadz Asy’ari Rois who gave such
an inspiration in approaching science and life. Also thank to my previous
supervisors Assoc. Prof. Ann C. Lawrie of RMIT, and Dr. Wallace Bridge of
UNSW who continuously send their encouragement. Thanks to Dr. Robin
McCormack from Student Learning Unit for being so encouraging, of whose
help came at the right moments.
19. Security staff at Victoria University, Werribee Campus who provide any
emergency help and great reassurance during my frequent night or weekend
work in the lab: Lynn, Heidar Ali, ‘big’ Muhammad, ‘little’ Muhammad,
Bruce, Adil, Michael and others. I thank for the nice friendship from the night-
shift cleaning staff: Mrs. Slavka and others.
20. Above all, I acknowledge the help from the Almighty, who has saved my
family from any trouble during my long journey in Australia. His blessing
with peace and happiness, good health and inspiration enables me to survive
academic life. His guidance makes it possible for me and us all to overcome
unnecessary non-academic turbulence which almost ruined this study and
potentially devastated our whole life. Only to HIM I dedicate my life and
death.
Hoppers Crossing, 1 September 2007

x
List of Publications
Journal article
Purwandari, U., N. P. Shah, and T. Vasiljevic. 2007. Effects of
exopolysaccharide-producing strains of Streptococcus thermophilus on
technological and rheological properties of set-type yoghurt. International
Dairy Journal. 17(11):1344-1352.
Chaired Conference
Purwandari, U. and T. Vasiljevic. 2007. Exopolysaccharide production by a
yoghurt culture and their effects on textural properties of yoghurt. in
Postgraduate Seminar, School of Molecular Science, Victoria University.
Werribee.
Purwandari, U. and T. Vasiljevic. 2007. The problem with texture of 'super
healthy' yoghurt. VU Indonesian Students Round Table Conference,
Melbourne. September 2007.
Purwandari, U., and Vasiljevic, T. 2008. The effect of calcium and/or whey
protein supplementation on textural properties of low-fat yoghurt.
Proceedings, International Conference in Food Science and Technology,
July 31-August 1 2008, Semarang, Indonesia, FPE 12.
Poster Presentation
Purwandari, U., Shah, N.P. and T. Vasiljevic. 2006. Exopolysaccharide
production by Streptococcus thermophilus strains. IDF Symposium on
Scientific and Technological Challenges in Fermented Milk / IDF Dairy
Science and Technology Week. 15-19 May 2006, Sirmione, Italy, p. 127.

xi
Purwandari, U. and T. Vasiljevic. 2007. Modeling selected technological
properties of calcium-fortified low-fat yoghurt supplemented with whey
protein concentrate (WPC) or isolate (WPI) using response surface
methodology. 67th Annual IFT Meeting. 28 July - 01 August. Chicago, IL,
P054-08.
Purwandari, U., Vasiljevic, T. 2008. Rheological properties of exopolysaccharides
produced by Streptococcus thermophilus strains and their role in creation of
yoghurt texture. Proceedings, International Conference in Food Science and
Technology, July 31-August 1 2008, Semarang, Indonesia, P 22.

xii
Table of Contents
Dedication ............................................................................................................... ii
Abstract .................................................................................................................. iii
Declaration .............................................................................................................. v
Acknowledgements ................................................................................................ vi
List of Publications ................................................................................................. x
List of Tables ....................................................................................................... xvi
List of Figures .................................................................................................... xviii
1 Introduction..................................................................................................... 1
1.1 Background ..................................................................................... 1
1.2 Aims ................................................................................................ 2
1.3 Thesis outline .................................................................................. 3
2 Literature Review............................................................................................ 6
2.1 Yoghurt - consumption and health benefits .................................... 6
2.2 Yoghurt microorganisms............................................................... 10
2.3 Exopolysaccharide production...................................................... 13
2.4 Rheological characteristics of EPS ............................................... 16
2.5 Important aspects of the yoghurt texture....................................... 19
2.6 The role of milk proteins in yoghurt texture ................................. 23
2.7 The role of EPS in yoghurt texture ............................................... 27
2.8 Rheological determination of yoghurt texture .............................. 29
2.9 Enrichment of yoghurt mix ........................................................... 34
2.9.1 Calcium supplementation.............................................................. 34
2.9.2 Whey protein supplementation ..................................................... 37
2.9.3 Addition of sucrose to yoghurt...................................................... 40
2.10 Milk composition and processing factors ..................................... 41
3 Production and Rheological Characterization of Exopolysaccharides
Produced by Strains of Streptococcus thermophilus.................................... 43
3.1 Introduction................................................................................... 43
3.2 Materials and methods .................................................................. 45
3.2.1 Bacterial cultures........................................................................... 45
3.2.2 Cell growth and EPS production and isolation ............................. 45
xiii
3.2.3 Rheological characterization of EPS............................................. 47
3.2.4 Statistical analysis ......................................................................... 48
3.3 Results and discussion .................................................................. 49
3.3.1 Microbiological and chemical analysis......................................... 49
3.3.2 The flow behavior of the crude EPS solutions.............................. 55
3.4 Conclusions ................................................................................................. 67
4 Effects of Exopolysaccharide-Producing Strains of Streptococus
thermophilus on Technological and Rheological Properties of Fermented
Milk.............................................................................................................. 69
4.1 Introduction................................................................................... 69
4.2 Materials and methods .................................................................. 72
4.2.1 Materials........................................................................................ 72
4.2.2 Experimental design and statistical analysis ................................. 73
4.2.3 Preparation of fermented milk batches ......................................... 73
4.2.4 Technological, microbial and chemical properties of fermented
milk ............................................................................................... 74
4.2.5 Rheological properties of fermented milk..................................... 75
4.3 Results and discussion .................................................................. 77
4.3.1 Technological, microbial and chemical properties of fermented
milk ............................................................................................... 77
4.3.2 Rheological properties .................................................................. 83
4.4 Conclusions................................................................................... 89
5 Rheological Properties of Fermented Milk Produced by a Single
Exopolysaccharide Producing Streptococcus thermophilus Strain in the
Presence of Added Calcium and Sucrose..................................................... 91
5.1 Introduction................................................................................... 91
5.2 Materials and methods .................................................................. 93
5.2.1 Materials........................................................................................ 93
5.2.2 Experimental design and statistical analysis ................................. 93
5.2.3 Preparation of fermented milk batches ......................................... 94
5.2.4 Bacterial growth and EPS concentration in fermented milk......... 94
5.2.5 Rheological and physical properties of fermented milk ............... 96
5.3 Results and discussion .................................................................. 97
5.3.1 Bacterial growth and EPS concentration in fermented milk......... 97

xiv
5.3.2 Rheological and physical properties of fermented milk ............... 99
5.4 Conclusion .................................................................................. 113
6 Physico-Chemical and Rheological Properties of Calcium-Fortified Low-Fat
Fermented Milk Supplemented with Whey Proteins ................................. 114
6.1 Introduction................................................................................. 114
6.2 Materials and methods ................................................................ 116
6.2.1 Fermented milk cultures.............................................................. 116
6.2.2 Experimental design and statistical analysis ............................... 116
6.2.3 Preparation of fermented milk batches ....................................... 117
6.2.4 Microbial and chemical properties of fermented milk................ 119
6.2.5 Rheological and physical properties of fermented milk ............. 120
6.3 Results and discussion ................................................................ 121
6.3.1 Microbial and chemical properties.............................................. 121
6.3.2 Rheological and physical properties ........................................... 125
6.4 Conclusions................................................................................. 132
7 Structural Properties of Fermented Milk as Affected by Culture Type and
Casein to Whey Protein Ratio .................................................................... 134
7.1 Introduction................................................................................. 134
7.2 Materials and methods ................................................................ 137
7.2.1 Preparation of mixture ................................................................ 137
7.2.2 Viable cell count and EPS production ........................................ 138
7.2.3 Physical properties of fermented milk gels................................. 138
7.2.4 The rheological characteristics of set-type fermented milk ........ 140
7.2.5 Statistical analysis ....................................................................... 141
7.3 Result and discussion .................................................................. 142
7.3.1 Bacterial growth and EPS production ......................................... 142
7.3.2 Gelling properties of acid induced gels in the presence of EPS and
heat-untreated or heat-treated WPI ............................................. 144
7.3.3 Physical properties of fermented milk samples .......................... 148
7.3.4 Rheological properties of fermented milk with the EPS and native
and heat-treated whey proteins.................................................... 151
7.4 Conclusions................................................................................. 158
8 Summary of Results and Future Research Directions................................. 159
8.1 Summary of Results .................................................................... 159

xv
8.2 Future research directions ........................................................... 163
9 List of References ....................................................................................... 166

xvi
List of Tables
Table 3.1 Cell growth parameters of capsular-ropy and capsular strain of
Streptococcus thermophilus as affected by temperature and sugar source during
growth phase ......................................................................................................... 52
Table 3.2 Adjusted mean squares from analysis of variance of the Ostwald
parameters of capsular-ropy and capsular exopolysaccharide, at pH 3 and 6.5,
different concentrations and temperatures ............................................................ 56
Table 3.3 Concentration dependency of consistency (K) and flow behaviour (n)
index of EPS dispersions at pH 3 and 4, 20, 37 or 42 °C ..................................... 57
Table 3.4 Concentration dependency of consistency (K) and flow behaviour (n)
index of EPS dispersions at pH 6.5 and 4, 20, 37 or 42 °C .................................. 58
Table 3.5 Parameters of apparent viscosity (at 100/s shear rate) as a function of
concentration for capsular-ropy and capsular EPS dispersions at temperatures
ranging from 4 to 42 °C ........................................................................................ 60
Table 3.6 Arrhenius-like temperature dependency of apparent viscosity of
capsular-ropy and capsular EPS dispersions of different concentrations
determined at 100/s shear rate and pH 3 and 6.5 .................................................. 63
Table 3.7 Adjusted mean squares from analysis of variance of the Cross model
parameters of capsular-ropy and capsular exopolysaccharide, at pH 3 and 6.5, and
different concentrations......................................................................................... 65
Table 3.8 The Cross model parameters describing the dependence of the apparent
viscosity of capsular-ropy and capsular EPS dispersions on the concentration at
pH 3 and 6.5 .......................................................................................................... 66
Table 4.1 The fermentation time, acidification rate, titratable acidity, syneresis,
hysteresis loop area, elastic modulus and loss tangents of fermented milk batches
incubated by Streptococcus thermophilus ST1275 or ST285 at 30, 37 or 42 °C and
stored for 30 days at 4 °C...................................................................................... 81
Table 4.2 Consistency (K) and flow behaviour (n) index during cold storage of
fermented milk batches produced with Streptococcus thermophilus ST 1275 or ST
285 by fermentation at 30, 37 or 42 °C and stored at 4 °C for 30 days. ............... 86

xvii
Table 5.1 Microbiological properties and EPS concentration of yoghurt base
fortified with sucrose (0, 15 30, 45 mM) and calcium (0, 3, 6, 9 mM) and
fermented using Streptococcus thermophilus ST 1275 and ST 285 as acidulants at
42 °C ..................................................................................................................... 98
Table 5.2 Rheological and physical properties of yoghurt bases fortified with
sucrose (0, 15 30, 45 mM) and calcium (0, 3, 6, 9 mM) and acidified using
glucono-δ-lactone at 42 °C ................................................................................. 100
Table 5.3 Rheological and physical properties of fermented milk batches fortified
with calcium (0, 3, 6, 9 mM) and fermented using Streptococcus thermophilus ST
1275 and ST 285 at 42 °C, and addition of sucrose (0, 15 30, 45 mM).............. 101
Table 6.1 Experimental design and levels of factors in natural and coded values
............................................................................................................................. 118
Table 6.2 Regression coefficients of the second-order polynomial model for the
response variables (analysis has been performed using coded units) for WPC.. 121
Table 6.3 Regression coefficients of the second-order polynomial model for the
response variables (analysis has been performed using coded units) for WPI ... 123
Table 7.1 Physical and chemical properties of fermented milk supplemented with
either heat-untreated or heat-treated whey protein isolate and acidified using GDL
or capsular-ropy or capsular EPS producing strains of Streptococcus thermophilus
at 42 °C................................................................................................................ 143
Table 7.2 Rheological properties of the fermented milk supplemented with either
native or heat-treated whey protein isolate and acidified using GDL or capsular-
ropy or capsular EPS producing strains of Streptococcus thermophilus at 42 °C.
............................................................................................................................. 153

xviii
List of Figures
Figure 3.1 The viable cell counts of the capsular-ropy (A) and the capsular (B)
strain of Streptococcus thermophilus cultivated in a M17 medium supplemented
with glucose, galactose or lactose, at 30, 37 or 42 °C, for 24 hours. .................... 51
Figure 3.2 The exopolysaccharide production by the capsular-ropy (A) and the
capsular (B) strain of Streptococcus thermophilus grown in a M17 medium
supplemented with glucose, galactose or lactose, at 30, 37 or 42 °C, for 24 hours.
............................................................................................................................... 53
Figure 3.3 Arrhenius plot of temperature from 0 to 42 °C and concentration from
0.25-1 g/100 g (0.25 - ◇; 0.5 - ■; 0.75 - ▽; 1 g/100 g EPS - ●) at pH 3.0 and
apparent viscosity of capsular-ropy (solid line) and capsular (dashed line) EPS at
shear rate of 100/s. ................................................................................................ 61
Figure 3.4 Arrhenius plot of temperature from 0 to 42 °C and concentration from
0.25-1 g/100 g (0.25 - ◇; 0.5 - ■; 0.75 - ▽; 1 g/100 g EPS - ●) at pH 6.5 and
apparent viscosity of capsular-ropy (solid line) and capsular (dashed line) EPS at
shear rate of 100/s. ................................................................................................ 62
Figure 4.1 Method for determination of EPS concentration ................................ 76
Figure 4.2 Time dependent pH change during the production of fermented milk
batches using Streptococcus thermophilus ST 1275 (capsular-ropy) or
Streptococcus thermophilus ST 285 (capsular) at 30, 37 or 42 °C prior to the cold
storage. (Legend presented as i.e. ST1275, 30 indicates the strain and fermentation
temperature). ......................................................................................................... 78
Figure 4.3 The viable cell counts and EPS concentrations in fermented milk
batches fermented by Streptococcus thermophilus ST 1275 (A) or ST 285 (B) at
30, 37 or 42 °C and stored for 30 days at 4 °C. (The error bars indicate the SEM
of 0.24 cfu/mL and 0.05 cfu/mL for the cell count and EPS concentration,
respectively, n≥4; legend presented as i.e. CFU,30 indicates the measured
characteristic and fermentation temperature)........................................................ 80
Figure 4.4 Storage modulus (G’) of yoghurt batches as a function of oscillatory
frequency. Yoghurt samples were produced by Streptococcus thermophilus ST

xix
1275 (A) or ST 285 (B) by fermentation at 30, 37 or 42 °C and stored for 30 days
at 4 °C. Samples were taken at day 1 (○, □, ◊} for 30, 37 and 42 °C, respectively),
day 7 (+, x, * for 30, 37 and 42 °C, respectively), and day 30 (●, ■, ♦ for 30, 37
and 42 °C, respectively), of storage. ..................................................................... 84
Figure 4.5 The thixotropy loop of fermented milk batches prepared by
Streptococcus thermophilus ST 1275 at 30, 37 or 42 °C and stored for 1 day (A)
or 30 days (B) at 4 °C............................................................................................ 87
Figure 5.1 The effect of calcium fortification on the flow behaviour of the
fermented milk batches prepared using glucono-δ-lactone (GDL) as the acidifier
and without (A) or with 45 mM (B) sucrose addition. (The legends depicted by
the arrows present the calcium chloride (Ca) concentration of 0, 3, 6 or 9 mM).
The data present the average of three independent determinations. ................... 104
Figure 5.2 The effect of calcium fortification on the flow behaviour of the
fermented milk batches prepared using capsular-ropy strain of Streptococcus
thermophilus and without (A) or with 45 mM (B) sucrose addition. (The legends
depicted by the arrows present the calcium chloride (Ca) concentration of 0, 3, 6
or 9 mM). The data present the average of three independent determinations. .. 105
Figure 5.3 The effect of calcium fortification on the flow behaviour of fermented
milk batches prepared using capsular strain of Streptococcus thermophilus and
without (A) or with 45 mM (B) sucrose addition. (The legends depicted by the
arrows present the calcium chloride (Ca) concentration of 0, 3, 6 or 9 mM). The
data present the average of three independent determinations............................ 106
Figure 5.4 The first derivative of the average upward shear stress – shear rate
profiles of the fermented milk batches supplemented with 45 mM sucrose and 0 or
45 mM CaCl2 acidified using GDL (A), capsular-ropy strain (B) or capsular strain
(C) of Streptococcus thermophilus...................................................................... 109
Figure 5.5 Plots of the apparent viscosity versus shear stress for fermented milk
batches prepared by direct acidification by GDL or fermentation by capsular-ropy
or capsular strains of Streptococcus thermophilus and supplemented with (A) 45
mM sucrose and 0 or 9 mM CaCl2 or (B) 9 mM CaCl2 and 0 or 45 mM sucrose.
............................................................................................................................. 111
Figure 6.1 Typical estimated responses achieved by the response surface
modelling showing the effects of the calcium chloride and whey protein

xx
concentrate additions on (A) the gel elastic modulus (G’) (B) the EPS production
by Streptococcus thermophilus and (C) the extent of the syneresis of the
fermented milk batches after overnight cold storage. ......................................... 126
Figure 6.2 Typical estimated responses achieved by the response surface
modeling showing the effects of the calcium chloride and whey protein isolate
additions on (A) the gel elastic modulus (G’) (B) the EPS production by
Streptoccocus thermophilus and (C) the extent of the syneresis of the fermented
milk batches after overnight cold storage. .......................................................... 127
Figure 7.1 Changes in elastic moduli (G’) during gelation of fermented milk
acidified with glucono-δ-lactone for control mixture (+), and those containing
casein:whey protein ratio of 3:1 (∆ for heat-untreated, and ▲for heat-treated whey
protein), and casein: heat-untreated whey protein ratio of 1:1 (□ for heat-untreated
and ■ for heat-treated whey protein), fermented at 42 °C. ................................. 145
Figure 7.2 Changes in elastic moduli (G’) during gelation of fermented milk
acidified with capsular-ropy strain of Streptococcus thermophilus for control
mixture (+), and those containing casein:whey protein ratio of 3:1 (∆ for heat-
untreated, and ▲for heat-treated whey protein), and casein: heat-untreated whey
protein ratio of 1:1 (□ for heat-untreated and ■ heat-treated whey protein)
fermented at 42 °C. ............................................................................................. 146
Figure 7.3 Changes in elastic moduli (G’) during gelation of fermented milk
acidified with capsular strain of Streptococcus thermophilus for control mixture
(+), and those containing casein:whey protein ratio of 3:1 (∆ for heat-untreated,
and ▲for heat-treated whey protein), and casein: heat-untreated whey protein
ratio of 1:1 (□ for heat-untreated and ■ for heat-treated whey protein) fermented at
42 °C. .................................................................................................................. 147

1
1 Introduction
1.1 Background
Yoghurt market has shown a marked increase in recent years in the
European countries and US. Moreover, yoghurt has also entered the market in
Asian and Middle Eastern countries. Although nearly every culture in the world
recognised this product in the past (Vasiljevic and Shah, 2007), its largest market
currently has been Europe, followed by the US (Defra, 2007). The world market
volume is now around 14.5 millions tonnes, with market growth around 5%
(Defra, 2007). The per capita consumption of fermented milk has been
continuously increasing even in European countries and the US, and has reached
around 10-15 pounds in Canada and UK, 5.4 pounds in the US, and 30 pounds in
some European countries (Cook, 2003).
The health benefits of yoghurt were frequently cited very early, especially at
the beginning of the last century. Nowadays, it is an important part of every day
diet for the maintenance and improvement of health status in the society. The
health benefits of yoghurt are even more improved due to its ability to be a vehicle
for probiotics and nutrient supplementation. Since yoghurt has also gained a very
good acceptance in children and the elderly, it is now an important element of the
health improvement strategies for these groups. Calcium intake has been declining
(Perales et al., 2006), partly due to lower consumption of milk. This may lead to
several potential health problems associated with calcium deficiency such as
hypovitaminosis and related diseases (Calvo et al., 2004). On the other hand, milk
and milk products including yoghurt provide good environment for a better
calcium bioavailability (Kitts and Kwong, 2004). Milk phosphopeptides enhance
the availability calcium added in milk or milk products. Yoghurt has been
recommended for athletes who experienced bone fractures and stress to increase
the calcium intake (Cook, 2003).

2
Although health-related attributes are likely the main characteristic driving
the yoghurt acceptance, sensory properties such as flavour and texture are also
important. Despite the high attractiveness of non-fat yoghurt for its consumption,
the desirable texture has the ‘creamy’ mouthfeel (Jaworska et al., 2005).
Therefore, the texture creation of yoghurt is an important facet in designing any
new yoghurt product(s) with additional health advantages. The texture of yoghurt
is determined by fermentation conditions and interaction of yoghurt components,
especially casein, whey protein, and exopolysaccharide (EPS) produced by
yoghurt starter cultures (Lucey et al., 1998). Temperature, for example, affects
protein-protein arrangement within the three-dimensional structure of yoghurt.
EPS, as a member of hydrocolloid groups potentially gives ‘creamy’ characteristic
in yoghurt (Cayot et al., 2008). Although it is well-known for its very limited
amount produced in yoghurt, it plays an important role in texture creation of the
final product. The types of EPS vary the yoghurt texture from shiny to dull, from
ropy to crumble or brittle (Cayot et al., 2008). In regard to this characteristic, EPS
are categorised into two main groups, ropy and non-ropy or capsular EPS. To add
to the diversity, some strains produce a mixture of the two types of EPS with
various proportion (Zisu and Shah, 2002, 2003). Their effect on the yoghurt
texture is not easily predicted. Sucrose is a very common additive in yoghurt
manufacturing and drives the flavour perception (Perez et al., 1994). It potentially
affects the yoghurt texture through its interactions with either milk proteins (Braga
and Cunha, 2004) or EPS (Yanes et al., 2002). Other supplements such as calcium
(Achanta et al., 2007) and whey proteins (Guggisberg et al., 2007, Oliveira et al.,
2001, Patocka et al., 2004) may also have a significant influence on the texture of
yoghurt through their possible interactions with caseins and/or
exopolysaccharides.
1.2 Aims
The main aims of this research were to study the effect of exopolysaccharide
producing strains of Streptococcus thermophilus on the rheological and physical
properties of various set type fermented milk products including fermented milk
3
fortified with calcium and/or whey proteins. A special discussion will focus on the
role of exopolysaccharide in determining the final texture of set type fermented
milk. Set-type fermented milk was selected due to its intact texture that would
better describe various interactions that would take place during fermentation and
supplementation with various adjuncts. It was expected to achieve texture of
fermented milk as semi solid gel with minimum syneresis, and shear-resistant
character.
The specific aims of this research are to study:
1. the effect of carbon source, temperature and fermentation time on the
growth and EPS production of two strains of S. thermophilus one produces
mixed of capsular and ropy EPS, and the other produces capsular EPS.
2. the characteristics of two types of EPS determined using rheological
methodology
3. the effect of incorporation of two strains of S. thermophilus producing
different types of EPS in production of low-fat fermented milk on the final
texture as affected by fermentation temperature and storage time
4. the effect of calcium or/and sucrose addition and EPS-producing strains on
the texture of low-fat fermented milk
5. the effect of addition of calcium and whey protein isolate or whey protein
concentrate on the texture of low-fat fermented milk prepared using
capsular-ropy strain of S. thermophilus
6. the effect of supplementation of non-heat-treated and heat-treated whey
proteins and two types of EPS on the gelation properties of low-fat
fermented milk.
1.3 Thesis outline
Chapter two presents a review of the literature on the health benefit of
fermented milk, fermented milk quality acceptance and textural quality, yoghurt
starter cultures and their growth in fermented milk, exopolysaccharide production
in fermented milk and their effects on final texture, rheological method in

4
analysing fermented milk texture, and the effect of calcium or whey protein
supplementation on fermented milk texture.
Throughout the study, the strains used are Streptococcus thermophilus ST
1275 and ST 285. The S. thermophilus ST 1275 produces both ropy and capsular
EPS, but mostly ropy type. Therefore, we called this strain as capsular-ropy EPS
producer. Whilst, strain ST 285 produces both type of EPS, but mostly capsular
type of EPS. The study on the characterization of EPS of these strains was carried
out by Zisu & Shah (2003, 2005).
Chapter three reports a study on the production of EPS by two strains of
Streptococcus thermophilus which produced capsular-ropy (strain ST 1275) and
capsular EPS (strain ST 285) respectively, as the effect of carbon source and
temperature. The medium used was M17 containing glucose, galactose or lactose
at 2% sugar concentration. The incubation temperatures were set at 30, 37 and 42
°C. A particular attention was given to the conditions to give the highest amount
of EPS produced. The rheological and physico-chemical characterization of
capsular-ropy or capsular EPS was then carried out. The behaviour of EPS
dispersion during shearing as the effect of concentrations was studied. The
mobility of EPS molecules in the dispersion due to hydration and enlargement
was predicted using Cross model. Subsequently, degree of entanglement was also
predicted.
Chapter four reveals the results from the experiment on the physico-
chemical and textural characteristics of low-fat set-styled fermented milk as
affected by the two strains of S. thermophilus producing different type of EPS and
fermentation temperatures. The effect of EPS was examined by using artificial
acidulant glucono-δ-lactone. The temperatures applied were 30, 37, and 42 °C.
The total solid was 14%, and bacterial inoculation was set at 2%.
Chapter five deals with the study on calcium supplementation in low-fat
fermented milk in the presence of sucrose, and fermented by the two strains of S.
thermophilus. The fermentation temperature was set at 42 °C, and calcium
chloride concentration varied from 0 to 9 mM. Sucrose concentrations were 0, 15,
30, 45 mM. The total solid and inoculum level were 14 and 2%, respectively.

5
Chapter six presents the report on the combined effects of calcium and whey
protein concentrate or whey protein isolate on the physico-chemical
characteristics of low-fat fermented milk produced using capsular-ropy strain of S.
thermophilus, fermented at 42 °C. The experimental design and data analysis were
carried out using the response surface methodology. Optimum combinations
between concentrations of calcium chloride and whey protein concentrate or
isolate were explored.
Chapter seven demonstrates the gelation behaviour of fermented milk
prepared using the two strains of S. thermophilus differing in their EPS type, as
affected by whey protein addition in native or heat-treated form. The structural
development was followed by rheological method, revealing the changes in
storage moduli over time. The final textural properties were assessed by both
physico-chemical and rheological methods.
Chapter eight provides the summary of the results of all experiments carried
out in this study, and underlines important findings. This chapter also presents a
possible future research to further explore the possibilities of producing yoghurt
with additional health benefits, without impairing physical and sensory quality.

6
2 Literature Review
2.1 Yoghurt - consumption and health benefits
Before Ellie Metchnikoff in 1910 related health benefits of yoghurt to
longevity of the Bulgarian peasants, the attention paid to this product was rather
minor. Around the mid of the last century an extensive industry-driven research
started to take place in an attempt to reveal all the benefits related to this product
(Vasiljevic and Shah, 2007). As a result, more recently yoghurt started to be
considered as an important part of a healthy diet in order to improve overall well
being. It is one among the recommended foods for infants and toddlers to improve
health and eating habit in the US (Fox et al., 2004). The aggressive marketing
campaign that utilized the health potential resulted in the good response and lead
to an increase (Sloan, 2004). At present, the world market for this product
increased around 5%, projected to reach 14.5 million tonnes consisting of various
types of yoghurts (Defra, 2007). The largest market is European Union, and the
fastest growing markets (8% per year) are Latin America, Africa and the Middle
East. Consumers are attracted by the ‘healthiness’ attribute of yoghurt, rather than
desirable flavour or pleasure (Valli and Traill, 2005), although some others
perceived yoghurt as ‘slimmy’ and ‘healthy’ product with pleasant flavour (Kim
et al., 1997). It is one of the ‘healthy’ food choice in ‘health conscious group’ to
reduce their fat intake (Bowman and Davis, 1996). Yoghurt consumption is also
influenced by country, knowledge about yoghurt, as well as socio-demographic
factors (Valli and Traill, 2005). It consumed as a snack, popular for young and
elderly in Europe (Valli and Traill, 2005), and children in the US (Sloan, 2006).
The health benefits of yoghurt were originally associated with
microorganisms involved in yoghurt fermentation, and/or its fermentation
products. However, more recently many other physiological benefits have been
recognized that originated from other yoghurt components. Two main species of
bacteria used as starter culture in the production of yoghurt are Lactobacillus

7
delbrueckii subsp. bulgaricus, and Streptococcus thermophilus. Consumption of
yoghurt also presents a way of administration of living yoghurt bacteria into the
gastrointestinal tract. By surviving low acid environment and presence of bile
acid, this culture may eventually reach intestine where native community of
microflora is already established. The mutual interaction with the gut microflora
may further lead to several health benefits to the host, depending on several
factors such as the ability and duration of the yoghurt bacteria to reside in the gut.
Among the well-known health advantages of yoghurt is the ability of yoghurt
cultures to improve lactose digestion by making it metabolically available for
people with lactose-intolerance (Guarner et al., 2005). Accordingly, better lactose
metabolism reduced the extent of flatulence, abdominal pain and diarrhea
(Hertzler and Clancy, 2003). Yoghurt contained microbial metabolic product
which may benefit human health, such as lactic acid, free amino and fatty acids
(Gurr, 1987), as well as low-calorie sugars and B vitamins (Hugenholtz and Smid,
2002).
Yoghurt cultures commonly used are strains of Lactobacillus delbrueckii
ssp. bulgaricus and Streptococcus thermophilus. L. bulgaricus may impart
specific sensory properties due to ‘post-acidification’ (Oliveira et al., 2001).
Alternatively, yoghurt may be produced by a single strain culture of S.
thermophilus, which results in a mild flavour. This approach has been
accommodated by several regulatory bodies. In Australia, yoghurt is defined as a
fermented milk produced by fermentation with lactic acid producing
microorganisms (FSANZ, 2003). This particular strain also gives a desirable body
to yoghurt due to its production of exopolysaccharides (Hassan et al., 1996a). The
presence of EPS in fermented products influences several important sensory
properties, including mouth thickness, shininess, clean cut, ropiness and
creaminess (Folkenberg et al., 2005). Due to discrepancy in regulations
worldwide, the products produced from a yoghurt base and fermented by a single
strain of a mixed yoghurt culture or any other lactic acid bacterium are generally
termed fermented milks.
Yoghurt starter cultures exhibited probiotic effect, although it is weaker than
those of probiotic species, based on the resistance to gastric juice and bile acid, β-

8
galactosidase activity, and hydrophobicity (Vinderola et al., 2005). Consumption
of yoghurt is adversely related to the incidence of vascular disease due to
reduction of serum tHcy (Ganji and Kafai, 2004) and greater protective effect
against stroke (Bernal-Pacheco and Roman, 2007). Reduced serum cholesterol
level was observed after 42 days consumption (Canzi et al., 2000). Yoghurt
containing living or dead bacteria inhibited activity of α-amylase, α-glucosidase,
pancreatic α-amylase, and angiotensin-converting-enzyme-I (ACE-I), rendering
its consumption suitable for diabetics and people with high risk of cardiac disease
(Apostolidis et al., 2006).
Both yoghurt cultures potentially survive harsh environment in the gut
(Mater et al., 2005), and may alter gut microbiota composition (Alander et al.,
1999, Canzi et al., 2000). Their residing in the gut may suppress the growth of
pathogenic bacteria such as Listeria monocytogenes (Benkerroum et al., 2002). S.
thermophilus produced bacteriocin with anti-listeria activity (Villani et al., 1995).
There was a possible immunomodulation effect of yoghurt cultures. The immune
enhancing effect of consumption of yoghurt fermented using S. thermophilus and
L. delbrueckii subsp. bulgaricus was observed, but may be absent depending on
the strains (Makino et al., 2006). When consumed as live bacteria, the systemic
immune response can be enhanced through stimulation of anti-inflammatory
cytokines (TNF-α, IFN-γ, or IL-12) (Perdigon et al., 2003). L. delbrueckii subsp.
bulgaricus exhibited good adherence to intestinal mucus, thus potentially
provided a health benefit by modulation of immune system as well as reduction of
allergy in infants (Ouwehand et al., 1999). Both yoghurt cultures induced
proliferation of Payer’s patch and splenic B cells, to give immunostimulatory
effect (Kitazawa et al., 2003). Result on the effect of yoghurt starter culture on
alleviation of food allergy was not consistent, as they did not show any effect,
except when supplemented with probiotic (Cross et al., 2001).
S. thermophilus exhibited lesser probiotic effect compared to L. delbrueckii
subsp bulgaricus (Vinderola et al., 2006). However, S. thermophilus may provide
certain health benefits through its production of exopolysaccharides (EPS), a
carbohydrate essential for yoghurt textural building. Some strains of L.
delbrueckii subsp bulgaricus are also EPS-producers (Welman and Maddox,
9
2003). Exopolysaccaharides may appear in two forms: as capsular or slimy
(extracellular) EPS (Wicken et al., 1983a). Capsular EPS is a thick outermost
layer covalently attached to cell wall, while ‘slimy’ EPS is excreted into the
medium. Nevertheless, some strains may have both types of EPS with various
proportions between the two (Zisu and Shah, 2005b, 2007). From a technological
point of view, ropy EPS give a ‘ropy’ appearance to yoghurt, a continuous strand-
like structure. When this yoghurt is probed by a stick which is lifted or pulled up
to a certain distance before the strand is broken (Folkenberg et al., 2006a). Thus,
ropiness is a non-oral parameter of yoghurt. On the other hand, EPS in yoghurt
that do not show strand-like structure are categorised as ‘non-ropy’ EPS. Ropy
EPS fill the pores in the protein network in yoghurt, with more ropy EPS showing
a more compact strand-like structure than less ropy EPS (Hassan et al., 2003a).
Carbohydrate components attached on the surface of lactic acid bacteria may
facilitate colonization of mucus in the colon (Vandevoorde et al., 1992), and
subsequently inhibit pathogens’ colonization in the area (Spencer and Chesson,
1994). Although the role of carbohydrates on the cell surface on binding appeared
to be inferior to that of proteinaceous portion (Rojas et al., 2002), carbohydrate-
rich cell surface was also adhesive (Schaer-Zammaretti and Ubbink, 2003). On the
other hand, carbohydrate component was apparently important in facilitating
aggregation and co-aggregation processes (Spencer and Chesson, 1994).
Aggregation was a characteristics related to cell persistence in the gut, allowing
sufficient time to produce a probiotic effect (Cesena et al., 2001). On the other
hand, co-aggregation was related to cell binding to pathogens. Some Lactobacillus
strains shared carbohydrate-binding specificity with pathogenic bacteria. Some
lactobacilli co-aggregated to Escherichia coli and Salmonella enteridis, and
consequently reduced the growth of the pathogens through competitive or
exclusion mechanism (Drago et al., 1997). Excreted EPS may also support growth
of probiotic bacteria by providing carbon source (Chung and Day, 2002). Acidic
fraction of high molecular weight EPS produced in yoghurt fermented with both
yoghurt starter cultures was related to immunomodulation effect, specifically by
stimulation of production of interferon-γ and increased the activity of natural
killers (Makino et al., 2006). It was proposed that the difference in the ability to

10
modulate immune response among bacteria may originate from the surface
properties (Perdigon et al., 2003).
In order to improve health benefits of yoghurt, probiotic bacteria are
frequently included in the product during yoghurt manufacture. The resistance to
extremely low acid and bile acid of probiotic bacteria can overcome the problem
of the lack of these characteristics in yoghurt starter cultures, as well as proved
more pronounced health-improving effects including reduction of serum
cholesterol and anti-carcinogenic activities (Lourens-Hattingh and Viljoen, 2001).
In this case, the survival and viability of probiotic during yoghurt fermentation
and storage are important attributes. Probiotic bacteria may be antagonistic to
yoghurt starter culture. L. acidophilus produces anti-bacterial substances active
against L. delbrueckii subsp bulgaricus. On the other hand, L. delbrueckii subsp.
bulgaricus also produces hydrogen peroxide, which is toxic to L. acidophilus. In
contrast, Bifidobacterium bifidus grows in synergy with S. thermophilus. S.
thermophilus is capable of utilising oxygen in a significant amount, thus providing
anaerobic environment supportive for the growth of B. bifidum. Another important
consideration is avoiding suppression of the growth of probiotic bacteria due to
the over dominance of yoghurt culture, by controlling the culture inoculum level,
cell number during fermentation and storage, as well as production of metabolites.
The minimum concentration of probiotics to result in a health effect (therapeutic
minimum level) varies from 106 (Rybka and Kailasapathy, 1995).
2.2 Yoghurt microorganisms
Two yoghurt cultures, Lactobacillus delbrueckii subsp bulgaricus and
Streptococcus thermophilus, grow symbiotically in yoghurt and support each
other’s growth and subsequently produce lactic acid (Tamime and Robinson,
1985). Proteolytic activity is also important for survival and growth of bacteria in
milk. However, S. thermophilus is described as a poor proteolytic species, thus
requires several essential amino acids for its growth with valine apparently the
most important (Tamime and Robinson, 1985). L. delbrueckii subsp bulgaricus

11
provides the amino acids through its proteolytic activity. On the other hand, the
growth of Lactobacillus is promoted by organic acids and carbon dioxide
produced by S. thermophilus. This species also produces vitamins, including folic
acid, required for the growth of L. delbrueckii subsp bulgaricus. During
fermentation, L. delbrueckii subsp bulgaricus first releases catabolic products
form milk proteins which are then used by S. thermophilus to grow profusely and
consequently produce lactic acid and other organic acids including formic acid
essential for the growth of L. delbrueckii subsp bulgaricus. The synergistic
interaction between the two is also shown in their EPS production and eventually
increase viscosity of yoghurt (Moreira et al., 2000). The geometry of the two
bacteria affected their metabolic performance (Ginovart et al., 2002). In this case,
the ratio of surface and biomass (S/M ratio) is larger in S. thermophilus, thus
provided the cells with better absorption of substrate and faster growth. However,
the decline in growth was also earlier in this species, due to high lactic acid
concentration. Whilst S. thermophilus cease to grow at low pH, the cells of L.
delbrueckii subsp bulgaricus continue growing.
Sugar utilization by yoghurt cultures is initiated by its transport across cell
wall into the cytoplasm. It is commonly recognised that there are primary and
secondary transport systems (Poolman, 2002a). The energy for the first type is
drawn from the ATP pool, while the second type uses the energy generated by the
proton motive force derived from the difference in the internal and external pH
and transmembrane potential. The primary transport system is common in lactic
acid bacteria for the accumulation of substrates and compatible solutes and
expulsion of unwanted metabolic products. The secondary systems, also called
group translocation, mostly use carbohydrates and alditols as substrates. Some of
lactic acid bacteria transport lactose via the secondary transport system involving
phosphotranferase phosphoenolpyruvate-dependent system (Tamime and
Robinson, 1985). However, the operons expressing this system are absent in
yoghurt culture (Poolman, 2002a). They rather utilize a specific permease for the
lactose uptake with concomitant excretion of galactose (Tamime and Robinson,
1985). Subsequently, lactose is activate and converted into lactose-P (glucosyl β-
(1,4)-galactoside-6P) which is then further cleaved into D-glucose and β-D-
12
galactose via glycolysis. The glucose passes through the Embden-Meyerhoff-
Parnas pathway to produce pyruvate as the end product. The pyruvate is
metabolised to produce various metabolites, with lactic acid as the main product.
Several other products includes organic acids such as formic and acetic acid,
flavour compounds such as acetaldehyde, diacetyl and ethanol, and amino acid
such as alanine (Kleerebezem et al., 2000). The conversion of pyruvate to lactic
acid is facilitated by lactate dehydrogenase (LDH). In lactic acid bacteria, the
activity of this enzyme is typically high, leads to high rate and less efficient
metabolism (Hugenholtz and Kleerebezem, 1999). As a consequence, the growth
is very abundant in a nutrient rich environment, makes these bacteria potentially
inhibit growth of other bacteria by outgrowing them or rapid reduction of pH
through lactic acid production.
The galactose moity is excreted back into the medium, and can be
incorporated into other metabolic pathway, depending on the ability of strain to
metabolise galactose (Poolman, 2002a). It became apparent that certain portion of
galactose may not be excreted, and may take part in the synthesis of
exopolysaccharides. The bacterial utilization of galactose in lactic acid
fermentation is of technological interest, since it improves cell metabolic economy
especially in carbon source utilization. Whilst most of lactobacillus strains are
capable of utilising galactose, most strains of S. thermophilus have limited
capacity to ferment it. Galactose fermenting ability of this species varies from
completely unable to complete ability to utilise galactose (de Vin et al., 2005).
Some strains loose this ability after several hours. Galactose may be incorporated
in both energy-generating and synthesis metabolism (Boels et al., 2001). The
catabolic pathway for this sugar is tagatose-6-P pathway, while the synthesis is
via Leloir pathway. In S. thermophilus, apparently the energy-generating system
in the presence of galactose operates at a slower rate resulting in a slower cell
growth, compared to that of other sugars. In this species, the main product of
Leloir pathway is sugar nucleotide, a monomer for EPS polymer building. In L.
bulgaricus, however, the presence of galactose metabolising enzymes and Leloir
pathway may not always relate to EPS production (Marshall et al., 2001b). In
general, strains of S. thermophilus possess the Leloir pathway, however the

13
system varies in the activity rate. In Gal- strains, the enzymes in the system are
less active than in Gal+ strains (Degeest and de Vuyst 2000).
The rate of sugar uptake and metabolism in lactic acid bacteria varies and
partly depends on a type of sugar available. In this case, a catabolic repression
mechanism regulates the sequence of sugar types to be metabolised (Degeest and
de Vuyst 2000). The preferred sugar is metabolised first, which can cause the
inhibition of metabolism of other sugar(s). It may also mean a higher uptake rate
of preferred sugar (Poolman, 2002a). The catabolic repression is observed when
cells are grown in a mixture of sugars. For instance, S. thermophilus strains,
unlike other gram-positive bacteria, slowly metabolise glucose, but rapidly utilise
sucrose and lactose (Poolman, 2002a). Thus, in the mixture of galactose and
lactose, the smaller lactose portions in the mixture, the slower the uptake rate as
well as glycolysis activity. Similarly, in the later stage of growth, the more
galactose is accumulated, the slower metabolic rate.
2.3 Exopolysaccharide production
In yoghurt, the production of exopolysaccharides by the culture is very low,
maximum of ~500 mg/L, but it plays a major role in the development of texture of
the final product (Bouzar et al. 1997). S. thermophilus is considered to be
responsible for the EPS production, although some strains of L. delbrueckii subsp.
bulgaricus are also EPS-producers. A mutual interaction between the two species
of yoghurt starter cultures has been noticed leading to a higher EPS production
when both grew together (Bouzar et al. 1997). The EPS production of both
yoghurt cultures is growth-associated (Bouzar et al. 1997, Kimmel and Roberts,
1998). Therefore, the optimum EPS production occurs during the maximum of the
cell production (Petry et al. 2000). In general, the EPS production starts during the
exponential phase and may reach the maximum in the stationary phase (Petry et
al. 2000). In the later stage of growth, the EPS degradation may take place
(Deegest and de Vuyst, 2000, Pham et al. 2000) likely due to activation of the
EPS-degrading enzyme(s) with relatively low molecular weight of 50,000-10,000

14
Da (Degeest et al., 2002). Both endo- and exo-enzymes are found to breakdown
the EPS into low molecular weight polymeric compounds, but the activity of
endoenzymes is apparently more dominant (Degeest et al., 2002). It was
suggested that glycohydrolases were responsible for the EPS degradation. The
EPS may be synthesized either from external sugars in the medium or internal
sugars via Leloir pathway (Boels et al. 2001), with the latter pathway likely
occurring in yoghurt. As a consequence, the EPS production is less stable and
easily altered by external factors such as sugar type, temperature and other
supplements. In L. delbrueckii subsp. bulgaricus, lactose supported the EPS
production poorly, while the greater concentrations were achieved in the presence
of glucose (Petry et al. 2000). Sucrose addition into lactose containing medium
increased the EPS production in the lactose-grown cells (Gancel and Novel,
1994). Similarly, lactose supplementation during growth of sucrose-grown cells
also enhanced the EPS production by S. thermophilus. Moreover, there was a
synergistic effect when both sugars were present in the medium. A sugar
concentration may or may not enhance the EPS production and is dependent on
the kind of strain (Petry et al. 2000). In some strains, an excess of sugar
concentration increased the EPS production, while in other strains it did not.
Lower fermentation pH, around 5.8 or 6.0, resulted in a greater EPS concentration
than higher pH (Kimmel and Roberts, 1998, Petry et al., 2000). In mesophilic
strains, lower fermentation temperatures around 15-25 °C increased the EPS and
EPS specific production. Whilst, in S. thermophilic strains, higher temperature
around 42 °C is more supportive for the EPS production (De Vuyst and Degeest,
1999). Some nutrients such orotic acid, thiamine, adenine and xanthine (Petry et
al., 2000a), other members of vitamin B (Chervaux et al., 2000) increased the
growth and subsequently the EPS production. However, in some other strains,
addition of some amino acids and certain types of carbohydrates into the medium
did not enhance its production, since they were not taken up by the cells (Degeest
et al., 2002). The excessive protein addition may reduce the EPS yield (Kimmel
and Roberts, 1998). Similarly, addition of whey permeate in low concentration
was supportive to the EPS production (Macedo et al., 2002). A complex medium
high in nutrients was found to improve the EPS yield, likely due to vitamin and

15
nucleic acids (purin and pirimidin) content (Degeest et al., 2002). Depletion of
oxygen was reported to positively affected EPS production (Petry et al., 2000).
The EPS formation in yoghurt is mostly considered as a product of Leloir
pathway which is expressed in most of S. thermophilus strains. However, the
enzymes are not always in an active stage (Poolman, 2002a). Similarly, all S.
thermophilus studied contained eps operon, responsible for the production of EPS
(Mozzi et al., 2006). The pathway utilises galactose as a substrate which is taken
up from the medium via LacS protein (Poolman et al., 1989). LacS protein can
function either as lactose-glucose antiporter or proton symporter. In S.
thermophilus strains, galactose utilisation mainly relates to the EPS production,
while certain portion is used for the cell wall development (Levander and
Radstrom, 2001). Only minor quantity was incorporated into the energy-
generating metabolism. Galactose metabolising enzyme in this system is
phosphoglucomutase which is responsible for both EPS and lactate production
(Levander and Radstrom, 2001). Only ~10% of the strain population of L.
delbrueckii subsp. bulgaricus studied expressed the eps genes (Mozzi et al.,
2006). For Lactobacillus strains, the EPS production in this pathway is in
particular related to the activity of galactokinase which is absent in non-EPS
producing strain (Mozzi et al., 2001). This system metabolises galactose better
than glucose, and resultes in a slower cell growth (Poolman, 2002a), but greater
EPS yield (Mozzi et al., 2001). Therefore, decreasing galactose concentration in
the medium without observable galactokinase activity at the later stage of
fermentation may indicate that the cells metabolism is switched into tagatose
pathway.
Molecular weight of EPS varies greatly, ranging from ~10 to >5000 kDa
(Mozzi et al., 2006) and affects the rheological properties of EPS. Molecular mass
of EPS may or may not be affected by growth medium, and is mainly strain
dependant (Vaningelgem et al., 2004b). Molecular weight and intrinsic viscosity
of EPS is higher when cells are grown in milk compared to those in a chemically
defined medium (Petry et al., 2003). High molecular mass is an important
characteristic since it relates to ropiness (Mozzi et al., 2006), a characteristic that
greatly influences the yoghurt texture. The ropy EPS consists of mainly high

16
molecular weight EPS as opposed to non-ropy EPS composed of low molecular
weight EPS (Petry et al., 2003). The molecular weight of EPS potentially
influences the EPS-protein interactions by creating depletion flocculation. Some
of the strains also produce ‘floating’ or ‘non-floating’ EPS or mixture of both, but
this characteristic is apparently independent of the molecular weight
(Vaningelgem et al., 2004b). The EPS type is influenced by medium, depending
on the strains. Floating EPS potentially made isolation difficult, due to loss during
precipitation. Main sugar monomers creating the EPS building blocks are glucose
and galactose (Degeest et al., 2002, Marshall et al., 2001a, Petry et al., 2003) and,
in lesser amount, other sugars or their derivatives such as rhamnose (Marshall et
al., 2001a, Petry et al., 2003), and N-acetyl glucosamine (Degeest et al., 2002) or
N-acetyl galactosamine (Vaningelgem et al., 2004b). Galactose is the most
common sugar monomer constructing many types of the EPS secreted by S.
thermophilus (Mozzi et al., 2006, Vaningelgem et al., 2004b). On the other hand,
rhamnose is rarely found in the EPS (Mozzi et al., 2006). The EPS yield varies
among strains and is affected by several external factors. However, the sugar
monomers (Degeest and de Vuyst, 2000a) and their ratio (Mozzi et al., 2006) tend
to remain unchanged. Sugar composition in EPS appears unstable during early
stages of formation, and stabilizes at the later stage. Consequently, the
composition differences among strains frequently diminish at the end of
fermentation.
2.4 Rheological characteristics of EPS
As a hydrocolloid, the EPS exhibit viscoelastic properties of solution.
However, the correlation between EPS and viscosity is very complex, since it is
influenced by concentration, molecular mass, and environmental pH
(Vaningelgem et al., 2004b). Although high molecular weight tends to result in a
higher viscosity, it is not the only governing factor (Petry et al., 2003). For
example, solution containing high concentration of low molecular mass EPS may
have similar viscosity as low concentration of high molecular mass EPS

17
(Vaningelgem et al., 2004a). Another possible factor is the higher proportion of
glucose monomers in the EPS backbone (Petry et al., 2003). Similarly,
consistency of EPS solution is influenced by interaction of the concentration and
molecular mass as well as the molecular structure (Vaningelgem et al., 2004b).
Stiff polymer chain results in a higher consistency. The EPS containing β-linkage
are mostly forming stiff chain (Vaningelgem et al., 2004b). On the other hand, α-
linkage gives flexible polymer characteristics, with less stiffness and lower
consistency. Nevertheless, when the EPS are incorporated into yoghurt
manufacturing, they may behave differently from pure EPS solution due to their
possible interactions with other yoghurt constituents.
The characterization of EPS can be carried out by several methods,
including rheological methodology. Common rheological models for general
viscous liquids include the Power law, Cross, Yasuda, Carreau, and Ellis models
(Macosko, 1994). Modified Power Law model for shear rate against viscosity is
expressed as:
( )1−⋅= nKγη
This model displays shear thinning or shear thickening behaviour, and covers a
wide range of the shear rates. However, it poorly describes a Newtonian flow
commonly encountered at very low shear rate. Hence, two power law indices are
derived, those are K and n. K is consistency index and denotes the viscosity at
shear rate 1/s (Rao, 1999). The exponent n is the flow behaviour index, which
indicates the extent of deviation of material from the Newtonian flow (n = 1).
Shear thinning is indicated by n < 1, while shear thickening is shown by n > 1.
Similarly, the two indices can also be derived from the Power Law model
for shear stress plotted against shear rate (Rao, 1999):
τ = K •γ n
where τ is shear stress (Pa s), •γ is shear rate (1/s), K is consistency index (Pa sn),
and n is the flow behaviour index (dimensionless).
The Cross model is often employed to describe the pseudoplasticity of the
polymer dispersion (Rao, 1999). This model is expressed as:

18
( )m⋅+=
τγηη
10
where K, n, η, γ⋅ are consistency index (mPa sn), flow behaviour index
(dimensionless ), apparent viscosity (mPa s ) and shear rate per second (1/s ),
respectively. η0 is viscosity at shear rate 0/s, τ relaxation time (s), and m is
limiting slope (dimensionless). Yasuda model is expressed as:
[ ] an
Da )1(
211
−∞
∞
ΙΙ+=
−°−
ληηηη
This model is similar to the Cross model, but with additional fifth fitting
parameter a (Macosko, 1994). Another equivalent model to Cross and Yasuda is
the Carreau model. The Carreau model is characterised by the a value equals to 2
(Macosko, 1994). It is expressed as (Rao, 1999):
( )[ ]N
c
a 20
1 γλ
ηηηη
&+
−+= ∞
∞
The Ellis model is used when the limiting viscosity ∞η is set at zero (Macosko,
1994). As a function of stress invariant, it is expressed as:
1
1−
⎟⎠⎞
⎜⎝⎛ ΙΙ
+=a
o
kτ
ηη
A frequency sweep (dynamic oscillatory) analysis at 0.01-10 Hz at strain of
5% (in linear viscoelastic region) can be used to determine the dominance of
solid-like (storage modulus, G’) or liquid-like (loss modulus, G”) characteristics
of a EPS solution (Lambo-Fodje et al., 2007). The operation at linear region of
viscoelasticity is important in order to avoid interference with the microstructure.
This technique is also often employed to determine the frequency at which the
intersection between G’ and G” occurred, commonly called as cross-over
frequency. Furthermore, G’max, G’ at plateau of the curve can also be derived. The
reduction in this value indicates the collapse of polymer chain to form more
compact and aggregated structure. The cross-over frequency designates a
frequency when transition between solid- and liquid-like takes place. Furthermore,

19
the cross-over time can also be calculated using the equation (Lambo-Fodje et al.,
2007):
"'
2"' GGfGG
t π=
=
The temperature dependence of EPS can be calculated using Arrhenius
model (Rao, 1999):
RTE
Aa
a
e⋅= ∞ηη
where aη is viscosity at a particular shear rate (Pa), Α∞η frequency factor (Pa), Ea
activation energy (J/mol), R gas constant (J/mol. K), and T absolute temperature
(K).
Intrinsic viscosity [ ]η is the viscosity as infinite dilution where the effect of
the different particles are independent of each other (Lambo-Fodje et al., 2007).
This characteristic positively correlates to the chain length, branching or stiffness.
Intrinsic viscosity is derived by extrapolation to zero-concentration of a Kraemer
(Lambo-Fodje et al., 2007) or Huggins and Kramer (Gorret et al., 2003) plot of ln
(ηrel)/c, with c is the concentration of the polymer dispersion.
2.5 Important aspects of the yoghurt texture
There are different types of yoghurt according to the process, such as set-
type, stirred type, drinking, butter, and dried yoghurt (Tamime & Robinson 1985).
They also differ in the texture. Set-type and stirred-type yoghurt belong to
custard-like yoghurt, which has a semisolid character. However, set-type yoghurt
tends to have firmer texture, since it is made by fermentation of yoghurt
ingredients in individual cup or package. This type of processing allows very
limited physical disturbance to enable restoring the original texture. In contrast,
stirred-type yoghurt is made by fermentation in a large tank, the final product is
then filled into individual package. During the filling process, a severe force is
applied to the yoghurt and breaks the texture. The broken texture is redeveloped
20
when the yoghurt is kept in the package. The new texture is usually weaker than
the original texture before filling process.
There appears to be a long discussion on the definition of texture in food.
The first point of disagreement was whether it was a physical or sensory attribute.
As a consequence, texture comprises of both physical and sensory characteristics.
Although this common concept is accepted in general, it seems that there is no
exact definition to satisfy all parties coming from different backgrounds. This
leads to several different definitions proposed by experts or organizations.
Nevertheless, some basic characteristics of food texture have been underlined, that
texture is a set of physical structures of food, consisting either mechanical or
rheological properties which are connected to the feeling of touch in the mouth or
other parts of body, but do not relate to taste or odor. Texture is objectively
measured by dimensions derivative of mass, distance, and time (Bourne, 2002).
There is a various and broad range of vocabulary used by different nations to
describe texture of food (Meullenet, 2002). In principle, the sensory element of
texture is perceived by touching, although those are perceived by hearing, vision
and tasting also affect the evaluation (Kilcast, 2004). Furthermore, the response to
touching can be devided into two modes. Firstly, it is texture as a surface response
of skin (proprioception), and secondly, the deep response from muscle and tendon
(somesthesis). Such responses can also be observed indirectly by using utensils, as
well as organs in the mouth such as tounge, palate and teeth. Although sensory
evaluation is the best method to describe consumer perception of yoghurt texture,
it needs a carefully-designed procedure (Bourne, 2002). The result of sensory
evaluation is, therefore, more meaningful illustration of yoghurt texture than
physical assessment. However, sensory evaluation takes a long time to be carried
out, and it is costly. In order to best describe the texture of food, a procedure
called Texture Profiling Analysis (TPA) has been developed by a group led by Dr.
Szczesniak to give the basic method in conducting sensory evaluation (Bourne,
2002). The use of trained panels and intensity test gives better and more reliable
result than untrained panels or hedonic test. The procedure in TPA comprises
several main stages: selection and training of panels, establishment of standard
rating scales, development of TPA rating sheet, and developing comparative TPA

21
for every commodity. Physical and sensory properties are not only the main
elements in texture, they are also closely interdependence. The influence of
flavour and food texture such as viscosity and melting in the mouth is one of the
examples.
Sensory properties which are determined by the consumer preference on
yoghurt texture, are influenced by sexes, ages, and health concern (Kahkonen and
Tuorila, 1999). Young people prefer fat-containing yoghurt, in contrast to the
elderly. Smooth texture is important attribute for both young and elderly
consumers (Kalviainen et al., 2003). Therefore, thickness (Jaworska et al., 2005)
of yoghurt is important determinant of yoghurt texture, although it appears second
to flavour in sensory perception of yoghurt attributes (Kalviainen et al., 2003).
Among textural characteristic characteristics, ‘creamy texture’ is the most
preferred (Jaworska et al., 2005, Ward et al., 1999), although creaminess is not a
sole textural property since it also involves other sensory and physical properties
(Frost and Janhoj, 2007). In another research, creamy (smoothness) was described
as a flavour paramater (Jaworska et al., 2005), and was the most important flavour
component. More specifically, creaminess in set plain yoghurt is related to
textural and mouthfeel descriptors, while in stirred plain yoghurt it is associated
with relatively high viscosity, fat-related flavour, smooth mouthfeel and fatty after
mouthfeel. Smoothness is also correlated to creaminess (Cayot et al., 2008).
The particle size yoghurt ranging from 100 to 150 μm enhances the
sensation of product creaminess, but particles greater than 250 μm provide for a
very thick texture (Cayot et al., 2008). A positive correlation between creaminess
of yoghurt and thickness and smoothness has been previously established (Kokini,
1987) as:
Creaminess = thickness0.54 x smoothness0.84
The direct measurement of creaminess is very difficult due to the complex
nature of this attribute. In custard, creaminess is predicted by initial rheological
and mechanical breakdown properties (de Wijk et al., 2006). The rheological
parameters included G’ at 1 Pa, and critical stress or strain. Creaminess correlates
positively to initial G’ and low critical stress or strain. Very high values of storage

22
modulus reduce creaminess as the gel structure is hard to break down. Several
physical parameters are used to measure creaminess including consistency,
granulation, surface adhesion, surface angle measurement, viscosity and complex
modulus (Cayot et al., 2008). Low viscosity and low complex modulus are
attributes of a thick and creamy texture. In this case, creaminess is correlated to
viscosity measured at shear rate 50/s (Frost and Janhoj, 2007). The thick and
creamy sensation is originated from covering of the tongue and delayed the
cleaning of the mouth (Cayot et al., 2008). The susceptibility to become liquid
contributes to creamy perception.
In addition to creaminess, there are several other textural properties that
affect yoghurt acceptance, including smoothness, viscosity, meltdown rate,
astringent, fatty after mouthfeel and dry after mouthfeel (Frost and Janhoj, 2007).
Physically, desirable yoghurt texture is depicted by the shear thinning behaviour,
quick recovery after shearing and less syneresis or whey expulsion. Ropy EPS
tend to exhibit high cohesion of yoghurt, and difficult to break into smaller size of
particles, thus give thick characteristic. Texture of yoghurt is interrelated with
flavour. Yogurt with one type of flavour results in a thick, sticky and less smooth
texture, while yoghurt containing mixtures of flavours is perceived as less thick
with smoother and less sticky texture (Saint-Eve et al., 2004). Furthermore,
yoghurt made by additions of fatty flavours such as coconut and butter is
perceived as thicker, while green apple or almond flavour provides for a sensation
of a smoother texture.
Physically, desirable yoghurt texture is depicted by the shear thinning
behaviour, quick recovery after shearing and less syneresis or whey expulsion.
Syneresis results from a low water holding capacity of the acid formed gel,
extensive large pores of gel, and can be induced by physical disturbance such as
stirring. Several factors during yoghurt processing which lead to syneresis are
high incubation temperature, low total solid content, types of EPS, and high
casein to whey protein ratio. High heating temperature at 80-90 °C results in
yoghurt with large cracks and rough texture, visible after gel development (Lucey
et al., 1998). The structural breakdown and subsequent syneresis is positively
correlated to brittleness and less flexible protein-protein bonds, rather than
23
porosity. Unlike textural properties and syneresis, porosity may not (Lucey et al.,
1998) or be (Lee and Lucey, 2004b) affected by the heat treatment, apparently
depending on the nature of the milk proteins. Higher temperatures increase
significantly porosity and consequently also syneresis (Lee and Lucey, 2004b).
The fracture of gel may also be caused by local pressure built up during
continuing casein aggregation, which eventually exceeds the pressure resistance
of the gel. Thick strand of yoghurt network can give good resistance to the break-
down (Lucey et al., 1998). This condition can also be achieved by low incubation
temperature. Moreover, high storage modulus and small tan δ value are indication
of a high counter pressure towards the gel shrinkage, and results in less syneresis
(Lee and Lucey, 2004b). Syneresis can also be reduced by increasing inoculation
rate, which consequently leads into improvement of elastic properties of the gel
(Lee and Lucey, 2004b). A lower yield stress derived from lower levels of
inoculation was correlated to larger but weak pores within yoghurt network.
During cold storage, syneresis may decline (Guzel-Seydim et al., 2005). Low
temperatures during storage weaken hydrophobic bonds among casein particles in
yoghurt, leading to less compact structure, more inter-particle bonds and better
solid-like behavior and reduced syneresis (Van Vliet et al., 1989).
2.6 The role of milk proteins in yoghurt texture
Yoghurt gel is the result of aggregation of milk proteins following the
collapse of casein micelles. There are several models proposed for the shape and
functionality of the casein micelle. However, it appears that none of them
provides thorough and complete explanation for the behaviour of the casein
micelle in different environments. The model proposed by Fox, describes micelle
as a cluster of submicelles in the form of κ-casein–rich fraction on the exterior
and non-κ-casein fractions in the interior of micelle (Horne, 2006). The micelles
are connected to the others by the colloidal calcium phosphate (CCP). Another
model, based on the electron microscopy image, suggested a smooth or raspberry
surface of the casein micelle (McMahon and McManus, 1998). Later, this model

24
was corrected by suggesting a non-smooth surface with tubular attachments on the
micelle surface protruding from the centre of the micelle and creating gaps in
between two adjacent tubular bodies (Dalgleish et al., 2004). The Holt model
suggests that the micelle consists of nanoclusters of calcium phosphate which are
assembled into a loop-like arrangement (Horne, 2006). This model seems to lack
in a micelle growth-terminating mechanism. Nevertheless, all these models share
a similar principle, in which the micelle consists of all types of casein: α-, β-, and
κ-casein, and they self-associated in a special dynamic arrangement (Horne,
1998). The caseins are connected by inorganic nanoclusters of colloidal casein
phosphate (CCP) (Horne, 2002) and thus responsible for the integrity of casein
micelle. However, it was found that the collapse of CCP did not result in
dissolution of micelle, thus suggesting other mechanisms are also involved in
stabilizing the micellar integrity (Horne, 2006). At natural pH of milk, the α- or β-
casein are linked by hydrophobic bonds to form a larger body, while κ-casein
form a densely charged appendages on the surface of micelle (Horne, 1998).
Individual aggregate of α-casein is a worm-like structure in a linear ‘parallel/anti-
parallel’ order, with the anchor points as the hydrophobic components at every
end of single particle. The aggregates of β-casein, on the other hand, are a
‘hedgehog’-like shape, in which the hydrophobic components join to form an
ellipsoidal central core and hairy structure sticking out at every end. κ-Casein
structure is a mirror image of β-casein. However, sinceκ-casein lacks of a cluster
of phosphoserine residue in its chain, it is unable to continue growing. Therefore,
it terminates the growth of micelle. On the other hand, α- and β-casein play a part
in the development and enlargement of casein micelle structure. The association
of every type of casein has their equilibrium between monomer and micelle.
While the equilibrium of α- or β-casein is affected by temperature, that of κ-
casein was independent of temperature. When pH is lowered such as during
yoghurt fermentation, negative charges are reduced, causing electrostatic
repulsions to be shielded which consequently results in the increase in polymer
size of both α- and β-casein (Horne, 1998). On the contrary, when pH is higher
than natural pH of milk, the repulsive forces prevail over electrostatic attractions
and polymer size of α- and β-casein is reduced. The strength of the interaction in

25
a micelle is a resultant of hydrophobic and repulsive forces. As the hydrophobic
force supports the growth of micelle, the repulsive force limits it. κ-casein
contributes not only to control of the micelle growth but also functions as a
sterically stabilising brush, to prevent micelles from aggregating (Horne, 2002).
Thus, the size of micelle is governed by the balance between attractive and
repulsive forces. The collapse of κ-casein layer on the micelle surface during
renneting triggers the casein aggregation.
Pre-heating of milk alters the balance of forces within milk environment
(Horne, 1998). Increasing the temperature up to 35-40 °C enhances the strength of
hydrophobic bond, and calcium ion is more strongly attached to the micelle.
However, when temperature is above 40 °C, CCP precipitates, and the calcium
components are detached from the casein, leading to the loosening of bonds and
weakening the gel structure. Heating at 90 °C induces the complex formation of
κ-casein and β-lactoglobulin via disulfide bridges (Horne, 1998). As a result, the
gel strength is improved. Pre-heating of milk is also related to the denaturation of
whey protein. Denatured whey protein can increase casein aggregate size as a
result of enhanced covalent (disulfide-, and sulfhydrile bond) as well as cross-
linking of intermolecular disulfide binding. Complete denaturation of milk whey
protein can be attained by pre-heating milk at 95 °C for 5 mins (Sodini et al.,
2004).
Pre-heated milk has a very important influence on yoghurt texture,
especially as expressed by storage modulus (Xu et al., 2008). The difference of 1
°C in pre-heating temperature can have substantial implications. The association
of heat-denatured whey protein into micelles elevates the G’ to form a ‘shoulder’
at the beginning of the curve of G’ against time. After that, a plateau is reached to
indicate the solubilization of colloidal calcium phosphate. This is followed by a
further G’ increase reflecting extensive coagulation of casein aggregates. A more
detailed information is provided on this phenomenon (Anema, 2008). Denatured
‘non-sedimentable’ whey proteins are able to bind to κ-casein. Thus, at neutral pH
when colloidal calcium phosphate (CCP) is still intact, the whey proteins are
mostly in the solution. As pH declines through the fermentation, the CCP is
26
solubilized and free colloidal calcium can bind the ‘soluble’ fraction of denatured
whey proteins. This association forms a strand-like body which later functions as
bridging appendages among casein particles via disulfide bonding. As a result, the
casein particles become larger in size and subsequently increase the storage
modulus. The extent of this association is influenced by pre-heating pH. While
heating milk at its natural or higher pH leads to increase in the gel storage
modulus, heating it at lower than its natural pH gives the contrasting effect.
Heating milk at acidic environment results in less denatured whey proteins,
including the portion of the soluble denatured component. The available denatured
whey proteins tend to bind casein micelle rather than κ-casein. Consequently,
there was less number of connecting body for casein particles, resulted in smaller
aggregate size and less firm texture. Milk protein concentration adversely but only
insignificantly affects denaturation of whey proteins (Anema, 2008). However,
increasing milk protein concentration increases breaking stress and breaking
strain, which reflects the number of covalent bonds.
As caseins are the main component in milk gel, the higher their
concentration, the firmer (expressed as storage modulus G’) the final texture of
yoghurt (Anema, 2008). Heating of yoghurt base mixture (Lucey et al., 2001) as
well as high fermentation temperature are known to increase viscosity, firmness
and reduce syneresis (Shaker et al., 2000). The increase in viscosity during
acidification exhibits three steps (Shaker et al., 2000). First, at the beginning of
the gelation, there is a slight increase in viscosity, but the size of casein particles is
still unaltered. Secondly, co-aggregation of casein particles into larger aggregates
starts indicated by a sharp increase in viscosity to eventually reach a plateau. The
size and shape of the aggregates vary with no apparent trend. Finally, by the
decrease in pH at the later stage of acidification, the aggregate size is reduced to
produce small particles which are connected into the gel network.
Other technique to improve yoghurt texture is application of high pressure
homogenisation. This method is designated to avoid the use of additive(s) which
can give off-flavours. High pressure (more than 100 MPa) applied during
homogenisation breaks the casein particles (Penna et al., 2007) or fat globules
(Serra et al., 2007), further resulting in altered physical and rheological properties

27
of yoghurt. The higher the pressure applied, the firmer the yoghurt gel resulted.
High pressure induces denaturation of whey proteins to a certain extent (Serra et
al., 2007). At lower pH when CCP is solubilized, the smaller size of casein
particles is connected by a bridging material consisting of κ-casein and denatured
whey proteins associated by disulfide bonds (Penna et al., 2007). Large particles
of caseins are subsequently produced, as their aggregation is hindered by the
bridging body. The result is a firmer texture with less serum expulsion. In this
case, firmer gel as indicated by higher storage modulus is negatively correlated
with syneresis (Serra et al., 2007). In the presence of fat, high pressure treatment
increases the active surface of fat globules as the globular size is reduced. This
would in turn facilitate their association in the development of three dimensional
gel network and improve the aggregation rate. Clusters of possibly cross-linked
proteins and lipids may be formed during this treatment leading to a higher
storage modulus.
2.7 The role of EPS in yoghurt texture
The exopolysaccharides (EPS) content in yoghurt affects the yoghurt
texture. In general, they reduce firmness of yoghurt as measured by storage
modulus (G’) (Folkenberg et al., 2006a). Ropy type of EPS gives rise in ropiness
of yoghurt, as well as mouth thickness and creaminess. A mechanism for fat-
replacer capacity of EPS has been suggested, involving the ability of EPS to cover
the tongue and delay the cleaning of mouth by saliva (Cayot et al., 2008)
resembling the action of fat in the mouth cavity during chewing. The thickness
character is raised from a high cohesion which prevents yoghurt particles to
segregate into smaller particles, resulting in a more elastic material. Mouth
thickness is correlated with viscosity at shear rate of 241/s (Folkenberg et al.,
2006a). Although ropiness of EPS is related to creaminess, the EPS produced by
some non-ropy strains are also able to exhibit creaminess in yoghurt (Folkenberg
et al., 2006a). The effect of the EPS on the textural properties also varies with
different strains. The EPS from L. delbrueckii subsp. bulgaricus, for example,

28
influenced firmness, while that of S. thermophilus gave creaminess, mouth
thickness and ropiness of the final product. A yoghurt culture called strain YC180
gave creamy characteristics similar to a fat-containing yoghurt, including creamy
flavour, mouthfeel, sweet taste with reduced astringency, bitter and sour taste
(Folkenberg and Martens, 2003). However, there are apparently some
characteristics of EPS other than ropiness which would govern their effects on
yoghurt texture, such as their interactions with other yoghurt components,
molecular weight, degree of branching, and chain flexibility (Folkenberg et al.,
2006a, Folkenberg et al., 2006b).
The EPS hinder the structural rebuilding of yoghurt after rupturing by shear,
a phenomenon often expressed as thixotropy (Rao, 1999) and is also perceived as
‘a loss of consistency’ after shear (Penna et al., 2001). During shearing in a
rheometer or chewing in the mouth, the EPS which are originally located in the
void among casein particles are driven out, which leads into aggregation with EPS
from other interspace cavities. The formation of large EPS aggregates eventually
leads to phase separation. Due to incompatibility of EPS and caseins, re-
association of casein particles is obstructed by EPS (Folkenberg et al., 2006a),
especially EPS which form attractive bonds with casein micelle (Girard and
Schaffer-Lequart, 2007). Therefore, factors inhibiting the attractive interactions
between EPS and casein would potentially support better recovery. Some of these
EPS characteristics include low molecular weight and weak charge (Girard and
Schaffer-Lequart, , 2007). On the other hand, in the absence of EPS, the casein
particles are easily reconnected regaining their original state (Folkenberg et al.,
2006a) or in the case of brittle yoghurt network, the structure may be
irrecoverably broken (Girard and Schaffer-Lequart, 2007).
The EPS influence gelation and microstructure of yoghurt. The presence of
EPS in yoghurt base mixture induced depletion, and as a consequence gelation as
observed by sharp increase in G’ started earlier (Girard and Schaffer-Lequart,
2007). The pressure created during depletion interaction causes casein particles to
assemble by hydrophobic forces, giving raise to greater elastic properties. The
earlier start of gelation in acid milk is especially pronounced when EPS involved
in the interactions have stiff chains in their backbone at neutral pH (Tuinier and de

29
Kruif, 1999). α (1→4) linkage is stiffer than β (1→2) or β (1→3) linkages.
Higher concentration of EPS stimulates more extensive depletion (Girard and
Schaffer-Lequart, 2007). However, this effect also depends on the molecular of
the EPS with low molecular weight producing a smaller depletion effect due to
their poor exclusion from the gap between two casein particles (Tuinier and de
Kruif, 1999).
2.8 Rheological determination of yoghurt texture
Although creaminess is an important characteristic of yoghurt, it is difficult
to make a simple correlation with physical and rheological measurements.
Therefore, most of physical and rheological measurements are focused on the gel
strength towards mechanical disturbance and syneresis. Rheological and textural
measurements are carried out using small and large deformation techniques. Large
deformation is carried out by applying a constant shear rate 0.00185/s until
yielding of the gel was reached (Lucey et al., 1997a). Large deformation method
can be used to collect data on the viscosity which can further be analysed using
rheological model such as the Cox-Merz model. Although this model can be fitted
to other several semi solid foods, it poorly fitted the properties of a culture-
fermented yoghurt (Yu and Gunasekaran, 2001). Small deformation method
consists of oscillatory and rotatory measurements, commonly called as SAOS
(small amplitude oscillatory shear), by applying low frequency (0.01-100 Hz) at
stress <1 Pa (Yu and Gunasekaran, 2001) and low to medium shear rate (0.05-
100/s) (Yu and Gunasekaran, 2001), respectively. Using SAOS, the structure
remains relatively intact since the deformation is minimal (Yu and Gunasekaran,
2001). The large deformation technique was applied to GDL-acidified yoghurt to
reveal several crucial parameters of the gel strength where irreversible structural
disruption started to occur (Lucey et al., 1997a). These parameters were γyield and
σyield, the shear strain at yielding and apparent yield stress, respectively. Hence,
lower values of both parameters indicated more brittle gel. In the reported work,

30
the values of γyield showed meaningful trend, but those of σyield did not (Lucey et
al., 1997a).
Several rheological parameters commonly derived from SAOS measurement
are storage modulus (G’), loss modulus (G”), loss tangent (tan δ), fracture stress
(σfracture) and fracture strain (γfracture) (Lucey, 2001). Storage modulus indicates a
solid-like behavior of a material and relates to the strength and number of bonds
to resist to the oscillatory deformation (Lucey, 2001). High values of G’ thus
reflect a large number of strong bonds within the structure. During storage or
ageing of the yoghurt gel, the increase in G’ may indicate the enhanced fusion of
particles in inter- and intramolecular rearrangement (Lucey et al., 1997d). The
plot of G’ against frequency or strain can be used to reveal the structural changes
as an increasing stress is applied (Hess et al., 1997). In yogurt, its shear thinning
behaviour is shown by declining storage modulus as the strain or frequency is
increased. The change in the rate of decline is indicative of the change in the
amount of energy required to break down the casein network into smaller
particles. When the EPS are present within the network, they reduce the rate of
structural disruption, which is demonstrated as an inflection (Hess et al., 1997).
Loss modulus, G”, is an indicator of a liquid-like behaviour. Furthermore, the
ratio between these two moduli, G”/G’ is also known as the phase shift or tan δ,
and reflects the degree of the bond relaxation. High value of tan δ shows tendency
towards greater relaxation of bonds (Lucey and Singh, 1997, Lucey et al., 2001).
A maximum in tan δ is observed during solubilization of CCP and may be related
to loosening in structure (Lucey et al., 2001). Fracture stress, σfracture, is a shear
stress required to break the gel. It indicates the ability of the network to resist to a
break-down, as well as shows the shear rate where the structural rearrangement
can take place. The fracture strain, γfracture, indicates the strain value at which the
gel starts to break, and σfracture indicated susceptibility of gel to break upon the
application of strain. The higher the values of both parameters, the more intensive
association among particles within the network (Lucey et al., 1997d).
A shear sweep method or rotational rheological test is commonly applied to
obtain parameters such as apparent viscosity (ηapp), consistency index (K), flow

31
behaviour index (n), and yield (Rao, 1999). Apparent viscosity is viscosity as a
function of the shear rate (Rao, 1999). During shearing of yoghurt, apparent
viscosity is decreasing, indicative of shear thinning behavior. The inflection
observed in the curve shows a change in the shear resistance, thus could be a sign
of different structural arrangements being exposed to shearing. The EPS residing
in the network cause an increase in the shear resistance after the casein network is
first disrupted (Hess et al., 1997). Rotational test can also be used to describe flow
behaviour of yoghurt. In most cases, the viscosity trend against shear rate follows
the modified Power Law model, commonly known as Ostwald – de Waele model
(Rao, 1999):
ηapp = K •γ (n-1)
This model depicts a shear thinning or shear thickening behaviour, and can
cover a wide range of shear rates. However, it cannot demonstrate a Newtonian
flow commonly encountered at very low shear rate. Hence, two power law indices
are derived, those are K and n. K is consistency index and denotes viscosity at
shear rate 1/s (Rao, 1999). Whilst, exponent n is flow behaviour index and
indicates the deviation of a material from the Newtonian flow (n = 1). Shear
thinning is indicated by n < 1, while shear thickening is described by n > 1.
Similarly, the two indices can also derived from the Power Law model for
shear stress plotted against shear rate (Rao, 1999):
τ = K •γ n
Where τ is shear stress (Pa s), •γ is shear rate (1/s), K is consistency index
(Pa sn), and n is the flow behaviour index (dimensionless). The values of both
indices in the EPS-containing yoghurt are influenced by the shear rate (Hess et al.,
1997). At low shear rates, very low values are observed indicating intensive shear
thinning. At higher shear rate, the values of both indices are greater in EPS-
containing yoghurt compared to those of non-EPS yoghurt. Therefore, EPS in
yoghurt seemingly supported the shear resistance.
As the Power Law model did not always fit well to the data obtained by the
dynamic measurement (Hassan et al., 2003b), several other rheological models

32
have been introduced to describe the flow behaviour of the yoghurt gel. By
assuming the presence of yield in yoghurt, the Herschel-Bulkley model was
employed and gave a good fit, while other yield-consisting models such as Casson
and QRS model did not (Hassan et al., 2003b). However, although Herschel-
Bulkley model effectively describe the yield of yoghurt, the overall data was
poorly fitted into the model (Yu and Gunasekaran, 2001). The Herschel-Bulkley
model is expressed as:
( )n•=− γκσσ 0
Where σ is shear stress (Pa s), and σ0 is yield stress (Pa s), •γ is shear rate
(1/s), KH is consistency index (Pa sn), and nH is flow behaviour index. It can be
seen that the difference of this model from the Power Law model is in the
incorporation of the yield expression. The yield measure in yoghurt can be absent,
low or high, depending on the preparation method such as type of culture (Hassan
et al., 2003b) or heat treatment (Lucey et al., 1997a). In the EPS-containing
yoghurt, the yield is lower, and may be a sign of poor interaction between the EPS
and protein components (Hassan et al., 2003b).
The Casson model is expressed as:
5.00
5.0 •+= γσ cC KK
where σ is shear stress (Pa s), K0c and Kc are intercept and slope, respectively; and •γ is shear rate (1/s). The model exhibits a yield and non-Newtonian flow at shear
stress above yield. The Casson model is used to analyse food dispersions, and
often applied for chocolate products. The limiting viscosity, a viscosity at high
shear rates, can be calculated using plastic viscosity, and follows the equation:
2)( cCa K==∞ ηη
In other work, the QRS was better than other models in describing flow
behaviour of stirred yoghurt varying in dry matter content (Skriver et al., 1993).
This discrepancy may originate from the variation of preparation or processing
method, as well as rheological and analytical methods.

33
The area between upward and down ward curves of shear stress versus shear
rate is called thixotropy area. The value denotes structural recovery after shearing
(Rao, 1999). Larger values correlate with slow structural recovery after disruption
due to shearing. It may also indicate more elastic gel. On the other hand, low
value denotes quick recovery after shear-induced deformation. Thixotropy area is
also correlated to ropiness of yoghurt, although only in a cautious and limited
application (Folkenberg et al., 2006a), by the following equation:
bRopiness a area Thixotropy ⋅=
The constants, a and b, have values of 36.6 and 0.27, respectively.
In most cases, the rheological behaviour of set-type yoghurt was carried out
by directly placing the sample on the measuring device with a care to maintain the
integrity of the acid created gel. However, the homogeneity of the sample is one
of the important factors to be considered especially in the case of non-
homogenous growth of an EPS producing culture. Therefore, it appears relevant to
have the sample pre-sheared and thoroughly mixed before loading it into the
measuring device. Pre-shearing at high shear-rate was commonly applied for
material possessing thixotropy, in order to eliminate any residual stress, which
may cause less reproducible results (Da Cruz et al., 2002). Similarly, the stirred
yoghurt was first stirred several times before the measurements were made
(Folkenberg et al., 2005).
The onset of gelation is often studied using rheological methods. There are
several definitions on the determination of the start of gelation, apparently
depending on the nature of materials being tested. It has been described as a sharp
increase in G’ (Haque et al., 2001), the appearance of maximum tan δ before
sudden decline (Lee and Lucey, 2004a), increase of storage modulus greater than
1 Pa (Lee and Lucey, 2004a), or the cross-over between G’ and G” (Tung and
Dynes, 1982), tan δ independent of frequency (Winter and Chambon, 1986), the
appearance of pronounced complex modulus G* above the instrumental noise
(Horne, 1998) or when G’ and G” shared the Power Law exponent (Winter,
1987). A very low strain (<0.01%) (Hassan et al., 2003b) or 0.5% (Jaros et al.,
2002b) and low frequency (0.1 Hz) (Hassan et al., 2003b) is employed in an
34
oscillatory measurement applied to measure in situ gelation. The low oscillation is
maintained to avoid destruction of the weak structure at the beginning of
development. The development of dynamic moduli over time is then studied.
Typically, the storage modulus or complex modulus (G*) exhibits a slow increase
at the beginning of fermentation. An abrupt increase in the moduli starts to take
place when pH drops to around 5.5 depending on the type of mixture (Lucey et
al., 2001) or cultures (Hassan et al., 2002), and continus until pH 4.5 (Hassan et
al., 2002). The gelation starts by solubilization of the CCP, which is indicated by a
sudden increase in tan δ to reflect loosening of original casein-casein structure in
milk (Lucey et al., 1999). The structure weakening possibly originates from a
reduction in electrostatic repulsions among micelles (Lucey, 2002). Consequently,
it is followed by association of casein particles to form a firm structure, and is
reflected in the increase of G’ (Lucey, 2002). The casein aggregation may be
driven by several forces such as van der Waals, hydrophobic and κ-casein
bridging. Some treatments can affect the start of gelation so that the gelation pH is
higher, such as pre-heating of milk (Lucey et al., 1997a) or the presence of EPS
(Hassan et al., 2002), as well as higher temperature during acidification (Lucey et
al., 1997c). The mechanism of gelation itself, as observed by the increase in G’ in
time, is not affected by protein concentration of yoghurt mixtures (Anema, 2008).
2.9 Enrichment of yoghurt mix
2.9.1 Calcium supplementation
One of the important reasons for calcium supplementation is that calcium
daily intake does not meet the recommended level (Cook and Friday, 2003).
Calcium is the major mineral (~60 %) within the bone, thus contributes to bone
density, bone size, mass and architecture as well as prevention of bone fracture
and osteoporosis (Kessenich, 2007). Milk and dairy products including yoghurt
and cheese are considered to be the main source for dietary calcium. The

35
frequency of milk consumption is positively associated with bone density
(Kalkwarf, 2007). The main target group for calcium fortification are children and
the elderly. Calcium requirement in the diet during childhood and early adulthood
is very high as a consequence of the rapid growth with peak bone mass formation
in this period. A failure to meet this requirement can lead to childhood fracture
epidemy (Kalkwarf, 2007, Matkovic et al., 2007). Milk consumption and
consequently the calcium intake during childhood is important, since it is the
consumption during this period that determines the total bone mass and resistance
against adolescent rib and osteoporotic fractures (Kalkwarf, 2007). On the other
hand, calcium intake during adulthood exhibits a poor correlation with the
prevention of osteoporotic fractures. The recommended milk consumption for
children age 2-8 years is 2 cups (800 mg) of milk or milk equivalent per day,
while for 9 year and older is 3 cups (1300 mg) per day (Kalkwarf, 2007). Calcium
supplementation during pre-puberty is more effective than post-puberty to
maintain bone mass and density after cessation of supplementation. The elderly
are a group with high risk of osteoporosis. There are ~44 million people in the US
age of 50 years suffering from this disease (Kerstetter et al., 2007). Therefore,
calcium intake for this group is given a great attention, and calcium
supplementation is important part of the osteoporosis therapy (Kessenich, 2007).
The recommended calcium intake for 50-70 year old women is 1200 to 1500 mg
per day with no more than 500 mg Ca consumed at one time. Moreover, high
calcium intake also reduces the systolic blood pressure (Sugiyama et al., 2007).
Milk is considered to be a good vehicle for calcium fortification, for its
phosphopeptide content enabling better calcium absorption likely due to reduced
rate of gastric emptying (Kitts and Kwong, 2004). Even more, calcium
bioavailability in yoghurt is higher than in milk, likely due to ionisation of
calcium in acidic pH of yoghurt and subsequently improved intestinal absorption
(Unal et al., 2005). Another reason to make yoghurt an important candidate for
calcium and other minerals fortification is its rocketing popularity, and good
acceptance to women, children, teenagers and elderly, especially in the US
(Achanta et al., 2007). The consumption per capita in 2003 was 8.2 lbs (Dairy-
Facts, 2004). Calcium fortification in fruit yoghurt up to 100 mg Ca per 100 mL

36
yoghurt increases the yoghurt firmness and has no adverse effect on sensory
properties including flavour, colour, body, texture, appearance and overall
acceptability (Achanta et al., 2007). Calcium bioavailability is also associated
with a high protein intake (Kerstetter et al., 2007). Large population data set
showed that women with high protein intake had higher bone mass density.
Proteins themselves contribute to 50% of the bone volume. High protein intake
(2.1 g/kg) increases intestinal calcium absorption, bone mass density, and reduces
kinetic measures of the bone turn-over. Bone calcium loss is lower in people with
high protein-containing diet than those with low protein diet. There are several
proposed mechanisms on the role of protein in the improvement of calcium
bioavailability. First, amino acids in proteins may stimulate secretion of gastric
juice via the allosteric activation of the gastric parietal cell calcium-sensing
receptor. Another possible mechanism is protein activated insulin-like growth
factor 1 (IGF-1) which controls the bone growth (Bonjour et al., 1997). A synergy
between calcium and protein has been observed, which is involved in the bone
and muscle mass protection. Proteins in sufficient amount are required to attain
and maintain muscle mass and strength, and this effect only appeares under high
calcium intake (Heaney, 2007). In this regard, calcium fortification in yoghurt
may need to be combined with protein fortification such as with whey protein.
Despite the well-known potential benefit of calcium supplementation milk
products, seemingly there is only limited number of studies in this area focusing
on the effects of calcium on the yoghurt texture. Commercial calcium preparation
for food supplementation includes calcium carbonate, calcium chloride, calcium
phosphate, tribasic calcium phosphate, calcium citrate malate, calcium lactate,
calcium gluconate, calcium lactate gluconate and natural milk calcium (Goldscher
and Edelstein, 1996). When supplemented in the form of Ca-lactate to fruit
yoghurt, the water holding capacity was improved, but the thinning behaviour was
reduced, while flow behaviour was higher compared to the control (Singh and
Muthukumarappan, 2008). The yoghurt gel strengthening effect of calcium may
be due to dissolved calcium facilitating cross-linking between protein molecules.
The increase in the degree of cross-linking was not accompanied by changes in

37
bonding, as shown by insignificant increase in apparent viscosity nor loss tangent
(Singh and Muthukumarappan, 2008).
2.9.2 Whey protein supplementation
Whey proteins, a by-product of cheese manufacturing, have been
extensively used to improve functional, nutritional, therapeutic, and physiological
properties of various food products. It consists of mostly (~50%) β-lactoglobulin,
and to a lesser extent (~20%), α-lactalbumin (Chatterton et al., 2006). β-
Lactoglobulin is a soluble globular protein with a low molecular weight (~18
kDa). At pH 3-7, it forms a dimer with molecular weight of 36 kDa. α-
Lactalbumin is also a globular protein soluble in water, and exhibits a pronounced
affinity to metals, especially calcium. The released of some portion of calcium
from α-lactalbumin may lead to denaturation, commonly called as molten globule
state (Chatterton et al., 2006). Calcium in α-lactalbumin exerts its heat stability
with melting temperature around 68 °C, while on the depletion of calcium it is
reduced to 43 °C.
Whey proteins are related to the biosynthesis of skeletal muscle, especially
during excessive physical activity (Ha and Zemel, 2003) and in elderly (Paddon-
Jones et al., 2006). The protein anabolism function of whey proteins may relate to
their essential amino acids, especially leucine (Ha and Zemel, 2003). Leucine is a
substrate for muscle protein biosynthesis and may take part in signalling among
molecules during initiation of the anabolism. The muscle building effect of whey
proteins also correlates to a rapid absorption of their amino acids in the gut
system. There is an apparent synergy between whey proteins and calcium in the
muscle development, with calcium supplementation increasing the optimisation of
the skeletal muscle composition. Furthermore, calcium inhibits synthesis of
adipose tissue through suppression of parathyroid hormone responsible for fat
storage. Whey protein consumption reduces food intake during
hypercholesterolemic diet (Jacobucci et al., 2001, Minehira et al., 2000). This
effect may originate from the reduction in appetite due to accumulation of amino

38
acid in the blood or rapid enhancement of protein anabolism and catabolism
(Jacobucci et al., 2001). Therefore, the combination of whey proteins and calcium
appears to be supportive of the good lean muscle development. In the elderly,
whey proteins prevent a progressive loss of muscle mass and functional capacity
(Paddon-Jones et al., 2006).
Whey protein supplementation results in a strong hypocholesterolemic
effect, and thus may reduce the risk of cardiovascular diseases (Jacobucci et al.,
2001, Minehira et al., 2000). The rise in blood and liver high-density lipoprotein
is inhibited during a high cholesterol diet. However, the oxidised cholesterol in
the blood may impair immune response (Minehira et al., 2000). Whey proteins
appear to support the gastrointestinal health by providing lactose for the growth of
probiotics (Ha and Zemel, 2003) and β-lactoglobulin prevents the adhesion of
pathogens in the gut (Chatterton et al., 2006). Antimicrobial activities of whey
proteins have been noted against several pathogens (Gill et al., 2006, Madureira
et al., 2007, Yalcin, 2006) including cariogenic species (Warner et al., 2001).
Upon hydrolysis, these proteins release a wide range of peptides with manifested
bioactivities including angiotension-converting enzyme inhibitory activity
(Chatterton et al., 2006). Therefore, the inclusion of these highly valuable dairy
ingredients into various food products would certainly improve healthy perception
of foods. Moreover, it also gave environmental and economical benefits.
The important functional characteristics of whey proteins are their gelling
properties which affect physical quality of various food systems including
yoghurt. Heat-induced gelation of whey proteins at least involves two steps. These
are unfolding of protein three dimensional structure to expose reactive functional
thiol groups, and rearrangement of the unfolding state to form aggregates (van Mil
and Roefs, 1993). The unfolding renders whey proteins to become amphiphilic
with higher water holding capacity (Morr, 1979). Several factors induce the
unfolding including temperature and heating rate, pH, lactose content, β-
lactoglobulin content and the presence of other proteins in whey. Following
unfolding, the aggregation to form fibril-like structure occurs, with the
aggregation rate influenced by the concentration of whey proteins, total solids, or
β-lactoglobulin. At high concentration of added whey proteins, denaturation as

39
indicated by significant increase in elastic modulus (G’) starts earlier, and may
show higher maximum values of G’ (Kavanagh et al., 2000). At neutral pH,
gelation of whey proteins is correlated to denaturation of β-lactoglobulin, while
denaturation of α-lactalbumin only gives increase in viscosity without apparent
gelation (Boye et al., 1995). When pH of the system is far from pI, there is a
possible additional step after aggregation, called ‘random cross-linking’ of
aggregated fibrils (Clark et al., 2001). Thus, at the gelation point, the aggregation
is not considered complet and would continue to eventually reach a plateau. This
plateau could be indicated by G’inf, a ‘limiting modulus’. For charged proteins, it
may take long time to reach this plateau. The unfolding and aggregation may be
irreversible or reversible, depending on the temperature of denaturation. Thermal
denaturation at neutral pH and 60 °C (Pelegrine and Gasparetto, 2005) resulted in
reversible altered tertiary conformation of whey proteins (Iametti et al., 1996).
Irreversible denaturation is induced by heating at around 75-80 °C (Clark et al.,
2001), and is more extensive at higher temperatures and low heating rates (De Wit
and Klarenbeek, 1984). Higher temperatures enable more extensive protein-
protein interactions via hydrophobic non-covalent bonds (Lorenzen and Schrader,
2006). Similarly, the strongest WPI gel is structured at pH 5-6 when large
aggregates are formed by non-covalent bonds in addition to disulfide bridges
(Lorenzen and Schrader, 2006). In the presence of caseins, the aggregation of
whey proteins is affected by casein:whey protein ratio (Beaulieu et al., 1999,
Puvanenthiran et al., 2002), where high whey protein proportion increases the
denaturation rate (Law and Leaver, 1999) and causes formation of large particles
consisting of both micelles covered with individual whey proteins as well as whey
protein aggregates (Beaulieu et al., 1999).
The supplementation of whey proteins to yoghurt has been studied
extensively and the results showed various effects on the final yoghurt texture,
apparently influenced by the preparation methods. Native whey protein
supplementation reduced yoghurt gel strength parameters such as storage
modulus, and yield stress (Guggisberg et al., 2007), viscosity and firmness
(Guggisberg et al., 2007, Oliveira et al., 2001), and created porous structure
leading to higher syneresis (Gonzalez-Martinez et al., 2002). However, when
40
native whey proteins were added at high concentration after fermentation of
yoghurt, storage modulus was increased (Patocka et al., 2004). When yoghurt
milk base supplemented with whey proteins was heated before acidification, the
gel strength was significantly increased by heating time, apparently due to larger
micelle size which may have resulted from more extensive cross-linking of whey
proteins and caseins (Remeuf et al., 2003). Heating milk mixture containing added
whey proteins positively affected gel strength, likely due to denaturation of whey
proteins. The positive effect of denatured whey proteins on the gel strength of
glucono-δ-lactone (Vasbinder et al., 2003) as well as microbial (Puvanenthiran et
al., 2002) acidified yoghurt was emphasized. Interestingly, when whey proteins
heated at high temperature were added to milk base after homogenization, the gel
strength was impaired, which was opposite to unheated counterpart (Sodini et al.,
2006). This may reflect the complex nature of the yoghurt structural development,
which possibly involves several factors and their interactions.
2.9.3 Addition of sucrose to yoghurt
Sucrose is commonly added during yoghurt making to improve flavour.
Sweetness is one of major sensory determinants that positively affects
acceptability of yoghurt (Jaworska et al., 2005). Clearly, yoghurt with optimum
level of sweetness was preferred than those oversweetened or undersweetened
(Vickers et al., 2001). However, oversweetened yoghurt was accepted better than
the undersweetened yoghurt. The preferred degree of sweetness in yoghurt is
affected by eating situation. In multi-food lunch, for example, over-sweetened
yoghurt is disliked. Sucrose content in yoghurt affects palatability (Perez et al.,
1994). The favoured sucrose content in yoghurt is between 5 to 10 %, and its
consumption increases food intake. Non-sucrose sweeteners also increase appetite
(Bellisle and Perez, 1994), with varying effect among sweeteners (Rogers and
Blundell, 1989). The addition of sucrose is also very likely to affect the final
texture of yoghurt. There is a lack of information on the effects of sucrose
addition on the yoghurt texture. Few conducted studies showed that sucrose

41
reduces gel elasticity of the GDL-acidified sodium caseinate (Braga and Cunha,
2004). Sucrose also potentially weakened the polysaccharide junction zones and
altered flow behaviour of liquid food systems. It may increase or decrease
viscosity depending on hydration of hydrocolloid molecules, rheological
properties of the hydrocolloid and also the influence of other components in the
system (Yanes et al., 2002).
2.10 Milk composition and processing factors
Milk composition has an important influence on yoghurt texture, as shown
by seasonal variation in yoghurt gel properties (Tamime and Robinson, 1985).
Total solid content in milk suspension positively affected the firmness of yoghurt
coagulum in linear way, as shown by the increase in storage modulus and lower
loss tangent (Kristo et al., 2003). Acidified milk containing higher levels of total
solid started to gel earlier, and exhibited greater maximum G’ than that with lower
level of total solids. Higher concentration of total solids also prolonged the time to
reach end of fermentation, probably due to buffering effect of milk solid. Since
yoghurt cultures obtained more nutrition from milk containing higher
concentration of total solid, the cell growth and acid production is improved. The
fat content in milk also showed similar tendency, where full fat yoghurt (3.5 g/100
g fat) exhibited firmer structure than low fat yoghurt (Xu et al., 2008).
Consequently, yoghurt made from skim milk may potentially face the problem of
weak texture.
Texture of yoghurt is also affected by several processing factors during,
before and after fermentation. Pre-heating (95 °C, 5 min) and homogenization are
common pre-treatments to milk (Tamime and Robinson, 1985). During pre-
heating, denaturation of whey protein takes place, which starts the interactions
among β-lactoglobulin, κ-casein, and α-lactalbumin. As a result, yoghurt gel
becomes stronger and more stable. Higher temperature potentially escalates the
effect. A 5 °C difference in pre-heating temperature between 80-95 °C for 1 min
increased storage modulus of resulted fermented milk coagulum (Xu et al., 2008).
At the same time, prolonged heating such as 30 min at 95 °C seemingly resulted

42
in severely denatured whey proteins, and caused substanstial increase in firmness
(Knudsen et al., 2006). Pressure treatment applied to milk such as homogenisation
or pressurization may also induce particle interaction and give comparable effects
to extensive heat-treatment (Knudsen et al., 2006). During yoghurt fermentation,
temperature is usually set between 37-45 °C (Tamime and Robinson, 1985). The
effect of temperature on yoghurt texture varies. Kristo et al. (2003) reported that
higher temperature within the range increased gelation rate, significantly
shortened the onset of gelation, and resulted in higher storage modulus, more
poreous structure and higher level of syneresis. Higher fermentation temperature
supported the growth of yoghurt cultures, thus reduced fermentation time and also
affected polysaccharides production. In contrast, Beal et al. (1999) showed that
lower fermentation temperature resulted in more viscous gel.
The type and concentration of yoghurt inoculum influence gelation and final
texture of yoghurt, by altering the start and onset of gelation (Jumah et al., 2001).
The sudden increase in viscosity, indicating the start of gelation, is delayed at low
concentration of yoghurt starter inoculum. The onset of gelation and shear-
thinning properties of yoghurt gel depend on the type of cultures. The firmness of
yoghurt is positively related to slow gelation. In addition, it is also influenced by
the type of culture which may in conjunction with the characteristics of
polysaccharides produced during fermentation.

43
3 Production and Rheological
Characterization of Exopolysaccharides
Produced by Strains of Streptococcus
thermophilus
3.1 Introduction
In this experiment, the production of exopolysaccharides (EPS) of two
strains of Streptoccous thermophilus was studied, and the rheological properties
of the EPS-suspension were also examined. EPS is one type of hydrocolloids
which possess the potential as emulsifier or stabilizer to affect food texture. The
study on factors affecting the production of the EPS is thus useful in optimization
of their production. The rheological characterisation of EPS is not only important
for the application of the EPS as food additives, but also to study its interaction
with milk components in fermented milk which may then determine the final
textural characteristics of product. Results of such study can be utilised to control
the processing environment during the making of fermented milk.
Considerable attention has been given to bacterial exopolysaccharides
(EPS) in foods arising their ability to provide potential health benefits to
consumers (De Vuyst and Degeest, 1999, Looijesteijn et al., 2001) and their
application as thickening agents in processed products (Cerning, 1990). Although
certain bacterial species can produce considerable amounts of EPS, yoghurts
prepared with strains Streptococcus thermophilus result in less than 0.1% EPS in
the final product (Cerning, 1990). Nevertheless, EPS play an important role in the
development of yoghurt texture, with the type of EPS exerting a greater effect
than their concentration (Vaningelgem et al., 2004b). In general, two strain-
dependent types of EPS (Mozzi et al., 2006) have been frequently assessed for

44
their effects on yoghurt texture, namely ‘ropy’ and ‘capsular’. Certain bacterial
strains may even produce a mix of these two types in various proportions (Zisu
and Shah, 2003, 2005b). Furthermore, combinations of the two types of EPS
producing cultures improved not only the total EPS production but also yoghurt
texture (Marshall and Rawson, 1999).
Numerous studies have been conducted in order to enhance our
understanding of the factors governing EPS production and the mechanisms by
which they affect the yoghurt texture. Most of the EPS produced during yoghurt
fermentation are heteropolysaccharides, and their production may be
unpredictable due to a plasmid-related instability (Boels et al., 2001). EPS
production, thickening properties, molecular mass and structural conformation are
greatly affected by environmental factors (Ruas-Madiedo et al., 2005a). In some
species, these affected only EPS yield, because their monosaccharide composition
remained unchanged (Looijesteijn and Hugenholtz, 1999). Strain selection,
temperature, pH and growth stage (Aslim et al., 2005), nitrogen source (Degeest
et al., 2002), and metabolizable sugars (Mozzi et al., 2003) are among the factors
influencing EPS production. EPS production by some S. thermophilus strains was
coupled to growth (de Vin et al., 2005). However, in some mesophilic bacterial
strains, EPS were mainly produced at sub-optimal growth conditions (Cerning,
1990). Depending on the strain and growth conditions, maximum yield of EPS
may be achieved in the exponential (Duenas et al., 2003) or stationary growth
phase (Gancel and Novel, 1994). At the end of growth phase, there are some
indications that EPS undergoes undesirable enzymatic degradation (Degeest et al.,
2002, Pham et al., 2000). The type of carbon source apparently governs the total
amount of EPS produced with a clear strain-dependence (Mozzi et al., 2001). For
example, S. thermophilus LY03 produced more EPS with lactose than with
glucose (Degeest and de Vuyst, 2000a). Nitrogen compounds in the growth
medium are necessary during formation of sugar nucleotides, essential precursors
for EPS assembly. However, the type of nitrogen source appears to be less
important in EPS production than is the carbon source (Duenas et al., 2003).
Although the type of EPS has been reported to influence yoghurt texture,
and some mechanisms on their interactions with milk proteins has been proposed,

45
there is a lack of information on the rheological properties of EPS produced by
yoghurt cultures. Such information can be useful for predicting the possible
interaction of EPS with milk component(s) to influence the texture of yoghurt.
More importantly these complex carbohydrates could also be applied in other food
systems as thickeners. Therefore, this study aimed to examine EPS production by
two strains of S. thermophilus which produced capsular-ropy and capsular EPS.
We report on the effect of fermentation conditions including temperature, time,
and carbon source; and on the rheological properties of extracted EPS.
3.2 Materials and methods
3.2.1 Bacterial cultures
The two strains of S. thermophilus examined in the study were kindly
provided by Australian Starter Culture Research Centre (Werribee, Australia). S.
thermophilus ST 1275 produces mainly ropy with a smaller portion of capsular
EPS, while ST 285 produces only capsular EPS (Zisu & Shah, 2003, 2005). The
frozen (-80 °C) cultures in 300 mL/L glycerol were activated by growing them
twice in M17 medium (Amyl Media, Merck Pty Ltd., Kilsyth, Victoria, Australia)
at 37 °C for at least 24 hours.
3.2.2 Cell growth and EPS production and isolation
The medium used in these experiments was basal M17 medium
supplemented with galactose, glucose or lactose at 20 g/L. The cultures were
inoculated into 30 mL of the sterile medium at 1 mL/100 mL in 50 mL Falcon
tubes (Falcon, Blue Max, Becton Dickinson and Company, Franklin Lakes, N.J.,
USA) and incubated at 30, 37 or 42 °C for 24 hours aerobically, during which
samples were periodically collected for analysis of all growth parameters and
determination of EPS concentration.

46
In this experiment, M17 was chosen as the medium rather than milk due to
its more defined and simpler composition. Presence of very complex compounds
in milk such as proteins may lead to difficulty in isolation and purification of EPS
from milk. Although EPS produced by the same strain in milk may be different
from those produced in M17 media, previous studies (Degeest and de Vuys,
2000a; Mozzi et al. 2006) mentioned that the composition of EPS did not alter
significantly by external factors during growth.
Determination of viable cell counts was carried out by serial dilutions in
sterile 1 g/L peptone water, and incubation at the corresponding temperature for
24 hours to obtain sufficient cell growth. Cell concentration was additionally
determined by optical density at 650 nm. EPS assessed in the rheological studies
were extracted from the culture grown in M17 medium by precipitation with
ethanol (Van Geel-Schutten et al., 1998). Initially, fermentation was stopped by
adding 25 mL/L of trichloroacetic acid (80 g/100 g) into the suspension, and
keeping the container in a cold room (4 °C) overnight. This was followed by
protein removal by centrifugation at 11000 × g and 4 °C for 10 min (Model J2-
HS, Beckman, Fullerton, California, USA). The supernatant was collected and
mixed with two volumes of ethanol. The mixture was allowed to stand for twelve
hours for complete precipitation of EPS. This procedure was repeated twice, after
which the EPS was freeze-dried (Dynavac freeze drier, Dynavac Eng. Pty. Ltd.,
Melbourne, Australia). The concentration of EPS was assessed using the phenol–
sulphuric acid method (Dubois et al., 1956). Lactic acid concentration was
determined by an HPLC method (Donkor et al., 2005). The method uses dilute
0.01 mol/L H2SO4 as a mobile phase with flow rate of 0.6 mL/min, and 300 × 7.8
mm ion-exchange Aminex HPX-87H column (Bio-Rad Laboratories, Australia)
coupled to a UV detector (Varian Analytical Instruments, Walnut Creek, CA,
USA) at 220 nm. The column temperature was maintained at 65 °C.
The determination of the viable cell counts was carried out by serial
dilutions in sterile 0.1 g/100 g peptone water, and incubation at the corresponding
temperature for at least 48 hours to obtain sufficient cell growth. The cell
concentration was additionally determined by optical density at 650 nm. The EPS
quantification was carried out according to a method described previously (Gancel

47
and Novel, 1994) involving protein digestion using pronase (Sigma Chemical Co.)
and dialysis. It was then followed by phenol-sulphuric acid method to quantify
glucose (Dubois et al., 1956) with slight modification. In brief, an aliquot sample
was heated for 10 min, cooled down and mixed with trichloroacetic acid, as
before, for the cell inactivation and protein removal. The EPS was collected as
reported previously and further degraded into their sugar units by acid hydrolysis
combined with heating. The released reducing sugars were then determined by
spectrophotometric/colorimetric method incorporating phenol and concentrated
sulphuric acid. The lactic acid concentration was determined following an
established HPLC method (Donkor et al., 2005). The method used dilute 0.01 M
H2SO4 as a mobile phase with flow rate of 0.6 mL/min, and 300 × 7.8 mm ion-
exchange Aminex HPX-87H column (Bio-Rad Laboratories, Australia) coupled to
Varian HPLC (Varian Analytical Instruments, Walnut Creek, CA, USA). The
column temperature was maintained at 65 °C.
3.2.3 Rheological characterization of EPS
Prior to analysis, the freeze-dried crude EPS was dissolved in citric acid-
phosphate buffer at pH 3 and also at 6.5 achieving concentrations of 0.1, 0.25, 0.5,
0.75 or 1 g/100 g. Samples were kept in cold (4 °C) storage for 12 hours to allow
hydration. Upon full EPS solubilisation, each sample was mixed using Vortex
mixer. As much as ~3 mL sample was placed in a cone-plate geometry, using
pipette. The gap between two stainless steel geometries was set at 0.3 mm. Any
excess of sample was carefully removed using pipette. The sample was then
subjected to a controlled shear rate ramp at different temperatures from 0.01 to
100/s in a cone and plate geometry (50 mm diameter, 2°) of a rheometer (Physica
MCR 301, Anton Paar, GmbH, Germany). Temperature regulation was achieved
with a Viscotherm VT 2 circulating bath and controlled with a Peltier system
(Anton Paar) to an accuracy of ± 0.1 °C. The data were analyzed with proprietary
software (Rheoplus/32 v2.81, Anton Paar). The flow curves were fitted to
rheological models; Ostwald (for overall shear rate curve 0-100/s), and Cross (for

48
non-Newtonian flow at a shear rate below 10/s). These models are presented by
the following equations:
Ostwald model: ( )1−⋅= nKγη (1)
Cross model: ( )m⋅+=
τγηη
10
(2)
with K, n, η, γ& as consistency index (mPa sn), flow behaviour index
(dimensionless), apparent viscosity (mPa s) and shear rate ( 1/s ), respectively; ηo
presents the zero shear rate viscosity (mPa s), τ relaxation time (s), and m is the
limiting slope (dimensionless). The effect of concentration on viscosity was
studied by applying the following equation (Speers and Tung, 1986):
(3)
where a and b are parameters derived from the intercept (mPas g/100g-b) and the
slope of a logarithmic plot (dimensionless), respectively. C presents EPS
concentration (g/100 g). The influence of temperature on apparent viscosity was
also assessed using the Arrhenius model (Macosko, 1994, Speers and Tung,
1986):
(4)
where η is the apparent viscosity (mPa s) at shear rate of 100/s, A the frequency
factor (mPa s), ΔE the activation energy (J/mol), R the gas constant (8.314 J/mol
K), and T is the absolute temperature (K).
3.2.4 Statistical analysis
A randomized split plot in time block design was applied to the design of
the fermentation experiments. This was set up with four main effects: strain (two
49
levels), sugar types (three levels), temperatures (three levels), and fermentation
time (six levels: 0, 3, 6, 9, 12, 24 hours). This design was replicated twice with at
least two sub samplings. Results were analyzed using a General Linear Model
procedure (SAS, 1996). The level of significance was set at P=0.05. The best fit
correlational analysis for rheological data was carried out using the Rheoplus
software (v2.81, Anton Paar).
3.3 Results and discussion
3.3.1 Microbiological and chemical analysis
Viable cell counts were significantly (P<0.5) affected by all the factors:
strain, temperature, type of sugar, the fermentation time and their interactions. The
capsular strain consistently showed slower growth compared to capsular-ropy
culture, regardless the growth conditions. The maximum cell number of the
capsular strain was 2.2 × 10⁸ cells/mL achieved in glucose-M17 medium at 42 °C.
In contrast, the capsular-ropy culture grew to 1.6 × 10¹⁰ cells/mL in lactose-M17
medium at 37 °C (Figure 3.1A, B). Higher temperatures (37 and 42 °C) resulted in
greater cell growth than that at 30 °C for both strains and all types of sugar. M17
medium containing glucose or lactose was more growth supportive than that with
galactose for both strains and in all temperatures.
The positive effect of higher fermentation temperature, glucose or lactose on
the cell growth was also confirmed by other growth parameters such as optical
density (OD), pH and lactic acid production (Table 3.1). Statistically, OD readings
were only significantly (P<0.05) influenced by the type of sugar and its
interactions with other factors. Fermentation time and the type of strain
individually had no effect on cell growth as measured by OD, but their
interactions did (P<0.05). Sugar type and its interaction with other factors
significantly (P<0.05) affected the final pH of the medium. Lactic acid
concentration was similarly influenced by the factors examined. The types of
sugar substantially (P<0.05) influenced lactate concentration, where glucose
produced most lactic acid (~0.80-0.87 + 0.02 mg/mL), whereas galactose

50
produced the lowest levels ~0.55-0.62 ± 0.02 mg/mL. In most cases, from the 8th
hour onwards, lactate concentration was either increased or remained unchanged.
The EPS production was only significantly (P<0.05) affected by the type of
sugar and the fermentation time, and their interactions with other factors. The
amount of EPS produced by the two strains was not significantly (P>0.05)
different. Maximum EPS production by capsular-ropy strain was 441 + 36.2
mg/L, produced in galactose-M17 at 42 °C after 12 hours. Similarly, the capsular
strain produced 563 + 36.2 mg/L, in glucose at 30 °C after 12 hours (Figure
3.2A,B). EPS production of capsular strain at all temperatures was relatively high
and the difference among them was negligible. Although not statistically
significant (P>0.05), higher temperature tended to enhance EPS production of
capsular-ropy strain in all types of sugar (Figure 3.2A,B). On the other hand, the
capsular strain appeared to prefer lower temperature (30 °C) and produced more
EPS when grown on glucose or lactose (Figure 3.2A,B). M17 medium containing
galactose poorly supported the cell growth, however, the EPS concentration in
this medium was relatively high. In medium with lactose at all temperatures, and
glucose or galactose at low temperature (30 °C), maximum EPS concentration
was reached after 8 hours. After that time it was often slightly reduced towards the
end of fermentation. The pattern of EPS production over time by the capsular
strain was somewhat similar to that of the capsular-ropy counterpart, except that
EPS concentration in galactose medium at low temperature (30 °C) remained
stationary after 4 hours. Moreover, EPS concentration in lactose medium at low
temperatures (30 and 37 °C) was small, and did not show any considerable change
until the end of fermentation.

51
Figure 3.1 The viable cell counts of the capsular-ropy (A) and the capsular (B)
strain of Streptococcus thermophilus cultivated in a M17 medium supplemented
with glucose, galactose or lactose, at 30, 37 or 42 °C, for 24 hours.

52
Table 3.1 Cell growth parameters of capsular-ropy and capsular strain of Streptococcus
thermophilus as affected by temperature and sugar source during growth phase Strain Temperature,
(°C) Time, (hour)
Types of sugar
pH* Lactic acid concentration,
(g/100 g lactate) *
OD*
30 8 galactose 6.91cB 0.53aA 0.07cA Capsular-ropy lactose 5.99aB 0.67bA 0.86bA
glucose 6.38bB 0.87cA 0.72bA 24 galactose 6.88cA 0.54aA 0.09aA lactose 5.94bB 0.65bB 0.95bA glucose 5.48aB 0.84cA 1.73cA 37 8 galactose 6.81cAB 0.55aAB 0.15aA lactose 5.82bB 0.68bA 1.23bB glucose 5.05aA 0.87cA 2.52cB 24 galactose 6.69cA 0.68bC 0.20aA lactose 5.80bB 0.57aA 1.08bA glucose 5.01aA 0.88cA 2.08cB 42 8 galactose 6.62bB 0.58aB 0.28aA lactose 5.29aA 0.77bB 1.75bC glucose 5.09aA 0.88cA 2.53cB 24 galactose 6.52bA 0.60aB 0.28aA lactose 5.32aA 0.74bC 1.67bB glucose 5.09aA 0.88cA 2.78cB
Capsular 30 8 galactose 6.94cA 0.55aA 0.24cC lactose 5.93bA 0.65bA 0.94aB glucose 5.25aA 0.84cB 2.12bB 24 galactose 6.84cA 0.56aA 0.27cB lactose 5.88bA 0.66bA 1.01aB glucose 5.26aA 0.83cB 2.11cB 37 8 galactose 6.75cA 0.54aA 0.20aA lactose 5.89bA 0.64bA 0.57bA glucose 5.40aA 0.84cB 1.69cB 24 galactose 6.59cA 0.57aA 0.14aA lactose 5.85bA 0.66bA 0.66bB glucose 5.36aA 0.84cB 1.51cA 42 8 galactose 6.93cA 0.59aB 0.20aA lactose 5.96bA 0.66bA 0.57bA glucose 5.38aA 0.76cA 1.58cA 24 galactose 6.85cA 0.57aA 0.16aA lactose 6.09bB 0.62bA 0.44bA glucose 5.41aA 0.77cA 1.60cA
SEM** 0.10 0.02 0.11
*different small letters in a coloumn denote significant (P>0.05) difference among means of the same culture, temperature and time but different sugar types. The different capital letters depict a difference (P>0.05) among means of the same culture, sugar type and time but different temperature.**SEM, standard error of means, with P=0.05.

53
Figure 3.2 The exopolysaccharide production by the capsular-ropy (A) and the
capsular (B) strain of Streptococcus thermophilus grown in a M17 medium
supplemented with glucose, galactose or lactose, at 30, 37 or 42 °C, for 24 hours.

54
Our results were in agreement with previous work showing comparable cell
numbers of S. thermophilus grown in lactose- and glucose-containing medium
(Degeest and De Vuyst, 2000b). In contrast to these findings, an import system in
S. thermophilus is lactose-dedicated (van den Bogaard et al., 2000), causing poor
growth on glucose (Poolman, 2002b). The growth of S. thermophilus strain in the
glucose based medium required the activity of phosphoglucomutase which may be
repressed in the presence of lactose (Levander and Radstrom, 2001). Galactose
did not support the growth of S. thermophilus cells (Deegest and de Vuyst, 2000)
and its secretion was energetically-favoured (Levander and Radstrom, 2001).
Most of the strains were able to utilize only part of excreted galactose moiety (de
Vin et al., 2005).
Our experiment showed that both strains produced considerable amounts of
EPS in M17 medium (Figure 3.2A, B), even higher than in a recent study (Aslim
et al., 2006). Similar to our result, no difference in the EPS production of ropy and
non-ropy strains was observed previously (Mozzi et al., 2006). Most of S.
thermophilus strains own Leloir system for EPS synthesis (Mora et al., 2002). The
three sugars examined in our study potentially supported the EPS production, as
reported elsewhere (Chervaux et al., 2000), with galactose was frequently related
to EPS production (Mozzi et al., 2001). Glucose or glucose moiety of lactose was
used for EPS synthesis (Welman et al. 2006). However, when present as a sole
carbon source in the medium, glucose poorly supported the EPS production
compared to lactose (Deegest and de Vuyst, 2000). Notably in our study, EPS
production was only significantly (P<0.05) affected by time. The growth-
associated nature of the EPS production of Streptococcus thermophilus strains
was reported previously, with the EPS was produced mainly during logarithmic
phase (Ruas-Madiedo et al., 2005a).
Galactose was the predominant (Goh et al., 2005) and a consistent (Goh et
al., 2005, Mozzi et al., 2006) primary unit in the EPS backbone of several S.
thermophilus strains, although most of them did not utilize galactose (Mora et al.,
2002) or metabolized galactose only at the end of growth phase (de Vin et al.,
2005). However, several reports found discrepancies between theoretical values
and actual galactose concentration in the medium, suggesting a flux to other

55
metabolites including lactic acid or even assimilation of galactose into EPS in the
Gal-
strains of S. thermophilus (de Vin et al., 2005). Galactose appeared to
contribute to the EPS anabolism rather than the cell growth (Mozzi et al., 2001).
The availability of galactose might be initiated by the activation of galactose
symporter in the absence of lactose (de Vin et al., 2005) or low lactose/galactose
ratio (Poolman, 2002b). Moreover, galactose catabolism was also possible by the
activation of some enzymes of Leloir pathway such as galactokinase in lactose-
depleted environment (de Vin et al., 2005).
The EPS concentration in the medium was reduced at the end of the growth
phase. This could be related to shortage of the available ATP required for EPS
polymerization (Welman et al., 2006). Moreover, the cell lysis (Mozzi et al.,
2003) could lead to the enzymatic degradation of EPS (Pham et al. 2000) towards
the late stages of the growth.
3.3.2 The flow behavior of the crude EPS solutions
The flow curves of the dispersions containing both EPS types at pH 6.5 were
fitted to the Ostwald model with high correlation coefficient (between 0.8-0.9). At
very low shear rates (below 10/s), a small overshoot as well as thixotropy was
observed (figure not shown). In the Ostwald model, consistency index (K) denotes
the shear resistance of material, with high value indicates greater resistance. While
the other parameter, flow behaviour index n, designates deviation from the
Newtonian flow (n = 1) (Rao, 1999). The values of both parameters were affected
significantly (P<0.05) by strain, pH, and temperature (Table 3.2). The effect of
interaction between strain and pH was only significant (P<0.05) for K value,
whilst, the n value was affected significantly by the interaction between strain and
temperature. K values were in general low (Table 3.3, 3.4), apparently a sign of a
low shear-resistance (Speers and Tung, 1986). Capsular EPS showed higher K
values than the capsular-ropy EPS, indicating more shear-resistant nature.
Moreover, the flow behaviour indices (n) of the capsular-ropy EPS dispersions
were close to that of Newtonian fluid. In contrast, n values of the capsular EPS
dispersions were low, with a considerable deviation

56
Table 3.2 Adjusted mean squares from analysis of variance of the Ostwald
parameters of capsular-ropy and capsular exopolysaccharide, at pH 3 and 6.5,
different concentrations and temperatures
p-value Source of variation DF
K n
Strain 1 <0.0001 <0.0001 Concentration 3 0.076 0.211 pH 1 <0.0001 <0.0001 Temperature 3 <0.0001 <0.0001 Strain × concentration 3 0.118 0.389 Strain × pH 1 <0.0001 <0.0001 Strain × temperature 3 0.009 <0.0001 Concentration × pH 3 0.294 0.018 Concentration × temperature
9 0.147 0.001
pH × temperature 3 <0.0001
Error 192

57
Table 3.3 Concentration dependency of consistency (K) and flow behaviour (n)
index of EPS dispersions at pH 3 and 4, 20, 37 or 42 °C
Strain EPS (g/100 g)
Temperature (°C) Capsular-ropy Capsular
K (mPa sn) n r2 K
(mPa sn) n r2
1.00 4 7.5 0.79 0.909 14.8 0.57 0.750 20 5.3 0.80 0.981 7.9 0.63 0.773 37 9.9 0.44 0.871 7.6 0.55 0.766 42 7.7 0.63 0.949 8.1 0.62 0.804
0.75 4 7.8 0.70 0.799 7.3 0.73 0.775 20 6.5 0.88 0.895 5.7 0.67 0.781 37 8.7 0.47 0.778 7.6 0.51 0.793 42 3.8 0.76 0.923 3.3 0.79 0.956
0.50 4 5.8 0.79 0.874 5.6 0.78 0.844 20 2.8 0.89 0.934 4.1 0.68 0.764 37 7.6 0.48 0.820 5.6 0.55 0.746 42 3.6 0.71 0.960 3.4 0.72 0.953
0.25 4 5.1 0.74 0.834 4.2 0.82 0.836 20 1.9 0.98 0.921 3.0 0.77 0.863 37 5.0 0.62 0.848 7.5 0.44 0.740 42 4.6 0.63 0.937 2.5 0.78 0.950

58
Table 3.4 Concentration dependency of consistency (K) and flow behaviour (n)
index of EPS dispersions at pH 6.5 and 4, 20, 37 or 42 °C
Strain EPS (g/100 g)
Temperature (°C) Capsular-ropy Capsular
K (mPa sn) n r2 K
(mPa sn) n r2
1.00 4 4.2 0.84 0.929 19.4 0.37 0.867 20 2.7 0.87 0.971 20.5 0.32 0.948 37 1.8 0.90 0.969 21.6 0.23 0.732 42 3.8 0.62 0.801 12.1 0.38 0.759
0.75 4 5.9 0.79 0.868 19.2 0.36 0.746 20 3.4 0.77 0.932 17.9 0.31 0.945 37 5.7 0.44 0.796 13.4 0.25 0.817 42 1.5 0.90 0.987 7.3 0.45 0.725
0.50 4 3.8 0.85 0.923 16.3 0.36 0.415 20 2.8 0.74 0.898 19.5 0.22 0.818 37 2.6 0.65 0.786 10.5 0.34 0.916 42 1.7 0.82 0.975 6.0 0.45 0.753
0.25 4 3.2 0.85 0.898 12.3 0.49 0.660 20 1.8 0.81 0.848 18.3 0.19 0.915 37 2.3 0.67 0.784 6.1 0.14 0.895 42 1.7 0.78 0.975 5.4 0.45 0.694

59
from the Newtonian flow and thus exhibiting greater pseudoplastic behaviour. In
most samples, lower EPS concentrations and higher temperatures had a negative
effect on K values, with no apparent trend for n values. However, EPS dispersions
at pH 3 did not show any observable difference of Ostwald constants between the
two types of EPS. The low pH may diminish the rheological difference between
the two.
An increase of the EPS concentration caused concomitant increase of the
apparent viscosity. The parameter ‘a’ was slightly greater for the capsular than
capsular-ropy EPS, which denoted the more temperature-sensitive nature of the
capsular EPS (Table 3.5). The Arrhenius plot showed that the temperature
negatively affected the apparent viscosity of both the colloids (Figure 3.3, 3.4). In
the same manner, the activation energy also decreased with the increasing
temperature (Table 3.5). The activation energy (ΔE) is the energy required to
facilitate the motion of a liquid during flow, and smaller when kinetic energy of
the material increases due to rise in temperature (Speers and Tung, 1986). This
phenomenon was also shown in our work, with the ΔE values for the capsular-
ropy EPS were slightly higher than those of the capsular EPS (Table 3.6).
Apparently, the capsular-ropy EPS molecules were slightly more restricted to
move than those of the capsular EPS. Activation energy was correlated to
cohesion and stickiness of sugar dispersions (Chen, 2007). Nevertheless, the
relatively low values of ΔE obtained in the present study were somewhat
comparable to earlier reports (Kwon et al., 1996, Speers and Tung, 1986), thus
emphasizing a negligible influence of temperature on the apparent viscosity
(Figure 3.3, 3.4). pH had no apparent effect on the viscosity at different
temperatures. The activation energy at low pH, however, tended to be slightly
lower than at higher pH (Table 3.5).
There was a clear difference among the methods employed in this
experiment to reveal the effect of temperature on the viscosity of EPS. While the
results presented in Tables 3.3 and 3.4 did not reveal clearly the effect of
temperature on viscosity, the result in Tables 3.5 and 3.6 showed obvious effect.
The K values did not show the decreasing viscosity as the temperature was

60
Table 3.5 Parameters of apparent viscosity (at 100/s shear rate) as a function of
concentration for capsular-ropy and capsular EPS dispersions at temperatures
ranging from 4 to 42 °C
Capsular-ropy Capsular Temperature (°C) a
(mPa s%-b) b r2 a
(mPa s%-b) b r2
pH 3.0 4 9.96 0.21 0.889 13.96 0.27 0.929 20 5.23 0.18 0.828 7.42 0.25 0.907 37 3.27 0.17 0.764 5.75 0.27 0.956 42 2.76 0.16 0.703 6.31 0.32 0.958
pH 6.5 4 3.00 0.12 0.614 3.07 0.23 0.914 20 1.83 0.10 0.598 1.88 0.21 0.905 37 1.15 0.11 0.577 1.21 0.21 0.911 42 0.91 0.11 0.614 0.99 0.22 0.901

61
Figure 3.3 Arrhenius plot of temperature from 0 to 42 °C and concentration from
0.25-1 g/100 g (0.25 - ◇; 0.5 - ■; 0.75 - ▽; 1 g/100 g EPS - ●) at pH 3.0 and
apparent viscosity of capsular-ropy (solid line) and capsular (dashed line) EPS at
shear rate of 100/s.

62
Figure 3.4 Arrhenius plot of temperature from 0 to 42 °C and concentration from
0.25-1 g/100 g (0.25 - ◇; 0.5 - ■; 0.75 - ▽; 1 g/100 g EPS - ●) at pH 6.5 and
apparent viscosity of capsular-ropy (solid line) and capsular (dashed line) EPS at
shear rate of 100/s.

63
Table 3.6 Arrhenius-like temperature dependency of apparent viscosity of
capsular-ropy and capsular EPS dispersions of different concentrations
determined at 100/s shear rate and pH 3 and 6.5
Capsular-ropy Capsular EPS concentration
(g/ 100 g) ΔE
(kJoule/mole)A
(mPa s)r2 ΔE
(kJoule/mole) A
(mPa s) r2
pH 3.0 1.00 8.31 0.049 0.998 8.32 0.051 0.998 0.75 8.82 0.037 0.999 8.26 0.048 0.998 0.50 8.77 0.036 0.999 8.83 0.036 0.992 0.25 8.22 0.042 0.998 8.43 0.038 0.996 0.10 7.73 0.052 0.999 9.13 0.027 0.996
pH 6.5 1.00 9.82 2.35 0.994 9.52 0.027 0.990 0.75 9.22 2.20 0.992 9.18 0.029 0.992 0.50 9.47 2.26 0.994 9.48 0.024 0.994 0.25 9.52 2.27 0.993 9.11 0.026 0.983 0.10 9.41 2.25 0.992 9.20 0.025 0.988

64
increased. This was especially observed in capsular-ropy EPS and temperature of
25 and 37 °C. Nevertheless, the effect of temperature was obvious in most of the
data between 4 and 42 °C, especially in capsular EPS. It seems that it is due to
less suitability of the method used, where K values did not reveal clearly the effect
of temperature, or the EPS concentration used was too low.
In contrast, the effect of temperature was obvious from Table 3.5, which
showed that temperature negatively correlated to apparent viscosity. Further, the
method employing Arrhenius equation (Table 3.6) was able to show that
activation energy ΔE of capsular-ropy EPS was higher than that of capsular EPS,
suggesting relatively restricted movement of molecules of capsular EPS. The less
free movement of capsular-ropy EPS and its temperature-insensitivity can explain
more the inconsistency of the K values for capsular-ropy EPS in table 3.3 and 3.4.
Thus, it was suggested that the use of parameter ‘a’ and activation energy ΔE is
better than K values in revealing the effect of temperature on the viscosity of these
types of EPS.
Polymer characteristics are often studied by assessing flow behaviour at very
low shear rate, such as below 10/s (Gorret et al., 2003). Some polysaccharides
exhibit non-Newtonian flow, obeying the power law only in the intermediate
shear-rate region, but not at low and high shear rates (Rao, 1999). In our work, the
data were fitted to the Cross model with a relatively high degree of correlation
(Table 3.7). The Cross model is commonly used to describe the flow
characteristics of materials possessing first and second Newtonian plateaus at low
and high shear rates and the power law flow in between (Macosko, 1994). Zero-
shear viscosity (ηo) was affected significantly (P<0.05) by strain and pH, but not
by concentration (P>0.05) (Table 3.7). Any interaction between two factors
involving concentration was not significant (P>0.05). In acidic environment (pH
3), dispersions of the capsular-ropy EPS showed higher ηo than those of the
capsular EPS dispersions (Table 3.8). However, the opposite occurred at pH 6.5.
Higher ηo may relate to lower mobility due to water-binding and enlargement of
EPS molecules (Ravi and Bhattacharya, 2004), and may indicate more extensive
coil overlap (Gorret et al., 2003). Similarly, the values of τ (structural relaxation
time) were significantly (P<0.05) affected by all factors examined except
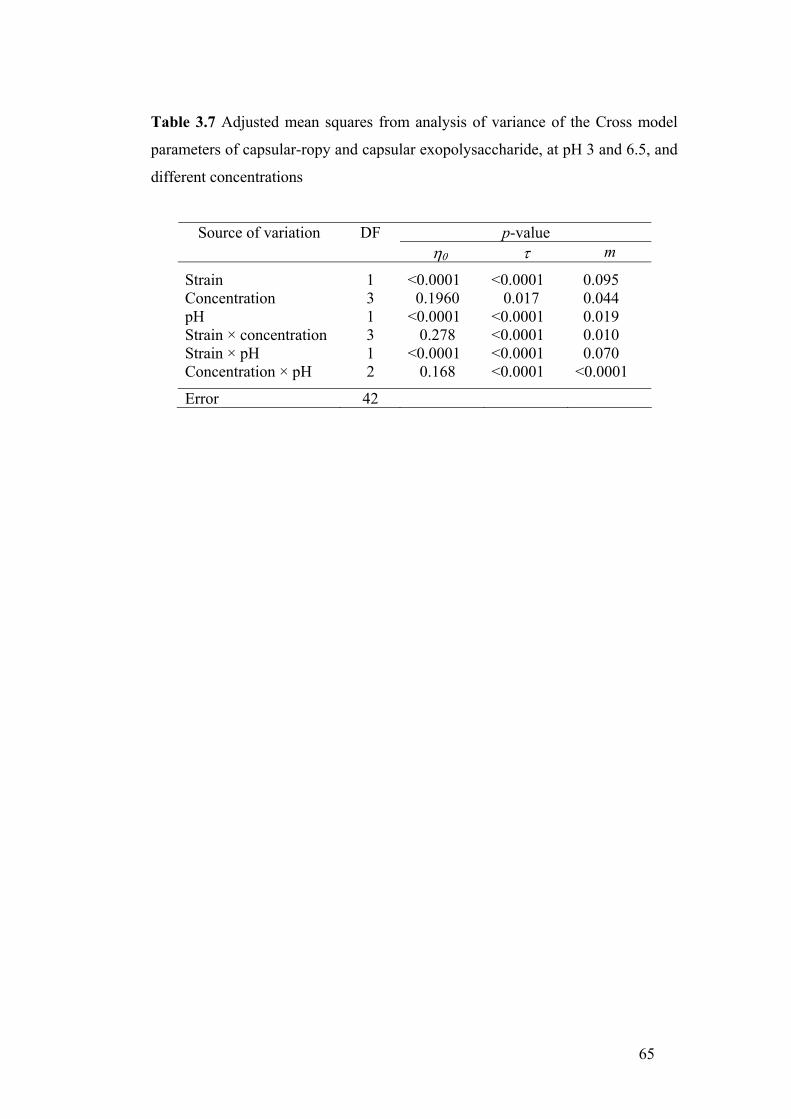
65
Table 3.7 Adjusted mean squares from analysis of variance of the Cross model
parameters of capsular-ropy and capsular exopolysaccharide, at pH 3 and 6.5, and
different concentrations
p-value Source of variation DF η0 τ m
Strain 1 <0.0001 <0.0001 0.095 Concentration 3 0.1960 0.017 0.044 pH 1 <0.0001 <0.0001 0.019 Strain × concentration 3 0.278 <0.0001 0.010 Strain × pH 1 <0.0001 <0.0001 0.070 Concentration × pH 2 0.168 <0.0001 <0.0001
Error 42

66
Table 3.8 The Cross model parameters describing the dependence of the apparent
viscosity of capsular-ropy and capsular EPS dispersions on the concentration at
pH 3 and 6.5
67
concentration. A greater structural relaxation time (τ) was a sign of more
extensive entanglement leading to a less mobile EPS chain, and consequently a
longer time to develop new entanglement after disruption during shearing (Gorret
et al., 2003). Greater values of τ at increasing polymer concentration (Table 3.8)
as shown in our work might be ascribed to non-gelling properties (Gorret et al.,
2003). However, we observed that higher concentrations of capsular EPS at pH
6.5 exhibited lower τ (Table 3.8), indicating a gelling character under these
conditions. The value of m is equal to (1-n) where n is flow behaviour index in the
power law model (Ravi and Bhattacharya, 2004). Therefore, the greater the m
values, the more the material deviates from the Newtonian behaviour. The m
values were not affected (P>0.05) by strain and interaction between strain and pH
(Table 3.7). They were affected by concentration, pH, and temperature, and the
combinations of two factors among them. The insignificant role of concentration
in our study may be due to the low concentrations used. Considerably higher
concentration was required to enable examination of viscoelastic properties, eg. 6
g/L in the case of the EPS from Propionibacterium acidipropionici (Gorret et al.,
2003). Although it was apparent from our work that the two types of EPS
exhibited different rheological characteristics, their interaction with milk
components during fermentation may be more influential in determining the final
texture of yoghurt (Rohm and Kovac, 1994).
3.4 Conclusions
The cell growth and EPS production of the two strains of S. thermophilus
was affected by fermentation conditions, with capsular strain showed slower
growth but similar amount of EPS produced. In general, high temperature, glucose
and lactose supported cell growth. The EPS-production in both strains was
growth-associated. Galactose was not supportive to cell growth, but EPS
production in medium containing this sugar was as much as in other sugars. Thus,
both strains were able to utilize galactose supplemented into the medium,
seemingly for EPS synthesis. In most cases, maximum EPS production was
attained after 4-8 hours. The viscosity of capsular EPS was seemingly more

68
influenced by temperature. Compared to capsular EPS, capsular-ropy EPS
apparently exhibited more resistant to flow and less ability to structural
rearrangement after shear-induced disruption. The activation energy of capsular-
ropy EPS tended to be higher than that of the capsular EPS. Strain, temperature
and pH were significant in determining the flow behaviour of the EPS dispersions.
In the next chapter, the suitability of lactose for both growth and EPS
production will be examined in fermented milk product. The effect of processing
factors especially incubation temperature and storage will be evaluated. The
possible influence of the rheological difference between EPS of the two strains on
texture of fermented milk will also be investigated.

69
4 Effects of Exopolysaccharide-Producing
Strains of Streptococus thermophilus on
Technological and Rheological Properties
of Fermented Milk
4.1 Introduction
In the previous chapter, it was shown that capsular-ropy EPS exhibited
lower mobility in the aqueous system and was also less sensitive to temperature
changes in comparison to capsular EPS. The EPS production itself and the cell
growth were positively affected by temperature. These properties will be
evaluated in real food system, i.e. fermented milk. It was expected that high
incubation temperature would result in higher EPS production as well as
improved cell growth. The effect of two different EPS on fermented milk texture,
however, may not be easily predicted since it would involve their interactions with
other milk components. Studying the texture of fermented milk produced using
the strains in different processing conditions would provide better insight on how
the two EPS would affect real food system.
Many cultures have appreciated yoghurt as an integral part of everyday
diet for centuries. The rich flavour and smooth body have been major contributors
to its consumer acceptance, although these attributes nowadays are accompanied
with certain health benefits. In early 20th century, Metchnikoff suggested that the
longevity of Bulgarian peasants could have been attributed to the consumption of
yoghurt. The fermenting cultures used in yoghurt production could minimize
detrimental effect of putrefactive bacteria in the gut (Vasiljevic and Shah, 2007).
Recent marketing reports indicate that the production of fermented dairy products

70
is on the rise with yoghurt being the second most popular snack among children in
the USA (Sloan, 2006).
In addition to health benefits, another important characteristic of its
attractive perception is textural properties such as viscosity (Marshall and
Rawson, 1999), smoothness and thickness (Jaworska et al., 2005) and structural
resistance to stress (Skriver et al., 1993). Yoghurt cultures commonly used are
strains of Lactobacillus delbrueckii ssp. bulgaricus and Streptococcus
thermophilus. L. bulgaricus may impart specific sensory properties due to ‘post-
acidification’ (Oliveira et al., 2001). Alternatively, yoghurt may be produced by a
single strain culture of S. thermophilus, which results in a mild flavour. This
approach has been accommodated by several regulatory bodies. In Australia,
yoghurt is defined as a fermented milk produced by fermentation with lactic acid
producing microorganisms (FSANZ, 2003). This particular strain also gives a
desirable body to yoghurt due to its production of exopolysaccharides (Hassan et
al., 1996a). The presence of EPS in fermented products influences several
important sensory properties, including mouth thickness, shininess, clean cut,
ropiness and creaminess (Folkenberg et al., 2005). Due to discrepancy in
regulations worldwide, the products produced from a yoghurt base and fermented
by a single strain of a mixed yoghurt culture or any other lactic acid bacterium are
generally termed fermented milks.
The semi solid texture of yoghurt is a result of the development of a three-
dimensional protein network during fermentation. The formation of the yoghurt
gel is related to pH decrease and culture behavior during fermentation (Hassan et
al., 1996b). The development of the elastic gel structure with a solid like
behaviour starts at pH around 5.6, caused by structural changes of micelle due to
solubilization of colloidal calcium phosphate (Lee and Lucey, 2004b). Further pH
reduction causes more complex and extensive interconnection of casein particles,
leading to the formation of a continuous protein network and thus governing the
structure of yoghurt. Textural properties of yoghurt such as viscosity (Marshall
and Rawson, 1999), smoothness and thickness (Jaworska et al., 2005) and
structural resistance to stress (Skriver et al., 1993) are important attributes
determining its consumer acceptance. In this regard, viscosity of yoghurt appears

71
to be more influential than flavor (Jaworska et al., 2005) and affected by type of
culture used (Guzel-Seydim et al., 2005, Haque et al., 2001), fermentation
temperature and storage time (Guzel-Seydim et al., 2005).
The traditional yoghurt production includes the fermentation of milk with a
thermophilic mixed cultures consisting of strains of Lactobacillus delbrueckii ssp.
bulgaricus and Streptococcus thermophilus. In addition to the pH lowering effect
and flavour formation, it plays a major role in the yoghurt texture creation through
its in situ exopolysaccharides (EPS) production. The EPS produced by yoghurt
starter cultures affect the texture of yoghurt and improve sensory characteristics
such as mouthfeel, shininess, clean cut, ropiness and creaminess (Folkenberg et
al., 2005). However, the final textural characteristics of yoghurt are strongly
dependent on structural properties of EPS, such as type (capsular or ropy) (Bouzar
et al., 1997), the degree of ropiness (Hassan et al., 1996b), sugar composition
(Petry et al. 2000, Petry et al., 2003) and degree of branching (Rinaudo, 2004).
The role of the capsular and ropy EPS on the texture of yoghurt has been
extensively studied for their distinctly different behaviour in relation to the
interaction with milk proteins during yoghurt manufacturing. They differed in
their localization within the protein network (Folkenberg et al., 2005, Hassan et
al., 2003b) and their effect on the viscosity and consistency of yoghurt (Hassan et
al., 2002). Although a great deal of work has been done in this area, the effect of
EPS and other processing factors on rheological properties of yoghurt appears to
vary greatly, which may suggest a complex nature of the EPS-protein interactions
that affect the texture.
The temperature of fermentation may affect the viscosity of yoghurt directly
(Lee and Lucey, 2004b) or indirectly via the bacterial EPS production (Ruas-
Madiedo et al., 2002). Higher fermentation temperature causes higher gelation pH
and subsequently lowers the solubilization of colloidal calcium phosphate leading
to a weak structure of the gel. The EPS also production appears temperature
dependent (Haque et al., 2001, Lee and Lucey, 2004b), although the viscosity of
yoghurt was not always positively correlated to EPS concentration (De Vuyst et
al., 2003, Ruas-Madiedo et al., 2002). For example, relatively low EPS
concentration produced by L. lactis ssp. cremoris B40 resulted in the viscosity

72
similar to that of the strain with highest EPS concentration (Ruas-Madiedo et al.,
2002). Also, yoghurt with highest EPS content had the lowest viscosity (Bouzar et
al., 1997). Furthermore, the application of EPS-producing yoghurt cultures may
decrease the extent of syneresis (Hess et al., 1997, Moreira et al., 2000) likely due
to enhanced water-binding ability (Vinarta et al., 2006).
We have recently identified a strain capable of producing both, capsular and
ropy EPS, and tested its applicability in the manufacturing of low-fat cheese (Zisu
and Shah, 2003, 2005b). S. thermophilus ST 285 produces capsular EPS which
attached to outer cell wall as assessed using staining and microscopic technique
(Zisu and Shah, 2002). On the other hand, when examined using similar technique
combined with viscosity measurement, strain of ST 1275 produces capsular EPS,
as well as ropy EPS, which is excreted into the medium and consequently
increased viscosity of medium (Zisu and Shah, 2003). Our goal in this study was
to compare the performance of these two strains, ST 1275 and ST 285, in the
manufacturing of fermented milk. More specifically, the effects of fermentation
temperature and storage time were assessed in relation to culture growth, EPS
production and subsequent in situ content and rheological properties of fermented
milk.
4.2 Materials and methods
4.2.1 Materials
The starter cultures used in this study were obtained from the Australian
Starter Culture Research Centre (Werribee, Australia) and have been
characterized for their EPS production by Zisu and Shah (Zisu and Shah, 2002,
2003). S. thermophilus ASCC 1275 (ST 1275) produces both capsular and ropy
EPS, while S. thermophilus ASCC 285 (ST 285) produces capsular EPS only.
Frozen (at -80 °C) glycerol stocks of the cultures were activated by incubating
them twice in 30 mL sterile 14 g/100 g skim milk at 37 °C for 24 hours, before
using them in the fermented milk manufacturing. Skim milk was prepared by
reconstituting corresponding amount of skim milk powder (“Our Milk”, Cowbell,

73
Metallstrasse, Switzerland) in distilled water and subsequently sterilizing in an
autoclave at 121 °C for 15 min.
4.2.2 Experimental design and statistical analysis
All experiments were organized as a randomized full factorial block design
with culture, temperature and storage time as main factors. This block structure
was replicated twice with at least 2 subsamplings. Results were analyzed as split
plot in time measurements using General Linear Model procedure of the SAS
System (SAS, 1996). Where appropriate, correlational analysis was employed
using Microsoft Excel StatProTM. The level of significance was preset at P = 0.05.
4.2.3 Preparation of fermented milk batches
Skim milk powder was reconstituted to 14 g/100 g with distilled water,
pasteurized at 90 °C for 5 min in a water bath and stored in a cold room (4 °C)
overnight. The following day, it was pre-warmed in a water bath and inoculated
with 1 mL/100 mL of each strain of S. thermophilus. Inoculated milk was poured
aseptically into sterile 250 mL plastic containers, which were then placed in an
incubator at different temperatures: 30, 37 or 42 °C. During fermentation, the pH
change of all batches was recorded every 15 min using a pH meter (model 8417;
HANNA Instruments, Singapore). The fermentation time, in min, was defined as
time required to reach the mandatory pH of 4.5. The acidification rate was
inferred from the linear slopes of pH versus time functions and expressed as pH
milliunit/min (mU/min).
The fermentation was terminated at pH 4.5 and fermented milk samples
were immediately stored in a cold room (4 °C) for 30 days. During this storage
period, yoghurt batches were assessed for microbial, chemical and rheological
properties at day 1 (approximately 20 h post-fermentation), after 7 days (day 7)
and at the end (day 30) of the storage period.

74
4.2.4 Technological, microbial and chemical properties of fermented
milk
The enumeration of S. thermophilus strains followed the established
procedure reported previously (Donkor et al., 2006). Briefly, 1 mL of a fermented
milk sample was resuspended in 0.1 g/100 g peptone water and serially diluted to
desired levels. Diluted samples were plated on M17 agar (Merck Pty. Ltd.,
Kilsyth, Victoria, Australia) and incubated aerobically at 37 °C for 48 h. The
results obtained as means of six observations were expressed as log of colony
forming units per mL of fermented milk.
The pH change of fermented milk batches during storage was monitored
using a pH-meter (HANNA Instruments, Singapore). The titrable acidity of
fermented milk was also assessed following AOAC titration method using 0.1 M
NaOH (AOAC 33.2.06, 1999). Approximately 10 g of fermented milk was diluted
with approximately same volume of distilled water before titration. Titrable
acidity was expressed as percentage of lactic acid, determined using the following
equation:
100 (g) Sample
0.009 (mL) NaOH M 0.1 % acid, Lactic ×⋅
=
The crude EPS was determined following the method previously reported
(Rimada and Abraham, 2003) with some modifications (Figure 4.1). The method
was selected based on its reported high reliability (Rimada and Abraham, 2003).
Approximately 30 g of fermented milk was first centrifuged (Model J2-HS,
Beckman, Fullerton, California, USA) at 11000 × g at 4 °C for 4 min. The
supernatant was collected and combined with two volumes of chilled ethanol and
stored at 4 °C overnight. Consequently, the precipitate was collected by
centrifugation at 2000 × g at 4 °C for 15 min (J2-HS, Beckman). About 10 mL of
distilled water was then added to dissolve the EPS-containing precipitate,
followed by addition of 250 μL 80 g/100 g trichloroacetic acid to precipitate the
remaining proteins. The mixture was stored overnight at 4 °C, centrifuged at 2000
× g at 4 °C for 15 min (J2-HS, Beckman) and the supernatant was again collected.

75
The EPS in the supernatant was finally collected using ethanol precipitation and
cold storage as described above. The whole procedure for EPS purification using
water and TCA was repeated once more. After that, the EPS was vacuum-dried at
55 °C and weighed. The results were expressed as the amount of crude EPS per kg
of fermented milk.
The extent of syneresis during cold storage of fermented milk batches was
analysed by a centrifugation method previously reported (Amatayakul et al.,
2006) with a slight modification. Inoculated milk samples, prepared following
procedure described above, were fermented in centrifugation tubes (Falcon, Blue
Max, Becton Dickinson and Company, Franklin Lakes, N.J., USA) and
centrifuged (model RT7, Sorvall, DuPont, Newtown, Connecticut, USA) at 70 × g
at 8 °C for 10 min. The weight of the drained liquid was recorded and related to
the initial weight of fermented milk. The degree of syneresis was expressed as a
percentage.
4.2.5 Rheological properties of fermented milk
The rheological properties of fermented milk batches were characterized by
initially assessing flow behavior subsequently followed by a small amplitude
oscillatory measurement combined in one test. The measurements were carried
out using a Haake RheoStress rheometer (RS 50, Haake Rheometer, Karlsruhe,
Germany) fitted with a cone-and-plate measuring system (35 mm/2° angle). Prior
to analysis, all samples were brought to the room temperature (controlled at 20+1
°C) and all determinations were performed at this temperature. The data
acquisition was carried out by a RheoWin Pro software package (Version 2.94,
Haake). The rheometer was calibrated every 60 days by motor adjustment and two
oils with different viscosities as per manufacturer's instructions. The gap width
was preset as per the hardware specifications (MCR301, Anton Paar).
The samples were initially gently stirred with a spatula 20 times prior to
loading to achieve homogenous mixture. About 10 g sample was loaded into the
bottom plate with spoon. After lowering the upper geometry, excess was then
removed using spoon. Sample was subjected to a high shearing at 500/s for 60 s to

76
Figure 4.1 Method for determination of EPS concentration

77
diminish structural differences among samples caused by different treatments.
This was followed by 300 s equilibration to allow for a structural rebuilding that
would solely be dependent on the composition of the fermented milk. The
elimination of gel structure was also necessary prior to measurement of hysteresis-
loop-curves to eliminate the effect of probable cross-linking that may have
occurred during cold storage (Benezech and Maingonnat, 1994). The flow curves
were generated by measuring shear stress as a function of shear rates from 0.1 to
100/s (up and down sweeps). The flow behaviour was described by the Ostwald-
de Waele model (τ = K ⋅γ n), where τ presents shear stress (Pa), ⋅γ is shear rate
(1/s), while K and n are consistency factor (Pa sn) and flow behaviour index,
respectively. The hysteresis loop area between the upward and downward flow
curves (shear rates from 0 to 100/s) was also calculated using the RheoWin Pro
software (Version 2.94, Haake).
After ascertaining the flow behaviour, the sample was left to equilibrate
again for 300 s and then subjected to the dynamic oscillatory sweep. During these
determinations, the frequency was varied between 0.1 and 10 Hz in 14 steps at 5%
strain (determined from an amplitude sweep at 1 Hz). Dynamic moduli (G’, G”)
and their ratio, loss tangent (tan δ), were recorded as a function of frequency. All
determinations were independently repeated at least three times.
4.3 Results and discussion
4.3.1 Technological, microbial and chemical properties of fermented
milk
The technological performances of two EPS producing strains during
fermented milk manufacturing were assessed as the function of the fermentation
time, acidification rate and titrable acidity. The fermentation temperature had a
significant (P<0.05) effect on the rate of acidification. In general, the ropy (ST
1275) strain reached the end of fermentation at pH 4.5 faster (Figure 4.2) with a
greater acidification rate in comparison to the capsular (ST 285) strain (Table 4.1).

78
4
5
6
7
0 500 1000 1500Fermentation time, minute
pH
ST 285,30 ST 285,42 ST 285,37ST 1275,30 ST 1275,37 ST 1275,42
Figure 0.1 Time dependent pH change during the production of fermented milk
batches using Streptococcus thermophilus ST 1275 (capsular-ropy) or
Streptococcus thermophilus ST 285 (capsular) at 30, 37 or 42 °C prior to the cold
storage. (Legend presented as i.e. ST1275, 30 indicates the strain and fermentation
temperature).

79
Due to significantly (P<0.05) greater acidification rate at 42 °C (6.4 pH mU/min),
the ropy strain reached pH of 4.5 in 304.5 min, which was significantly (P<0.05)
faster than any other strain/temperature combination (Table 4.1). On the contrary,
the longest fermentation time was observed for ST 285 during fermentation at 30 oC with the lowest acidification of 3 pH mU/min. Interestingly, the similar
acidification rate by the same strain was obtained at 42 oC, indicating a mesophilic
nature of this culture which was in contrast to ST 1275 which preferred the higher
fermentation temperature.
The initial colony counts of both strains during fermented milk storage were
clearly strain- and the fermentation temperature dependent (P<0.05, Figure 4.3).
At the end of the fermentation, the fermented milk batches produced with the
capsular-ropy strain fermented at 30 and 42 oC contained significantly (P<0.05)
higher number of cells than that fermented at 37 oC. Furthermore, the number of
viable cell of the capsular-ropy strain was also significantly (P<0.05) higher in
comparison to that of the capsular strain regardless the fermentation temperature.
Interestingly during cold storage, both strains cultivated at 37 oC experienced an
increase in number of viable cells, which was greater (P<0.05) for the capsular
strain. The number of the viable cells also decreased slightly (P>0.05) towards the
end of the storage. Thes cell growth and EPS production profile of the two strains
in fermented milk was in connection with their pattern in M17 medium as
reported in Chapter 3.
The titrable acidity expressed as the amount of lactic acid was also strongly
(P<0.05) strain and storage time dependent and not significantly (P>0.05) affected
by the fermentation temperature. Similar to the growth, titrable acidity in some
samples of ropy strain fermented milk tended to be significantly (P<0.05) higher
in some samples than in those of the capsular strain (Table 4.1). During the
storage, ST 1275 stopped producing acid after the day 7, while ST 285 continued
producing acid until end of 30 days, which resulted in subsequent increase in
titrable acidity. Similarly, other studies (Haque et al., 2001, Hassan et al., 1995a,
Hassan et al., 2001b) observed that ropy strains grew faster than capsular strains
during the fermentation of milk, although the exceptions were noted

80
0
2
4
6
8
10
0 5 10 15 20 25 30 35
Time, day
Via
ble
Cel
l Cou
nt, l
og C
FU/m
l
0
0.2
0.4
0.6
0.8
1
EPS
Con
cent
ratio
n, g
EPS
/kg
ferm
ente
d m
ilk
CFU,30 CFU,37 CFU,42EPS,30 EPS,37 EPS,42
A
0
2
4
6
8
10
0 5 10 15 20 25 30 35
Time, day
Via
ble
Cel
l Cou
nt, l
og C
FU/m
l
0
0.2
0.4
0.6
0.8
1
EPS
Con
cent
ratio
n, g
EPS
/kg
ferm
ente
dm
ilk
CFU,30 CFU,37 CFU,42EPS,30 EPS,37 EPS,42
B
Figure 0.2 The viable cell counts and EPS concentrations in fermented milk batches fermented by Streptococcus thermophilus ST 1275 (A) or ST 285 (B) at 30, 37 or 42 °C and stored for 30 days at 4 °C. (The error bars indicate the SEM of 0.24 cfu/mL and 0.05 cfu/mL for the cell count and EPS concentration, respectively, n≥4; legend presented as i.e. CFU,30 indicates the measured characteristic and fermentation temperature).

81
Table 4.1 The fermentation time, acidification rate, titratable acidity, syneresis, hysteresis loop area, elastic modulus and loss tangents of fermented milk batches incubated by Streptococcus thermophilus ST1275 or ST285 at 30, 37 or 42 °C and stored for 30 days at 4 °C

82
(Hassan et al., 2001b). The slow growth and acidification rate of capsular strains
may be attributed to greater energy expenditure on the capsule production or
inhibition of metabolic activity due to reduced permeability of capsular material
on cell surface (Hassan et al., 1995a). The ability of S. thermophilus to produce
basic metabolites from urea at low temperatures may also contribute to the slow
decrease of pH in addition to slow metabolic performance (Tinson et al., 1982).
Both strains showed similar tendency for the EPS production, which was
greatly (P<0.05) affected by the fermentation temperature (Figure 4.3). The
maximum quantity of the EPS produced by both strains differed slightly (P>
0.05), with ST 1275 producing 860+47.5 mg EPS/kg fermented milk at 42 °C as
opposed to ST 285 which generated 769+47.5 mg EPS/kg fermented milk at 37
°C. More importantly, the EPS concentration in all batches declined substantially
(P<0.05) during storage, especially in the first week. Despite different initial EPS
concentrations, all yoghurt batches with the exception of one produced with ST
285 at 42 °C, showed no statistical difference (P>0.05) in the final EPS
concentration at the end of the storage.
Relatively high fermentation temperature of around 40 °C supported the cell
growth and EPS production of thermophilic lactic acid bacteria (Deegest et al.,
2002, Petry et al., 2000). Apparently, the EPS production in our study was
associated with the culture growth, since both strains produced the maximum EPS
at the optimum growth temperatures (Figure 4.3). A significant (P<0.05)
reduction of the EPS concentration in all batches during first weeks of storage
may indicate the activity of enzymes capable of degrading the EPS (Deegest et al.,
2002). This mechanism was likely activated due to energy requirements for the
cellular maintenance since the EPS may serve as an energy storage in the presence
of an excess of nutrients, which may be used later in the cell metabolism
(Tolstoguzov, 2003).
The extent of syneresis during the cold storage was also significantly
(P<0.05) affected by the strain selection, fermentation temperature and time. For
both strains, the fermentation at 42 °C resulted in products with greater (P<0.05)
syneresis than those at 30 °C. Prolonged storage affected the extent of syneresis
greatly (P<0.05) with a general tendency towards reduction, although the

83
exceptions might be noticed. This result was somewhat similar to a previous
report where the use of a ‘more-ropy’ strain resulted in less syneresis (Folkenberg
et al., 2005) as occurred with ST 1275. On the other hand, the ‘less-ropy’ strain
produced the EPS, which gave greater syneresis, as in the case of the ST 285
yoghurt. Furthermore, higher fermentation temperature may also lead to greater
syneresis (Lee and Lucey, 2004b) due to formation of large pores (Lucey et al.,
2003, Ruas-Madiedo and Zoon, 2003). In general, our results showed no apparent
effect of EPS concentration on the extent of syneresis in fermented milk batches.
4.3.2 Rheological properties
The storage modulus (G’) of the fermented milk batches was significantly
(P<0.05) affected by the storage time, while strain and fermentation temperature
had no apparent effect (P>0.05). Similarly, the more solid-like character was also
shown by greater tan δ which was affected by storage time but not affected by the
strain or the fermentation temperature (P>0.05). G' increased towards the end of
storage (Table 4.1, Figure 4.4), although the difference was rather slight (P>0.05)
among fermented milk batches. The highest G' (1040.98 Pa) was obtained for the
fermented milk made by the capsular strain at 42 °C on the day-30 of the storage.
On the other hand, the lowest elastic modulus of 23.8 Pa was determined for the
fermented milk containing capsular-ropy EPS incubated at 30 °C at the beginning
of the storage. In general, the milk fermented with ST 285 had slightly (P>0.05)
more elastic, solid character as shown by greater storage modulus than that of ST
1275 (Table 4.1, Figure 4.4). For both strains, the low fermentation temperature
(30 oC) resulted in the fermented milk batches with low storage modulus and vice
versa.
Low G' of the ropy yoghurt was observed earlier (Hassan et al., 1996a, Hess
et al., 1997), while the yoghurt prepared with the addition of a capsular culture
had higher elastic properties (Guzel-Seydim et al., 2005). The tendency of yoghurt
gel to become more solid in the presence of the capsular EPS than with the ropy
EPS may be influenced by a higher degree of cross-linking in capsular EPS
(Tolstoguzov, 2003). Concomitant increase of G’ with the increase of the

84
10
100
1000
10000
0.01 0.1 1 10 100
Frequency, Hz
G', P
a
30,d-1 37,d-1 42,d-1 30,d-7 37,d-7 42,d-7 30,d-30 37,d-30 42,d-30
A
10
100
1000
10000
0.01 0.1 1 10 100
Frequency, Hz
G', P
a
30,d-1 37,d-1 42,d-1 30,d-7 37,d-7 42,d-7 30,d-30 37,d-30 42,d-30
B
Figure 0.3 Storage modulus (G’) of yoghurt batches as a function of oscillatory frequency. Yoghurt samples were produced by Streptococcus thermophilus ST 1275 (A) or ST 285 (B) by fermentation at 30, 37 or 42 °C and stored for 30 days at 4 °C. Samples were taken at day 1 (○, □, ◊} for 30, 37 and 42 °C, respectively), day 7 (+, x, * for 30, 37 and 42 °C, respectively), and day 30 (●, ■, ♦ for 30, 37 and 42 °C, respectively), of storage.
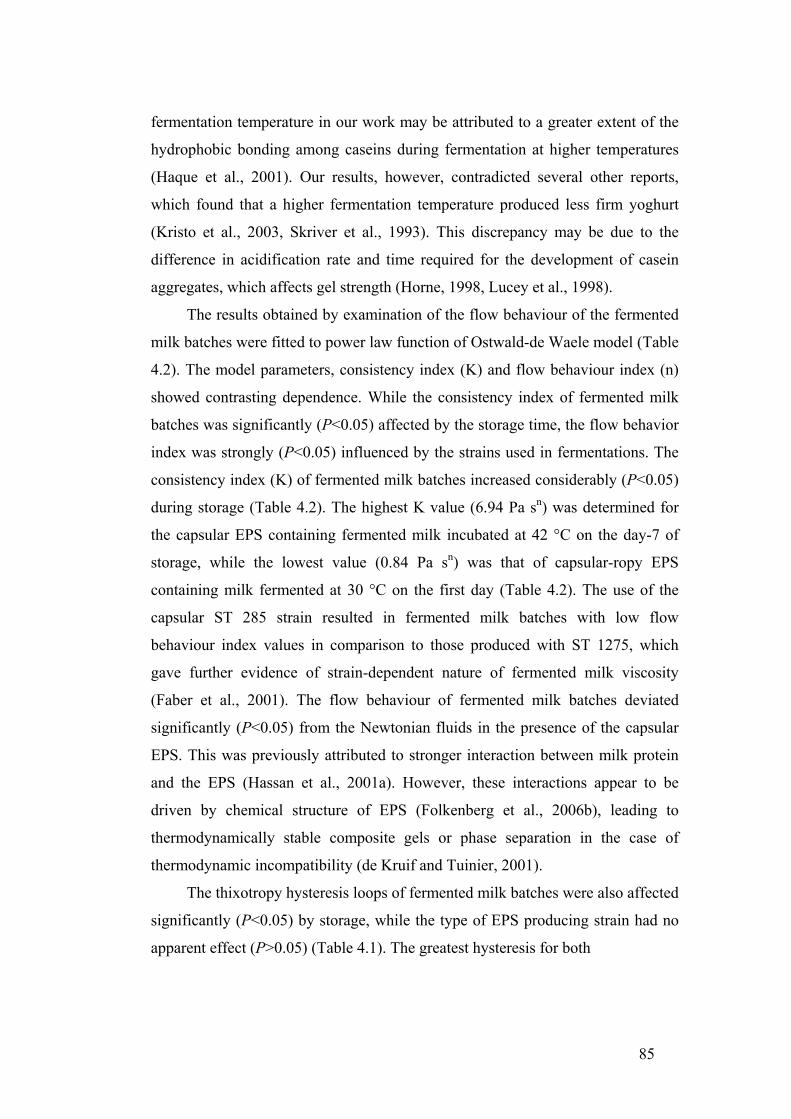
85
fermentation temperature in our work may be attributed to a greater extent of the
hydrophobic bonding among caseins during fermentation at higher temperatures
(Haque et al., 2001). Our results, however, contradicted several other reports,
which found that a higher fermentation temperature produced less firm yoghurt
(Kristo et al., 2003, Skriver et al., 1993). This discrepancy may be due to the
difference in acidification rate and time required for the development of casein
aggregates, which affects gel strength (Horne, 1998, Lucey et al., 1998).
The results obtained by examination of the flow behaviour of the fermented
milk batches were fitted to power law function of Ostwald-de Waele model (Table
4.2). The model parameters, consistency index (K) and flow behaviour index (n)
showed contrasting dependence. While the consistency index of fermented milk
batches was significantly (P<0.05) affected by the storage time, the flow behavior
index was strongly (P<0.05) influenced by the strains used in fermentations. The
consistency index (K) of fermented milk batches increased considerably (P<0.05)
during storage (Table 4.2). The highest K value (6.94 Pa sn) was determined for
the capsular EPS containing fermented milk incubated at 42 °C on the day-7 of
storage, while the lowest value (0.84 Pa sn) was that of capsular-ropy EPS
containing milk fermented at 30 °C on the first day (Table 4.2). The use of the
capsular ST 285 strain resulted in fermented milk batches with low flow
behaviour index values in comparison to those produced with ST 1275, which
gave further evidence of strain-dependent nature of fermented milk viscosity
(Faber et al., 2001). The flow behaviour of fermented milk batches deviated
significantly (P<0.05) from the Newtonian fluids in the presence of the capsular
EPS. This was previously attributed to stronger interaction between milk protein
and the EPS (Hassan et al., 2001a). However, these interactions appear to be
driven by chemical structure of EPS (Folkenberg et al., 2006b), leading to
thermodynamically stable composite gels or phase separation in the case of
thermodynamic incompatibility (de Kruif and Tuinier, 2001).
The thixotropy hysteresis loops of fermented milk batches were also affected
significantly (P<0.05) by storage, while the type of EPS producing strain had no
apparent effect (P>0.05) (Table 4.1). The greatest hysteresis for both

86
Table 4.2 Consistency (K) and flow behaviour (n) index during cold storage of
fermented milk batches produced with Streptococcus thermophilus ST 1275 or ST
285 by fermentation at 30, 37 or 42 °C and stored at 4 °C for 30 days.
Culture Temperature, (oC)
Storage time, (day)
K*, (Pa sn)
n*, - R2 **
ST 1275 30 1 0.85aA 0.67 aA 0.9215 7 0.97aA 0.69 aA 0.9805 30 1.56aA 0.61 aA 0.9547 37 1 2.94aA 0.53aB 0.9023 7 3.09aA 0.53 aB 0.979 30 5.50bB 0.49 bB 0.9586 42 1 2.35aA 0.55 aB 0.9609 7 3.21aA 0.49 aB 0.979 30 3.12aA 0.51 aB 0.9439 ST 285 30 1 2.06aA 0.41 aA 0.9714 7 3.40aA 0.23 aA 0.9562 30 2.87aA 0.40 aA 0.9654 37 1 3.78aA 0.38 aA 0.9644 7 3.45aA 0.41 aA 0.9588 30 6.30bB 0.28bB 0.9909 42 1 3.05aA 0.40abA 0.9693 7 6.94bB 0.34 aA 0.9872 30 3.22aA 0.45bA 0.9464 SEM*** 0.76 0.03
* Small letter superscripts in a column denote significant difference (P<0.05) among samples fermented at the same temperature for a particular strain. Capital letter superscripts in a column indicate significant difference (P<0.05) among samples on a same day of storage for a particular strain. **Coefficient of regression of power law equation, n≥4; ***SEM - pooled standard error of the mean, P<0.05.

87
0
10
20
30
40
0 20 40 60 80 100
Shear rate, 1/s
Shea
r stre
ss, P
a
A
37oC
42oC
30oC
0
10
20
30
40
0 20 40 60 80 100
Shear rate, 1/s
Shea
r stre
ss, P
a
B37oC
42oC
30oC
Figure 0.4 The thixotropy loop of fermented milk batches prepared by
Streptococcus thermophilus ST 1275 at 30, 37 or 42 °C and stored for 1 day (A)
or 30 days (B) at 4 °C.

88
strains was observed for batches prepared at 37 °C at the end of storage. The
hysteresis loop, that is frequently noticed during the shear rate sweep of
viscoelastic materials, may be assumed as the difference between energies
required for the structural breakdown and rebuilding (Gambus et al., 2004). In our
study, all fermented milk batches at the end of storage tended to have better
structural reversibility (greater hysteresis loop area) from those at the beginning.
The thixotropy of fermented milk with capsular-ropy EPS is illustratively shown
in Figure 4.5. Although not statistically significant (P>0.05), the yoghurt
produced with capsular strain followed similar pattern, but had a smaller
hysteresis area.
It appears that the rheological behaviour and syneresis of fermented milk
containing different type of EPS have some connection with the behaviour of EPS
dispersion as reported in Chapter 3. Some differences between the two EPS were
their zero-shear ηo and relaxation time τ, where they reflected a less mobile
molecules of capsular-ropy EPS possibly due to higher water-binding capacity or
more extensive molecular enlargement (Ravi and Bhattacharya, 2004), as
compared to capsular EPS. The similar characteristics were shown in fermented
milk gel, where that of fermented milk made using capsular-ropy EPS producer
exhibited gel with less syneresis, more flexible, and less susceptible to break-
down. Although the milk gel mainly consists of casein and bacterial
exopolysaccharides and their interaction determines the texture, the rheological
and physicochemical behaviour of EPS seems to give important effect. Prolonged
cold storage gave substantial changes in syneresis and textural properties;
however the difference between fermented milk made by each of the EPS
producer remained. This may again highlighted the essential role of EPS type on
the texture of fermented milk, which did not diminish by the effect of structural
rearrangement (de Kruif and Tuinier, 2001, Hassan et al., 2003) during storage.
The statistical analysis revealed a weak correlation between the EPS
concentration and selected rheological and physical parameters. In both capsular
and capsular-ropy EPS fermented milk, the EPS amount was inversely correlated
to G’ (r = -0.5026, and -0.5597 for capsular-ropy- and capsular fermented milk ,
respectively), hysteresis loop area (r = -0.3813 for capsular-ropy- and -0.4399 for

89
capsular fermented milk), and consistency index (r = -0.3493 and -0.2529 for
ropy- and capsular fermented milk, respectively), but positively related to the
extent of syneresis (r = 0.3617 for ropy- and 0.3480 for capsular fermented milk).
The amount of EPS in yoghurt did not have a major impact on selected
rheological characteristics confirming findings of several other reports (Bouzar et
al., 1997, Folkenberg et al., 2006b, Marshall and Rawson, 1999, Petry et al.,
2000b, Skriver et al., 1993). Noteworthy, greater EPS concentration may lead to
phase separation due to depletion effect (de Kruif and Tuinier, 2001) and
enhanced syneresis. Also, a higher amount of EPS at the beginning of storage in
our study may have hindered casein-casein interactions leading to a protein
network with lower ability to retain serum (Hassan et al., 1996b). Conversely,
reduced concentration of EPS at the end of storage resulted in a more
thermodynamically stable system (de Kruif and Tuinier, 2001) with a consequent
decline in the degree of syneresis due to better water-holding ability (Hassan et
al., 2003b).
4.4 Conclusions
The fermented milk made with a capsular-ropy or capsular strain of S.
thermophilus at different fermentation temperatures showed different rheological
and physical properties at the end of fermentation and during cold storage. The
duration of the storage of fermented milk had a more pronounced effect on the
EPS concentration, parameters of viscoelastic and flow behaviour, as well as
syneresis than the type of culture or the fermentation temperature. Both cultures
produced appreciable amounts of the EPS at higher temperature and their
production appeared to be related to the culture growth. The weak correlation
between the EPS concentration and rheological characteristics of fermented milk
was observed. The fermented milk prepared by capsular EPS producing strain had
more solid characteristics but greater syneresis in comparison to that prepared by
capsular-ropy strain. Different behaviour of two cultures in acidification and
rheological properties of fermented milk may need to be considered during
processing to control the textural quality of the final product. Although the ropy

90
strain in this work appears to be more suitable for fermented milk production, the
relation between the observed textural characteristics and sensory perception
needs yet to be assessed.
Result of this study will be used in the next experiment on the making of
calcium-fortified fermented milk prepared by the two strains. Calcium is an
important mineral in the diet which is commonly added into several popular
products in order to enhance the intake of this mineral. However, since calcium
carries positive charges, the presence of calcium in a food system containing
charged components in the three-dimensional network such as in fermented milk
may influence the textural properties. Theoretically, positive charges of calcium
may weaken the fermented milk gel. As uncharged or weakly charged EPS were
also present in the system, they may affect the gel texture in positive or negative
way. Therefore, it is important to investigate the effect of EPS type on the textural
properties of calcium-fortified fermented milk.

91
5 Rheological Properties of Fermented Milk
Produced by a Single Exopolysaccharide
Producing Streptococcus thermophilus
Strain in the Presence of Added Calcium
and Sucrose
5.1 Introduction
In the previous chapter, it was revealed that final texture of fermented gel
was affected by the type of strain. However the difference was diminished to a
certain extent with prolonged storage due to seemingly extensive structural
rearrangement and likely EPS degradation. The use of capsular-ropy EPS
producing strain in milk fermentation led to less firm, more shear-resistant gel,
and lower syneresis. In contrast, milk fermented with capsular EPS producing
strain resulted in more brittle gel and higher degree of serum expulsion. In this
chapter, the effects of calcium and sucrose additions on the formation of acid gels
in the presence of two different types of EPS were examined. Calcium
fortification was likely to disrupt the fermented gel, while sucrose or EPS may
diminish this effect. These effects have not been assessed previously therefore
well defined experimental design would be required to address many confounding
factors.
These days, yoghurt is the second most favorite snack among children in
the US (Sloan 2006). An important characteristic of its attractive perception is its
textural properties such as viscosity (Marshall & Rawson 1999), smoothness and
thickness (Jaworska et al. 2005) and structural resistance to stress (Skriver et al.
1993). Yoghurt cultures commonly used are strains of Lactobacillus delbrueckii
subsp. bulgaricus and Streptococcus thermophilus. L. bulgaricus may impart
specific sensory defects due to ‘post-acidification’ (Oliveira et al. 2001). Legal

92
specifications in many countries require use of a mixed yoghurt culture, although
yoghurt may also be produced by a single strain culture of S. thermophilus as a
main acid producer and in conjunction with probiotics such in case of ABT
culture. This particular strain also gives a desirable body to yoghurt as a result of
its production of exopolysaccharides (EPS) (Hassan et al. 1996). The presence of
EPS in fermented products influences several important sensory properties,
including mouth thickness, shininess, clean cut, ropiness and creaminess
Dairy products have been considered a good medium for calcium
fortification (Singh & Muthukumarappan 2008) mainly due to presence of various
bioactive compounds that improve calcium absorption in the intestine primarily
by increasing calcium solubility (Kitts & Kwong 2004). Current market trends
show that the milk consumption is declining in the industrialized countries
(Perales et al., 2006) leading to inadequate intake of calcium as well as increased
incidence of hypovitaminosis D and related diseases (Calvo et al. 2004) in some
populations. The addition of calcium to dairy products to improve nutrition may
also strengthen several structural characteristics; however, this fortification may
have detrimental textural consequences when its concentration exceeds a certain
level (Matia-Merino et al. 2004).
On the other hand, sucrose may improve texture and reduce syneresis of acid
induced casein gels (Schorsch et al. 2002). Although there is a need for greater
understanding of the effects of sucrose addition on the textural properties of acid
induced gels, sucrose is more frequently incorporated in fermented milk products
including yoghurt for taste improvement. In milk beverages supplemented with
hydrocolloids, sucrose may increase or decrease viscosity, depending on the
degree of hydration of the hydrocolloid (Yanes et al. 2002). It alleviates syneresis
by reducing incompatibility between milk proteins and polysaccharides (Schorsch
et al. 1999b, Choi et al. 2004) and affects dominance of the hydrophilic over
hydrophobic sites (Belyakova et al. 2003). Sucrose addition at a certain
concentration enhanced the elastic properties of a GDL-acidified gel (Belyakova
et al. 2003). Since the addition of sucrose may be beneficial in restoring the
structural weakening of calcium-supplemented yoghurt, we aimed to assess the
effects of calcium and sucrose additions to fermented milk produced solely by

93
single, EPS producing S. thermophilus strains. Additionally, the role of glucono-
δ-lactone (GDL, an artificial acidifier) (Lucey et al. 1998) in modulating of the
rheological properties of an acid set gel structure was also examined.
5.2 Materials and methods
5.2.1 Materials
Batches of fermented milk were prepared from a yoghurt base (see below)
and acidified by addition of one of two EPS-producing strains of S. thermophilus
ASCC1275 (ST1275) and S. thermophilus ASCC285 (ST285) or by GDL.
ST1275 produces mixed, capsular and ropy EPS, and ST285 produces capsular
EPS (Zisu & Shah 2002, 2003, 2005). Both strains were kindly provided by the
Australian Starter Culture Research Center (ASCRC, Werribee, Victoria,
Australia). Frozen (at –80 oC) glycerol stocks of the cultures were activated by
incubating them twice in 30 mL sterile 14 g/100 g skim milk at 37 oC for 24
hours, before using them in manufacturing.
5.2.2 Experimental design and statistical analysis
Experiments were arranged in a randomized full factorial block design
with three factors: types of acidulant, calcium and sucrose concentrations. This
block structure was replicated twice with at least two sub-samplings. Results were
analyzed as a split plot design using a General Linear Model procedure (SAS,
1996) with acidulants as the main plot and calcium and sucrose as subplot. This
analysis can be described by following equation:
Xijk = μ + αi + βj + (αβ)ij + γk + δl+ (αγ)ik + (αδ)jl + (γδ)kl + εijkl
Where X corresponds to the actual value and μ the expected value, ε is the error
term and α, β, γ and δ denote acidulants, replications, calcium and sucrose
supplementation, respectively. Terms in brackets present corresponding

94
interactions. Correlational analysis was performed whenever necessary. The level
of significance was preset at P = 0.05.
5.2.3 Preparation of fermented milk batches
Reconstituted skim milk (14 g/100 g) was prepared by dissolving skim
milk powder (Murray Goulburn Co-operative Co. Ltd., Brunswick, VIC.,
Australia) in Milli-Q® water, followed by heat treatment at 90 °C for 5 minutes in
a water bath, and cooling to 42 oC. This base was then inoculated with 1 mL/100
mL of each strain of S. thermophilus or mixed with 2 g/100 g of GDL (Sigma-
Aldrich, Inc., St. Louis, MO, USA). The appropriate amounts of 0.1 M CaCl2
solution and sucrose were then added resulting in calcium and sucrose
concentrations of 0, 3, 6 or 9 and 0, 15, 30 or 45 mM, respectively. Selected
maximum concentration of added calcium would increase the total calcium
concentration in the product by almost 30 g/100 g (Singh & Muthukumarappan
2008). The whole mixture was mixed thoroughly using a magnetic stirrer for ten
minutes. After addition of culture or GDL, the milk was poured aseptically into
sterile 100 mL plastic containers, and placed in an incubator at 42 °C. The process
was terminated when the pH reached 4.5 by transfer into a cold room (4 °C), and
kept overnight. The fermentation time depended on the type of acidifier, with the
GDL lowering pH to 4.5 within 6 hours. While the rate of acid production from
the GDL dissociation was always greater than those produced by the cultures, the
final pH of all batches was 4.5. The capsular-ropy and capsular EPS starter culture
attained pH 4.5 after 8 (±0.2) and 12 (±0.3) hours, respectively. Following
overnight storage, the pH of all batches was checked prior to all rheological
measurements and was found to remain stable.
5.2.4 Bacterial growth and EPS concentration in fermented milk
The enumeration of S. thermophilus strains followed established
procedures (Donkor et al. 2007). Briefly, approximately 1 mL of homogenized
fermented milk sample was resuspended in 0.1 g/100 g peptone water and serially

95
diluted to required levels. Such diluted samples were then plated on M17 agar
(Merck Pty Ltd., Kilsyth, VIC, Australia) and incubated aerobically at 37 °C for
48 h. The results obtained as means of at least four independent observations were
expressed as a log of colony forming units per mL of fermented milk.
The titratable acidity of yoghurt was assessed using the AOAC titration
method with 0.1 M NaOH (AOAC 1999). Approximately 10 g of fermented milk
was diluted with approximately same volume of distilled water before titration.
Titratable acidity was expressed as percentage of lactic acid.
The concentration of crude EPS was determined in fermented samples
following established methodology (Rimada & Abraham 2003) with some
modifications as reported in Chapter 4. Even capsule producing strains may
produce EPS that can be loosely attached to the cell wall (Wicken et al. 1983),
thus the EPS portion isolated from the medium would be of a greater interest for
the study of texture (Folkenberg et al. 2006b). The size of samples used for EPS
analysis ranged between 30 and 100 g (Folkenberg et al. 2006b). Protein
precipitation was carried out by addition of 80 g/100 g tricholoroacetic acid
(TCA), while EPS was precipitated using chilled ethanol (Rimada & Abraham
2003). First, the sample was centrifuged (Model J2-HS, Beckman, Fullerton,
California, USA) at 11000 × g at 4 °C for 4 min. The supernatant was collected,
combined with two volumes of chilled ethanol and stored at 4 °C overnight. The
precipitate was collected by centrifugation at 2000 × g, 4 °C for 15 min (model
RT7, Sorvall, DuPont, Newtown, Connecticut, USA). About 10 mL of distilled
water was then added to the precipitate and mixed before addition of 250 μL 80
g/100 g TCA, and then stored overnight at 4 °C before being centrifuged at 4000
× g and 4 °C for 15 min (Sorvall). The precipitate was discarded. This final
procedure was repeated twice. To the remaining supernatant was added 10 mL
chilled ethanol, which was then stored overnight and then centrifuged at 4000 × g
and 4 °C for 15 minutes. The precipitate was collected, dried at 55 °C and
weighed. The results were expressed as the weight (mg) of crude EPS per kg of
yoghurt.
Syneresis is a common defect of yoghurt (IDF 1992). The extent of
syneresis during cold storage of all batches was determined by a centrifugation

96
method (Jaros et al. 2002) with slight modification. Batches were prepared by in
situ fermentation as described above in 50 mL centrifuge tubes (Falcon, Blue
Max, Becton Dickinson and Company, Franklin Lakes, N.J., USA) and
centrifuged (Sorvall) at 70 × g at 8 oC for 10 min. The weight of the drained liquid
was recorded and related to the initial weight of yoghurt with the degree of
syneresis expressed as a percentage.
5.2.5 Rheological and physical properties of fermented milk
The rheological properties of all acidified batches were evaluated by
controlled stress rheometry and small-deformation oscillatory shear rheology
using a Haake RheoStress rheometer (RS 50, Haake Rheometer, Karlsruhe,
Germany) fitted with a cone-and-plate measuring system (35 mm/2o angle). The
rheometer was calibrated every 60 days by motor adjustment and two oils with different
viscosities as per manufacturer's instructions. The gap width was preset as per the
hardware specifications (MCR301, Anton Paar). Prior to analysis performed
approximately 15 h post-fermentation, all samples were equilibrated to 20+1°C.
The pH of all samples was 4.40 ± 0.05. About 10 g sample was loaded into the
bottom plate with spoon. Any excess was then removed using spoon. Dynamic
oscillatory measurements were carried out over 0.01 to 10 Hz to determine storage
(G’) and loss modulus (G"), and the ratio between G”/G’ (tan δ) was calculated.
Strain was maintained constant at 0.5% and was inferred from the linear
viscoelastic region determined by amplitude sweep at a constant frequency (1 Hz).
The data were analyzed using RheoWin software package (v 2.94).
Textural properties of fermented milk are often assessed on samples
acidified with GDL, at a rate controlled by its concentration and temperature
(Lucey et al. 1998). The difference in acidification rates between GDL- and
bacterial-acidified yoghurt may result in substantial discrepancy in the gel
properties and final texture (Lucey et al. 1998). To avoid this confounding in our
study, all samples, after in situ thorough mixing and loading, were pre-sheared at
a high shear rate of 500/s for 5 s, followed by 300 s rest to allow structural
rebuilding, before rheological examination. Pre-shearing at high shear rate was
97
required to erase the processing history of these semisolid materials. The newly
formed structures would clearly be dependent on the medium composition (Da
Cruz et al. 2002b). Moreover, the pre-shear eliminates residual stress or
anisotropy, which consequently, gives reproducible results. These restructured
gels in general have mechanical spectra resembling those of the set-type yoghurt
with viscoelastic moduli being 8-10 times lower (Jaros & Rohm 2003). Hysteresis
loops were generated by measuring shear stress upon increasing shear rate from
0.1 to 100/s in 300 s (upward curve in the rheogram), then holding the rate at
100/s for 5 s and finally decelerating from 100 to 0.1/s in 300 s (downward curve
in the rheogram). Data from the upward curve of the shear cycle were fitted to the
modified Ostwald-de Waele power law model (η = Kγ& n-1) where η presents
apparent viscosity (Pa.s), γ& is shear rate (1/s), while K and n are consistency
factor (Pa.sn) and flow behaviour index, respectively. The thixotropy was
determined by calculating the area between the upward and downward flow
curves of the hysteresis loop. All determinations were repeated at least three
times.
5.3 Results and discussion
5.3.1 Bacterial growth and EPS concentration in fermented milk
Acidification is an important factor governing gelation of casein. In GDL-
gels, low pH was achieved by slow release of gluconic acid, which was easily
controlled by GDL concentration. In culture fermented milk, the increased acidity
resulted from organic acid production which was dependant on microbial
metabolism. Cell growth of the capsule-forming strain was significantly (P<0.05)
slower than that of the other strain (Table 5.1). Higher sucrose concentrations
impaired cell growth significantly (P<0.05) (Table 5.1). A similar effect was
observed upon the addition of calcium, with cells experiencing better growth at
low concentrations (Table 5.1). However in many cases the capsular-ropy EPS
strain appeared unaffected by calcium concentration.

98
Table 5.1 Microbiological properties and EPS concentration of yoghurt base
fortified with sucrose (0, 15 30, 45 mM) and calcium (0, 3, 6, 9 mM) and
fermented using Streptococcus thermophilus ST 1275 and ST 285 as acidulants
at 42 °C
Type of acidulant
Sucrose,
(mM)
CaCl2,
(mM)
Titratable Acidity*, (g/100 g lactate)
Δ CFU*, (CFU/ml)
Crude EPS*, (mg/kg
fermented milk)
ST 1275
0
0 1.09aA
2.385aB
653.5bAB
3 1.24aA 2.540aB 228.8aA 6 1.28aA 2.821abC 489.8bAB 9 1.26aA 3.081bB 614.4bB
15 0 1.32aA 2.243aAB 190.4aA 3 1.47aAB 2.339aAB 358.5aA 6 1.47aAB 2.531aB 336.2aAB 9 1.46aAB 2.250aA 533.2aB
30 0 1.62aB 2.218aAB 528.8abAB 3 1.69aB 2.323aAB 459.7aA 6 1.66aB 2.322aA 250.1aA 9 1.71aB 2.159aA 525.5abB
45 0 1.43aB 2.073aA 352.7aA 3 1.53aA 2.106aA 282.7aA 6 1.44aB 2.232aA 433.9aAB 9 1.49aAB 2.113aA 249.9aA
ST 285 0 0 1.29aA 1.120aAB 231.9aA
3 1.42aA 1.975cC 409.6abA 6 1.18aA 1.570bC 347.5abA 9 1.39aA 1.101aB 516.7abA
15 0 1.43aAB 1.396bB 740.2bCB 3 1.66aAB 1.205abB 364.5aA 6 1.84aB 1.051aB 466.2aA 9 1.71aB 1.060aA 299.1aA
30 0 1.55aB 0.904aA 535.5abBC 3 1.43aA 0.807aA 220.6aA 6 1.49aB 1.358bC 285.1aA 9 1.58aAB 0.851aA 516.5abA
45 0 1.56aB 1.015bAB 480.9aB 3 1.69aB 0.981abAB 408.4aA 6 1.71aB 0.719aA 618.5aAB 9 1.54aAB 0.804abA 415.0aA SEM** 0.09 0.104 84.4 *Small letter superscripts in a column denote significant difference (P<0.05) among samples at different calcium concentrations, at a particular sucrose concentration for one type of acidulant. Capital letter superscripts in a column indicate significant difference (P<0.05) among samples at different sucrose concentrations, at a particular calcium concentration for one type of acidulant. **SEM - pooled standard error of the mean, P<0.05.

99
Capsule production requires a great deal of metabolic energy, and polysaccharides
may interfere with nutrient absorption (Hassan et al. 1995). High concentrations
of added sucrose or calcium has been reported to adversely affect cell growth,
which may be related to a high osmotic pressure in the medium (Yannick &
Laurent 2005). Differing responses between the two strains towards calcium
addition could also be caused by the differences in osmotic tolerance.
While sucrose and calcium concentrations affected cell growth, EPS
concentration was influenced only by interactions between acidulant type, sucrose
and calcium (Table 5.1). A clear trend could not be observed, and EPS
concentrations between two strains differed only slightly (P>0.05, 190 to
653+84.4, and 231 to 740+84.4 mg/kg for capsular-ropy and capsular EPS,
respectively). The EPS concentration was weakly and positively correlated to cell
growth (r=0.45).
5.3.2 Rheological and physical properties of fermented milk
In our study, elastic moduli as the measure of the solid nature of samples
among three types of acidified milk were significantly (P<0.05) affected by types
of acidulant, calcium concentration and interactions between acidulant type and
sucrose concentration (Table 5.2a,b). In general, artificially acidified milk
prepared with GDL alone had greater elastic modulus than either fermented milk
prepared under the same conditions. An obvious detrimental effect of calcium
addition was observed for all the samples (Table 2a,b), although this was
significant (P<0.05) only for milk fermented with the capsular EPS strain.
Addition of sucrose had an apparent and significant (P<0.05) effect in fermented
milk with capsular EPS present in the system. Our observations further support
suggestions that the characteristics of the bacterially produced EPS play an
important role in governing the properties of acid induced gels.
Food gels are commonly characterized by their viscoelasticity, which may
be related to their sensory perception. For example, apparent viscosity measured
at 241/s has been reported to be closely related to mouthfeel properties
(Folkenberg et al. 2006a). Our work showed that G’ of the batches fermented with
capsular-ropy strain was lower than that of other examined fermented milk

100
Table 5.2 Rheological and physical properties of yoghurt bases fortified with
sucrose (0, 15 30, 45 mM) and calcium (0, 3, 6, 9 mM) and acidified using
glucono-δ-lactone at 42 °C
Sucrose,
(mM) CaCl2 (mM)
Loop area*, (unit)
G'*, (Pa)
Consistency Index*, (Pa s)
Flow Behaviour
Index*
Syneresis*, (g/100 g)
0 0 732aA 834bA 7.61aA 0.79abA 38.54aA 3 822aA 659abA 7.91aA 0.85abA 34.41aA 6 828aA 535aA 6.00aA 0.74aA 36.47aA 9 650aA 505aA 7.08aA 0.78aA 36.18aA
15 0 747abA 806aA 6.10aA 0.76aA 33.42aA 3 824abA 687aA 6.62aA 0.77aA 35.26aA 6 975bA 1267bB 7.22aA 0.78aA 35.84aA 9 657aA 838aAB 7.61aA 0.80aA 35.99aA
30 0 846aA 879bA 10.04abA 0.83aA 35.50abA 3 1077bA 829abA 13.21bA 0.88aAB 33.73aA 6 704aA 656abA 8.05aA 0.81aA 38.61abA 9 707aA 574aA 7.70aA 0.80aA 39.07bB
45 0 819aA 861aA 8.95aA 0.80aA 35.84aA 3 792aA 803aA 9.36aA 0.80aA 36.42aA 6 768aA 636aA 8.87aA 0.83aA 38.95aA 9 647aA 719aA 6.19aA 0.76aA 36.07aA
SEM** 103.5 103.6 1.67 0.03 1.89 *Capital letter superscripts in a column indicate significant difference (P<0.05) among samples at different sucrose concentrations, at a particular calcium concentration. **SEM - pooled standard error of the mean, P<0.05. Small letter superscripts in a column denote significant difference (P<0.05) among samples at different calcium concentrations, at a particular sucrose concentration.

101
Table 5.3 Rheological and physical properties of fermented milk batches fortified with calcium (0, 3, 6, 9 mM) and fermented using Streptococcus thermophilus ST 1275 and ST 285 at 42 °C, and addition of sucrose (0, 15 30, 45 mM)
Type of Acidulant
Sucrose, (mM)
CaCl2, (mM)
Titratable Acidity*, (g/100 g lactate)
Δ CFU*, (CFU/ml)
EPS*, (mg/kg
fermented milk)
ST 1275
0
0 1.09aA 2.38aB
653.5bAB
3 1.24aA 2.54aB 228.8aA 6 1.28aA 2.82abC 489.8bAB 9 1.26aA 3.08bB 614.4bB
15 0 1.32aA 2.24aAB 190.4aA 3 1.47aAB 2.34aAB 358.5aA 6 1.47aAB 2.53aB 336.2aAB 9 1.46aAB 2.25aA 533.2aB
30 0 1.62aB 2.22aAB 528.8abAB 3 1.69aB 2.32aAB 459.7aA 6 1.66aB 2.32aA 250.1aA 9 1.71aB 2.16aA 525.5abB
45 0 1.43aB 2.07aA 352.7aA 3 1.53aA 2.11aA 282.7aA 6 1.44aB 2.23aA 433.9aAB 9 1.49aAB 2.11aA 249.9aA
ST 285 0 0 1.29aA 1.12aAB 231.9aA 3 1.42aA 1.97cC 409.6abA 6 1.18aA 1.57bC 347.5abA 9 1.39aA 1.10aB 516.7abA
15 0 1.43aAB 1.39bB 740.2bCB 3 1.66aAB 1.21abB 364.5aA 6 1.84aB 1.05aB 466.2aA 9 1.71aB 1.06aA 299.1aA
30 0 1.55aB 0.90aA 535.5abBC 3 1.43aA 0.81aA 220.6aA 6 1.49aB 1.36bC 285.1aA 9 1.58aAB 0.85aA 516.5abA
45 0 1.56aB 1.02bAB 480.9aB 3 1.69aB 0.98abAB 408.4aA 6 1.71aB 0.72aA 618.5aAB 9 1.54aAB 0.80abA 415.0aA SEM** 0.09 0.10 84.4 *Capital letter superscripts in a column indicate significant difference (P<0.05) among samples at different sucrose concentrations, at a particular calcium concentration for one type of acidulant. **SEM - pooled standard error of the mean, P<0.05. Small letter superscripts in a column denote significant difference (P<0.05) among samples at different calcium concentrations, at a particular sucrose concentration, for one type of acidulant.

102
batches (Hassan et al. 2001) and less responsive to the addition of calcium or
sucrose. However, the gel containing capsular EPS showed higher G’ which may
be due to localization of EPS within the gel pores (Folkenberg et al. 2006b).
Consistency index can be defined as the apparent viscosity at shear rate of 1/s
(Rao 1999). In our experiment, the consistency index of all samples was
influenced significantly (P<0.05) by the interaction of acidulant type and sucrose
concentration (Tables 5.2 and 5.3). Sucrose addition increased the consistency
index, especially in fermented milk containing capsular-ropy EPS. At lower
concentrations of sucrose, consistency indices of the three types of acidified milk
gels were generally similar. However, at high concentrations of sucrose, GDL
acidified milk had a lower (P<0.05) consistency index than those of the culture
ferments whose values were not significantly different (P>0.05). The flow
behaviour index shows the extent of deviation from Newtonian behaviour, with
values less than 1 indicating shear-thinning properties and susceptibility to
structural breakdown upon application of hydrodynamic force (Rao 1999). Our
experiments showed that flow behaviour was significantly (P<0.05) affected by
sucrose concentration as was its interaction with the type of acidulant. Higher
sucrose concentrations increased flow behaviour index, especially in fermented
milk containing capsular-ropy EPS (Table 5.2 and 5.3).
Shear-thinning may reflect the changes in entanglement occurring in the
structure (Macosko 1994), where shear breaks down the aggregates and further
reduces their size. In our study, all types of acidified gel showed an immediate
and large reduction of apparent viscosity upon shearing. At the beginning of
shearing before attaining the plateau, shear stress increased, likely due to
dominance of structural rebuilding over structural breakdown. The rate of the
structure rebuilding then declined at higher shear rates to reach a plateau (Da Cruz
et al. 2002a). Fermented milk produced with capsular-ropy EPS producing strain
showed higher shear stress at the plateau range in comparison to the other two
acid gels. Higher shear stress values in this range have previously been attributed
to greater interactions between EPS and caseins (Girard & Schaffer-Lequart
2007). Higher calcium concentrations increased the susceptibility to structural
breakdown caused by shear (Figure 5.1A,B, 5.2A,B, 5.3A,B). Sucrose, on the

103
other hand, apparently increased the shear stress plateau in all types of acid gels
and thus appeared to improve rigidity. The effect of sucrose on improving shear-
resistance by increasing relaxation time has been reported earlier (Macosko 1994).
Similarly, a greater shear stress magnitude before its maximum has been related to
a stronger bond between EPS and the casein network (Skriver et al., 1993).
Plots of apparent viscosity as a function of applied shear rate (Figure
5.1A,B, 5.2A,B, 5.3A,B) indicated that all types of acid gels displayed shear-
thinning and thixotropic behaviour. Higher calcium concentration increased
susceptibility to shear-induced breakdown. In contrast, addition of sucrose
increased the resistance of all gels to shearing and prolonged the time required to
attain the plateau.

104
Figure 5.1 The effect of calcium fortification on the flow behaviour of the fermented milk batches prepared using glucono-δ-lactone (GDL) as the acidifier and without (A) or with 45 mM (B) sucrose addition. (The legends depicted by the arrows present the calcium chloride (Ca) concentration of 0, 3, 6 or 9 mM). The data present the average of three independent determinations.
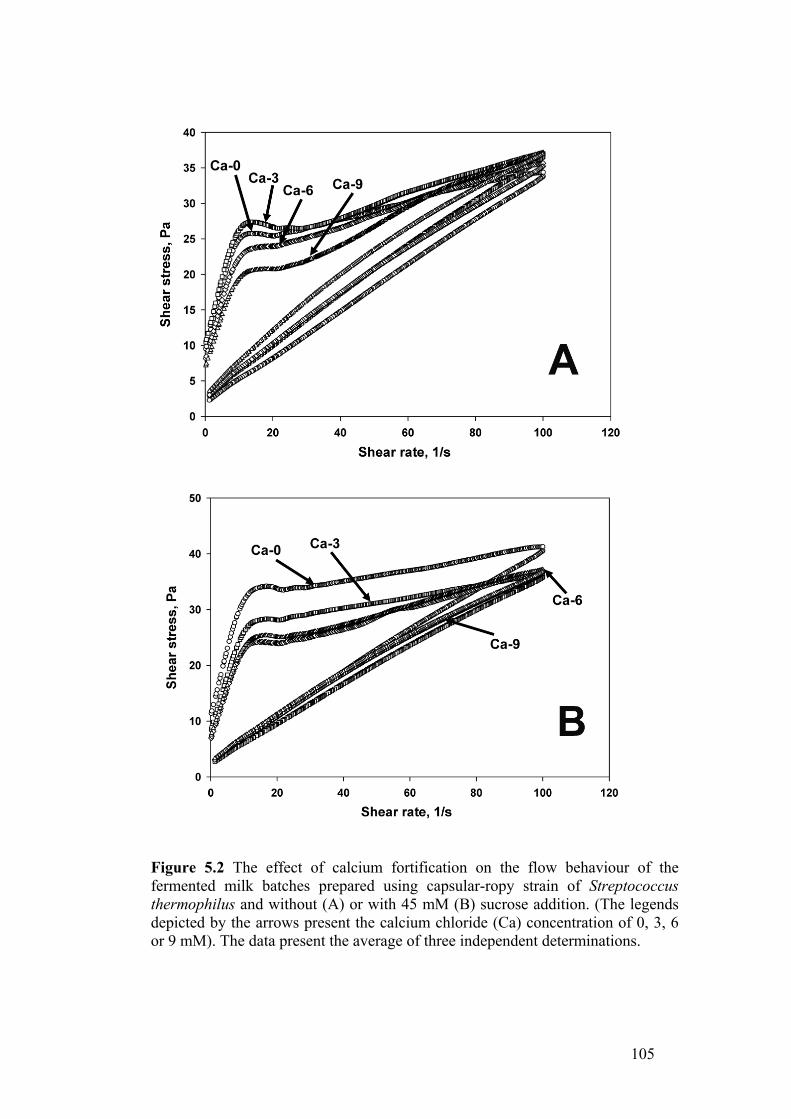
105
Figure 5.2 The effect of calcium fortification on the flow behaviour of the fermented milk batches prepared using capsular-ropy strain of Streptococcus thermophilus and without (A) or with 45 mM (B) sucrose addition. (The legends depicted by the arrows present the calcium chloride (Ca) concentration of 0, 3, 6 or 9 mM). The data present the average of three independent determinations.

106
Figure 5.3 The effect of calcium fortification on the flow behaviour of fermented milk batches prepared using capsular strain of Streptococcus thermophilus and without (A) or with 45 mM (B) sucrose addition. (The legends depicted by the arrows present the calcium chloride (Ca) concentration of 0, 3, 6 or 9 mM). The data present the average of three independent determinations.

107
Similarly, a greater shear stress magnitude before its maximum has been related to
a stronger bond between EPS and the casein network (Skriver et al. 1993).
Plots of apparent viscosity as a function of applied shear rate (Figure
5.1A,B, 5.2A,B, 5.3A,B) indicated that all types of acid gels displayed shear-
thinning and thixotropic behaviour. In contrast, addition of sucrose increased the
resistance of all gels to shearing and prolonged the time required to attain the
plateau. In our experiments, hysteresis was also significantly (P<0.05) reduced by
calcium concentration in some samples (Table 5.2a,b). Fermented milk containing
capsular-ropy EPS appeared to be more sensitive to calcium addition compared to
the other batches (Table 5.2 and 5.3) as shown by a greater reduction of the loop
area in response to increases in calcium concentration. But the loop area of the
GDL-acidified milk appeared unaffected by sucrose addition (Table 5.2 and 5.3).
Fermented milk produced with the EPS strains showed larger loop areas
than artificially acidified milk, as has been reported by others (Hassan et al. 2003,
Folkenberg et al. 2006a). Greater hysteresis indicates poorer structural rebuilding
after shear-induced breakdown an observation which has been related to
incompatibilities between caseins and EPS (Folkenberg et al. 2006a). The
addition of calcium to fermented milk base appears to have facilitated the
structural rebuilding of the acid gel (Figure 5.1, 5.2, 5.3); however, its addition
created a more brittle gel in the presence of capsular EPS as indicated by viscosity
curves reaching a plateau sooner. This type of gel was poorly resistant to
mechanical damage (Folkenberg et al. 2006b). Sucrose is believed to form a
hydrophilic layer on the casein micelle surface strengthening the association of
caseins during acidification (Schorsch et al. 1999a) and it may also improve
solubility of hydrocolloids (Schorsch et al. 1999a). The effect of sucrose we found
not to be as evident as that of calcium and probably depended on the type of EPS
present in the system.
The second maximum derivative of shear-stress against shear-rate indicates
some type of ‘yield’ before shear-induced structural breakdown occurs (Jaros et
al. 2007). The magnitude of this yield in fermented milk with capsular- ropy EPS
was greater than that of other batches (Figure 5.4A,B). The addition of calcium
reduced this maximum. Thus, the first derivative of an upward thixotropy curve

108
plotted against shear rate (Jaros et al., 2007) indicates a more shear-resistant
nature of gels containing capsular-ropy EPS than those acidified with GDL or
with the capsule-forming ST strain. Plots of apparent viscosity against shear stress
described the influence of shear stress when a material starts to flow (Figure
5.5A,B). Thus, the inflection points in the curves show the apparent yield stress
(Jaros et al., 2007). Apparent yield stress of fermented milk produced with
capsular-ropy EPS strain was higher than that of milk acidified with GDL or
fermented by the capsular strain (Figure 5.5A,B). Addition of calcium or sucrose
reduced the apparent yield stress of all batches. Fermented milk with capsular-
ropy EPS exhibited greater resistance to applied stress, which may be related to a
stronger network. Higher values of apparent yield stress have been correlated to
higher degree of cross-linking of milk protein in acidified milk (Jaros et al., 2007).
Addition of calcium to fermented milk base appeared to have a similar effect to
that of sucrose. As the apparent yield stress declined by the addition of either
sucrose or calcium, both additives may increase the susceptibility of gels to flow
during shearing.

109
Figure 5.4 The first derivative of the average upward shear stress – shear rate profiles of the fermented milk batches supplemented with 45 mM sucrose and 0 or 45 mM CaCl2 acidified using GDL (A), capsular-ropy strain (B) or capsular strain (C) of Streptococcus thermophilus.

110
calcium reduced this maximum. Thus, the first derivative of an upward thixotropy
curve plotted against shear rate (Jaros et al. 2007) indicates a more shear-resistant
nature of gels containing capsular-ropy EPS than those acidified with GDL or
with the capsule-forming ST strain.
Plots of apparent viscosity against shear stress describe the influence of
shear stress when a material starts to flow (Figure 5.5A,B). Thus, the inflection
points in the curves show the apparent yield stress (Jaros et al. 2007). Apparent
yield stress of fermented milk produced with capsular-ropy EPS strain was higher
than that of milk acidified with GDL or fermented by the capsular strain (Figure
5A,B). Addition of calcium or sucrose reduced the apparent yield stress of all
batches. Fermented milk with capsular-ropy EPS exhibited greater resistance to
applied stress, which may be related to a stronger network. Higher values of
apparent yield stress have been correlated to higher degree of cross-linking of
milk protein in acidified milk (Jaros et al. 2007). Addition of calcium to
fermented milk base appeared to have a similar effect to that of sucrose. As the
apparent yield stress declined by the addition of either sucrose or calcium, both
additives may increase the susceptibility of gels to flow during shearing.
The extent of syneresis was greatly affected (P<0.05) by the type of
acidulants and their interaction with sucrose. Generally, the GDL acidified gel had
the greatest degree of syneresis, followed by the capsular-EPS and capsular-ropy
EPS fermented milks, respectively (Table 2a,b). The effect of calcium addition on
the extent of syneresis was not apparent (P>0.05). Others have also found that
ropy EPS has a greater ability to retain serum, resulting in low syneresis
(Folkenberg et al. 2006b, Lucey et al. 1998). The positive correlation between G’
and syneresis seemed to relate to gel compaction causing whey expulsion (Haque
et al. 2001, Torre et al. 2003). The GDL and capsular EPS containing acid gels
appeared to be more compact than that containing capsular-ropy EPS. Addition of
sucrose reduced syneresis of gels, especially those produced by bacterial cultures.
As previously shown, at acidic pH, sucrose increased dehydration of GDL-
acidified milk protein, thus improving protein-protein association, but excluding
water from the network (Belyakova et al. 2003).

111
Figure 5.5 Plots of the apparent viscosity versus shear stress for fermented milk
batches prepared by direct acidification by GDL or fermentation by capsular-ropy
or capsular strains of Streptococcus thermophilus and supplemented with (A) 45
mM sucrose and 0 or 9 mM CaCl2 or (B) 9 mM CaCl2 and 0 or 45 mM sucrose.

112
Similar characteristics as EPS in dispersion was still noticeable in this
experiment, where better water binding in capsular-ropy EPS caused less
syneresis in the corresponding fermented milk. The tendency towards lower
molecular mobility and higher relaxation time of capsular-ropy EPS dispersion
also gave shear-resistant characteristics of fermented milk made using the
capsular-ropy EPS producer, with or without calcium and sucrose. The addition of
calcium seems to magnify the extent of incompatibility between EPS and casein,
causing the fermented milk with capsular-ropy EPS became even less solid and
that with capsular EPS became more brittle, as compared to fermented milk
without calcium. Thus, in calcium-fortified fermented milk, the character of EPS
type similar to that shown in dispersion was still evident.
Compared to fermented milk without addition of calcium reported in
Chapter 4, calcium-fortified fermented milk showed more compact gel as
indicated by more syneresis (around twice higher) combined with higher G’
(around ten times higher when sucrose was not present). Calcium added
fermented milk contained more lactic acid than normal fermented milk, which
may due to pH lowering effect of hydrolysed CaCl2. Shear-resistance of calcium-
fortified fermented skim milk was also lower than normal fermented skim milk.
Our results showed that in most cases, fermented milk containing the
capsular-ropy EPS produced gel characteristics different from those of milk bases
acidified with GDL or fermented by the capsule-forming strain. Although it
cannot be concluded from our work that the EPS type was responsible for the
textural difference among samples, several previous reports have emphasized the
significance of EPS in modifying the properties of gels (Folkenberg et al., 2006b,
Girard and Schaffer-Lequart, 2007). In our study, EPS concentration at the end of
fermentations was weakly correlated with all viscoelastic parameters, although
there were some inconsistencies. For example, the concentration of the capsular-
ropy EPS was negatively but weakly correlated to all viscoelastic measurements:
G’ (r = -0.1738), consistency index (r = -0.3246), and flow behaviour index (r = -
0.2218). However, the concentration of capsular EPS was positively correlated to
the same parameters, with r = 0.2313, 0.1624, 0.2374 for G’, consistency, and
flow behaviour index, respectively.

113
The correlation between the EPS concentration and syneresis was weakly
positive in samples containing capsular-ropy EPS (r = 0.3899) but negative (r = -
0.3932) when capsular EPS was present. A higher syneresis of the gel produced
with the capsular strain noted by others (Folkenberg et al., 2006a) may be
associated with a structure-weakening effect of EPS (Lucey et al., 1998a). The
observations reported in this work may provide some insight into approaches to
modify textural characteristics of different fermented milk products manufactured
from the yoghurt base using artificial acidifiers or different EPS-producing
cultures with the addition of calcium and sucrose. It may also provide an
opportunity for development of a wider range of calcium-fortified dairy based
products.
5.4 Conclusion
The textural and physical properties of a yoghurt base acidified by a single,
capsular-ropy EPS producing strain of S. thermophilus were more profoundly
affected by the addition of calcium or sucrose in comparison to that acidified with
either GDL or the capsule-forming strain. Added calcium appeared to have
detrimental and weakening effects on the properties of acid gels. On the other
hand, sucrose addition strengthened and improved certain textural parameters. But
calcium and sucrose increased thixotropy and reduced yield stress. The results
underline the importance of understanding the role of different types of EPS in the
structural formation of acid set gel containing calcium and sucrose.
Result of experiment presented in this chapter highlighted a possible
calcium fortification in fermented milk, and that the subsequent gel weakening
can be reduced by either type of EPS. Although the response of both EPS type
towards addition of calcium and sucrose was similar, the gel of fermented milk
prepared with capsular-ropy EPS producer maintained less firm, less syneresis,
and more shear-resistant characteristics compared to that fermented with capsular-
EPS producer. In the next experiment, the ability of capsular-ropy EPS producing
strain to preserve the texture of whey protein-fortified fermented milk is studied.

114
6 Physico-Chemical and Rheological
Properties of Calcium-Fortified Low-Fat
Fermented Milk Supplemented with Whey
Proteins
6.1 Introduction
It was apparent from the previous chapter that EPS produced by either the S.
themophilus strain was capable of reducing the deteriorating effect of added
calcium and sucrose. In this chapter, the potential of the EPS to attenuate the
structure of acid gels was further assessed upon addition of two different types of
whey-protein products. Whey proteins used in the experiment were whey protein
concentrate (WPC) and whey protein isolate (WPI).
Whey proteins, a by-product of cheese manufacturing, have been
extensively used to improve functional, nutritional, therapeutic, and physiological
properties of various food products. They influence textural properties of various
food products (Christiansen et al., 2006, Davis and Foegeding, 2007, Innocente et
al., 2002, Morr et al., 2003, Serdaroglu, 2006, Yildiz-Turp and Serdaroglu, 2008,
in press) mainly due to water- as well as protein- binding, emulsifying, and
gelling characteristics in various food products. Their functional properties have
been used to improve colour, firmness, fracturability and reduce the oil content in
deep-fried poultry products (Dogan et al., 2005), to prevent cook loss and improve
texture profiles in meat batters (Barbut, 2006), to enhance homogeneity of the
crystal size, coldness intensity, and creaminess in ice cream (Ruger et al., 2002),
and to create more homogenous size of the air bubbles in whipped-frozen
emulsions (Relkin and Sourdet, 2005). The nutritional and health related benefits
of whey proteins include provision of essential amino acids in infant formula,

115
biostatic and antibacterial activity (De Witt, 1998), weight control due to their
calcium content (Pilvi et al., 2006), alleviation of stress related ailments
(Schaafsma, 2006a) and enhanced satiation during weight loss program
(Schaafsma, 2006b). Therefore, the inclusion of these highly valuable dairy
ingredients into various food products would certainly improve healthy perception
of foods.
The effects of whey protein addition during yoghurt fermentation on the
yoghurt texture varies, apparently depending on factors such as whey protein type
(Vasbinder et al., 2004), degree of whey protein denaturation (Sodini et al., 2006),
point of whey protein addition such as before or after pasteurisation (Schorsch et
al., 2001) and casein to whey protein ratio (Puvanenthiran et al., 2002). The
interactions between the whey proteins in the form of native whey protein isolate
(WPI) and casein led to weakening of the acid gel structure (Patocka et al., 2006).
On the other hand, the WPC supplementation to yoghurt improved the yoghurt gel
strength (Isleten and Karagul-Yuceer, 2006, Remeuf et al., 2003) especially after
whey protein denaturation. The denaturation of whey proteins may also adversely
(Sodini et al. 2006) or positively (Isleten and Karagul-Yuceer, 2006) affect
syneresis, the expulsion of whey upon prolonged storage.
Calcium is added to milk products not only for nutritional but also for
functional purposes. Biologically active phosphopeptides as well as other
compounds in milk can improve calcium bioavailability, rendering it as effective
means for calcium fortification (Kwit and Kwong, 2004). Moreover, the calcium
fortification in milk improved solubility, dialysis, transport and uptake rate of
calcium, thus increasing its bioavalability (Perales et al., 2006), as well as
enhancing its heat stability (Singh et al., 2007). Therefore, supplementation of
both whey protein and calcium (Sanchez-Hidalgo et al., 2000) may synergistically
improve nutritional status of certain food products. Although calcium is
considered as an inhibitor of Fe and Zn absorption, the adverse effect of Ca
fortification may be alleviated by high protein content (Mendoza et al., 2004).
Adding low concentrations of CaCl2 increased strength of both WPC and WPI
heat-set gels (Lorenzen and Schrader, 2006) due to enhancement of whey protein
unfolding and stronger bonding among formed aggregates (Ju and Kilara, 1998,

116
Lorenzen and Schrader, 2006). Similarly, a gel strengthening may also be caused
by the presence of EPS. As EPS are generally ‘non-adsorbing’ polymers to the
protein network, with a weak negative charge (Tuinier et al., 2003), it may
perform a ‘depletion layer’ surrounding every particle when mixed with colloidal
protein. This would cause the protein particles to coalesce, causing more rigid
structure. The information on the combined effects of the calcium addition and
whey protein type on the textural and physico-chemical properties of yoghurt
fermented with an EPS-producing culture, is rather limited. Therefore, we aimed
with this work to assess the properties of calcium and whey supplemented yoghurt
produced with an EPS-producing strain of Streptococcus thermophilus using the
response surface methodology.
6.2 Materials and methods
6.2.1 Fermented milk cultures
Fermented milk batches were fermented by an EPS-producing strain of
Streptococcus thermophilus ASCC 1275, which produces mixed EPS (capsular
and ropy) (Zisu and Shah, 2003). The strain was obtained from the Australian
Starter Culture Research Center (ASCRC, Werribee, Victoria, Australia). Frozen
(-80 oC) glycerol stock of the culture was activated by incubating it twice in 30
mL sterile 14 g/100 g skim milk at 42 °C for 24 hours, before application in the
fermented milk manufacturing.
6.2.2 Experimental design and statistical analysis
The experimental design consisted of twelve combinations according to a
second order central composite design with two factors at five levels each, and
CaCl2, WPC or WPI concentrations as independent variables (Table 6.1). Every
combination was at least replicated. The statistical analysis of the data was carried
out using the SAS System (SAS, 1996). The full term second order polynomial

117
response surface models were fitted to each of the response variables, according to
the following equation:
Y = β0 + β1X1 + β2X2 + β11X12 + β22X2
2 + β12X1X2 + ε
Where β0, β1, …, β22 represented the estimated regression coefficients, with β0
being the constant term; β1, β2 represented the linear effects, β11, β22 the quadratic
effects; β12, β22 the interaction effects; ε was the random error; and X1, X2, were
the independent coded variables (Myers and Montgomery, 2002). A simple
correlational analysis was performed to reveal connection among parameters.
6.2.3 Preparation of fermented milk batches
Low heat-treated skim milk powder (Murray Goulburn Co-operative Co.
Ltd., Brunswick, Victoria, Australia) was used alone or in conjugation with whey
protein preparations as fermented milk mixes. A portion of skim milk solids was
replaced with appropriate amount of whey proteins. The powders were
reconstituted in Milli-Q™ water to achieve 14 g/100 g total solid content and
subsequently pasteurized at 90 °C for 5 minutes holding time in a water bath. The
appropriate amount of Ca was added prior to pasteurization in the form of CaCl2.
Fermented milk bases were then cooled to 42 °C and inoculated with 1 mL/100
mL of S. thermophilus. Proportions of skim milk solids, whey protein concentrate
(WPC 80 instantised, Wynpro, United Milk Tasmania) or whey protein isolate
(Alacen 895, Fonterra, Laverton, Victoria, Australia) and added calcium in
samples were adjusted according to the central composite design in Table 6.1.
After inoculation, the pasteurized fermented milk bases were poured aseptically
into sterile 100 mL plastic containers, which were subsequently placed in an
incubator preset at 42 °C. The process was terminated when pH reached 4.5 by

118
Table 6.1 Experimental design and levels of factors in natural and coded values
Coded factor -2 -1 0 1 2
Factors
Natural values Calcium concentration
(mM) 0 2.5 5 7.5 10
WPC or WPI concentration (g/100 g)
0 1.25 2.5 3.75 5
Factors Run Calcium
concentration (mM) WPC or WPI
concentration (g/100 g)1 2 3 4 5 6 7 8 9 10 11 12
2.5 7.5 2.5 7.5 0 10 5 5 5 5 5 5
1.25 1.25 3.75 3.75 2.5 2.5 0 5 2.5 2.5 2.5 2.5

119
immediate transfer into a cold room (4 °C). After overnight cold storage,
randomly selected samples were examined for their rheological properties. The
remaining samples were similarly assessed after 21 days.
6.2.4 Microbial and chemical properties of fermented milk
The enumeration of S. thermophilus strains followed established procedures
reported previously (Donkor et al., 2006) for fresh sample (day-0) and storage
samples (day-21). Briefly, approximately 1 g of fermented milk sample weighed
precisely was resuspended in 0.1 g/100 g peptone water and serially diluted to
required levels. Such diluted samples were then plated on M17 agar (Merck Pty
Ltd., Kilsyth, Victoria, Australia) and incubated aerobically at 42 °C for 48 h. The
results obtained as means of four independent observations were expressed as a
log of colony forming units per g of fermented milk.
The crude EPS was determined following already established methodology
with some modifications, which was reported to be highly reliable (Rimada and
Abraham, 2006). Approximately 30 g of fermented milk was first centrifuged
(Model J2-HS, Beckman, Fullerton, California, USA) at 11000 × g at 4 °C for 4
min. The supernatant was collected and combined with two volumes of chilled
ethanol and stored at 4 °C overnight. This was followed by centrifugation at 2000
× g, 4 °C for 15 min (model RT7, Sorvall, DuPont, Newtown, Connecticut, USA)
to enhance the EPS precipitation. Collected EPS-containing precipitate was then
dissolved in 10 mL of distilled water, followed by the addition of 250 μL 80 g/100
g trichloroacetic acid for precipitation of the remaining proteins. After storing the
mixture overnight at 4 °C, it was centrifuged at 700 × g, 4 °C for 15 min (Sorvall)
to collect the EPS-containing supernatant. This procedure was repeated twice,
where the final precipitate was dried at 55 °C under vacuum and then weighed and
expressed as the crude EPS. The extent of syneresis during cold storage of the
fermented milk batches was analysed by a centrifugation method previously
reported (Jaros et al., 2002b) with slight modifications. For this test, the fermented
milk batches were prepared by in situ fermentation in 50 mL centrifuge tubes
(Falcon, Blue Max, Becton Dickinson and Company, Franklin Lakes, N.J., USA).

120
Upon termination of fermentation, the tubes were stored in a cold room and
centrifuged (Sorvall) at 700 × g at 8 °C for 10 min on the following day or after
21 days of cold storage. The weight of the drained liquid was recorded and related
to the initial weight of fermented milk with the degree of syneresis expressed as a
percentage.
6.2.5 Rheological and physical properties of fermented milk
The rheological properties of the fermented milks were measured using a
controlled-stress rheometer (Physica MCR 301, Anton Paar, GmbH, Germany),
equipped with a temperature and moisture regulating hood and a cone and plate
geometry (CP50-1, 50 mm diameter, 1° angle and 0.49 mm gap). The temperature
was regulated by a Viscotherm VT 2 circulating bath and controlled with a Peltier
system (Anton Paar). The temperature during all determinations was maintained
constant at 5 °C with an accuracy of ± 0.1 °C. The data of all rheological
measurements were analyzed with the supporting software Rheoplus/32 v2.81
(Anton Paar). The rheometer was calibrated every 60 days by motor adjustment
and two oils with different viscosities as per manufacturer's instructions. The gap
width was preset as per the hardware specifications (MCR301, Anton Paar).
Prior to loading, all samples were stirred gently with a spatula to eliminate
thixotropy and different concentration (i.e. EPS) effects. About 10 g sample was
loaded into the bottom plate with spoon. Any excess was then removed using
spatula. The sample was then pre-sheared at a high shear rate of 500/s for 15 s
followed by 300 s rest to allow for structural rebuilding. The dynamic oscillatory
measurements were carried out over a range of frequencies from 0.1 to 10 Hz to
determine elastic properties (storage modulus G’) of the samples. The strain was
maintained constant at 0.5% and was inferred from the linear viscoelastic region
determined by amplitude sweep at a constant frequency (1 Hz). The hysteresis
loops were generated by measuring the shear stress upon increasing shear rate
from 0.1 to 100/s in 300 s (upward curve in the rheogram), then holding at 100/s
for 5 s and finally decelerated from 100 to 0.1/s in 300 s (downward curve in the
rheogram). The data from the upward curve of the shear cycle were also fitted to

121
Ostwald-de Waele power law model (τ = K ⋅γ n), where τ represents shear stress
(Pa), ⋅γ shear rate (1/s), while K and n are consistency factor (Pa sn) and flow
behaviour index, respectively.
The firmness of fermented milk gels was determined using a texture
analyzer (TA-XT2plus, Stable Micro System Ltd., Surrey, UK), equipped with 30
kg load cell and 20 mm aluminium cylinder probe (P/20, Stable Micro Systems).
The cross-head speed during measurements was set at 1 mm/s with the 50%
compression. Every combination was replicated twice with two sub samplings
each.
6.3 Results and discussion
6.3.1 Microbial and chemical properties
The concentration of the viable cells in all samples increased as expected
during fermentations in a similar fashion between WPC- and WPI-supplemented
fermented milk with 1.389-1.510 and 0.913-1.469 log cfu/mL, respectively.
Statistically, the cell growth was not significantly (P>0.05) affected by either
WPC or WPI concentrations (Table 6.2, 6.3). Interestingly, the calcium addition
hindered substantially (P<0.01) the culture growth in the WPI supplemented
fermented milk only (Table 6.3).

122
Table 6.2 Regression coefficients of the second-order polynomial model for
the response variables (analysis has been performed using coded units) for
WPC

123
Table 6.3 Regression coefficients of the second-order polynomial model for the
response variables (analysis has been performed using coded units) for WPI

124
In fresh fermented milk, WPC and WPI additions significantly (P<0.05)
affected the EPS production diametrically different way (Table 6.2, 6.3). Whiles
the WPC supplementation improved it, EPI addition decreased it. As the EPS
production in most cases was growth-coupled (Ruas-Madiedo et al., 2005b), the
low EPS concentration in WPI fermented milk seemed to be in accordance with
the limited cell growth. The production of EPS by a bacterial culture in a whey-
based growth medium was only possible in the presence of hydrolized WPC
(Briczinski and Roberts, 2002). In general, the estimated EPS production in the
freshly prepared WPC-fermented milk (maximum of 542 mg/kg from
combination of 0 /100 g WPC and 4.6 mM Ca) was higher than that produced in
the WPI-fermented milk (maximum of 386.8 mg/kg from combination of ~1
g/100 g WPI and ~8.8 mM Ca). Statistically, the calcium addition in both WPC
and WPI fermented milk decreased the EPS production, but was significant
(P<0.05) only in WPI fermented milk (Table 6.2, 6.3). However, the apparent
trend according to the model showed that calcium increased EPS production in
both types of the supplemented fermented milk (Figure 6.1A, 6.2A). In the WPC
fermented milk, increasing the Ca concentration improved the EPS production at
any level of WPC. Calcium potentially improved cell growth as well as EPS
production under low pH condition (Maccio et al., 2002). Interaction between
whey protein and calcium positively affected EPS production in all fresh and
storage fermented milk, but was only significant (P<0.001) for WPI fermented
milk (Table 6.2, 6.3)
The storage time reduced the amount of the EPS in both WPC (estimated
maximum of ~333 mg/kg from combination of 1.7 g/100 g WPC and 9.7 mM Ca)
and WPI yoghurt (estimated maximum of 202 mg/kg from combination of 0 g/100
g WPI and 5.2 mM Ca) (graph not shown). In this case, the decline in the EPS
concentration in the WPI fermented milk was less pronounced than that of the
WPC fermented milk. The enzymatic degradation of the EPS beyond stationary
phase was a common phenomenon observed (Deegest et al., 2002, Pham et al.,
2000). The EPS may be incorporated in the culture metabolism when most of the
nutrients in the medium were diminished (Tolstoguzov, 2003). Thus, the limited
degradation of the EPS in WPI may be in conjunction with negative cell growth

125
during storage. Trend in EPS concentration of storage WPC yoghurt was
somewhat similar to that of the fresh fermented milk, in which WPC at medium
concentrations adversely affected EPS concentration. During storage of WPI
fermented milk, this reduction in the EPS concentration occurred in the region of
high WPI-low Ca concentration.
6.3.2 Rheological and physical properties
The viscoelastic properties of fermented milk are commonly examined
using small amplitude oscillatory measurement as elastic moduli (G’) to assess its
solid-like character. In general, the estimated log G’ of the freshly prepared WPC
fermented milk was higher (maximum of ~4.3 log mPa at 3.9 g/100 g WPC and
0.91 mM CaCl2) than that of the fresh WPI fermented milk (maximum of ~3.9 log
mPa, at 1.6 g/100 g WPI and 4.2 mM calcium) (Figure 6.1A, 6.2A). As the
statistical analysis revealed, the elastic modulus of fermented milks upon the
WPC supplementation was greatly (P<0.05) increased by the WPC concentration
(Table 6.2), which was in contrast to that of WPI fermented milk (Table 6.3). This
effect in the fresh WPC fermented milk was diminished by high Ca concentration.
The increasing effect of calcium concentration on G’ of the fresh fermented milk
was only significant (P<0.01) in WPC fermented milk (Table 6.2, 6.3) especially
at its low concentration. In the WPI fermented milk, albeit statistically opposite
effect of WPI on G’, the G’ was improved with the increase in the WPI
concentration at high concentrations of Ca.

126
Figure 6.1 Typical estimated responses achieved by the response surface modelling showing the effects of the calcium chloride and whey protein concentrate additions on (A) the gel elastic modulus (G’) (B) the EPS production by Streptococcus thermophilus and (C) the extent of the syneresis of the fermented milk batches after overnight cold storage.

127
Figure 6.2 Typical estimated responses achieved by the response surface modeling showing the effects of the calcium chloride and whey protein isolate additions on (A) the gel elastic modulus (G’) (B) the EPS production by Streptoccocus thermophilus and (C) the extent of the syneresis of the fermented milk batches after overnight cold storage.

128
Native whey proteins usually disrupt the weak acid gel of yoghurt due to
their ‘inactive filler’ nature (Lucey et al., 1999). However, our model describing
WPC addition showed the opposite. Some whey protein denaturation may have
likely taken place during heating of fermented milk-bases containing WPC at 90
°C, enabling the formation of a complex between whey proteins and κ-casein,
which altered the gel stiffness (Schorsch et al., 2001). Lactic acid was reported to
contribute to the increase in the gel stiffness of β-lactoglobulin (Resch et al.,
2005), which in our study may have been observed as improvement in G’ when
WPI concentration was increased. The apparent gel strengthening upon WPC
addition may have been also caused by some other essential low molecular weight
compounds otherwise absent in WPI due to processing, since the addition of the
WPI weakened the acid gel (Schorsch et al., 2001). On the other hand, Ca
weakened the WPC gel (Lorenzen and Schrader, 2006), stabilized α-lactalbumin
against unfolding and aggregation, thus prevented its denaturation in acidic
environment (Pedersen et al., 2006). It also inhibited subsequent complexation
between whey proteins with casein, leading to weak gel structure (Schorsch et al.,
2001).
After 21 day of storage, the estimated log G’ of both WPC (maximum of 4.4
mPa, from combination of 3.5 g/100 g WPC and 0.4 mM Ca) and WPI (maximum
of 4.38 mPa, from combination of 2.1 g/100 g WPI and 2.6 mM Ca) fermented
milk were higher than those of corresponding fresh fermented milk. Statistically,
the WPC concentration substantially (P<0.001) increased G’ (Table 6.2), but the
WPI concentration had no apparent effect (P>0.05) (Table 6.3). The improvement
of G’ was more evident in WPI compared to that of WPC fermented milk. WPC
contained more calcium, fat and phospholipid than WPI (Lorenzen and Schrader,
2006), that potentially hindered protein-protein interactions during cold storage in
the acidic environment (Pedersen et al., 2006). Interaction between whey protein
and Ca was only significant (P<0.05) for fresh and storage WPI fermented milk
(Table 6.3).
Firmness of the fermented milk gels was the textural characteristic analyzed
in this work, while other parameters usually depicted by texture profile analysis
were not assessed. Similar to G’, fresh WPC fermented milk gel was harder
129
(maximum firmness of 14 g, at 2.8 g/100 g WPC and 0.04 mM calcium) than that
of WPI fermented milk (maximum firmness of 9.8 g, at 2.4 g/100 g WPI and
0.004 mM calcium). The firmness of WPC yoghurt was slightly but significantly
altered by types of mixture (Table 6.2). In WPI yoghurt, there was no apparent
(P>0.05) effect upon supplementation. The calcium addition had no effect
(P>0.05) on firmness of both fresh WPC and WPI fermented milk (Table 6.2,
6.3). In all fresh or storage fermented milk samples, there was no significant
interaction (P>0.05) of both whey protein and calcium.
After storage, unlike G’, firmness of both fermented milk changed to a lesser
extent. While estimated firmness of WPC declined (maximum of 9.8 g from
combination of 2.0 g/100 g WPC and 0.1 mM Ca), that of WPI was slightly
greater (maximum of 10.9 g resulted from combination of 3.3 g/100 g and 0.3
mM Ca) (graph not shown). The effect of both whey protein additions on gel
firmness was significant (P<0.05 and P<0.01 for WPC and WPI yoghurt,
respectively). In storage WPC fermented milk, addition of WPC improved
firmness, but after ~4 g/100 g WPC, it leveled off. Increasing calcium addition at
any WPC concentration decreased firmness. In WPI fermented milk, high values
of firmness were achieved by combination of WPI at all concentration and Ca at
low concentration (up to ~4 mM). Increasing WPI concentration improved
firmness. However, at high WPI concentration, addition of high concentration of
Ca decreased it. Although not significant (P>0.05), addition of Ca tended to
increase firmness but gradually was reduced at high (~3 g/100 g) WPI
concentration.
A close relation between G’ and firmness was noted previously (Kealy,
2006). Moreover, a firmer gel of WPC fermented milk may due to higher fat
content in WPC. However, the firmness of fermented milk may be better
correlated to a yield stress rather than to G’. Both firmness and yield stress are a
measure of force to start breaking of gel, while G’ was a measurement of gel
strength upon oscillation. Nevertheless, in our work, firmness appeared to be less
affected by storage in comparison to G’.
Consistency index K is an indicator of the material resistance to deformation
(Rao, 1999). Therefore, similar to G’ and firmness, it also indicates the strength of

130
gel, but more specifically related to shear. In our work, similar to G’ and firmness,
estimated maximum K values of fresh WPC yoghurt were greater (around ten
fold) than those of WPI fermented milk. Whey protein concentration was the only
factor significantly (P<0.001 to P<0.05 for WPC and WPI, respectively)
contributing to the increase in K for both types of fermented milk (Table 6.2, 6.3).
In WPC yoghurt, addition of WPC increased K at any Ca concentration. However,
increasing WPC concentration as Ca was continuously added gradually reduced K
values considerably to reach very low value (close to 0 mPa.sn) at highest
concentration of both Ca and WPC (graph not shown). Similarly, addition of WPI
up to ~4 g/100 g also increased K value at any level of Ca, after which K
decreased slightly in about similar extent at all Ca concentrations. The effect of
Ca was not significant (P>0.05) on either WPC or WPI fermented milk (Table
6.2, 6.3), but its decreasing effect on K of WPI fermented milk was apparent. In
WPC yoghurt, Ca addition up to ~6 mM only very slightly increased K, but
decreased it afterwards.
During storage, estimated K values of WPC fermented milk were
substantially (P<0.001) reduced around 20 times without considerable change in
trend, while those of WPI fermented milk were not altered greatly (P>0.05)
(Table 6.2, 6.3). This difference in the magnitude of reduction of K values during
storage between WPC and WPI fermented milk was somewhat similar to that of
firmness. Ca addition had no apparent influence (P>0.05). While the trend in
storage WPC did not differ from that of fresh one, Ca addition up to ~6 mM in
storage WPI fermented milk increased K, but reduced it afterwards. WPI addition
also increased K values but there was a gradual and substantial cut down at high
concentration of WPI by increasing Ca concentration. Interaction between whey
protein and Ca was only significant for fresh and storage WPC fermented milk
(P<0.01 and P<0.001, respectively).
Syneresis or the whey expulsion can result from a weak gel incapable of
retaining serum or gel compaction that leads to water expulsion from protein
network (Lucey, 2001). The degree of syneresis of the two fresh fermented milks
(Figure 6.1C, 6.2C) varied slightly, around 30-50 g/100 g and 20-40 g/100 g for
WPC and WPI fermented milk, respectively. In fresh fermented milk, addition of

131
calcium played a significant (P<0.01) role in enhancing syneresis in both WPC
and WPI fermented milk (Table 6.2, 6.3). In WPC fermented milk, addition of
either WPC or Ca induced syneresis, although the effect of WPC was lesser than
that of Ca. In the WPI fermented milk, the addition of WPI increased syneresis,
followed by a steady decline at high concentration of both WPI (~4 g/100 g) and
Ca (from ~5 mM).
After the storage, the syneresis of the WPC fermented milk was reduced
slightly (around 20-50 g/100 g), while that of the WPI fermented milk increased
(up to ~80 g/100 g), especially at high Ca concentrations. Although not
statistically significant (P>0.05), WPC intensified syneresis of storage fermented
milk at any Ca concentrations with similar trend as that of fresh fermented milk.
In the WPI fermented milk, however, increasing both WPI and Ca concentration
intensified (P<0.01) syneresis steadily. The influence of interaction between the
two factors examined was not significant (P>0.05) in all samples. Relating
syneresis to parameters of the gel strength, especially G’ and firmness, revealed
negative correlations which became more significant (r ranged from -0.483 to –
0.8816) after storage. This may indicate that syneresis in both fermented milk was
induced by gel-weakening effect, which became more intense during storage.
The correlation between parameters in this study revealed a significant
negative correlation between the EPS concentration and all parameters of the gel
strength: firmness, G’, and K in both types of supplemented fermented milk. In
most cases, the storage intensified the extent of these correlations. For example,
coefficient of correlation between firmness and EPS concentration in fresh WPC
fermented milk was –0.4370, it was then increased to –0.9263 after storage.
Similarly, in the case of G’, the coefficient was increased from –0.6059 in fresh
fermented milk to -0.8852 after storage. Moreover, there was a shift of correlation
between EPS concentration and syneresis of both fermented milk, from less
significant negative (r of –0.3512 and –0.3087 in WPC and WPI fermented milk,
respectively) in fresh fermented milk, became more significant positive (r of
0.4178 and 0.9426 in WPC and WPI fermented milks, respectively) after storage.
Probably, although EPS was able to support water holding before storage, in the
later stage as it was reduced in quantity, it contributed to the weakening structure
132
leading to the increase in syneresis, as well as reduce in firmness, G’ and K of
some samples. EPS had been considered to be capable of hindering the
development of protein-protein network (Tuinier et al., 2000).
Whey-protein and calcium added fermented milk had very runny
characteristics as indicated by very low G’, only around one tenth of normal or
calcium-fortified fermented milk as reported in Chapter 5. Moreover, the
syneresis was also doubled up. This detrimental effect of combined calcium and
whey protein added into fermented milk would suggests that this type of
fermented milk suits more as drinking rather than spoonable fermented milk.
However, it is not impossible to improve the texture by applying several
treatments such as heating of whey protein upon addition into milk mixture
(Puvanenthiran et al., 2002).
6.4 Conclusions
The supplementation of non-fat set-type EPS-containing fermented milk
with calcium and whey protein affected microbial, physical and rheological
characteristics. Data derived from small deformation measurement showed trends
better than those of large deformation method. The calcium addition tended to
weaken the structure, resulted in induced syneresis and lowered storage moduli as
well as firmness. The addition of whey protein, on the contrary, tended to
strengthen the gel structure as shown by the increase in storage moduli,
consistency index K, and firmness. The effect of whey protein addition was only
significant in WPC fermented milk. The interaction of calcium and whey proteins
substantially reduced fermented milk gel strength. Therefore, in WPC fermented
milk, low concentration of Ca and high concentration of WPC appeared to
improve textural attributes of fermented milk. On the other hand, in WPI
supplemented fermented milk, both low concentrations of Ca and whey proteins
had resulted in a development of desirable textural characteristics.

133
This chapter revealed the gel weakening effect of whey protein addition of
fermented milk fortified with calcium, whilst EPS concentration was increased.
The next chapter deals with the possibility of reducing the weakening effect of
whey protein addition on texture of fermented milk prepared by each type of EPS
producer.

134
7 Structural Properties of Fermented Milk
as Affected by Culture Type and Casein to
Whey Protein Ratio
7.1 Introduction
Previous chapter highlighted the structural disruption of fermented milk gel
as a result of the addition of whey protein in combination with calcium. In this
chapter an experiment was carried out to rectify the problem by applying heat
treatment to whey proteins prior to mixing with the milk base. The effect of whey
proteins on the texture formation would be one of the aspects studied in this
experiment.
Whey proteins have been incorporated in various food products to provide
therapeutic and functional benefits. Their high content of branched amino acids
supported the body mass building and reduced body mass loss during physical
stress (Schaafsma, 2006a), promoted gut health through protection of intestinal
cells, prevented formation of toxic nitrogenous substances by colonic microflora,
reduced bowl inflammation and enhanced antimicrobial effects (Schaafsma,
2007). Antimicrobial activities of whey proteins were effective against several
pathogens (Gill et al., 2006, Madureira et al., 2007, Yalcin, 2006), including
cariogenic species (Warner et al., 2001). Improvement of immune-system and
mood control had also been reported (Yalcin, 2006).
In addition to their physiological importance, they also posses other
functional characteristics including water holding, interface and gelling behavior
that may affect physical properties of various food systems. Whey proteins were
used as stabilizing agent in several food systems such as food dressing
(Christiansen et al., 2006, Ofstad et al., 2005), low-fat Turkish sausage (Yildiz-
Turp and Serdaroglu, 2008) and low-fat meat ball (Serdaroglu, 2006). Whey
proteins were incorporated in the development of desirable texture of gluten free

135
product such as ‘empanadas’ and pie crust (Lorenzo et al., 2008), as well as bread
(Gallagher et al., 2003). Their foaming ability was employed to replace egg white
(Davis and Foegeding, 2007), and was used in angel cake manufacturing (Morr et
al., 2003). In ice cream, a whey protein addition modified melting resistance and
stability of air bubbles (Innocente et al., 2002, Zhang and Goff, 2005) without
impairing flavour (Innocente et al., 2002).
The supplementation of whey proteins to yoghurt has been studied
extensively with varying effects on the final yoghurt texture. Native whey protein
supplementation reduced yoghurt gel strength parameters such as storage modulus
and yield stress (Guggisberg et al., 2007), viscosity and firmness (Guggisberg et
al., 2007, Oliveira et al., 2001), and created porous structure which led to higher
syneresis (Gonzalez-Martinez et al., 2002). However, when native whey proteins
were added at high concentrations after fermentation of yoghurt, storage moduli
were increased (Patocka et al., 2004). When yoghurt milk base supplemented with
whey proteins was heated before acidification, the gel strength was significantly
increased by heating time, apparently due to larger micelle size which may have
resulted from more extensive cross-linking of whey proteins and caseins (Remeuf
et al., 2003). Heating milk mixture containing added whey proteins positively
affected gel strength, likely due to denaturation of whey protein. The positive
effect of denatured whey proteins on gel strength of glucono-δ-lactone (Vasbinder
et al., 2003) as well as microbial (Puvanenthiran et al., 2002) acidified yoghurt
was emphasized. Interestingly, when whey proteins heated at high temperature
were added to milk base after homogenization, the gel strength was impaired,
which was opposite to unheated counterpart (Sodini et al., 2006). This may reflect
the complex nature of yoghurt structural development, which possibly involves
several factors and their interactions.
Heat-induced gelation of whey proteins involves at least two steps,
unfolding of protein three dimensional structure to expose reactive functional thiol
groups, and rearrangement of the unfolding state to form aggregates (van Mil and
Roefs, 1993). The unfolding rendered whey proteins to become amphiphilic with
a higher water holding capacity (Morr, 1979). At high concentrations of added
whey proteins, denaturation, as indicated by significant increase in elastic

136
modulus (G’), started earlier and may reach higher maximum values (Kavanagh et
al., 2000). Thermal treatment at neutral pH and 60 °C (Pelegrine and Gasparetto,
2005) resulted in reversible altered tertiary conformation (Iametti et al., 1996).
Irreversible denaturation was induced by heating at around 75-80 °C (Clark et al.,
2001), and was more extensive at higher temperature and low heating rate (De
Wit and Klarenbeek, 1984). Higher temperature enabled more extensive protein-
protein interaction via hydrophobic non-covalent bonds (Lorenzen and Schrader,
2006). In the presence of casein, the aggregation of whey proteins was affected by
caseins to whey proteins ratio (Beaulieu et al., 1999, Puvanenthiran et al., 2002).
In this case, high whey protein proportion increased denaturation rate (Law and
Leaver, 1999) and caused formation of large particles consisted of both micelles
covered with whey protein as well as whey protein aggregates (Beaulieu et al.,
1999).
Another factor that governs formation of the yoghurt texture is the presence
of exopolysaccharides (EPS) produced in situ by yoghurt cultures, especially
Streptococcus thermophilus strains. The EPS positively contributed to the
development of desirable yoghurt characteristics: firmness and low serum
expulsion (Folkenberg et al., 2005). In a binary system consisting of an EPS and
caseins, the incompatibility may occur leading to a depletion-type interaction (de
Kruif, 1999). In this case, higher EPS concentrations and higher molecular weight
of the EPS would result in a larger size of aggregated whey proteins and
consequently firmer texture. However, in a real yoghurt system, the interaction of
the EPS and milk proteins appears more complex. For example, the higher EPS
concentration and greater molecular weight detrimentally affected the texture of
yoghurt rendering it runny, suggesting the influence of other factors (De Vuyst et
al., 2003) such as the location of the EPS within the network (Folkenberg et al.,
2005). The effects of whey protein supplementation to EPS-containing yoghurt
have not been extensively studied, especially those which involved different EPS
types and denaturation state of whey proteins. The aim of this work was to study
the effects of incorporating different concentrations of whey protein isolate in its
native or heat-treated state on the gelation and final textural characteristics of low-

137
fat set yoghurt fermented by two types of exopolysaccharide-producing cultures
of Streptococcus thermophilus.
7.2 Materials and methods
7.2.1 Preparation of mixture
The low heat skim milk powder was obtained from Murray-Goulburn
(Victoria, Australia) containing 34-37 g protein/100 g milk which contained 82.59
g of caseins/100 g milk protein. Whey protein isolate (Alacen 895) used was
provided by Fonterra (Fonterra, Victoria, Australia) and contained 90-92 g casein
/100 g whey proteins as per manufacturer’s specification. The fermented milk
bases were prepared by reconstituting either skim milk powder (as control) or
replacing adequate amounts of skim milk powder with whey protein isolate (WPI)
to achieve 14 g/100 g total solid content. The ratio of WPI:casein was adjusted to
3:1 and 1:1, with WPI added in heat-untreated or heat treated form. The heat-
treated WPI was prepared by heating WPI 5 g/100 g reconstituted in Milli-Q®
water at 80 °C for 10 min followed by immediate cooling by immersing the
container in ice to stop heating. After cooling, the mixture was homogenized
using microfluidizer (Microfluidics™, Newton, Massachusetts, USA) at ~100
MPa. The microfluidized whey protein dispersion was then mixed with
pasteurized (65 °C, 30 min) skim milk suspension in the required ratio giving the
final total solid content of 14 g/100 g. The mixtures, including the control sample,
were then again homogenized (~100 MPa). In order to produce acid gels, an
artificial acidulant in the form of glucono-δ-lactone (GDL) (Sigma-Aldrich, Inc.,
St. Louis, MO, USA) was used at concentration of 1.3 g/100 g. Fermented milk
samples were produced by fermentation using Streptococcus thermophilus ST
1275 (capsular-ropy EPS producer) and S. thermophilus ST 285 (ropy-EPS
producer), provided by the Australian Starter Culture Research Center (ASCRC,
Werribee, Victoria, Australia). The frozen (at –80 oC) glycerol stock of the culture
was activated twice by incubating it in 30 mL sterile 14 g skim milk /100 g
mixture at 42 °C for 24 hours, before application in the fermented milk

138
manufacturing. All fermented milk samples were fermented at 42 °C and
fermentation was terminated when pH reached 4.5 by placing them in a cold (4
°C) room for 12 hours.
7.2.2 Viable cell count and EPS production
After cooling, the fermented milk samples were stirred to attain homogenous
mixture and 1 mL of it was aseptically diluted in 9 mL sterile peptone water,
followed by serial dilutions. It was then plated onto M17 agar containing lactose
(Merck Pty Ltd., Kilsyth, Victoria, Australia) and incubated at 42 °C for 48 hours
aerobically. The EPS production was determined by method previously reported
(Rimada and Abraham, 2003) with minor modifications as was used the Chapter
4, 5 and 6. Around 50 g of fermented milk was centrifuged (Model J2-HS,
Beckman, Fullerton, California, USA) at ~11,000 × g, 4 °C for 10 min and the
whey was collected. The whey solution was then mixed with 2 volumes of ethanol
and stored overnight at 4 °C. The mixture was centrifuged under conditions
reported above and the precipitate was collected and dissolved with 10-20 mL
Milli-Q® water. It was then added with 50 μL of concentrated 80 g/100 g TCA
solution for every 10 mL mixture. After overnight storage at 4 °C, the mixture
was again centrifuged and the supernatant was collected. The whole procedure
was repeated once again and the resulting supernatant was collected and dried at
55 °C under vacuum. The amount of EPS was expressed as the crude EPS per kg
of fermented milk.
7.2.3 Physical properties of fermented milk gels
The firmness of all acid gels expressed as the force required to achieve 50%
strain was determined using a texture analyzer (TA-XT2 plus, Stable Micro
Systems Ltd., Surrey, UK), equipped with a 30 kg load cell and 20 mm aluminium
cylinder probe. The cross-head speed was set at 1 mm/s and compression was set
at 50%. Every determination was at least replicated with two sub samplings each.

139
Syneresis was determined using method previously established (Jaros et al.,
2002a) with slight changes. Undisturbed fermented milk gels were developed in
falcon tubes following either the GDL acidification or fermentation protocol. The
weight of gels was noted, and then the gels were centrifuged (model RT7, Sorvall,
DuPont, Newtown, Connecticut, USA) at ~70 × g and 8 °C for 10 min. The whey
expelled from the fermented milk was decanted, weighed and related to the initial
weight of the sample. The extent of syneresis was expressed as the percentage.
The permeability of the fermented milk gels was determined following an
established method (Lee and Lucey, 2004b, Verheul and Roefs, 1998) with slight
modifications. In brief, 10 mL of a fermented milk mixture (fermented milk base
with GDL or cultures) was placed in a 50 mL falcon tube (Falcon, Blue Max,
Becton Dickinson and Company, Franklin Lakes, N.J., USA). A glass tube (inner
diameter of 3.7 mm and length of 25 cm, open on both ends) supported with
rubber stopper was immersed in the fermented milk mixture. The falcon tube was
then closed by a fitting rubber stopper, immersed in a water bath at 42 °C and
incubated until pH reached 4.5. After acidification or fermentation, the glass tube
containing now the gel inside was removed and the length of the gel was
measured. The glass tube was then immersed in 35 mL whey in another falcon
tube. By the osmotic pressure, the whey would diffuse up along the length of the
gel and fill the surface of the gel. The height of the whey on the gel surface was
recorded periodically. Reference tubes were the same type of falcon tubes filled
with the whey of the same volume (35 mL), in which a similar glass tube
supported with rubber stopper was immersed. The height of whey was measured.
Permeability was expressed as permeability coefficient, B, as described by Lee &
Lucey (Lee and Lucey, 2004b). The temperature of determination was 20 °C, and
density of the whey was 1.033 mg/mL. Six tubes for each sample in every
subsampling were assessed. Any imperfect gel, which was broken or detached
from the glass wall, was excluded. Permeability coefficient was calculated using
the following equation:
( )( ) ( )12t1
t2
t- tgH
h - hh - hln- B
⋅⋅⋅
⋅⎥⎦
⎤⎢⎣
⎡=
∞
∞
ρη
140
Where B is the permeability coefficient (m2), h∞ the height of the whey in the
reference tube (m), ht1 and ht2 (m) the height of the serum in the gel tube at time t1
(s) and and t2 (s), respectively. η is the viscosity of whey (Pa), ρ density of the
whey (kg/mL), g acceleration due to gravity (m/s), and H the length of the gel
(m).
7.2.4 The rheological characteristics of set-type fermented milk
The gelation was assessed during acidification using the artificial acidulant
(GDL) or two types of the cultures. The GDL was added at 1.3 g/100 g, while
suspension of S. thermophilus was added as much as 2 mL/10 mL either as
capsular-ropy- or capsular-EPS producer. For the GDL-acidified fermented milk,
approximately 50 mL of the fermented milk base was thoroughly mixed with the
GDL using a vortex mixer, and quickly loaded into the sample chamber of a
double-gap type geometry (C-DG 26.7/T200, internal diameter 23.833 mm,
external diameter 27.594 mm, Anton Paar) equipped with a solvent trap to prevent
the evaporation. A layer of low viscosity silicone oil was placed in the solvent trap
ring to prevent evaporation. The structural development was assessed using a
controlled rate/controlled strain rheometer (Physica MCR 301, Anton Paar,
GmbH, Germany). The rheometer was connected to a circulating water bath
(Viscotherm VT 2, Anton Paar), and the temperature was controlled with a Peltier
system (Anton Paar) to maintain it constant at 42 °C with an accuracy of ± 0.1 °C.
Upon loading, all samples were pre-sheared (500/s, 3 s for GDL fermented milk,
and 3 min for bacterial fermented milk) to achieve uniformity in the measuring
geometry. The development of G’ over time was examined at 0.1 % strain and
constant frequency of 1 Hz until pH reached 4.5 or G’ showed plateau. The data
of all rheological measurements were analyzed with the supporting software
Rheoplus/32 v2.81 (Anton Paar). The changes of pH were checked periodically
from a simultaneous fermentation batch.
The assessment of the rheological properties of set-type fermented milk after
fermentation was carried out in a cone-and-plate geometry (CP50-1, 50 mm

141
diameter, 1o angle and 0.02 mm gap) with the CR/CS Anton Paar rheometer. All
samples were homogenized by thorough stirring prior to loading. The fermented
milk structure was additionally broken by pre-shearing at 500/s for 30 s, followed
by the resting period of 300 s to allow for a structural rebuilding. All samples
were subjected to a frequency sweep performed in the linear viscoelastic region.
The viscoelastic region was determined by applying an amplitude (strain) sweep
at 1 Hz. The thixotropy loop experiment was conducted by increasing the shear
rate logarithmically from 0.1 to 100/s within 300 s, and then decreasing back to
the origin again within 300 s. The data from the upward curve of the shear cycle
were fitted to three models: firstly, the Bingham model (τ = a + Kγ& ), where τ
presents shear stress (Pa), γ& shear rate (s-1), while a yield stress (Pa s) and K
consistency coefficient (Pa sn); secondly, the Herschel-Bulkley model (τ = a +
Kγ& n), with a yield stress (Pa s), K the consistency (Pa sn) and n viscous
coefficients (dimensionless), respectively; and thirdly, the power law model (τ =
Kγ& n), where K and n are consistency factor (Pa sn) and viscous coefficient
(dimensionless), respectively.
7.2.5 Statistical analysis
The experiments were arranged according to randomized full factorial block
design with two factors: types of acidulant (three levels), and whey protein
addition (five levels). This block structure was replicated twice with at least 2 sub-
samplings. Results were analyzed using General Linear Model procedure of the
SAS System (SAS, 1996), and the level of significance was preset at P = 0.05.
The General Linear Model could be described by following equation:
Xijk = μ + αi + βj + (αβ)ij + εij
Where X corresponds to the actual value and μ expected value, ε is the error term
and α, β, denote acidulants (GDL and EPS producing cultures) and whey protein

142
supplementation, respectively. Terms in brackets present corresponding
interactions. The level of significance was preset at P = 0.05.
7.3 Result and discussion
7.3.1 Bacterial growth and EPS production
In general, the addition of whey proteins either in heat-untreated or heat-
treated form had little or no effect on the growth of both strains of bacteria (results
not shown). The EPS concentration in capsular-ropy or capsular fermented milk
with the same casein to WPI ratio was in most cases not significantly different
(P>0.05) (Table 7.1). EPS isolated from fermented milk with capsular-ropy strain
was significantly (P<0.05) higher than that of capsular strain in some samples
with no or low concentration of added whey proteins. The apparent insensitivity
of the capsular S. thermophilus to the whey protein supplementation may be due
to its slow-growth nature. Accordingly, the EPS production by the capsular-ropy
strain was more influenced by the media composition compared to that of the
capsular S. thermophilus. The control fermented milk contained more EPS than
those produced by WPI supplementation (Table 7.1). Certain strains of S.
thermophilus are known to possess a poor proteolytic activity, thus their growth
and EPS production may depend on the quality of supplemented proteinaceous
nitrogen (Lucas et al., 2004). The strains used in our study produced the EPS in a
growth-dependent manner.

143
Table 7.1 Physical and chemical properties of fermented milk supplemented with
either heat-untreated or heat-treated whey protein isolate and acidified using GDL
or capsular-ropy or capsular EPS producing strains of Streptococcus thermophilus
at 42 °C.
Fermented milk samples*
Syneresis**, (g/100 g)
Permeability**,(× 10-11 m2)
Firmness**, (g)
EPS concentration**,
(mg/kg fermented milk)
GDL Control (Skim Milk) 22.95bA 23.2bB 69.9aA ND 3:1, NWPI 32.93bA 36.0cB 52.4aA ND 1:1, NWPI 34.82bA 43.8dB 47.4aA ND 3:1, DWPI 4.35aA 3.58aA 277.8bA ND 1:1, DWPI 5.88aA 0aA 524.3cA ND
Capsular-ropy Control (Skim Milk) 21.05abA 13.1bA 26.3aA 223.9aB 3:1, NWPI 29.65bA 15.2bA 18.1aA 142.5bB 1:1, NWPI 41.66bA 65.0cC 17.9aA 104.1aA 3:1, DWPI 18.12aB 3.71aA 217.2bA 50.2aA 1:1, DWPI 9.105aA 0aA 1009.0cB 90.4aA
Capsular Control (Skim Milk) 32.54bA 23.9cB 29.7aA 128.6bA 3:1, NWPI 33.24bA 15.0bA 24.2aA 62.2abA 1:1, NWPI 34.25bA 30.7cA 20.7aA 99.7abA 3:1, DWPI 17.07aB 3.48aA 305.7bA 81.3abA 1:1, DWPI 16.57aA 0aA 1028.5cB 53.4aA SEM*** 3.00 1.9 41.7 17.4 *Numbers denote casein and whey protein ratio, NWPI stands for heat-untreated whey protein isolate, and DWPI stands for heat-treated whey protein isolate Means present the average of at least 4 determinations (n=4); **Small letter superscripts in a column denote significant difference (P<0.05) among samples at different whey protein supplementation, for a particular type of acidulant; Capital letter superscripts in a coloumn denote significant difference (P<0.05) among samples at the same whey protein supplementation, for different acidulant. ***SEM - pooled standard error of the mean, P<0.05.

144
7.3.2 Gelling properties of acid induced gels in the presence of EPS
and heat-untreated or heat-treated WPI
In the GDL-acidified fermented milk, the WPI supplementation
enhanced both maximum G’, it shortened the time of onset of gelation, and was
positively related to whey protein concentration (Figure 7.1). The fermented
milk samples with the heat-treated WPI exhibited higher G’ than those of the
heat-untreated whey proteins. Similarly, in the capsular-ropy fermented milk,
whey proteins also induced earlier start of the gelation (Figure 7.2). However,
the low whey protein supplementation (casein:whey protein ratio of 3:1)
reduced maximum G’ in comparison to the control fermented milk. A typical
sharp increase of G’ was observed during gelation in all capsular-ropy
fermented milk samples, as opposed to those with heat-untreated whey proteins
with a rather gradual increase of the storage modulus. This may indicate a
slower textural development or a weaker structure during gelation. On the other
hand, in the fermented milk acidified with the capsular strain, the whey protein
supplementation increased the maximum G’ in comparison to control,
regardless the concentration and whey protein state (Figure 7.3). The higher
concentration of added whey proteins, heat-untreated or heat-treated, appeared
to delay the gelation. The results apparently indicated that while the gelation of
the GDL-acidified fermented milk was positively correlated to the
concentration of added whey proteins regardless their state, those fermented by
EPS-producing S. thermophilus strains were not. This may reflect that the EPS
interfered with the gelation in the whey protein supplemented fermented milks.
Moreover, the gelation behaviour among fermented milk samples made by
these two EPS producers also differed inferring likely the effect of the EPS
nature on the formation of the acid gel (Bouzar et al., 1997).

145
Figure 7.1 Changes in elastic moduli (G’) during gelation of fermented milk
acidified with glucono-δ-lactone for control mixture (+), and those containing
casein:whey protein ratio of 3:1 (∆ for heat-untreated, and ▲for heat-treated whey
protein), and casein: heat-untreated whey protein ratio of 1:1 (□ for heat-untreated
and ■ for heat-treated whey protein), fermented at 42 °C.

146
Figure 7.2 Changes in elastic moduli (G’) during gelation of fermented milk
acidified with capsular-ropy strain of Streptococcus thermophilus for control
mixture (+), and those containing casein:whey protein ratio of 3:1 (∆ for heat-
untreated, and ▲for heat-treated whey protein), and casein: heat-untreated whey
protein ratio of 1:1 (□ for heat-untreated and ■ heat-treated whey protein)
fermented at 42 °C.

147
Figure 7.3 Changes in elastic moduli (G’) during gelation of fermented milk
acidified with capsular strain of Streptococcus thermophilus for control mixture
(+), and those containing casein:whey protein ratio of 3:1 (∆ for heat-untreated,
and ▲for heat-treated whey protein), and casein: heat-untreated whey protein
ratio of 1:1 (□ for heat-untreated and ■ for heat-treated whey protein) fermented at
42 °C.

148
A partial unfolding of whey proteins may occur during heating at 80 °C
and pH 7, but the gelation may not occur due to electric repulsion among
denatured protein globules (Fitzsimons et al., 2007). The rate of heat
denaturation of whey proteins increased at lower proportion of casein to whey
protein (Law and Leaver, 1999). Nevertheless, the denaturation could increase
viscosity (Hollar et al., 1995). At high pH, dimeric β-lactoglobulin may be
activated by exposing the thiol groups (Iametti et al., 1996). Upon acidification
during the yoghurt manufacturing, the activated whey proteins may interact
with dissolved κ-casein, by partially or fully covering the casein aggregates
(Guyomarc'h et al., 2003, Vasbinder et al., 2003) to increase further network
strength (Guyomarc'h et al., 2003, Knudsen et al., 2006). In a binary model
system consisting of the EPS and whey proteins, the increase in viscosity was
directly correlated to the EPS concentration which interacted with aggregated
whey proteins (de Kruif, 1999). On the other hand, in a yoghurt system, a
minimum concentration of native whey proteins improved the gel strength,
while further supplementation had detrimental effects (Patocka et al., 2004).
This minimum concentration of added native whey proteins required to
improve yoghurt gel structure was apparently shown by the capsular-ropy
yoghurt in our study and even masked the gelation point. As the results showed
(Figure 7.2), apparently important interactions between types of
exopolysaccharide and native or heat-treated whey protein may exist, thus
further studies are needed to reveal the mechanism of these interactions.
7.3.3 Physical properties of fermented milk samples
7.3.3.1 Firmness
Type of acidifier had a negligible effect (P>0.05) on gel firmness, but the
ratio of casein to heat-treated WPI was a significant (P<0.05) factor. The
fermented milk gel samples produced by the culture fermentation appeared
slightly but not significantly (P>0.05) firmer than the GDL fermented milk (Table

149
7.1), whereas the addition of native whey proteins reduced firmness slightly
(P>0.05) in all fermented milks (Table 7.1). In contrast, firmness was
significantly (P<0.05) increased upon addition of heat-treated WPI in all
fermented milks produced by the three types of acidulants with an apparent
concentration-dependency. Among the three types of fermented milk with the low
proportion of added heat-treated whey proteins, the firmness was not significantly
different (P>0.05). However, upon addition of the greater concentration of heat-
treated whey proteins, the firmness of the GDL fermented milk (524+41.714g)
was lower (P<0.05) and only half as firm as the two culture-fermented fermented
milks (1009 and 1028±41.714g for capsular-ropy and capsular fermented milk,
respectively). Thus, the influence of EPS during supplementation with denatured
whey protein appears to be important determinant of firmness. A heat treatment as
low as 68 °C applied to whey protein isolate induces the activation of the thiol
groups through unfolding of the native protein structure (Alting et al., 2003).
Thiol groups are sensitive to pH, and during acidification, they may form covalent
bonds to further cause inter-particle cross-linking (Vasbinder et al., 2003). As a
result, a hard gel may be formed that depends upon the initial whey protein
concentration.
7.3.3.2 Syneresis
Syneresis in fermented milk occurs as a result of an open structure allowing
the flow of serum out from the acid-induced protein network (Puvanenthiran et
al., 2002). In this study there was generally no significant difference (P>0.05) in
syneresis with the different type of fermented milk mixtures (Table 7.1). Syneresis
was significantly (P<0.05) reduced in the fermented milk samples with heat-
treated WPI. This is consistent with a previous report, which also noted the
increase in the firmness of the gel (Lucey et al., 1997b). The denatured whey
protein supplementation caused a development of a more compact protein
network, leading to construction of smaller pores which inhibited serum release
(Puvanenthiran et al., 2002). In general, the syneresis was insignificantly
(P>0.05) affected by addition of native whey proteins, but greatly (P<0.05)

150
decreased by heat-treated whey protein supplementation (Table 7.1). The effect
was not significantly (P>0.05) concentration dependent. Substantially great
reduction in syneresis of heat-treated WPI supplemented GDL fermented milk
may indicate the more sensitive nature of GDL network to addition of denatured
whey protein. On the other hand, apparently there was an interaction between EPS
and heat-treated WPI to slightly hinder reduction in syneresis of bacterial
fermented milk.
7.3.3.3 Permeability coefficient
The permeability of the fermented milk gels was closely and positively
related with the pore size within the gel network (Alting et al., 2003). Among
control fermented milk, the permeability of the GDL and capsular fermented
milks was not different (P>0.05), but the permeability of both were significantly
(P<0.05) higher that that of the capsular-ropy fermented milk (Table 7.1). Upon
addition of the lower concentration of native WPI, the permeability of both
bacterial fermented milks was the same (P>0.05), but were significantly (P<0.05)
lower than that of GDL fermented milk. However, increasing the concentration of
native WPI caused significantly (P<0.05) higher permeability in both capsular-
ropy and GDL, when compared to that of capsular fermented milk. The
permeability of all fermented milk was intensified by the addition of native whey
proteins and significant (P<0.05) at casein:WPI of all ratio for the GDL
fermented milk. In fermented milk containing capsular-ropy strain, the increasing
permeability was demonstrated by mixture of 1:1 native casein:WPI (Table 7.1).
Whilst, in capsular fermented milk, native WPI addition at the lower casein:whey
protein ratio reduced permeability significantly (P<0.05). At higher ratio, it did
not alter permeability (P>0.05). Apparently, the changes in permeability during
supplementation with native WPI were too small to cause the changes in
syneresis.
In contrast to native WPI, heat-treated WPI reduced permeability
significantly (P<0.05), which was practically non-existent at 1:1 casein:WPI ratio.
The addition of the denatured whey proteins during yoghurt manufacturing results

151
not only in the formation of larger aggregates (Puvanenthiran et al., 2002), but
also greater bonding between these protein segments (Alting et al., 2003,
Puvanenthiran et al., 2002). As a result, yoghurt gel structure was more dense and
possessed smaller pores (Puvanenthiran et al., 2002) with consequently low
permeability and serum expulsion (Alting et al., 2003, Puvanenthiran et al., 2002).
Moreover, soluble denatured whey proteins residing in the pores are also capable
of performing physical barrier for serum flow (Puvanenthiran et al., 2002).
7.3.4 Rheological properties of fermented milk with the EPS and
native and heat-treated whey proteins
7.3.4.1 Elastic properties of fermented milk gels
The elastic properties of the fermented milk samples expressed as the
storage moduli were affected by the acidulant type and their interactions with
whey proteins (P<0.05) (Table 7.2). In the control and native whey protein
supplemented fermented milk, the storage moduli were significantly (P<0.05) and
consistently lower in the culture fermented fermented milk than in the GDL
fermented milk. However, this was reversed upon supplementation by the higher
concentration (casein:whey protein ratio of 1:1) of heat treated whey proteins.
Higher (P<0.05) values of storage moduli were also observed at a lower
concentration of heat-treated whey proteins for the capsular fermented milk, when
compared to that of GDL fermented milk. The addition of native whey proteins
appeared to be more detrimental to the structure of the culture produced fermented
milk than that of the GDL with even increased G’ (Table 7.2). The reduction of
the gel strength as a result of the native whey protein supplementation was
previously observed (Oliveira et al., 2001, Sodini et al., 2002) and may be due to
certain properties of whey proteins as ‘inactive filler’ (Guggisberg et al., 2007)
which poorly support the formation of the acid induced gel network. Our result
was different from earlier work (Patocka et al., 2004) in which the native whey
proteins at high concentrations were able to reverse a decline in the storage
modulus. This disparity may originate in two different approaches. In our study, a

152
portion of milk proteins was replaced by whey proteins at the constant total solid
level, while in the other study (Patocka et al., 2004) the whey protein
supplementation also increased the total solid content, which could have also
affected the elastic properties.
In contrast to the native whey protein addition, the applied heat treatment
resulted in whey proteins that subsequently increased G’ in all types of fermented
milk in the concentration-dependent manner. The apparent rise of the storage
modulus was less pronounced in the GDL fermented milk than in the culture-
produced fermented milk. This could likely indicate a possible interaction
between the released EPS and heat-treated whey proteins. The greater G’ values
upon addition of denatured whey proteins were considered to be due to their
interactions with casein (Vasbinder et al., 2003). Previously, the EPS exhibited a
depletion interaction with denatured whey proteins (de Kruif and Tuinier, 1999),
as well as casein (Tuinier et al., 1999) and induced the aggregation of both
proteins. Furthermore, partially denatured whey proteins were able to interact with
soluble κ-casein aggregates in the acidic environment (Vasbinder et al., 2003),
whilst aggregates of denatured whey proteins were also present in the surrounding
within the network (Puvanenthiran et al., 2002), both magnified the gel strength.

153
Table 7.2 Rheological properties of the fermented milk supplemented with either
native or heat-treated whey protein isolate and acidified using GDL or capsular-
ropy or capsular EPS producing strains of Streptococcus thermophilus at 42 °C.

154
7.3.4.2 Flow behavior of fermented milk samples
In our study, several models commonly used in the study of rheology of
semisolid foods, namely Ostwald, Herschel-Bulkley, and Bingham, were used to
ascertain flow behavior of the fermented milk samples after manufacturing (Rao,
1999). The three models describe the flow behaviour of a material possessing
pronounced shear-thinning properties at lower shear rates. Both Herschel-Bulkley
and Bingham models show yield stress of a material, above which the material
may exhibit the Newtonian (Bingham) or either shear-thinning or shear-thickening
(Herschel-Bulkley) flow. The consistency index derived from the Ostwald and
Herschel-Bulkley models were apparently similar (Table 7.2). However, the
Bingham model produced much lower values with no apparent trend, and even
showed rheologically meaningless negative values at high concentrations of added
heat treated WPI. This may indicate a poor suitability of the Bingham model
compared to the other two models employed here. All models indicated higher
consistency coefficient of the EPS containing fermented milk as previously
reported (Hassan et al., 2003b) than this of the non-EPS fermented milk, although
the difference was slight (P>0.05). Among similar types of mixture, the difference
of consistency index in all models between the GDL and bacterial fermented
milks was only significant (P<0.05) upon supplementation of heat-treated WPI
either at all concentrations (Table 7.2). During supplementation of low
concentration of heat-treated whey proteins, consistency index derived from the
Herschel-Bulkley or Ostwald model showed higher (P<0.05) values for the
bacterial than that of the GDL fermented milk. The EPS apparently improved the
shear resistance of fermented milk. The addition of the native whey proteins to the
fermented milk fermented with the cultures had slightly lower (P>0.05)
consistency index, reversely related to the WPI concentration, in comparison to
that of the GDL sample. On the other hand, the heat treated whey proteins
consistently and significantly (P<0.05) increased consistency index in all types of
fermented milks, although to a lesser extent in the GDL fermented milk. This

155
observation may further underline a probable interaction of the EPS and heat-
treated WP, which consequently improved the strength of the fermented milk gel.
The estimation of the viscous (flow behavior) coefficient by two models
(Herschel-Bulkley and Ostwald) delivered different results (Table 7.2). Viscous
coefficient derived from the Herschel-Bulkley model was higher for the GDL than
bacterial fermented milk with supplementation of higher concentration of heated
whey proteins. On the other hand, those of control bacterial fermented milk
derived from Ostwald model were higher (P<0.05) than that of the corresponding
GDL fermented milk. As the concentration of added whey proteins increased, the
Herschel-Bulkley model estimated a decline of n values for native, but increasing
values for the heat-treated WPI. However, this model appeared to be unsuitable
for the samples containing higher concentrations of heat-treated WPI. On the
other hand, the Ostwald model provided more consistent estimation for all the
samples with the transposed relation of the n values with the WPI concentration.
Similarly to Herschel-Bulkley estimation, the viscous coefficients were lower for
the heat treated than the control and native WPI fermented milk. This model
underlined shear-thinning characteristics of all samples, with the n values less
than 1 (Rao, 1999). The fermented milk supplemented with heat-treated WPI
produced a greater deviation from the Newtonian flow, than those of the native
WPI fermented milk. Lower viscous coefficient for the EPS-containing fermented
milk was observed previously (Hassan et al. 2003b).
The yield stress of all fermented milk samples was estimated using the
Herschel-Bulkley and Bingham models with varying results. Using the Herschel-
Bulkley model, yield stress was relatively low in all types of fermented milk,
ranging from 0.521 to 1.837+0.309 Pa with no obvious statistical difference
(P>0.05) or trend. In contrast, the yield stress estimated by the Bingham model
ranged from 0.64 to 600.62+23.30 Pa with an apparent trend. Therefore, the
Bingham model appeared to estimate the yield stress of all samples better than the
Herschel-Bulkley model. Upon addition of heat-treated whey proteins, the
Bingham model showed significantly higher (P<0.05) yields of bacterial
fermented milk than GDL fermented milk. Using Herschel-Bulkley model,
however, only GDL fermented milk added with lower concentration of heat

156
untreated whey protein showed significant (P<0.05) higher yield than those of
analogous bacterial fermented milk. The GDL fermented milk had insignificantly
(P>0.05) lower yield compared to the culture produced fermented milk with a
similar casein:whey protein ration (Table 7.2). Similar to other gel strength
parameters studied (G’, consistency coefficient, and firmness), the yield was
reduced upon supplementation by native whey proteins in the EPS fermented
milk, but not in the GDL fermented milk. In contrast, the addition of the heat-
treated whey proteins increased significantly (P<0.05) yield in all types of
fermented milk. A similar result was reported previously (Puvanenthiran et al.,
2002) with denatured whey proteins increasing the yield stress of fermented milk
due to a greater aggregate size and more extensive bonding within the gel
structure.
The thixotropy area correlates to the structural redevelopment after shear,
with a lower value indicating quicker structural rebuilding (Rao, 1999). In
general, the capsular fermented milk exhibited larger thixotropy area compared to
the analogous fermented milk treated with other acidulants (Table 7.2), which
may indicate a more solid nature of the capsular fermented milk. Upon addition of
either form of the whey proteins, the viscoelastic behaviour of the GDL fermented
milk differed from that of the bacterial fermented milk, with consistently larger
values of the thixotropy area. The low addition of native whey proteins to
fermented milk caused reduction in the thixotropy area, with subsequent increase
at the high concentration. Therefore, higher concentrations of native whey
proteins may improve the structural rebuilding after shear in fermented milk. On
the other hand, heat-treated whey proteins increased (P<0.05) the thixotropy area
in all types of fermented milk in a concentration dependent manner. Smaller
thixotropy may reflect quicker recovery after application of shear (Rao, 1999),
showing that the material is either more solid or more elastic. In our study, the
EPS-containing fermented milk had slower recovery than the GDL fermented
milk. However, lower thixotropy of a material may also indicate its brittle
character (Lucey et al., 1998), with higher thixotropy better reflecting an ability of
the material to regain original texture after shear albeit longer recovery time, as
shown by the EPS-containing fermented milk in our study. The rupture of texture,
157
phase separation and syneresis after stirring of non-EPS fermented milk had been
observed previously, while the EPS fermented milk was able to regain its
homogeneity (Hassan et al. 2003b).
Bacterial fermented milk showed significantly higher (P<0.05) thixotropy
than that of the GDL fermented milk, only when supplemented with higher
concentration of heat-treated whey proteins (Table 7.2). In general, although
mainly not statistically significant (P>0.05), the capsular fermented milk
exhibited larger thixotropy area compared to the analogous fermented milk treated
with other acidulants, which may indicate a more solid nature of the capsular
fermented milk. The thixotropy observations were consistent to other gel strength
parameters (G’ and consistency coefficient), showing that the native whey protein
supplementation increased solid characteristics of the GDL fermented milk with
the opposite tendency in the EPS containing fermented milk. Non-reactive,
‘inactive filler’ (Guggisberg et al., 2007) nature of the native whey proteins
supplemented to milk mixture in bacterial fermented milk may be the cause for
lowering the thixotropy, and connected to a weakening of its structure (Lucas et
al., 2004, Oliveira et al., 2001, Puvanenthiran et al., 2002). On the other hand,
heat treated whey proteins upon addition to the fermented milk increased the
strength of casein aggregates via disulfide-bridges linkage to κ-casein, as well as
induced β-lactoglobulin inter-particle association to give more rubbery-elastic
characteristics (Vasbinder et al., 2003).
Power law, Bingham, Herschel-Bulkley, and Casson models were
commonly used to describe flow behaviour of semi-solid foods (Murat and
Kokini, 1986). In our work, the values of K were well described by Ostwald and
Herschel-Bulkley models, n values by Herschel-Bulkley, and yield stress by
Bingham model. However, in overall, apparently the data fit Herschel-Bulkley
model better than the other two models, to show shear-thinning material with
small yield. Herschel-Bulkley model was also the best model to be applied in the
design of flow process of ketchup, mustard, apple sauce, and tomato paste (Murat
and Kokini, 1986).
Heat-treatment of whey protein added into fermented milk base at low
concentration in this experiment seems to restore the texture which was severely
158
damaged by addition of heat-untreated whey protein, calcium alone or in
combination with heat-untreated whey proteins. However, at higher concentration
of heat-treated whey protein added into the milk, the texture became too hard and
compact without any pore, causing lost of semi-solid characteristics of this
fermented milk.
7.4 Conclusions
The GDL and EPS-containing fermented milk showed different gelation,
physical and rheological behaviour as a result of whey protein supplementation.
Native or heat-treated whey protein supplementation produced gels with different
properties. Gel strength parameters: G’, yield, firmness in EPS-containing
fermented milks were increased upon the addition of heat-treated whey protein in
much greater extent compared to non-EPS fermented milk. Capsular and GDL
fermented milk exhibited higher K (from Herschel-Bulkley and Ostwald models)
and yield (from Bingham model) than the values from capsular-ropy fermented
milk. K values were increased slightly by addition of native whey protein in GDL
fermented milk, but were decreased in EPS-containing fermented milk. Addition
of heated WPI increased K values in all fermented milk. Storage moduli of non-
EPS fermented milk were relatively not influenced by WPI supplementation, in
contrast to those of EPS-containing fermented milk. Non-EPS- and EPS-
containing fermented milk showed opposite response on thixotropy upon addition
of native WPI. Syneresis and permeability of all types of fermented milk were
lowered by addition of heat-treated whey protein, while firmness was increased.
Herschel-Bulkley model seemed to be the best model to describe flow properties
of fermented milk.
In conclusion, further study is needed to reveal the mechanism of apparent
interaction between EPS and whey protein during manufacturing of WPI-
supplemented fermented milk. Therefore, during production of WPI supplemented
fermented milk, the type of EPS produced by the starter cultures and the whey
proteins state are apparently important factors to be considered in order to obtain
desirable textural characteristics of fermented milk.

159
8 Summary of Results and Future Research
Directions
8.1 Summary of Results
The Streptococcus thermophilus strains used in this study (ST 1275 and ST
285) produced exopolysaccharides (EPS) in varying concentrations. They were
also capable of utilising galactose present in the medium probably recruiting
intracellular processes to incorporate this sugar into newly formed
exopolysaccharides. This characteristic may be beneficial to the economy of
carbon utilisation of the cells. In M17 medium, the carbon source influenced both
growth and EPS production of these two strains. While glucose and lactose
supported their cell growth, galactose restricted it. On the other hand, the EPS
concentration in galactose-containing M17 medium was comparable to those
produced in the presence of glucose and lactose. Higher fermentation temperature
favoured the cell growth with apparent growth-associated EPS production.
The capsular EPS exhibited different rheological characteristics in
comparison to capsular ropy EPS. The apparent viscosity of capsular EPS
dispersions declined to a greater extent by the increase in temperature, compared
to that of capsular-ropy. Shear-resistance as indicated by K (consistency index)
was positively affected by concentration, and the values in capsular EPS
dispersions were higher than those of capsular-ropy. The viscosity at zero shear
rate (η0) and relaxation time (τ) between the two types of EPS were different and
influenced by pH. In acidic environment, η0 and τ of capsular-ropy EPS were
higher, which may indicate lower molecular mobility due to higher water-binding,
or more extensive entanglement, more extensive coil overlap, or size enlargement
of the EPS molecules. Longer time was required by capsular-ropy EPS to rebuild
its initial structure after disruption during shearing. In accordance to this, the
parameter ‘a’ in Arrhenius plot showed less sensitive nature of capsular-ropy type
of EPS. Less sensitivity may also relate to less mobility of the molecules.

160
Although not apparent, activation energy (ΔE) of capsular-ropy EPS tended to be
lower than that of capsular EPS, further indicating more restricted molecular
movement in the capsular ropy EPS. Both EPS showed low sensitivity to
temperature, which was comparable to other bacterial hydrocolloid studied by
Speers and Tung (1986). While temperature influence on the rheological
properties of the two EPS was not shown clearly, the difference of zero-shear
viscosity (ηo) between the two EPS was palpable. This rheological difference
between the two types of EPS shown by Cross model parameters also emphasized
the suitability of this method in the study.
When produced in fermented milk system, two types of EPS caused
rheological and physical differences in the product, which were a reflection of the
rheological properties of the EPS. Fermented milk made by capsular-ropy strain
exhibited greater water-binding capacity, with a less brittle gel and larger
thixotropy. Although the final texture of fermented milk gel was basically a
network arrangement between milk protein and exopolysaccharide (Hassan et al.,
2001a), the original character of EPS appeared to be manifested in the final
fermented milk texture. For instance, capsular-ropy EPS in dispersion under
acidic environment exhibited higher zero-shear ηo and relaxation time τ which
was related to lower mobility. This lower mobility could be associated with its
better ability to bind water. This character was displayed in fermented milk
system containing capsular-ropy EPS, where the syneresis was lower than in that
containing capsular EPS. Larger thixotropy of fermented milk with capsular-ropy
EPS may also relate to lower mobility character of capsular-ropy EPS.
Furthermore, longer relaxation time of capsular-ropy EPS is in accordance with
less brittle gel of the fermented milk containing the EPS. This explanation
somewhat added more information to previous report mentioning characteristic of
attachment and location of EPS in yoghurt gel (Hassan et al., 2001a) in which
ropy EPS resided in the pores while capsular EPS was close to the surface of
casein network. The current work showed that higher water holding capacity,
more flexible or less brittle and larger thixotropy of fermented milk containing
capsular-ropy EPS.
161
During storage, certain structural changes appeared to have taken place,
resulting in a more elastic gel regardless the types of EPS. There was a
considerable reduction of the amount of EPS during first week of cold storage, but
the textural properties as determined by rheological assessment were not greatly
changed. This could have been likely caused by various interactions among
fermented milk components that were more influential over the EPS
disappearance to govern structural changes during gel ageing. Hindering effect of
EPS on structural development of gel (Hassan et al., 1996b) may play role in this
case, so that by reducing the EPS concentration during storage the protein-protein
interaction is improved. Nevertheless, the difference characteristics between
fermented milk prepared by each type of EPS were somewhat similar to their
behaviour in dispersion.
Such phenomenon was also shown in calcium-fortified fermented milk,
where the texture of fermented milk with capsular producer remained more solid-
like with more syneresis than that of capsular-ropy cultures, despite there was
some influence of added calcium. In the texture of calcium-fortified fermented
milk, texture of non-EPS fermented milk was not affected to a great extent by the
additive as compared to EPS-containing fermented milk. This gave the impression
that there was possible interaction of EPS and calcium. However, it was more
likely that calcium affected casein-casein network rather than EPS, since
electrostatic interaction between calcium and uncharged or weakly-charged EPS
was very unlikely to occur. It was not possible for us to comment on the charge of
the EPS in this work, since it was not one of the objectives but should be carried
out in the future. Furthermore the current work highlighted importance of the
depletion flocculation due to presence of EPS and their interaction with milk
proteins as reported in some studies (de Kruif and Tuinier, 2001). As it appeared
in the present study charge screening may also play an important role since
addition of calcium had a detrimental effect on the textural properties. Calcium
fortification in EPS-containing fermented milk should be carried out with
precaution, since it may reduce the bioavailability of calcium, by physically
trapping the mineral (Bosscher et al., 2003). In contrast to the the gel
strengthening effect of added calcium on fruit yoghurt (Singh and

162
Muthukumarappan, 2008), calcium addition in our work weakened the texture.
This quite opposite observation was likely due to presence of pectin in fruit
yoghurt and was not included in our work. This was also another indicator that the
EPS examined in the present work were not chared at pH of fermented milk and
made no or had adverse effect on the textural properties of acid gels.
Combined effect of calcium and heat-untreated whey protein addition to
fermented milk impaired the texture even more, and made it more suitable for
drinking yoghurt. This deleterious effect of whey protein supplementation on
fermented milk gel had made it ‘inactive filler’ (Guggisberg et al. 2007).
Therefore, the information from our experiment would be useful in order to yield
a right combination of calcium and whey proteins to produce a gell with less
syneresis, high thixotropy and low G’. From the current study, it appeared that
whey proteins interfered with caseins rather than EPS.
Upon addition of heat-treated whey proteins, the texture of fermented milk
can be improved and altered by adjusting the proportion between whey protein
and casein. Addition of low proportion of heat-treated whey protein and casein
resulted in EPS-containing fermented milk that differ in some textural
characteristics, but their original EPS characteristics dissimilarity remained, i.e.
those fermented with capsular-ropy producer was less solid and less syneresis than
their corresponding fermented milk made using capsular producer. However,
addition of high proportion of whey protein and casein diminished the difference.
This, again, suggested the lack of interaction between EPS and whey protein
either with or without heat treatment. The more severe effect of added heat-treated
whey protein noticeable in non-EPS fermented milk texture probably due to the
less stable system in EPS-containing fermented milk (de Kruif and Tuinier, 2001).
Mixture of casein and heat-treated whey protein at high concentration had
performed hard gel at the beginning of fermentation, thus eliminated the effect of
other components such as EPS and fermentation on the final texture of the
product. Heat treated whey proteins may form inter-particle association or more
extensive disulfide linkage (Vasbinder et al., 3003), resulted in a very hard and
rubbery gel.

163
As the overall conclusion, the production of fermented milk with additional
functional properties was possible through the use of low-fat skim milk,
employing EPS-producing strains, and supplementation with calcium or/and whey
protein concentrate. The two EPS used in the study showed an important role in
the development of fermented milk texture albeit the small quantity present in the
fermented milk. Moreover, the rheological behaviour of the two EPS in fermented
milk exhibited consistent distinctive characteristics. Since polymer-polymer
interaction is beyond the focus of this study, we cannot provide any detail
explanation on the nature of interaction between EPS and milk proteins. However,
the practical implication of the interaction was consistently shown through various
experiments that texture of fermented milk made using capsular-ropy EPS was
less solid, less syneresis, and more shear-resistant compared to that made using
capsular EPS.
8.2 Future research directions
Based on the findings of this work, several areas have resurfaced and require
a closer attention in order to properly assess and understand the complex
interactions of EPS-containing fermented milk in their natural or supplemented
form. The following points address possible directions that could be taken in
resolution of these complex systems:
1. the improvement of metabolic activity of selected cultures - the strains
used in this study experienced very slow-growth, therefore the
supplementation of the fermented milk mix with relevant growth factors
should be examined to shorten the fermentation time; however, the
special attention should be taken to maintain or improve the production
of exopolysaccharides. Alternatively, a fast growing EPS producing
strain should be additionally assessed.
2. the use of mixed culture for the improvement of EPS characteristics
produced in fermented milk - two examined strains released EPS, which
gave distinctly different textural characteristics. One strain produced
EPS which gave stronger solid character and smaller thixotropy but

164
brittle gel with large whey expulsion of fermented milk. On the other
hand, the type of EPS produced by the other strain gave ropy fermented
milk with greater shear resistance, less syneresis, but weaker solid
character. Thus combining the two strains in a right proportion may
better improve the texture of fermented milk.
3. the nature of various interactions - in this study, it was demonstrated the
changes in the textural properties of EPS-containing fermented milk as
affected by various supplementations. However, controlling the texture
creation is an important element in order to attain desirable textural
characteristics. To achieve this goal, a thorough study on the
understanding of mechanisms among fermented milk constituents would
be essential. As shown in several chapters, the EPS appeared to be
involved in the interaction with milk protein network as well as
supplements, all of which resulted in a substantial effect on fermented
milk textural properties.
4. sensory studies - the acceptance of fermented milk, including new type
of fermented milk containing supplements, is greatly governed by its
creamy characteristics. Therefore, any manufacturing or modification of
fermented milk should aim at creating creamy appearance and
mouthfeel. A sensory study or studies that would assess the effects of
supplementation on the consumer acceptance would be necessary. It
would also be important to correlate these sensory characteristics to
rheological and physical examinations for practical purpose. Despite its
importance, this area has not been widely studied. Since human
perception of the sensory quality of fermented milk may vary among
groups of people or cultures, the study on this particular topic can be
expected to be broad.
5. physiological importance - the efficacy of nutrient supplementation was
affected by several factors, including the intake or proportion of mixed
supplements. The effect of calcium on bone strengthening may be
affected by the concentration of whey proteins added into the fermented
milk mix. Similarly, the effect of whey protein on preventing muscular

165
degeneration may also be influenced by calcium concentration being
added into the fermented milk. Some fermented milk strains,
exopolysaccharides, or bioactive peptides released by digestion of whey
proteins may have potential immunomodulatory properties. The extent
of the health benefits of supplemented EPS-containing fermented milk
thus needs to be explored.

166
9 List of References

167
Achanta, K., K. J. Aryana, and C. A. Boeneke. 2007. Fat free plain set yogurts
fortified with various minerals. LWT - Food Science and Technology 40(3):424-
429.
Alander, M., I. De Smet, L. Nollet, W. Verstraete, A. von Wright, and T. Mattila-
Sandholm. 1999. The effect of probiotic strains on the microbiota of the Simulator
of the Human Intestinal Microbial Ecosystem (SHIME). International Journal of
Food Microbiology 46(1):71-79.
Alting, A. C., R. J. Hamer, C. G. de Kruif, M. Paques, and R. W. Visschers. 2003.
Number of thiol groups rather than the size of the aggregates determines the
firmness of cold set whey protein gels. Food Hydrocolloids 17(4):469-479.
Amatayakul, T., A. L. Halmos, F. Sherkat, and N. P. Shah. 2006. Physical
characteristics of yoghurts made using exopolysaccharide-producing starter
cultures and varying casein to whey protein ratios. International Dairy Journal
16(1):40-51.
Anema, S. G. 2008. Effect of milk solids concentration on the gels formed by the
acidification of heated pH-adjusted skim milk. Food Chemistry 108(1):110-118.
Apostolidis, E., Y. I. Kwon, and K. Shetty. 2006. Potential of select yogurts for
diabetes and hypertension management. Journal of Food Biochemistry 30(6):699-
717.
Aslim, B., Y. Beyatli, and Z. N. Yuksekdag. 2006. Productions and monomer
compositions of exopolysaccharides by Lactobacillus delbrueckii subsp
bulgaricus and Streptococcus thermophilus strains isolated from traditional home-
made yoghurts and raw milk. International Journal of Food Science and
Technology 41(8):973-979.

168
Aslim, B., Z. N. Yuksekdag, Y. Beyatli, and N. Mercan. 2005. Exopolysaccharide
production by Lactobacillus delbrueckii subsp bulgaricus and Streptococcus
thermophilus strains under different growth conditions. World Journal of
Microbiology & Biotechnology 21(5):673-677.
Barbut, S. 2006. Effects of caseinate, whey and milk powders on the texture and
microstructure of emulsified chicken meat batters. LWT-Food Science and
Technology 39(6):660-664.
Beaulieu, M., Y. Pouliot, and M. Pouliot. 1999. Composition and microstructure
of casein: whey protein aggregates formed by heating model solutions at 95°C.
International Dairy Journal 9(3-6):393-394.
Bellisle, F. and C. Perez. 1994. Low-energy substitutes for sugars and fats in the
human diet: Impact on nutritional regulation. Neuroscience & Biobehavioral
Reviews 18(2):197-205.
Belyakova, L. E., A. S. Antipova, M. G. Semenova, E. Dickinson, L. Matia
Merino, and E. N. Tsapkina. 2003. Effect of sucrose on molecular and interaction
parameters of sodium caseinate in aqueous solution: relationship to protein
gelation. Colloids and Surfaces B: Biointerfaces 31(1-4):31-46.
Benezech, T. and J. F. Maingonnat. 1994. Characterization of the rheological
properties of yoghurt--A review. Journal of Food Engineering 21(4):447-472.
Benkerroum, N., R. Oubel, and L. Ben Mimoun. 2002. Behavior of Listeria
monocytogenes and Staphylococcus aureus in yogurt fermented with a
bacteriocin-producing thermophilic starter. Journal of Food Protection 65(5):799-
805.
Bernal-Pacheco, O. and G. C. Roman. 2007. Environmental vascular risk factors:
New perspectives for stroke prevention. Journal of the Neurological Sciences
262(1-2):60-70.
Boels, I. C., R. van Kranenburg, J. Hugenholtz, M. Kleerebezem, and W. M. de
Vos. 2001. Sugar catabolism and its impact on the biosynthesis and engineering of
169
exopolysaccharide production in lactic acid bacteria. International Dairy Journal
11(9):723-732.
Bonjour, J. P., T. Schurch, T. Chevalley, P. Ammann, and R. Rizzoli. 1997.
Protein intake, IGF-1 and osteoporosis. Canadian Journal of Applied Physiology
7(Supplement 3):S36-S42.
Bosscher, D., M. van Cailie-Bertrand, and H. Deelstra. 2003. Do thickening
properties of locust bean gum affect the amount of calcium, iron and zinc avilable
for absorption from instant formula? In vitro studies. International Journal of Food
Science and Nutrition 54(4):261-268.
Bourne, M. C. 2002. Food Texture and Viscosity: Concept and Measurement.
Elsevier Science and Technology Books.
Bouzar, F., J. Cerning, and M. Desmazeaud. 1997. Exopolysaccharide production
and texture-promoting abilities of mixed-strain starter cultures in yogurt
production. Journal of Dairy Science 80:2310-2317.
Bowman, S. A. and C. A. Davis. 1996. Comparison of food related behavior of
individuals based on their fat intake. Journal of the American Dietetic Association
96(9, Supplement 1):A103-158.
Boye, J. I., I. Alli, A. A. Ismail, B. F. Gibbs, and Y. Konishi. 1995. Factors
affecting molecular characteristics of whey protein gelation. International Dairy
Journal 5(4):337-353.
Braga, A. L. M. and R. L. Cunha. 2004. The effects of xanthan conformation and
sucrose concentration on the rheological properties of acidified sodium caseinate-
xanthan gels. Food Hydrocolloids 18:977-986.
Briczinski, E. P. and R. F. Roberts. 2002. Production of an exopolysaccharide-
containing whey protein concentrate by fermentation of whey. Journal of Dairy
Science 85(12):3189-3197.

170
Calvo, M. S., S. J. Whiting, and C. N. Barton. 2004. Vitamin D fortification in the
United States and Canada: current status and data needs. American Journal of
Clinical Nutrition 80(6):1710S-1716S.
Canzi, E., R. Zanchi, P. Camaschella, A. Cresci, G. F. Greppi, C. Orpianesi, M.
Serrantoni, and A. Ferrari. 2000. Modulation by lactic-acid bacteria of the
intestinal ecosystem and plasma cholesterol in rabbits fed a casein diet. Nutrition
Research 20(9):1329-1340.
Cayot, P., F. Schenker, G. Houze, C. Sulmont-Rosse, and B. Colas. 2008.
Creaminess in relation to consistency and particle size in stirred fat-free yogurt.
International Dairy Journal 18(3):303-311.
Cerning, J. 1990. Exocellular polysaccharides produced by lactic acid bacteria.
FEMS Microbiology Letters 87(1-2):113-130.
Cesena, C., L. Morelli, M. Alander, T. Siljander, E. Tuomola, S. Salminen, T.
Mattila-Sabdholm, T. Vilpponen-Salmela, and A. Von Wright. 2001.
Lactobacillus crispatus and its nonaggregating mutant in human colonization
trials. Journal of Dairy Science 84:1001-1010.
Chatterton, D. E. W., G. Smithers, P. Roupas, and A. Brodkorb. 2006. Bioactivity
of β-lactoglobulin and α-lactalbumin--Technological implications for processing.
International Dairy Journal 16(11):1229-1240.
Chen, X. D. 2007. Conformability of the kinetics of cohesion/stickiness
development in amorphous sugar particles to the classical Arrhenius law. Journal
of Food Engineering 79(2):675-680.
Chervaux, C., S. D. Ehrlich, and E. Maguin. 2000. Physiological study of
Lactobacillus delbrueckii subsp bulgaricus strains in a novel chemically defined
medium. Applied and Environmental Microbiology 66(12):5306-5311.
Choi, Y. H., S. T. Lim, and B. Yoo. 2004. Measurement of dynamic rheology
during ageing of gelatine-sugar composites. International Journal of Food Science
and Technology 39(9):935-945.

171
Christiansen, K. F., T. Krekling, A. Kohler, G. Vegarud, T. Langsrud, and B.
Egelandsdal. 2006. Microstructure and sensory properties of high pressure
processed dressings stabilized by different whey proteins. Food Hydrocolloids
20(5):650-662.
Chung, C. H. and D. F. Day. 2002. Glucooligosaccharides from Leuconostoc
mesenteroides B-742 (ATCC 13146). Journal of Industrial Microbiology and
Biotechnology 29(4):196-199.
Clark, A. H., G. M. Kavanagh, and S. B. Ross-Murphy. 2001. Globular protein
gelation - theory and experiment. Food Hydrocolloids 15(4-6):383-400.
Cook, A. J. and J. E. Friday. 2003. Food mixture or ingredient sources for dietary
calcium: Shifts in food group contributions using four grouping protocols. Journal
of the American Dietetic Association 103(11):1513-1519.
Cook, J. 2003. Mixed bag: yogurt continues to enjoy strong consumer demand,
while cottage cheese struggles to stay afloat (cultured products). 1 August 2003
ed. Dairy Field.
Cross, M. L., L. M. Stevenson, and H. S. Gill. 2001. Anti-allergy properties of
fermented foods: an important immunoregulatory mechanism of lactic acid
bacteria? International Immunopharmacology 1(5):891-901.
Da Cruz, F., F. Chevoir, D. Bonn, and P. Coussot. 2002a. Viscosity bifurcation in
granular materials, foams, and emulsions. Physical Review E 66:051305-051301-
051305-051307.
Da Cruz, F., F. Chevoir, D. Bonn, and P. Coussot. 2002b. Viscosity bifurcation in
granular materials, foams, and emulsions. Physical Review E 66:051305-051301 -
051305-051307.
Dairy-Facts. 2004. Dairy Facts. International Dairy Foods Association,
Washington, D.C.

172
Dalgleish, D. G., P. A. Spagnulo, and H. D. Goff. 2004. A possible structure of
the casein micelle based on high-resolution field-emission scanning electron
microscopy. International Dairy Journal 14:1025-1031.
Davis, J. P. and E. A. Foegeding. 2007. Comparisons of the foaming and
interfacial properties of whey protein isolate and egg white proteins. Colloids and
Surfaces B: Biointerfaces 54(2):200-210.
de Kruif, C. G. 1999. Casein micelle interactions. International Dairy Journal 9(3-
6):183-188.
de Kruif, C. G. and R. Tuinier. 2001. Polysaccharide protein interactions. Food
Hydrocolloids 15(4-6):555-563.
de Kruif, K. G. and R. Tuinier. 1999. Whey protein aggregates and their
intercation with exo-polysaccharides. International Journal of Food Science and
Technology 34:487-492.
de Vin, F., P. Radstrom, L. Herman, and L. de Vuyst. 2005. Molecular and
biochemical analysis of the galactose phenotype of dairy Streptococcus
thermophilus strains reveals four different fermentation profiles. Applied and
Environmental Microbiology 71(7):3659-3667.
De Vuyst, L. and B. Degeest. 1999. Heteropolysaccharides from lactic acid
bacteria. FEMS Microbiology Reviews 23(2):153-177.
De Vuyst, L., M. Zamfir, F. Mozzi, T. Adriany, V. Marshall, B. Degeest, and F.
Vaningelgem. 2003. Exopolysaccharide-producing Streptococcus thermophilus
strains as functional starter cultures in the production of fermented milks.
International Dairy Journal 13(8):707-717.
de Wijk, R. A., M. E. J. Terpstra, A. M. Janssen, and J. F. Prinz. 2006. Perceived
creaminess of semi-solid foods. Trends in Food Science & Technology 17(8):412-
422.

173
De Wit, J. N. and G. Klarenbeek. 1984. Effects of heat treatments on structure and
solubility of whey protein. Journal of Dairy Science 67:2701-2710.
De Witt, J. N. 1998. Nutritional and functional characteristics pf whey proteins in
food products. Journal of Dairy Science 81:597-608.
Defra. 2007. http://www.defra.gov.uk/ 20 March 2009
Degeest, B. and L. de Vuyst. 2000a. Correlation of activities of the enzymes a-
phosphoglucomutase, UDP-galactose 4-epimerase, and UDP-glucose
pyrophosphorylase with exopolysaccharide biosynthesis by Streptococcus
thermophilus LY03. Applied and Environmental Microbiology 66(8):3519-3527.
Degeest, B. and L. De Vuyst. 2000b. Correlation of activities of the enzymes
alpha-phosphoglucomutase, UDP-galactose 4-epimerase, and UDP-glucose
pyrophosphorylase with exopolysaccharide biosynthesis by Streptococcus
thermophilus LY03. Applied and Environmental Microbiology 66(8):3519-3527.
Degeest, B., F. Mozzi, and L. De Vuyst. 2002. Effect of medium composition and
temperature and pH changes on exopolysaccharide yields and stability during
Streptococcus thermophilus LY03 fermentations. International Journal of Food
Microbiology 79(3):161-174.
Dogan, S. F., S. Sahin, and G. Summu. 2005. Effects of batters containing
different protein types on the quality of deep-fat-fried chicken nuggets. European
Food Research Technology 220:502-508.
Donkor, O. N., A. Henriksson, T. Vasiljevic, and N. P. Shah. 2005. Probiotic
strains as starter cultures improve angiotensin-converting enzyme inhibitory
activity in soy yogurt. Journal of Food Science 70(8):M375-M381.
Donkor, O. N., A. Henriksson, T. Vasiljevic, and N. P. Shah. 2006. Effect of
acidification on the activity of probiotics in yoghurt during cold storage.
International Dairy Journal 16(10):1181-1189.
174
Drago, L., M. R. Gismondo, A. Lombardi, C. de Haen, and L. Gozzini. 1997.
Inhibition of in vitro growth of enteropathogens by new Lactobacillus isolates of
human intestinal origin. FEMS Microbiology Letters 153:455-463.
Dubois, M., K. A. Gilles, K. Hamilton, P. A. Rebers, and F. Smith. 1956.
Colorimetric method for the determination of sugars and related substances.
Analytical Chemistry 28:350-356.
Duenas, M., A. Munduate, A. Perea, and A. Irastorza. 2003. Exopolysaccharide
production by Pediococcus damnosus 2.6 in a semidefined medium under
different growth conditions. International Journal of Food Microbiology 87(1-
2):113-120.
Faber, E. J., J. P. Kamerling, and J. F. G. Vliegenthart. 2001. Structure of the
extracellular polysaccharide produced by Lactobacillus delbrueckii subsp.
bulgaricus 291. Carbohydrate Research 331(2):183-194.
Fitzsimons, S. M., D. M. Mulvihill, and E. R. Morris. 2007. Denaturation and
aggregation processes in thermal gelation of whey proteins resolved by
differential scanning calorimetry. Food Hydrocolloids 21(4):638-644.
Folkenberg, D. M., P. Dejmek, A. Skriver, H. S. Guldager, and R. Ipsen. 2006a.
Sensory and rheological screening of exopolysaccharide producing strains of
bacterial yoghurt cultures. International Dairy Journal 16(2):111-118.
Folkenberg, D. M., P. Dejmek, A. Skriver, and R. Ipsen. 2005. Relation between
sensory texture properties and exopolysaccharide distribution in set and in stirred
yoghurts produced with different starter cultures. Journal of Texture Studies
36(2):174-189.
Folkenberg, D. M., P. Dejmek, A. Skriver, and R. Ipsen. 2006b. Interactions
between EPS-producing Streptococcus thermophilus strains in mixed yoghurt
cultures. Journal of Dairy Research 73(4):385-393.
Folkenberg, D. M. and M. Martens. 2003. Sensory properties of low fat yoghurts.
Part A: Effect of fat content, fermentation culture and addition of non-fat dry milk

175
on the sensory properties of plain yoghurts. Milchwissenschaft-Milk Science
International 58(1/2):48-51.
Fox, M. K., S. Pac, B. Devaney, and L. Jankowski. 2004. Feeding infants and
toddlers study: what foods are infants and toddlers eating? Journal of the
American Dietetic Association 104(Supplement 1):22-30.
Frost, M. B. and T. Janhoj. 2007. Understanding creaminess. International Dairy
Journal 17(11):1298-1311.
FSANZ. 2003. Australia New Zealand Food Standards Code. Vol. Standard 2.5.3.
C. O. Australia, ed. Food Standards Australia and New Zealand.
Gallagher, E., T. R. Gormley, and E. K. Arendt. 2003. Crust and crumb
characteristics of gluten free breads. Journal of Food Engineering 56(2-3):153-
161.
Gambus, H., D. Gumul, and L. Juszczak. 2004. Rheological properties of pastes
obtained from starches derived from immature cereal kernels. Starch-Starke
56(6):225-231.
Gancel, F. and G. Novel. 1994. Exopolysaccharide production by Streptococcus-
salivarius ssp thermophilus cultures. 2. Distinct modes of polymer production and
degradation among clonal variants Journal of Dairy Science 77(3):689-695.
Ganji, V. and M. R. Kafai. 2004. Frequent consumption of milk, yogurt, cold
breakfast cereals, peppers, and cruciferous vegetables and intakes of dietary folate
and riboflavin but not vitamins B-12 and B-6 are inversely associated with serum
total homocysteine concentrations in the US population. American Journal of
Clinical Nutrition 80(6):1500-1507.
Gill, J. J., P. M. Sabour, K. E. Leslie, and M. W. Griffiths. 2006. Bovine whey
proteins inhibit the interaction of Staphylococcus aureus and bacteriophage K.
Journal of Applied Microbiology 101(2):377-386.

176
Ginovart, M., D. Lopez, J. Valls, and M. Silbert. 2002. Simulation modelling of
bacterial growth in yoghurt. International Journal of Food Microbiology 73(2-
3):415-425.
Girard, M. and C. Schaffer-Lequart. Attractive interactions between selected
anionic exopolysaccharides and milk proteins. Food Hydrocolloids In Press,
Corrected Proof:1040.
Girard, M. and C. Schaffer-Lequart. 2007. Gelation and resistance to shearing of
fermented milk: Role of exopolysaccharides. International Dairy Journal
17(6):666-673.
Goh, K. K. T., R. D. Haisman, and H. Singh. 2005. Examination of
exopolysaccharide produced by Lactobacillus delbrueckii subsp bulgaricus using
confocal laser scanning and scanning electron microscopy techniques. Journal of
Food Science 70(4):M224-M229.
Goldscher, R. L. and S. Edelstein. 1996. Calcium citrate: A revised look at
calcium fortification. Food Technology 50:96-98.
Gonzalez-Martinez, C., M. Becerra, M. Chafer, A. Albors, J. M. Carot, and A.
Chiralt. 2002. Influence of substituting milk powder for whey powder on yoghurt
quality. Trends in Food Science & Technology 13(9-10):334-340.
Gorret, N., C. Renard, M. H. Famelart, J. L. Maubois, and J. L. Doublier. 2003.
Rheological characterization of the EPS produced by P-acidi-propionici on milk
microfiltrate. Carbohydrate Polymers 51(2):149-158.
Guarner, F., G. Perdigon, G. Corthier, S. Salminen, B. Koletzko, and L. Morelli.
2005. Should yoghurt cultures be considered probiotic? British Journal of
Nutrition 93(6):783-786.
Guggisberg, D., P. Eberhard, and B. Albrecht. 2007. Rheological characterization
of set yoghurt produced with additives of native whey proteins. International
Dairy Journal 17(11):1353-1359.

177
Gurr, M. I. 1987. Nutritional aspects of fermented milk products. FEMS
Microbiology Letters 46(3):337-342.
Guyomarc'h, F., C. Queguiner, A. J. R. Law, D. S. Horne, and D. G. Dalgleish.
2003. Role of the soluble and micelle-bound heat-induced protein aggregates on
network formation in acid skim milk gels. Journal of Agricultural and Food
Chemistry 51(26):7743-7750.
Guzel-Seydim, Z. B., E. Sezgin, and A. C. Seydim. 2005. Influences of
exopolysaccharide producing cultures on the quality of plain set type yogurt. Food
Control 16(3):205-209.
Ha, E. and M. B. Zemel. 2003. Functional properties of whey, whey components,
and essential amino acids: mechanisms underlying health benefits for active
people (review). The Journal of Nutritional Biochemistry 14(5):251-258.
Haque, A., R. K. Richardson, and E. R. Morris. 2001. Effect of fermentation
temperature on the rheology of set and stirred yogurt. Food Hydrocolloids 15(4-
6):593-602.
Hassan, A. N., M. Corredig, and J. F. Frank. 2001a. Viscoelastic properties of
yogurt made with ropy and non-ropy exopolysaccharides producing cultures.
Milchwissenschaft-Milk Science International 56(12):684-687.
Hassan, A. N., M. Corredig, and J. F. Frank. 2002. Capsule formation by nonropy
starter cultures affects the viscoelastic properties of yogurt during structure
formation. Journal of Dairy Science 85:716-720.
Hassan, A. N., J. F. Frank, and M. Elsoda. 2003a. Observation of bacterial
exopolysaccharide in dairy products using cryo-scanning electron microscopy.
International Dairy Journal 13(9):755-762.
Hassan, A. N., J. F. Frank, M. A. Farmer, K. A. Schmidt, and S. I. Shalabi. 1995a.
Formation of yogurt microstructure and three-dimensional visualization as
determined by confocal scanning laser microscopy. Journal of Dairy Science
78(12):2629-2636.

178
Hassan, A. N., J. F. Frank, M. A. Farmer, K. A. Schmidt, and S. I. Shalabi. 1995b.
Observation of encapsulated lactic acid bacteria using confocal scanning laser
microscopy. Journal of Dairy Science 78(12):2624-2628.
Hassan, A. N., J. F. Frank, K. A. Schmidt, and S. I. Shalabi. 1996a. Rheological
properties of yogurt made with encapsulated non-ropy lactic cultures. Journal
Dairy Science 79(12):2091-2097.
Hassan, A. N., J. F. Frank, K. A. Schmidt, and S. I. Shalabi. 1996b. Textural
properties of yogurt made with encapsulated non-ropy Lactic Cultures. Journal
Dairy Science 79(12):2098-2103.
Hassan, A. N., J. F. Frank, and S. I. Shalabi. 2001b. Factors affecting capsule size
and production by lactic acid bacteria used as dairy starter cultures. International
Journal of Food Microbiology 64(1-2):199-203.
Hassan, A. N., R. Ipsen, T. Janzen, and K. B. Qvist. 2003b. Microstructure and
rheology of yogurt made with cultures differing only in their ability to produce
exopolysaccharides. Journal Dairy Science 86(5):1632-1638.
Heaney, R. P. 2007. Effects of protein on the calcium economy. International
Congress Series 1297:191-197.
Hertzler, S. R. and S. M. Clancy. 2003. Kefir improves lactose digestion and
tolerance in adults with lactose maldigestion. Journal of the American Dietetic
Association 103(5):582-587.
Hess, S. J., R. F. Roberts, and G. R. Ziegler. 1997. Rheological properties of
nonfat yogurt stabilized using Lactobacillus delbrueckii ssp. bulgaricus producing
exopolysaccharide or using commercial stabilizer systems. Journal of Dairy
Science 80:252-263.
Hollar, C., N. Parris, A. Hsieh, and K. D. Cokcley. 1995. Factors affecting the
denaturation and aggregation of whey proteins in heated whey protein concentrate
mixtures. Journal of Dairy Science 78:260-267.

179
Horne, D. S. 1998. Casein interactions: casting light on the black boxes, the
structure in dairy products. International Dairy Journal 8:171-177.
Horne, D. S. 2002. Casein structure, self-assembly and gelation. Current Opinion
in Colloid & Interface Science 7(5-6):456-461.
Horne, D. S. 2006. Casein micelle structure: Models and muddles. Current
Opinion in Colloid & Interface Science 11(2-3):148-153.
Hugenholtz, J. and M. Kleerebezem. 1999. Metabolic engineering of lactic acid
bacteria: overview of the approaches and results of pathway rerouting involved in
food fermentations. Current Opinion in Biotechnology 10(5):492-497.
Hugenholtz, J. and E. J. Smid. 2002. Nutraceutical production with food-grade
microorganisms. Current Opinion in Biotechnology 13(5):497-507.
Iametti, S., B. De Gregori, G. Vecchio, and F. Bonomi. 1996. Modifications occur
at different structural levels during heat-denaturation of β-lactoglobulin. European
Journal of Biochemistry 237:106-112.
IDF. 1992. General standard of identity for fermented milk. Vol. Standard
No.162. I. D. Federation, ed. International Dairy Federation, Brussels.
Innocente, N., D. Comparin, and C. Corradini. 2002. Proteose-peptone whey
fraction as emulsifier in ice-cream preparation. International Dairy Journal
12(1):69-74.
Isleten, M. and Y. Karagul-Yuceer. 2006. Effects of dried dairy ingredients on
physical and sensory properties of non-fat yogurt. Journal of Dairy Science
89(8):2865-2872.
Jacobucci, H. B., V. C. Sgarbieri, N. F. G. P. Dias, P. Borges, and C. Tanikawa.
2001. Impact of different dietary protein on rat growth, blood serum lipids and
protein and liver cholesterol. Nutrition Research 21(6):905-915.

180
Jaros, D., A. Haque, W. Kneifel, and H. Rohm. 2002a. Influence of the starter
culture on the relationship between dry matter content and physical properties of
stirred yogurt. Milchwissenschaft-Milk Science International 57(8):447-450.
Jaros, D., C. Heidig, and H. Rohm. 2007. Enzymatic modification through
microbial transglutaminase enhances the viscosity of stirred yogurt. Journal of
Texture Studies 38(2):179-198.
Jaros, D. and H. Rohm. 2003. The rheology and textural properties of yoghurt. in
Semi-solid Foods. Vol. 1. B. McKenna, ed. CRC Press, Washington D.C.
Jaros, D., H. Rohm, A. Haque, C. Bonaparte, and W. Kneifel. 2002b. Influence of
the starter culture on the relationship between dry matter content and physical
properties of set-style yogurt. Milchwissenschaft-Milk Science International
57(6):325-328.
Jaworska, D., B. Waszkiewicz-Robak, W. Kolanowski, and F. Swiderski. 2005.
Relative importance of texture properties in the sensory quality and acceptance of
natural yoghurts. International Journal of Dairy Technology 58(1):39-46.
Ju, Z. Y. and A. Kilara. 1998. Properties of gels induced by heat, protease,
calcium salt, and acidulant from calcium ion-aggregated whey protein isolate.
Journal of Dairy Science 81(5):1236-1243.
Jumah, R. Y., B. Abu-Jdayil, and R. R. Shaker. 2001. Effect of type and level of
starter culture on the rheological properties of set yogurt during gelation process.
International Journal of Food Properties 4(3):531-544.
Kahkonen, P. and H. Tuorila. 1999. Consumer responses to reduced and regular
fat content in different products: effects of gender, involvement and health
concern. Food Quality and Preference 10(2):83-91.
Kalkwarf, H. J. 2007. Childhood and adolescent milk intake and adult bone
health. International Congress Series 1297:39-49.
181
Kalviainen, N., K. Roininen, and H. Tuorila. 2003. The relative importance of
texture, taste and aroma on a yogurt-type snack food preference in the young and
the elderly. Food Quality and Preference 14(3):177-186.
Kavanagh, G. M., A. H. Clark, and S. B. Ross-Murphy. 2000. Heat-induced
gelation of globular proteins: 4. Gelation kinetics of low pH beta-lactoglobulin
gels. Langmuir 16(24):9584-9594.
Kealy, T. 2006. Application of liquid and solid rheological technologies to the
textural characterisation of semi-solid foods. Food Research International
39(3):265-276.
Kerstetter, J. E., E. D. Gaffney, K. O. O'Brien, D. M. Caseria, and K. L. Insogna.
2007. Dietary protein increases intestinal calcium absorption and improves bone
balance: An hypothesis. International Congress Series 1297:204-216.
Kessenich, C. R. 2007. Calcium and Vitamin D Supplementation for
Postmenopausal Bone Health. The Journal for Nurse Practitioners 3(3):155-159.
Kilcast, D. 2004. Measuring consumer perceptions of texture: an overview. in
Texture in Food. Vol. 2. D. Kilcast, ed. Woodhead Publishing Limited,
Cambridge, England.
Kim, E. H., T. N. Horner, and V. Utermohlen. 1997. Food Consumption Patterns
and Factors Affecting Food Choices, and Their Relationship to Vegetarianism,
Dieting Status, and Body Mass Index in Female College Students. Journal of the
American Dietetic Association 97(9, Supplement 1):A40-317.
Kimmel, S. A. and R. F. Roberts. 1998. Development of a growth medium
suitable for exopolysaccharide production by Lactobacillus delbrueckii ssp.
bulgaricus RR. International Journal of Food Microbiology 40(1-2):87-92.
Kitazawa, H., H. Watanabe, T. Shimosato, Y. Kawai, T. Itoh, and T. Saito. 2003.
Immunostimulatory oligonucleotide, CpG-like motif exists in Lactobacillus
delbrueckii ssp. bulgaricus NIAI B6. International Journal of Food Microbiology
85(1-2):11-21.
182
Kitts, D. D. and W. Kwong. 2004. Calcium bioavailability of dairy components.
in Handbook of Functional Dairy Products. C. Shortt and J. O'Brien, ed. CRC
Press, Washington, D.C.
Kleerebezem, M., P. Hols, and J. Hugenholtz. 2000. Lactic acid bacteria as a cell
factory: rerouting of carbon metabolism in Lactococcus lactis by metabolic
engineering. Enzyme and Microbial Technology 26(9-10):840-848.
Knudsen, J. C., A. O. Karlsson, R. Ipsen, and L. H. Skibsted. 2006. Rheology of
stirred acidified skim milk gels with different particle interactions. Colloids and
Surfaces A: Physicochemical and Engineering Aspects 274(1-3):56-61.
Kokini, J. L. 1987. The physical basis of liquid food texture and texture-taste
interactions. Journal of Food Engineering 6(1):51-81.
Kristo, E., C. G. Biliaderis, and N. Tzanetakis. 2003. Modelling of the
acidification process and rheological properties of milk fermented with a yogurt
starter culture using response surface methodology. Food Chemistry 83(3):437-
446.
Kwon, G. S., S. H. Moon, S. D. Hong, H. M. Lee, T. I. Mheen, H. M. Oh, and B.
D. Yoon. 1996. Rheological properties of extracellular polysaccharide, Pestan,
produced by Pestalotiopsis sp. Biotechnology Letters 18(12):1465-1470.
Lambo-Fodje, A. M., M. Leeman, K. G. Wahlund, M. Nyman, R. Oste, and H.
Larsson. 2007. Molar mass and rheological characterisation of an
exopolysaccharide from Pediococcus damnosus 2.6. Carbohydrate Polymers
68(3):577-586.
Law, A. J. R. and J. Leaver. 1999. Factors affecting the heat denaturation of whey
proteins in cows' milk. International Dairy Journal 9(3-6):407-408.
Lee, W.-J. and J. A. Lucey. 2004a. Rheological properties, whey separation, and
microstructure in set-style yogurt: effects of heating temperature and incubation
temperature. Journal of Texture Studies 34:515-536.

183
Lee, W. J. and J. A. Lucey. 2004b. Rheological properties, whey separation, and
microstructure in set-style yogurt: Effects of heating temperature and incubation
temperature. Journal of Texture Studies 34(5-6):515-536.
Levander, F. and P. Radstrom. 2001. Requirement for phosphoglucomutase in
exopolysaccharide biosynthesis in glucose- and lactose-utilizing Streptococcus
thermophilus. Applied and Environmental Microbiology 67(6):2734-2738.
Looijesteijn, P. J. and J. Hugenholtz. 1999. Uncoupling of growth and
exopolysaccharide production by Lactococcus lactis subsp. cremoris NIZO B40
and optimization of its synthesis. Journal of Bioscience and Bioengineering
88(2):178-182.
Looijesteijn, P. J., L. Trapet, E. de Vries, T. Abee, and J. Hugenholtz. 2001.
Physiological function of exopolysaccharides produced by Lactococcus lactis.
International Journal of Food Microbiology 64(1-2):71-80.
Lorenzen, P. C. and K. Schrader. 2006. A comparative study of the gelation
properties of whey protein concentrate and whey protein isolate. Lait 86(4):259-
271.
Lorenzo, G., N. Zaritzky, and A. Califano. 2008. Optimization of non-fermented
gluten-free dough composition based on rheological behavior for industrial
production of "empanadas" and pie-crusts. Journal of Cereal Science 48(1):224-
231.
Lourens-Hattingh, A. and B. C. Viljoen. 2001. Yogurt as probiotic carrier food.
International Dairy Journal 11(1-2):1-17.
Lucas, A., I. Sodini, C. Monnet, P. Jolivet, and G. Corrieu. 2004. Probiotic cell
counts and acidification in fermented milks supplemented with milk protein
hydrolysates. International Dairy Journal 14(1):47-53.
Lucey, J. A. 2001. The relationship between rheological parameters and whey
separation in milk gels. Food Hydrocolloids 15(4-6):603-608.

184
Lucey, J. A. 2002. ADSA Foundation Scholar Award, Formation and physical
properties of milk protein gels. Journal of Dairy Science 85:281-294.
Lucey, J. A., M. E. Johnson, and D. S. Horne. 2003. Invited review: Perspectives
on the basis of the rheology and texture properties of cheese. Journal of Dairy
Science 86(9):2725-2743.
Lucey, J. A., P. A. Munro, and H. Singh. 1999. Effects of heat treatment and
whey protein addition on the rheological properties and structure of acid skim
milk gels. International Dairy Journal 9(3-6):275-279.
Lucey, J. A. and H. Singh. 1997. Formation and physical properties of acid milk
gels: a review. Food Research International 30(7):529-542.
Lucey, J. A., M. Tamehana, H. Singh, and P. A. Munro. 1998. A comparison of
the formation, rheological properties and microstructure of acid skim milk gels
made with a bacterial culture or glucono-δ-lactone. Food Research International
31(2):147-155.
Lucey, J. A., M. Tamehana, H. Singh, and P. A. Munro. 2001. Effect of heat
treatment on the physical properties of milk gels made with both rennet and acid.
International Dairy Journal 11(4-7):559-565.
Lucey, J. A., C. T. Teo, P. A. Munro, and H. Singh. 1997a. Rheological properties
at small (dynamic) and large (yield) deformation of acid gels made from heated
milk. Journal of Dairy Research 64:591-600.
Lucey, J. A., C. T. Teo, P. A. Munro, and H. Singh. 1997b. Rheological properties
at small (dynamic) and large (yield) deformations of acid gels made from heated
milk. Journal of Dairy Research 64:591-600.
Lucey, J. A., T. van Vliet, K. Grolle, T. Geurts, and P. Walstra. 1997c. Properties
of acid casein gels made by acidification with glucono-δ-lactone. 1. Rheological
properties. International Dairy Journal 7(6-7):381-388.

185
Lucey, J. A., T. van Vliet, K. Grolle, T. Geurts, and P. Walstra. 1997d. Properties
of acid casein gels made by acidification with glucono-δ-lactone. 2. Syneresis,
permeability and microstructural properties. International Dairy Journal 7(6-
7):389-397.
Maccio, D., A. Fabra, and S. Castro. 2002. Acidity and calcium interaction affect
the growth of Bradyrhizobium sp and the attachment to peanut roots. Soil Biology
& Biochemistry 34(2):201-208.
Macedo, M. G., C. Lacroix, N. J. Gardner, and C. P. Champagne. 2002. Effect of
medium supplementation on exopolysaccharide production by Lactobacillus
rhamnosus RW-9595M in whey permeate. International Dairy Journal 12(5):419-
426.
Macosko, C. W. 1994. Rheology: Principles, Measurements, and Applications.
VCH Publishers, Inc., Minneapolis.
Madureira, A. R., C. I. Pereira, A. M. P. Gomes, M. E. Pintado, and F. X.
Malcata. 2007. Bovine whey proteins - Overview on their main biological
properties. Food Research International 40(10):1197-1211.
Makino, S., S. Ikegami, H. Kano, T. Sashihara, H. Sugano, H. Horiuchi, T. Saito,
and M. Oda. 2006. Immunomodulatory effects of polysaccharides produced by
Lactobacillus delbrueckii ssp. bulgaricus OLL1073R-1. Journal of Dairy Science
89:2873-2881.
Marshall, V. M., H. Dunn, M. Elvin, N. McLay, Y. Gu, and A. P. Laws. 2001a.
Structural characterisation of the exopolysaccharide produced by Streptococcus
thermophilus EU20. Carbohydrate Research 331(4):413-422.
Marshall, V. M., A. P. Laws, Y. Gu, F. Levander, P. Radstrom, L. de Vuyst, B.
Degest, Vaningelgem, F., H. Dunn, and M. Elvin. 2001b. Exopolysaccharide-
producing strains of thermophilic lactic acid bacteria cluster into groups according
to their EPS structure. Lertters in Applied Microbiology 32:433-437.

186
Marshall, V. M. and H. L. Rawson. 1999. Effects of exopolysaccharide-producing
strains of thermophilic lactic acid bacteria on the texture of stirred yoghurt.
International Journal of Food Science and Technology 34(2):137-143.
Mater, D. D. G., L. Bretigny, O. Firmesse, M.-J. Flores, A. Mogenet, J.-L.
Bresson, and G. Corthier. 2005. Streptococcus thermophilus and Lactobacillus
delbrueckii subsp. bulgaricus survive gastrointestinal transit of healthy volunteers
consuming yogurt. FEMS Microbiology Letters 250(2):185-187.
Matia-Merino, L., K. Lau, and E. Dickinson. 2004. Effects of low-methoxyl
amidated pectin and ionic calcium on rheology and microstructure of acid-induced
sodium caseinate gels. Food Hydrocolloids 18(2):271-281.
Matkovic, V., J. D. Landoll, N. E. Badenhop-Stevens, E. J. Ha, Z. Crncevic-Orlic,
B. Li, and P. K. Goel. 2007. Calcium supplementation and bone fragility fractures
during growth: A fracture risk assessment in a randomized controlled trial.
International Congress Series 1297:60-65.
McMahon, D. J. and W. R. McManus. 1998. Rethinking casein micelle structure
using electron microscopy. Journal of Dairy Science 81:2985-2993.
Mendoza, C., J. M. Peerson, K. H. Brown, and B. Lonnerdal. 2004. Effect of a
micronutrient fortificant mixture and 2 amounts of calcium on iron and zinc
absorption from a processed food supplement. American Journal of Clinical
Nutrition 79(2):244-250.
Meullenet, J.-F. 2002. Consumers and texture: understanding their perceptions
and preferences. in Texture in Food. Vol. 2. D. Kilcast, ed. Woodhead Publisher
Limited, Cambridge, England.
Minehira, K., S. Inoue, M. Nonaka, K. Osada, K. Yamada, and M. Sugano. 2000.
Effects of dietary protein type on oxidized cholesterol-induced alteration in age-
related modulation of lipid metabolism and indices of immune function in rats.
Biochimica et Biophysica Acta (BBA) - Molecular and Cell Biology of Lipids
1483(1):141-153.

187
Mora, D., M. G. Fortina, C. Parini, G. Ricci, M. Gatti, G. Giraffa, and P. L.
Manachini. 2002. Genetic diversity and technological properties of Streptococcus
thermophilus strains isolated from dairy products. Journal of Applied
Microbiology 93(2):278-287.
Moreira, M., A. Abraham, and G. de Antoni. 2000. Technological properties of
milks fermented with thermophilic lactic acid bacteria at suboptimal temperature.
Journal of Dairy Science 83:395-400.
Morr, C. V. 1979. Conformation and functionality of milk proteins. in
Functionality and Protein Structure. Vol. 92. A. Pour-El, ed. American Chemical
Society, Washington.
Morr, C. V., W. Hoffmann, and W. Buchheim. 2003. Use of applied air pressure
to improve the baking properties of whey protein isolates in angel food cakes.
Lebensmittel-Wissenschaft Und-Technologie-Food Science and Technology
36(1):83-90.
Mozzi, F., G. S. de Giori, and G. F. de Valdez. 2003. UDP-galactose 4-epimerase:
a key enzyme in exopolysaccharide formation by Lactobacillus casei CRL 87 in
controlled pH batch cultures. Journal of Applied Microbiology 94(2):175-183.
Mozzi, F., G. Rollan, G. Savoy de Giori, and G. Font de Valdez. 2001. Effect of
galactose and glucose on the exopolysaccharide production and the activities of
biosynthetic enzymes in Lactobacillus casei CRL 87. Journal of Applied
Microbiology 91(160-167).
Mozzi, F., F. Vaningelgem, E. M. Hebert, R. Van der Meulen, M. R. F. Moreno,
G. Font de Valdez, and L. de Vuyst. 2006. Diversity of heteropolysaccharide-
producing lactic acid bacterium strains and their biopolymers. Applied and
Environmental Microbiology 72(6):4431-4435.
Murat, D. and J. L. Kokini. 1986. Steady shear rheology and fluid mechanics of
four semi-solid foods. Journal of Food Science 51(3):541-546.

188
Myers, R. H. and D. C. Montgomery. 2002. Response Surface Methodolgy:
process and product optimization using design experiments. J. Wiley, New York.
Ofstad, R., O. Langsrud, T. E. Nyvold, G. Enersen, V. Host, E. Pilman Willers, B.
Nordvi, and B. Egelandsdal. 2005. Heat processed whey-protein food emulsions
and growth of shear-induced cracks during cooling. Lebensmittel-Wissenschaft
und-Technologie 38(1):29-39.
Oliveira, M. N., I. Sodini, F. Remeuf, and G. Corrieu. 2001. Effect of milk
supplementation and culture composition on acidification, textural properties and
microbiological stability of fermented milks containing probiotic bacteria.
International Dairy Journal 11(11-12):935-942.
Ouwehand, A. C., P. V. Kirjavainen, M. M. Gronlund, E. Isolauri, and S. J.
Salminen. 1999. Adhesion of probiotic micro-organisms to intestinal mucus.
International Dairy Journal 9(9):623-630.
Paddon-Jones, D., M. Sheffield-Moore, C. S. Katsanos, X.-J. Zhang, and R. R.
Wolfe. 2006. Differential stimulation of muscle protein synthesis in elderly
humans following isocaloric ingestion of amino acids or whey protein.
Experimental Gerontology 41(2):215-219.
Patocka, G., R. Cervenkova, and P. Jelen. 2004. Textural effects of soluble whey
protein isolate in stirred yogurt. Milchwissenschaft-Milk Science International
59(1-2):37-40.
Patocka, G., R. Cervenkova, S. Narine, and P. Jelen. 2006. Rheological behaviour
of dairy products as affected by soluble whey protein isolate. International Dairy
Journal 16(5):399-405.
Pedersen, J. B., P. Fojan, J. Sorensen, and S. B. Petersen. 2006. Towards control
of aggregational behaviour of alpha-lactalbumin at acidic pH. Journal of
Fluorescence 16(4):611-621.

189
Pelegrine, D. H. G. and C. A. Gasparetto. 2005. Whey proteins solubility as
function of temperature and pH. Lebensmittel-Wissenschaft und-Technologie
38(1):77-80.
Penna, A. L. B., K. Sivieri, and M. N. Oliveira. 2001. Relation between quality
and rheological properties of lactic beverages. Journal of Food Engineering
49(1):7-13.
Penna, A. L. B., G. Subbarao, and G. V. Barbosa-Canovas. 2007. High
hydrostatic pressure processing on microstructure of probiotic low-fat yogurt.
Food Research International 40(4):510-519.
Perales, S., R. Barbera, M. J. Lagarda, and R. Farre. 2006. Fortification of milk
with calcium: Effect on calcium bioavailability and interactions with iron and
zinc. Journal of Agricultural and Food Chemistry 54(13):4901-4906.
Perdigon, G., M. Locascio, M. Medici, A. P. D. Holgado, and G. Oliver. 2003.
Interaction of bifidobacteria with the gut and their influence in the immune
function. Biocell 27(1):1-9.
Perez, C., A.-M. Dalix, B. Guy-Grand, and F. Bellisle. 1994. Human Responses to
Five Concentrations of Sucrose in a Dairy Product: Immediate and Delayed
Palatability Effects. Appetite 23(2):165-178.
Petry, S., S. Furlan, M.-J. Crepeau, J. Cerning, and M. Desmazeaud. 2000a.
Factors affecting exopolysaccharide production by Lactobacillus delbrueckii
subsp. bulgaricus grown in a chamically defined medium. Applied and
Environmental Microbiology 66:3427-3431.
Petry, S., S. Furlan, M. J. Crepeau, J. Cerning, and M. Desmazeaud. 2000b.
Factors affecting exocellular polysaccharide production by Lactobacillus
delbrueckii subsp bulgaricus grown in a chemically defined medium. Applied and
Environmental Microbiology 66(8):3427-3431.
Petry, S., S. Furlan, E. Waghorne, L. Saulnier, J. Cerning, and E. Maguin. 2003.
Comparison of the thickening properties of four Lactobacillus delbrueckii subsp.

190
bulgaricus strains and physicochemical characterization of their
exopolysaccharides. FEMS Microbiology Letters 221(2):285-291.
Pham, P. L., I. Dupont, D. Roy, G. Lapointe, and J. Cerning. 2000. Production of
exopolysaccharide by Lactobacillus rhamnosus R and analysis of its enzymatic
degradation during prolong fermentation. Applied and Environmental
Microbiology 66:2302-2310.
Pilvi, T. K., R. Korpela, H. Vapaatalo, and E. Mervaala. 2006. High calcium diet
with whey protein inhibits weight gain in a model of diet induced obesity.
Atherosclerosis Supplements 7(3):431-431.
Poolman, B. 2002a. Transporter and their roles in LAB cell physiology. Antonie
van Leeuwenhoek 82:147-162.
Poolman, B. 2002b. Transporters and their roles in LAB cell physiology. Antonie
Van Leeuwenhoek International Journal of General and Molecular Microbiology
82(1-4):147-164.
Poolman, B., T. J. Royer, S. E. Mainzer, and B. F. Schmidt. 1989. Lactose
transport system of Streptococcus thermophilus: a hybrid protein with homology
to the melibiose carrier and enzyme III of phosphoenolpyruvate-dependent
phosphotransferase system. Journal of Bacteriology 171:244-253.
Puvanenthiran, A., R. P. W. Williams, and M. A. Augustin. 2002. Structure and
visco-elastic properties of set yoghurt with altered casein to whey protein ratios.
International Dairy Journal 12(4):383-391.
Rao, M. A. 1999. Rheology of Fluid and Semisolid Foods, Principles and
Applications. Aspen Publisher Inc., Maryland.
Ravi, R. and S. Bhattacharya. 2004. Flow behaviour of chickpea (Cicer arietinum
L.) flour dispersions: effect of additives. Journal of Food Engineering 65(4):619-
624.

191
Relkin, P. and S. Sourdet. 2005. Factors affecting fat droplet aggregation in
whipped frozen protein-stabilized emulsions. Food Hydrocolloids 19(3):503-511.
Remeuf, F., S. Mohammed, I. Sodini, and J. P. Tissier. 2003. Preliminary
observations on the effects of milk fortification and heating on microstructure and
physical properties of stirred yogurt. International Dairy Journal 13(9):773-782.
Resch, J. J., C. R. Daubert, and E. A. Foegeding. 2005. The effects of acidulant
type on the rheological properties of β-lactoglobulin gels and powders derived
from these gels. Food Hydrocolloids 19(5):851-860.
Rimada, P. S. and A. G. Abraham. 2003. Comparative study of different
methodologies to determine the exopolysaccharide produced by kefir grains in
milk and whey. Lait 83(1):79-87.
Rimada, P. S. and A. G. Abraham. 2006. Kefiran improves rheological properties
of glucono-δ-lactone induced skim milk gels. International Dairy Journal
16(1):33-39.
Rinaudo, M. 2004. Role of substituents on the properties of some polysaccharides.
Biomacromolecules 5(4):1155-1165.
Rogers, P. J. and J. E. Blundell. 1989. Separating the actions of sweetness and
calories: Effects of saccharin and carbohydrates on hunger and food intake in
human subjects. Physiology & Behavior 45(6):1093-1099.
Rohm, H. and A. Kovac. 1994. Effect of starter cultures on linear viscoelastic and
physical-properties of yogurt gels. Journal of Texture Studies 25(3):311-329.
Rojas, M., F. Acencio, and P. L. Conway. 2002. Purification and characterization
of a surface protein from Lactobacillus fermentum 104R that binds to orcine small
intestinal mucus and gastric mucin. Applied and Environmental Microbiology
68:2330-2336.
Ruas-Madiedo, P., A. C. Alting, and P. Zoon. 2005a. Effect of exopolysaccharides
and proteolytic activity of Lactococcus lactis subsp cremoris strains on the

192
viscosity and structure of fermented milks. International Dairy Journal 15(2):155-
164.
Ruas-Madiedo, P., A. C. Alting, and P. Zoon. 2005b. Effect of
exopolysaccharides and proteolytic activity of Lactococcus lactis subsp. cremoris
strains on the viscosity and structure of fermented milks. International Dairy
Journal 15(2):155-164.
Ruas-Madiedo, P., R. Tuinier, M. Kanning, and P. Zoon. 2002. Role of
exopolysaccharides produced by Lactococcus lactis subsp. cremoris on the
viscosity of fermented milks. International Dairy Journal 12(8):689-695.
Ruas-Madiedo, P. and P. Zoon. 2003. Effect of exopolysaccharide-producing
Lactococcus lactis strains and temperature on the permeability of skim milk gels.
Colloids and Surfaces A: Physicochemical and Engineering Aspects 213(2-
3):245-253.
Ruger, R. P., R. J. Baer, and K. M. Kasperson. 2002. Effect of double
homogenization and whey protein concentrate on the texture of ice cream. Journal
of Dairy Science 85(7):1684-1692.
Rybka, S. and K. Kailasapathy. 1995. The survival of culture bacteria in fresh and
freeze-dried AB yogurts. Australian Journal of Dairy Technology 50(2):51-57.
Saint-Eve, A., E. Paci Kora, and N. Martin. 2004. Impact of the olfactory quality
and chemical complexity of the flavouring agent on the texture of low fat stirred
yogurts assessed by three different sensory methodologies. Food Quality and
Preference 15(7-8):655-668.
Sanchez-Hidalgo, V. M., S. Flores-Huerta, G. Matute-Gonzalez, B. Urquieta-
Aguila, M. Bernabe-Garcia, and I. E. Cisneros-Silva. 2000. A fortifier comprising
protein, vitamins, and calcium-glycerophosphate for preterm human milk.
Archives of Medical Research 31(6):564-570.
SAS. 1996. SAS/STAT Softwares: Changes and enhancements through release
6.11. SAS Inst Inc., Cary, NC.
193
Schaafsma, G. 2006a. Health issues of whey proteins: 1. Protection of lean body
mass. Current Topics in Nutraceutical Research 4(2):113-121.
Schaafsma, G. 2006b. Health issues of whey proteins: 2. Weight management.
Current Topics in Nutraceutical Research 4(2):123-126.
Schaafsma, G. 2007. Health issues of whey proteins: 3. Gut health promotion.
Current Topics in Nutraceutical Research 5(1):29-33.
Schaer-Zammaretti, P. and J. Ubbink. 2003. Imaging of lactic acid bacteria with
AFM-elasticity and adhesion maps and their relationship to biological and
structural data. Ultramicroscopy 97:199-208.
Schorsch, C., A. H. Clark, M. G. Jones, and I. T. Norton. 1999a. Behaviour of
milk protein/polysaccharide systems in high sucrose. Colloids and Surfaces B:
Biointerfaces 12(3-6):317-329.
Schorsch, C., M. G. Jones, and I. T. Norton. 1999b. Thermodynamic
incompatibility and microstructure of milk protein/locust bean gum/sucrose
systems. Food Hydrocolloids 13(2):89-99.
Schorsch, C., D. K. Wilkins, M. G. Jones, and I. T. Norton. 2001. Gelation of
casein-whey mixtures: effects of heating whey proteins alone or in the presence of
casein micelles. Journal of Dairy Research 68(3):471-481.
Serdaroglu, M. 2006. Improving low fat meatball characteristics by adding whey
powder. Meat Science 72(1):155-163.
Serra, M., A. J. Trujillo, J. M. Quevedo, B. Guamis, and V. Ferragut. 2007. Acid
coagulation properties and suitability for yogurt production of cows' milk treated
by high-pressure homogenisation. International Dairy Journal 17(7):782-790.
Shaker, R. R., R. Y. Jumah, and B. Abu-Jdayil. 2000. Rheological properties of
plain yogurt during coagulation process: impact of fat content and preheat
treatment of milk. Journal of Food Engineering 44(3):175-180.

194
Singh, G., S. Arora, G. S. Sharma, J. S. Sindhu, V. K. Kansal, and R. B. Sangwan.
2007. Heat stability and calcium bioavailability of calcium-fortified milk. LWT-
Food Science and Technology 40(4):625-631.
Singh, G. and K. Muthukumarappan. 2008. Influence of calcium fortification on
sensory, physical and rheological characteristics of fruit yogurt. LWT - Food
Science and Technology 41:1145-1152.
Skriver, A., H. Roemer, and K. B. Qvist. 1993. Rheological characterization of
stirred yoghurt: viscometry. Journal of Texture Studies 24(2):185-198.
Sloan, A. E. 2004. Gourment & specialty food trends. Food Technology 58(7):26.
Sloan, E. A. 2006. Top 10 functional food trends. Pages 22-39 in Food
Technology. Vol. 60.
Sodini, I., A. Lucas, M. N. Oliveira, F. Remeuf, and G. Corrieu. 2002. Effect of
milk base and starter culture on acidification, texture, and probiotic cell counts in
fermented milk processing. Journal of Dairy Science 85(10):2479-2488.
Sodini, I., J. Mattas, and P. S. Tong. 2006. Influence of pH and heat treatment of
whey on the functional properties of whey protein concentrates in yoghurt.
International Dairy Journal 16(12):1464-1469.
Sodini, I., F. Remeuf, S. Haddad, and G. Corrieu. 2004. The relative effect of milk
base,starter, and process on yogurt texture: A review. Critical Reviews in Food
Science and Nutrition 44(2):113-137.
Speers, R. A. and M. A. Tung. 1986. Concentration and temperature-dependence
of flow behaviour of xanthan dispersions. Journal of Food Science 51(1):96-&.
Spencer, R. j. and A. Chesson. 1994. The effect of Lactobacillus spp. on the
attachment of enterogenic Escherichia coli to isolated porcine enterocytes. Journal
of Applied Bacteriology 77:215-220.

195
Sugiyama, T., D. Xie, R. C. Graham-Maar, K. Inoue, Y. Kobayashi, and N.
Stettler. 2007. Dietary and lifestyle factors associated with blood pressure among
U.S. adolescents. Journal of Adolescent Health 40(2):166-172.
Tamime, A. Y. and R. K. Robinson. 1985. Yoghurt Science and Technology.
Pergamon Press Ltd., Oxford.
Tinson, W., M. C. Broome, A. J. Hillier, and G. R. Jago. 1982. Metabolism of
Streptococcus thermophilus. 2. Production of CO2 and NH3 from urea. The
Australian Journal of Dairy Technology 37:14-16.
Tolstoguzov, V. 2003. Thermodynamic considerations on polysaccharide
functions. Polysaccharides came first. Carbohydrate Polymers 54(3):371-380.
Torre, L. L., A. Y. Tamime, and D. D. Muir. 2003. Rheology and sensory
profiling of set-type fermented milks made with different commercial probiotic
and yoghurt starter cultures. International Journal of Dairy Technology 56(3):163-
170.
Tuinier, R. and C. G. de Kruif. 1999. Phase behavior of casein
micelles/exocellular polysaccharide mixtures: Experiment and theory. Journal of
Chemical Physics 110:9296-9304.
Tuinier, R., J. K. G. Dhont, and C. G. De Kruif. 2000. Depletion-induced phase
separation of aggregated whey protein colloids by an exocellular polysaccharide.
Langmuir 16(4):1497-1507.
Tuinier, R., J. Rieger, and C. G. de Kruif. 2003. Depletion-induced phase
separation in colloid-polymer mixtures. Advances in Colloid and Interface
Science 103(1):1-31.
Tuinier, R., E. ten Grotenhuis, C. Holt, P. A. Timmins, and C. G. de Kruif. 1999.
Depletion interaction of casein micelles and exocellular polysaccharide. Physical
Review E 60(1):848-856.

196
Tung, C. Y. M. and P. J. Dynes. 1982. Relationship between viscoelastic
properties and gelation in thermosetting systems. Journal of Applied Polymer
Science 27.
Unal, G., S. N. El, and S. Kilic. 2005. In vitro determination of calcium
bioavailability of milk, dairy products and infant formulas. International Journal
of Food Sciences and Nutrition 56:13-22.
Valli, C. and W. B. Traill. 2005. Culture and food: a model of yoghurt
consumption in the EU. Food Quality and Preference 16(4):291-304.
van den Bogaard, P. T. C., M. Kleerebezem, O. P. Kuipers, and W. M. de Vos.
2000. Control of lactose transport, beta-galactosidase activity, and glycolysis by
CcpA in Streptococcus thermophilus: Evidence for carbon catabolite repression
by a non-phosphoenolpyruvate-dependent phosphotransferase system sugar.
Journal of Bacteriology 182(21):5982-5989.
Van Geel-Schutten, G. H., F. Flesch, B. ten Brink, M. R. Smith, and L.
Dijkhuizen. 1998. Screening and characterization of Lactobacillus strains
producing large amounts of exopolysaccharides. Applied Microbiology and
Biotechnology 50(6):697-703.
van Mil, P. J. J. M. and S. P. F. M. Roefs. 1993. Denaturation of whey proteins
studied by thermal analysis and chromatography. in Food Colloids and Polymers;
Stability and Mechanical Properties. E. Dickinson and P. Walstra, ed. The Royal
Society of Chemistry, Cambridge.
Van Vliet, T., S. P. F. M. Roefs, P. Zoon, and P. Walstra. 1989. Rheological
properties of casein gels. Journal of Dairy Research 56:529-534.
Vandevoorde, L., H. Christianes, and W. Verstraete. 1992. Prevalence of
coaggregation reactions among chicken lactobacilli. Journal of Applied
Bacteriology 72:214-219.
Vaningelgem, F., R. V. d. Meulen, M. Zamfir, T. Adriany, A. P. Laws, and L. D.
Vuyst. 2004a. Streptococcus thermophilus ST 111 produces a stable high-

197
molecular-mass exopolysaccharide in milk-based medium. International Dairy
Journal 14(10):857-864.
Vaningelgem, F., M. Zamfir, F. Mozzi, T. Adriany, M. Vancanneyt, J. Swings,
and L. De Vuyst. 2004b. Biodiversity of exopolysaccharides produced by
Streptococcus thermophilus strains is reflected in their production and their
molecular and functional characteristics. Applied and Environmental
Microbiology 70(2):900-912.
Vasbinder, A. J., A. C. Alting, R. W. Visschers, and C. G. de Kruif. 2003. Texture
of acid milk gels: formation of disulfide cross-links during acidification.
International Dairy Journal 13(1):29-38.
Vasbinder, A. J., F. V. de Velde, and C. G. de Kruif. 2004. Gelation of casein-
whey protein mixtures. Journal of Dairy Science 87(5):1167-1176.
Vasiljevic, T. and N. P. Shah. 2007. Fermented milk - Health Benefits Beyond
Probiotic Effect. Pages 99-116 in Handbook of Food Products Manufacturing.
Vol. 2. Y. H. Hui, ed. John Wiley & Sons.
Verheul, M. and S. P. F. M. Roefs. 1998. Structure of whey protein gels, studied
by permeability, scanning electron microscopy and rheology. Food Hydrocolloids
12(1):17-24.
Vickers, Z., E. Holton, and J. Wang. 2001. Effect of ideal-relative sweetness on
yogurt consumption. Food Quality and Preference 12(8):521-526.
Villani, F., O. Pepe, G. Mauriello, G. Salzano, G. Moschetti, and s. Coppola.
1995. Antilisterial activity of thermophilin 347, a bacteriocin produced by
Streptococcus thermophilus. International Journal of Food Microbiology
25(2):179-190.
Vinarta, S. C., O. E. Molina, L. I. C. Figueroa, and J. I. Farina. 2006. A further
insight into the practical applications of exopolysaccharides from Sclerotium
rolfsii. Food Hydrocolloids 20(5):619-629.

198
Vinderola, C. G., J. Duarte, D. Thangavel, G. Perdigon, E. Farnworth, and C.
Matar. 2005. Immunomodulating capacity of kefir. Journal of Dairy Research
72(2):195-202.
Vinderola, G., G. Perdigon, J. Duarte, E. Farnworth, and C. Matar. 2006. Effects
of the oral administration of the exopolysaccharide produced by Lactobacillus
kefiranofaciens on the gut mucosal immunity. Cytokine 36(5-6):254-260.
Ward, C. D. W., C. Stampanoni Koeferli, P. Piccinali Schwegler, D. Schaeppi,
and L. E. Plemmons. 1999. European strawberry yogurt market analysis with a
case studyon acceptance drivers for children in Spain using principal component
analysis and partial least squares regression. Food Quality and Preference 10(4-
5):387-400.
Warner, E. A., A. D. Kanekanian, and A. T. Andrews. 2001. Bioactivity of milk
proteins: 1. Anticariogenicity of whey proteins. International Journal of Dairy
Technology 54(4):151-153.
Welman, A. D. and I. S. Maddox. 2003. Exopolysaccharides from lactic acid
bacteria: perspectives and challenges. Trends in Biotechnology 21(6):269-274.
Welman, A. D., I. S. Maddox, and R. H. Archer. 2006. Metabolism associated
with raised metabolic flux to sugar nucleotide precursors of exopolysaccharides in
Lactobacillus delbrueckii subsp bulgaricus. Journal of Industrial Microbiology &
Biotechnology 33(5):391-400.
Wicken, A. J., A. Ayres, L. K. Campbell, and K. W. Knox. 1983a. Effect of
growth condition on production of rahmnose-containing cell wall and capsular
polysaccharides by strains of Lactobacillus casei subsp. rhamnosus. Journal of
Bacteriology 153:84-92.
Wicken, A. J., A. Ayres, L. K. Campbell, and K. W. Knox. 1983b. Effect of
growth conditon on production of rhamnose-containing cell wall and capsular
polysaccharides by strains of Lactobacillus casei subsp. rhamnosus. Journal of
Bacteriology 153:84-92.

199
Winter, H. H. 1987. Can gel point of a cross-linking polymer be detected by the
G'-G" corssover? Polymer Engineering and Science 27.
Winter, H. H. and F. Chambon. 1986. Analysis of linear viscoelasticity of a
crosslinking polymer at the gel point. Journal of Rheology 30(2).
Xu, Z. M., D. G. Emmanouelidou, S. N. Raphaelides, and K. D. Antoniou. 2008.
Effects of heating temperature and fat content on the structure development of set
yogurt. Journal of Food Engineering 85(4):590-597.
Yalcin, A. S. 2006. Emerging therapeutic potential of whey proteins and peptides.
Current Pharmaceutical Design 12(13):1637-1643.
Yanes, M., L. Duran, and E. Costell. 2002. Effect of hydrocolloid type and
concentration on flow behaviour and sensory properties of milk beverages model
systems. Food Hydrocolloids 16:605-611.
Yannick, M. and B. P. G. Laurent. 2005. Compared tolerance to osmotic stress in
various microorganisms: Towards a survival prediction test. Biotechnology and
Bioengineering 92(4):479-484.
Yildiz-Turp, G. and M. Serdaroglu. 2008. Effect of replacing beef fat with
hazelnut oil on quality characteristics of sucuk - A Turkish fermented sausage.
Meat Science 78:447-454.
Yu, C. and S. Gunasekaran. 2001. Correlation of dynamic and steady flow
viscosities of food materials. Applied Rheology 11(3):134-140.
Zhang, Z. and H. D. Goff. 2005. On fat destabilization and composition of the air
interface in ice cream containing saturated and unsaturated monoglyceride.
International Dairy Journal 15(5):495-500.
Zisu, B. and N. P. Shah. 2002. Effects of exopolysaccharide producing
Streptococcus thermophilus strains on the functionality of low fat Mozzarella
cheese. in Food Technologist Annual Meeting. Institute of Food Technologist,
Abaheim, CA.

200
Zisu, B. and N. P. Shah. 2003. Effects of pH, temperature, supplementation with
whey protein concentrate, and adjunct cultures on the production of
exopolysaccharides by Streptococcus thermophilus 1275. Journal of Dairy
Science 86(11):3405-3415.
Zisu, B. and N. P. Shah. 2005a. Low-fat mozzarella as influenced by microbial
exopolysaccharides, preacidification, and whey protein concentrate. Journal of
Dairy Science 88(6):1973-1985.
Zisu, B. and N. P. Shah. 2005b. Textural and functional changes in low-fat
Mozzarella cheeses in relation to proteolysis and microstructure as influenced by
the use of fat replacers, pre-acidification and EPS starter. International Dairy
Journal 15(6-9):957-972.
Zisu, B. and N. P. Shah. 2007. Texture characteristics and pizza bake properties of
low-fat Mozzarella cheese as influenced by pre-acidification with citric acid and
use of encapsulated and ropy exopolysaccharide producing cultures. International
Dairy Journal 17(8):985-997.