physical plant - university of manitoba plant currently has 375 staff of which physical plant...
TRANSCRIPT

October 2006 1
Physical PlantPhysical PlantAnticipating the Anticipating the
Next DecadeNext Decade
October 2006 2
Physical Plant Physical Plant Staff DemographicsStaff Demographics
Physical Plant currently has 375 staff of which Physical Plant currently has 375 staff of which 25 are Assistant Managers or Managers and 25 are Assistant Managers or Managers and including the Director and Assist. Directorincluding the Director and Assist. Director
Staff DemographicsStaff Demographics

October 2006 3
Physical Plant Physical Plant Staff DemographicsStaff Demographics
35
22
33
70
79
68
62
26
7
0
10
20
30
40
50
60
70
80
24 and under 25-29 30-34 35-39 40-44 45-49 50-54 55-59 60-64 65 and over
ALL STAFFALL STAFF

October 2006 4
Physical Plant Physical Plant Staff DemographicsStaff Demographics
57%
43%
ALL STAFFALL STAFF50 and Over50 and Over
50 and Over50 and Over(163)(163)
49 and Under49 and Under(212)(212)

October 2006 5
Physical Plant Physical Plant Staff DemographicsStaff Demographics
35%
65%
ALL STAFFALL STAFF45 and Over45 and Over
45 and over45 and over(242)(242)
44 and under44 and under(133)(133)

October 2006 6
Physical Plant Physical Plant Staff DemographicsStaff Demographics
40%
60%
SUPERVISORY STAFFSUPERVISORY STAFF50 and Over50 and Over
50 and over50 and over(15)(15)
49 and under49 and under(10)(10)

October 2006 7
Physical Plant Physical Plant Staff DemographicsStaff Demographics
32%
68%
SUPERVISORY STAFFSUPERVISORY STAFF45 and Over45 and Over
45 and over45 and over(17)(17)
44 and under44 and under(8)(8)

October 2006 8
Physical Plant Physical Plant Environmental Issues and RegulationsEnvironmental Issues and Regulations
Environmental IssuesEnvironmental Issuesand Regulationsand Regulations
Sustainable CampusSustainable CampusReRe--thinking our waysthinking our ways

October 2006 9
Physical Plant Physical Plant Environmental Issues and RegulationsEnvironmental Issues and Regulations
Green BuildingGreen BuildingProvProv. Of Manitoba. Of Manitoba’’s green building policy s green building policy ––LEED silverLEED silver
Construction materialsConstruction materialsDemolition wasteDemolition wasteDesign for water and energy conservationDesign for water and energy conservationTransportation and parkingTransportation and parkingGrounds managementGrounds managementCaretaking services Caretaking services

October 2006 10
Physical Plant Physical Plant Environmental Issues and RegulationsEnvironmental Issues and Regulations
Energy/Climate ChangeEnergy/Climate Change
Increase efficiency and maximize conservationIncrease efficiency and maximize conservation
Displace fossil fuels with renewable, alternative Displace fossil fuels with renewable, alternative energy and/or carbon offsetsenergy and/or carbon offsets

October 2006 11
Physical Plant Physical Plant Environmental Issues and RegulationsEnvironmental Issues and Regulations
Water Water –– Quality/QuantityQuality/Quantity
Water conserving fixturesWater conserving fixturesStorm water managementStorm water managementGrey water managementGrey water management
Managing water for pollution and Managing water for pollution and conservationconservation
October 2006 12
Physical Plant Physical Plant Environmental Issues and RegulationsEnvironmental Issues and Regulations
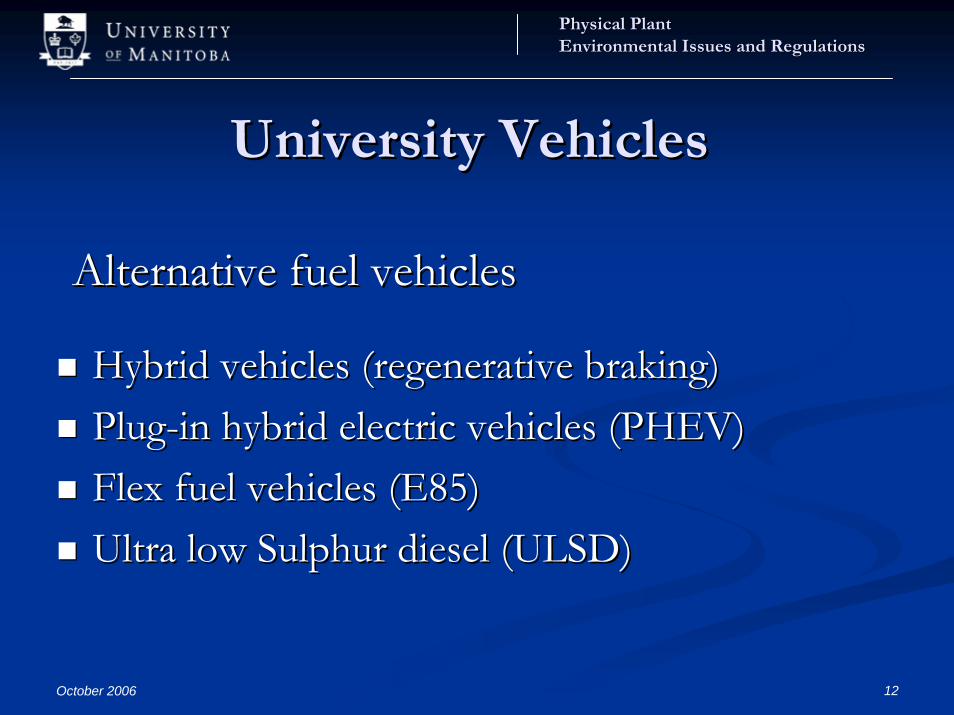
University VehiclesUniversity Vehicles
Hybrid vehicles (regenerative braking)Hybrid vehicles (regenerative braking)PlugPlug--in hybrid electric vehicles (PHEV)in hybrid electric vehicles (PHEV)Flex fuel vehicles (E85)Flex fuel vehicles (E85)Ultra low Ultra low SulphurSulphur diesel (ULSD)diesel (ULSD)
Alternative fuel vehiclesAlternative fuel vehicles

October 2006 13
Physical Plant Physical Plant Environmental Issues and RegulationsEnvironmental Issues and Regulations
WasteWaste PreventionPrevention
More than recycling cardboard, office paper and More than recycling cardboard, office paper and beverage containers.beverage containers.Two areas of increasing interest:Two areas of increasing interest:
Organic waste (food and yard waste) and electronic Organic waste (food and yard waste) and electronic waste (ewaste (e--waste).waste).EE--waste regulations are expected in the next couple waste regulations are expected in the next couple
of years.of years.Construction/demolition waste also a growing Construction/demolition waste also a growing concern.concern.

October 2006 14
Physical Plant Physical Plant Environmental Issues and RegulationsEnvironmental Issues and Regulations
Grounds ManagementGrounds Management
Growing concern over cosmetic use of Growing concern over cosmetic use of pesticides.pesticides.
Banned in Brandon, Halifax, Toronto.Banned in Brandon, Halifax, Toronto.Trend towards naturalized landscaping.Trend towards naturalized landscaping.
Drought tolerant.Drought tolerant.Native prairie plants.Native prairie plants.Organic fertilizers.Organic fertilizers.
Integrated pest management planningIntegrated pest management planning

October 2006 15
Physical Plant Physical Plant Environmental Issues and RegulationsEnvironmental Issues and Regulations
Planning/ReportingPlanning/Reporting
Increasing trend towards integrating sustainability into Increasing trend towards integrating sustainability into decisiondecision--making and campus planningmaking and campus planningState of the campus environment reporting to establishState of the campus environment reporting to establishSustainability base line Sustainability base line
Evaluation and monitoring tool for continual progressEvaluation and monitoring tool for continual progress
Sustainable campus planningSustainable campus planning

October 2006 16
Physical Plant Physical Plant Environmental Issues and RegulationsEnvironmental Issues and Regulations
Additional IssuesAdditional Issuesand Regulationsand Regulations
Safety Safety ““Bill CBill C--4545””TrainingTrainingAsbestos Asbestos MouldMouldGovGov’’tt regulationsregulations
FireFire--safetysafetyBackflow preventionBackflow prevention

October 2006 17
Physical Plant Physical Plant Deferred Maintenance and Renewal ForecastDeferred Maintenance and Renewal Forecast
Deferred Deferred Maintenance and Maintenance and Renewal ForecastRenewal Forecast

October 2006 18
Physical Plant Physical Plant Deferred Maintenance and Renewal ForecastDeferred Maintenance and Renewal Forecast
0
100,000
200,000
300,000
400,000
500,000
600,000
700,000
1911
1914
1917
1920
1923
1926
1929
1932
1935
1938
1941
1944
1947
1950
1953
1956
1959
1962
1965
1968
1971
1974
1977
1980
1983
1986
1989
1992
1995
1998
2001
2004
(Sq.
Ft.)
New Building Area by YearNew Building Area by Year

October 2006 19
Physical Plant Physical Plant Deferred Maintenance and Renewal ForecastDeferred Maintenance and Renewal Forecast
1956 – 19723.3 million sq. ft55% of Campus
0
100,000
200,000
300,000
400,000
500,000
600,000
700,000
1911
1914
1917
1920
1923
1926
1929
1932
1935
1938
1941
1944
1947
1950
1953
1956
1959
1962
1965
1968
1971
1974
1977
1980
1983
1986
1989
1992
1995
1998
2001
2004
(Sq.
Ft.)
New Building Area by YearNew Building Area by Year

October 2006 20
Physical Plant Physical Plant Deferred Maintenance and Renewal ForecastDeferred Maintenance and Renewal Forecast
1961 – 19722.8 million sq. ft47% of Campus
1956 – 19723.3 million sq. ft55% of Campus
0
100,000
200,000
300,000
400,000
500,000
600,000
700,000
1911
1914
1917
1920
1923
1926
1929
1932
1935
1938
1941
1944
1947
1950
1953
1956
1959
1962
1965
1968
1971
1974
1977
1980
1983
1986
1989
1992
1995
1998
2001
2004
(Sq.
Ft.)
New Building Area by YearNew Building Area by Year

October 2006 21
Physical Plant Physical Plant Deferred Maintenance and Renewal ForecastDeferred Maintenance and Renewal Forecast
Renewal ForecastRenewal Forecast
Over 72% of campus is over 35 years oldOver 72% of campus is over 35 years oldThe average lifecycle of a buildings components is The average lifecycle of a buildings components is about 30 yearsabout 30 yearsSignificantly, 55% of campus has reached a period Significantly, 55% of campus has reached a period of extensive/expensive building component of extensive/expensive building component renewal requirementsrenewal requirements

October 2006 22
Physical Plant Physical Plant Deferred Maintenance and Renewal ForecastDeferred Maintenance and Renewal Forecast
Deferred MaintenanceDeferred Maintenance
Keeping up with maintenance, upgrading , and Keeping up with maintenance, upgrading , and repair is going to be a major challengerepair is going to be a major challengeLimited funds allocated to meet current and Limited funds allocated to meet current and future requirements will result in maintenance future requirements will result in maintenance and repair work being deferred and the backlog and repair work being deferred and the backlog of deferred maintenance buildsof deferred maintenance builds

October 2006 23
Physical Plant Physical Plant Deferred Maintenance and Renewal ForecastDeferred Maintenance and Renewal Forecast
The University of Manitoba has an estimated The University of Manitoba has an estimated Deferred Maintenance Backlog of $125.7 million Deferred Maintenance Backlog of $125.7 million in buildings and $186 million when including in buildings and $186 million when including Campus infrastructure.Campus infrastructure.

October 2006 24
Physical Plant Physical Plant Deferred Maintenance and Renewal ForecastDeferred Maintenance and Renewal Forecast
Facilities Asset ManagementFacilities Asset Management
In 1980 a methodology was developed at Stanford In 1980 a methodology was developed at Stanford University for predicting facilities renewal and replacement University for predicting facilities renewal and replacement requirements based on liferequirements based on life--cycles and costs of building cycles and costs of building subsub--systems.systems.The predictive models from this study were reviewed in The predictive models from this study were reviewed in 1997 and found to be within 2% of actual.1997 and found to be within 2% of actual.In most cases differences of ten to twenty percent are to In most cases differences of ten to twenty percent are to be expected with a reasonable effort.be expected with a reasonable effort.The similarity of the predictions and actual outcomes The similarity of the predictions and actual outcomes support the reasonableness and viability of cost modeling support the reasonableness and viability of cost modeling as a forecasting tool.as a forecasting tool.

October 2006 25
Physical Plant Physical Plant Deferred Maintenance and Renewal ForecastDeferred Maintenance and Renewal Forecast
VFA was founded in 1998 as a spinVFA was founded in 1998 as a spin--off of off of VanderweilVanderweilEngineers, a BostonEngineers, a Boston--based construction and based construction and engineering firm. The company initially offered facility engineering firm. The company initially offered facility assessment services to organizations with large real assessment services to organizations with large real estate portfolios.estate portfolios.To date, VFA has performed assessments of more than To date, VFA has performed assessments of more than 100,000 properties, totaling over more than two billion 100,000 properties, totaling over more than two billion square feet of space. square feet of space. VFAVFA’’ss flagship software, flagship software, VFA.VFA.facilityfacility, is used to manage these real estate assets. , is used to manage these real estate assets.

October 2006 26
Physical Plant Physical Plant Deferred Maintenance and Renewal ForecastDeferred Maintenance and Renewal Forecast
During the summer of 2005 a Facilities During the summer of 2005 a Facilities Condition Assessment was performed on the Condition Assessment was performed on the University of Manitoba by VFA Inc. . It University of Manitoba by VFA Inc. . It consisted of a physical survey of buildings by consisted of a physical survey of buildings by qualified team of engineers and architects.qualified team of engineers and architects.

October 2006 27
Physical Plant Physical Plant Deferred Maintenance and Renewal ForecastDeferred Maintenance and Renewal Forecast
Determined the current effective age of each Determined the current effective age of each buildings components and systemsbuildings components and systems
Constructed cost models for each buildingConstructed cost models for each building
Identified deferred maintenance backlogIdentified deferred maintenance backlog

October 2006 28
Physical Plant Physical Plant Deferred Maintenance and Renewal ForecastDeferred Maintenance and Renewal Forecast
Data entered into Facilities Asset Management Data entered into Facilities Asset Management software (software (VFAVFA.facility.facility).).Capable of forecasting current and future Capable of forecasting current and future financial requirements.financial requirements.Maintenance Backlog, Building Replacement Maintenance Backlog, Building Replacement Value, Cost Models, and System Conditions can Value, Cost Models, and System Conditions can be examined from different perspectives to gain be examined from different perspectives to gain understanding of facilities capital requirements.understanding of facilities capital requirements.

October 2006 29
Physical Plant Physical Plant Deferred Maintenance and Renewal ForecastDeferred Maintenance and Renewal Forecast
One of many data points generated by Facilities One of many data points generated by Facilities Asset Management software is the Facilities Asset Management software is the Facilities Condition Index (FCI) .Condition Index (FCI) .FCI is a quantitative measure useful in FCI is a quantitative measure useful in benchmarking.benchmarking.FCI is an internationally recognized measure of the FCI is an internationally recognized measure of the amount of deferred maintenance.amount of deferred maintenance.This metric is used by numerous institutions across This metric is used by numerous institutions across North America as part of their capital planning North America as part of their capital planning process.process.

October 2006 30
Physical Plant Physical Plant Deferred Maintenance and Renewal ForecastDeferred Maintenance and Renewal Forecast
Facilities Condition IndexFacilities Condition Index( FCI )( FCI )
Calculated by dividing the sum of the Deferred Calculated by dividing the sum of the Deferred Maintenance by the current replacement value Maintenance by the current replacement value (CRV) of the facility.(CRV) of the facility.

October 2006 31
Physical Plant Physical Plant Deferred Maintenance and Renewal ForecastDeferred Maintenance and Renewal Forecast
Deferred MaintenanceDeferred Maintenance
Current Replacement ValueCurrent Replacement ValueFCI =FCI =
October 2006 32
Physical Plant Physical Plant Deferred Maintenance and Renewal ForecastDeferred Maintenance and Renewal Forecast
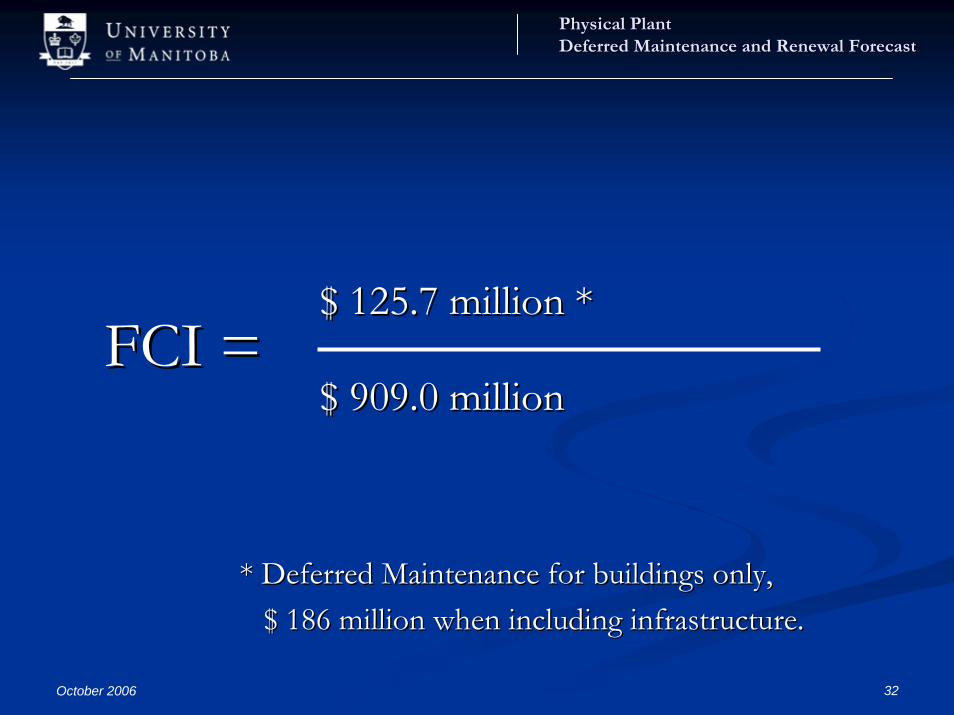
FCI =FCI =$ 125.7 million *$ 125.7 million *
$ 909.0 million$ 909.0 million
* Deferred Maintenance for buildings only, * Deferred Maintenance for buildings only, $ 186 million when including infrastructure.$ 186 million when including infrastructure.
October 2006 33
Physical Plant Physical Plant Deferred Maintenance and Renewal ForecastDeferred Maintenance and Renewal Forecast
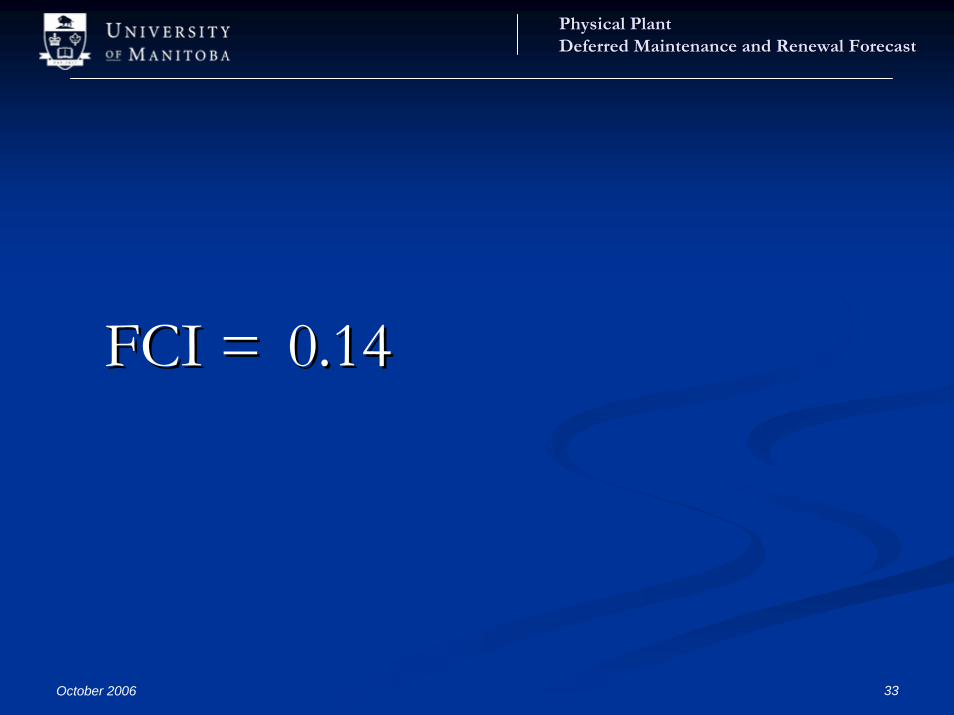
FCI =FCI = 0.140.14

October 2006 34
Physical Plant Physical Plant Deferred Maintenance and Renewal ForecastDeferred Maintenance and Renewal Forecast
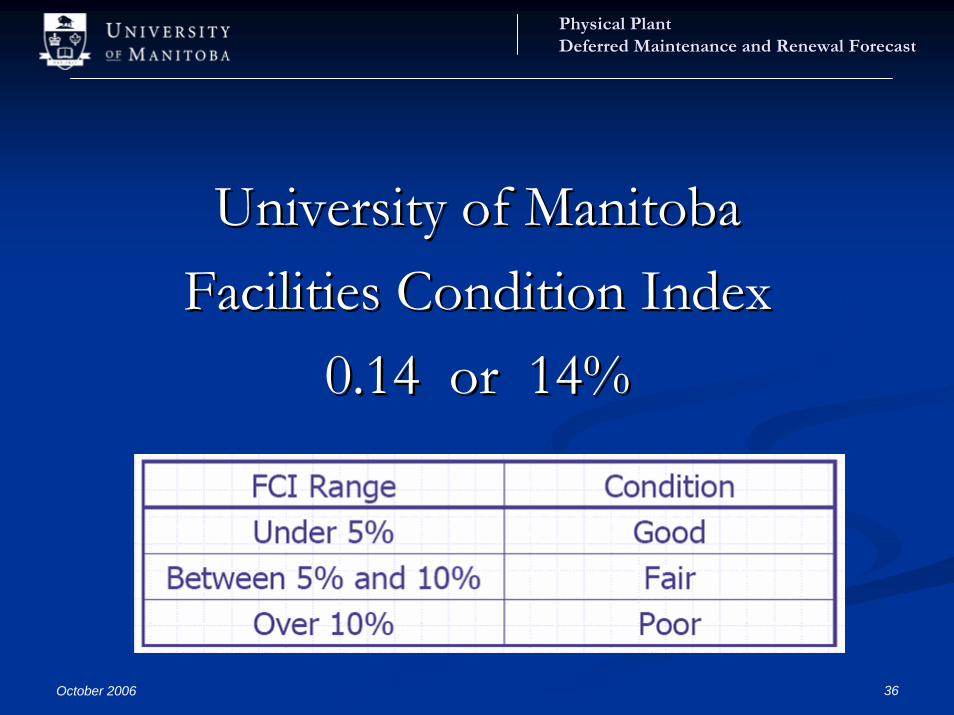
While property owners/managers can establish While property owners/managers can establish independent standards, the following reference independent standards, the following reference is generally accepted and promoted by APPA, is generally accepted and promoted by APPA, NACUBO, IFMA, and NASFA. NACUBO, IFMA, and NASFA.

October 2006 35
Physical Plant Physical Plant Deferred Maintenance and Renewal ForecastDeferred Maintenance and Renewal Forecast
October 2006 36
Physical Plant Physical Plant Deferred Maintenance and Renewal ForecastDeferred Maintenance and Renewal Forecast
University of ManitobaUniversity of ManitobaFacilities Condition IndexFacilities Condition Index
0.14 or 14%0.14 or 14%

October 2006 37
Physical Plant Physical Plant Deferred Maintenance and Renewal ForecastDeferred Maintenance and Renewal Forecast
FCIFCI # of# of RatingRating (Sq. Ft.)(Sq. Ft.)
RangeRange BuildingsBuildings
.00 < .05.00 < .05 3232 Good Good (1.40 mil)(1.40 mil)
.05 < .10.05 < .10 1111 Fair Fair (0.38 mil)(0.38 mil)
.10 < .15.10 < .15 2020
.15 < .20.15 < .20 16 16 (63 or 53%)(63 or 53%) Poor Poor (3.78 mil)(3.78 mil)
.20 < .25.20 < .25 1515
.25 < .30.25 < .30 1212
.30 +.30 + 1313 (11%)(11%) Critical Critical (0.34 mil)(0.34 mil)
119119

October 2006 38
Physical Plant Physical Plant Deferred Maintenance and Renewal ForecastDeferred Maintenance and Renewal Forecast
ANNUAL RENEWAL FORECASTANNUAL RENEWAL FORECAST
$0
$20
$40
$60
$80
$100
$120
2006 2007 2008 2009 2010 2011 2012 2013 2014 2015 2016 2017 2018 2019 2020 2021 2022 2023 2024 2025 2026
Mill
ions

October 2006 39
Physical Plant Physical Plant Deferred Maintenance and Renewal ForecastDeferred Maintenance and Renewal Forecast
0
1
2
3
4
5
6
7
8
9
2006 2007 2008 2009 2010 2011 2012 2013 2014 2015 2016 2017 2018 2019 2020 2021 2022 2023 2024 2025 20260
0.1
0.2
0.3
0.4
0.5
0.6
0.7
0.8
0.9
1
Fund
ing
in m
illion
s
FCI
CURRENT FUNDING AT 0.34%CURRENT FUNDING AT 0.34%(3 MILLION IN 2006)(3 MILLION IN 2006)

October 2006 40
Physical Plant Physical Plant Deferred Maintenance and Renewal ForecastDeferred Maintenance and Renewal Forecast
0
10
20
30
40
50
60
70
80
2006 2007 2008 2009 2010 2011 2012 2013 2014 2015 2016 2017 2018 2019 2020 2021 2022 2023 2024 2025 2026
Mill
ions
0
0.05
0.1
0.15
0.2
0.25
0.3
0.35
Fund
ing
in m
illion
s
FCI
FUNDING AT 3%FUNDING AT 3%

October 2006 41
Physical Plant Physical Plant Deferred Maintenance and Renewal ForecastDeferred Maintenance and Renewal Forecast
0
20
40
60
80
100
120
2006 2007 2008 2009 2010 2011 2012 2013 2014 2015 2016 2017 2018 2019 2020 2021 2022 2023 2024 2025 20260
0.02
0.04
0.06
0.08
0.1
0.12
0.14
0.16
0.18
0.2
FUNDING TO MAINTAINFUNDING TO MAINTAIN
Fund
ing
in m
illion
s
FCI

October 2006 42
Physical Plant Physical Plant Deferred Maintenance and Renewal ForecastDeferred Maintenance and Renewal Forecast
FUNDING TO TARGETFUNDING TO TARGET5% FCI in 10 years5% FCI in 10 years
0
20
40
60
80
100
120
2006 2007 2008 2009 2010 2011 2012 2013 2014 2015 2016 2017 2018 2019 2020 2021 2022 2023 2024 2025 20260
0.02
0.04
0.06
0.08
0.1
0.12
0.14
0.16
0.18
0.2
Fund
ing
in m
illion
s
FCI

October 2006 43
Physical Plant Physical Plant Deferred Maintenance and Renewal ForecastDeferred Maintenance and Renewal Forecast
Starting Net Present Value Ending
Funding Option Backlog FCI Applied Funding Ending Backlog Total Funding Deferred FCI
Requirement Maintenance
Penalty
Pay as you go 158,505,269 0.1744 665,894,848 0 665,894,848 0 0.0000
Funding to reduce FCI to 158,505,269 0.1744 651,116,928 45,427,683 696,544,611 30,649,763 0.0500
5% in 10 years
Funding to maintain 158, 505,269 0.1744 570,791,744 158,505,269 729,297,013 63,402,165 0.1744
constant FCI
3% of the Current 158,505,269 0.1744 545,406,656 271,389,655 816,796,311 150,901,463 0.2986
Replacement Value
0.34% of the Current 158,505,269 0.1744 61,812,736 785,848,176 847,660,912 181,766,064 0.8645
Replacement Value
FUNDING COMPARISON
20 Years

October 2006 44
Physical Plant Physical Plant Anticipating the Next DecadeAnticipating the Next Decade
ConclusionConclusion
QuestionsQuestions