physical and biological oceanography in west greenland ... · pdf filedata sheet title:...
TRANSCRIPT

National Environmental Research InstituteMinistry of the Environment . Denmark
Physical and biological oceanography in West Greenland waters with emphasis on shrimp and fish larvae distributionNERI Technical Report, No. 581

(Blank page)

National Environmental Research InstituteMinistry of the Environment
Physical and biological oceanography in West Greenland waters with emphasis on shrimp and fish larvae distributionNERI Technical Report, No. 5812006
Johan SöderkvistTorkel Gissel NielsenMartin Jespersen

Data sheet Title: Physical and biological oceanography in West Greenland waters with emphasis on shrimp and fish
larvae distribution Authors: Johan Söderkvist 1), Torkel Gissel Nielsen 1) & Martin Jespersen 2) Departments: 1) Department of Marine Ecology, 2) Department of Arctic Environment Series title and no.: NERI Technical Report No. 581 Publisher: National Environmental Research Institute © Ministry of the Environment URL: http://www.neri.dk Date of publication: October 2006 Editing completed: June 2006 Referee: Karin Gustafsson Financial support: The work has been funded as part of the cooperation between NERI and the Bureau of Minerals and
Petroleum, Government of Greenland, on developing a Strategic Environmental Impact Assessment of oil activities in the southeastern Baffin Bay.
Please cite as: Söderkvist, J., Nielsen, T.G. & Jespersen, M. 2006: Physical and biological oceanography in West
Greenland waters with emphasis on shrimp and fish larvae distribution. National Environmental Research Institute, Denmark. 54 pp. – NERI Technical Report No. 581.
http://technical-reports.dmu.dk Reproduction is permitted, provided the source is explicitly acknowledged. Abstract: The report provides an overview of the hydrography and plankton dynamics and shrimp and fish
larvae distribution in Disko Bay, and the waters along south west Greenland. Observations of hydro-graphy and the plankton community in Disko Bay and on the banks along the Greenland south west coast show that marine life is mainly concentrated in transition zones between water masses, on the steep bottom slopes of the banks, and at the shallow parts of the entrance to Disko Bay. High produc-tion of the plankton community is also expected in the marginal ice zone west of the Greenland west coast, but due to insufficient amount of observations it cannot be confirmed in this study. The plankton bloom in Disko Bay is triggered by upwelling of saline and warmer water at the end of April. Onset of the plankton bloom, magnitude, and the distribution of the plankton community are highly affected by the large inter-annual variations of the ice extent in spring. Onset of the plankton bloom at the banks south of Disko Bay is also expected to take place in April. The zooplankton community, including fish and shrimp larvae, increases in abundance and are abundant in the surface layer during early summer. Later in the season the plankton community is more scattered, and mostly beneath the surface layer. The aim of the report is – based on an analysis of physical and biological oceanography with emphasis on shrimp and fish larvae distribution – to support the identification of potential hot spots in time and space where an oil spill will have the largest consequences on the marine ecosystem. The most sensitive season – i.e. when an oil spill can be expected to have the most severe ecological consequences – is April to June when high biological activity of the pelagic food web from phytoplankton to fish larvae are con-centrated in the surface layers. On a horizontal scale the most important area is the fronts in association with the transition zone between different water masses.
Keywords: West Greenland, hydrography, biological oceanography, impact of oil spill, pollution Cover photo: Disko Bay by Torkel Gissel Nielsen Layout: Anne van Acker Drawings: Johan Söderkvist & Martin Jespersen ISBN: 978-87-7772-931-7 ISSN (electronic): 1600-0048 Number of pages: 54 Internet-version: The report is available only as a PDF-file from NERI’s homepage http://www.dmu.dk/Pub/FR581.pdf For sale at: Ministry of the Environment Frontlinien Rentemestervej 8 DK-2400 Copenhagen NV Tel. +45 7012 0211 [email protected]

Contents
Summary 5
Sammenfatning 7
Eqikkaaneq 9
1 Introduction 11
2 Materials and methods 13
2.1 Disko Bay 13 2.2 The permanent station 13 2.3 Cruises: Adolf Jensen 14 2.4 Ice conditions 15 2.5 Model description 15
3 Monthly mean ice conditions from 1996 to 1998 and 2005 19
4 Observations of hydrography, chlorophyll, plankton and larvae in the Disko Bay region 21
4.1 Annual cycle of temperature, salinity, and density 23 4.2 The spring phytoplankton bloom 24 4.3 Transects of hydrography in Disko Bay and along the Greenland west
coast, south of Disko Bay 26 4.4 The fate of the primary production, i.e. coupling to the higher trophic
levels 34
5 Model results 43
6 Conclusions 47
7 References 51
National Environmental Research Institute
NERI Technical Reports

[Blank page]

5
Summary
A hydrographic and plankton community description of the Disko Bay region has been made. The aim was to identify sensitive regions and time periods to oil spill. Analysis of historical observations of hydrography during the period April 1996 to August 1998 and spring 2005 showed that there was only polar water in Disko Bay, originating from the Arctic Ocean. In summer, the surface salinity is lower than in the polar water, which is an effect of ice melt from glaciers and sea ice. The observed hydrography at the Arctic Station, located 1 nauti-cal mile south of Qeqertarsuaq, showed that the warming of the sur-face water in Disko Bay started in May and continued to late August. Ice melt during summer increased the strength of the stratification and intensified the heating rate in the upper layers. The summer mixed layer thickness was typically 10-20 m. Convection together with advection of water from outside the bay from early September 1996 to late January 1997 increased the sea surface salinity from 30.7 to 33.4. Satellite observations showed that the ice growth season ex-hibited large interannual variations. The ice growth season in 1996 and 1997 started in January, but in 2005 Disko Bay was nearly ice free throughout the winter season.
In contrast to the general believe that decreased surface density due to warming or decreased surface salinity triggers the spring bloom, the present study suggests that increased salinity below the surface layer initiated the spring blooms in Disko Bay in 1997 and 2005. The increase in vertical stratification might have been generated by up-welling or inflow of dense water in the deeper parts of Disko Bay. The spring bloom started around the 20th of April for both 1997 and 2005.
The horizontal mapping performed in June 1996 and 1997 in Disko Bay suggests that there was a clockwise circulation in the upper 100 m during early summer. The coastal current in the bay received warm and saline water from the West Greenland Current. A fraction of the water left the bay along the southern coast of Disko Island. Analysis of the easternmost area in June 1997 suggests that there was an inflow in the surface layer through the northern entrance of Disko Bay, the Vaigat.
The aim of the report is – based on an analysis of physical and bio-logical oceanography with emphasis on shrimp and fish larvae dis-tribution – to support the identification of potential hot spots in time and space where an oil spill will have the largest consequences on the marine ecosystem. The present report provides an overview of the hydrography and plankton dynamics and shrimp and fish larvae distribution in Disko Bay, and the waters along south west Green-land.
In this context, knowledge about the interaction between hydrography and the pelagic food web is essential. Therefore attention is drawn to the identification of hydrodynamic discontinuities, i.e. sites where water masses with different properties meet and enhanced biological

6
activity can be expected. These sites are particularly sensitive and areas where pronounced ecological effects of a potential oil spill can be expected.
7
Sammenfatning
Rapporten indeholder en beskrivelse af Disko Bugtens hydrografi og planktonsamfund. Formålet er at identificere områder/perioder, som er specielt udsatte i forhold til et eventuelt olieudslip.
En analyse af tidligere indsamlede hydrografiske data fra Disko Bug-ten viste, at vandmassen primært er polarvand. Denne vandmasse stammer fra det Arktiske Ocean. Om sommeren er overfladevandets saltholdighed lavere end polarvandet pga. ferskvandstilførsel fra havis og gletschere. Den observerede hydrografi på en permanent station 1 sømil syd for Qeqertarsuaq viste, at opvarmningen af over-fladevandet startede i maj og fortsatte indtil august. Ferskvandstilfør-sel i løbet af sommeren forstærkede yderligere lagdelingen og op-varmningen af overfladelaget. Det opblandede overfladelag var ty-pisk 10 til 20 m tykt. Konvektion og advektion af vand ude fra bugten øgede overfladelagets saltholdighed fra 30,7 til 33,4 fra september til januar. Satellitobservationer viste, at der var store år til år variationer i varigheden af isdækket. Havisen blev etableret i januar i 1996 og 1997, mens der stort set ikke var noget sammenhængende havisdække i 2005.
I modsætning til den generelle antagelse at en reduktion i overflade-lagets massefylde, pga. opvarmning eller reduceret saltholdighed, udløser forårsopblomstringen, viser nærværende analyse, at øget saltholdighed af vandmassen under den fotiske zone initierer forårs-opblomstringen i Disko Bugten i 1997 og 2005. Opblomstringen star-tede i de to år ca. 20. april. Lagdelingen skyldes formodentlig op-strømning eller indstrømning af vand med høj densitet til de dybere områder i Disko Bugten. Tykkelsen af overfladelaget blev efterføl-gende reduceret, da overfladelaget strømmede ud af Disko Bugten.
Undersøgelsen af Disko Bugten i juni 1997 og 2005 viste, at de øverste 100 m af vandsøjlen strømmede med uret rundt i Disko Bugten. Kyst-strømmen i bugten modtog varmt og salt vand fra Den Vestgrøn-landske Strøm. En del af vandet forlod bugten i den sydlige del af Disko Bugten. Analyser af den østlige del i juni 1997 viste, at vandet også forlod bugten igennem Vaigat.
Hensigten med denne rapport er – ud fra en analyse af områdets hy-drografi – at understøtte identifikationen af potentielle biologiske produktionsmæssige ”hot spots” i tid og rum, hvor et eventuelt olie-udslip må forventes at have de største konsekvenser for det marine økosystem. Rapporten bidrager med et overblik over hydrografi, planktondynamik og udbredelse af reje- og fiskelarver i Disko Bugten og havområderne langs med Sydvestgrønland. I denne sammenhæng er kendskabet til samspillet imellem hydrografi og det pelagiske føde-net centralt. Specielt skal man være opmærksom på hydrografisk diskontinuitet, dvs. områder hvor forskellige vandmasser mødes og forhøjet biologisk aktivitet kan forventes. Sådanne områder er speci-elt følsomme og er områder, hvor den økologiske påvirkning af et eventuelt olieudslip kan forventes at være mest udtalt.

8
[Blank page]

9
Eqikkaaneq
Nalunaarusiap Disko Bugtip hydrografi-ata tappiorarnartuisalu nas-suiarneqarnerat imaraa. Ooliamik aniasoortitsisoqassagaluarpat sumiiffiit / piffissat suut allanit navianartorsiortinneqarnerusussat paasiniarnissaat siunertarineqarpoq.
Siusinnerusukkut hydrografisk-imut paasissutissanik siusinnerusuk-kut katersorneqarsimasunik paasiniaaqqissaarnerup takutippaa imap imertaa tassaanerusoq issittup imaa. Imaq tamanna Arktiske Oce-animeersuuvoq (Issittup imartaaneersuuvoq). Aasaanerani immap qaavata imartaa issittup imartaanit tarajoqarnera annikinnerusarpoq imermik immap sikuata aanneraneranit sermersuullu aanneranit akoorneqarnini pissutigalugu. Qeqertarsuup qujataani 1 sømil un-gasissusilimmi sumiiffimmi aalajangersumi hydrografi-mik misissu-inerup takutippaa immap qaavata kissakkiartornera majip qaam-mataani aallartittartoq augustusili tikillugu atuuttarluni.
Aasaanerani imiinnarmik akoorneqarnerata immaap ikiariissaarnera qaavatalu kissakkiartornera suli sakkortunerulersittarpaa. Immap qaava akueriissinneqartoq 10 – 20 m ippertutigigajuppoq. Iterlammi erngup sarfarusaarnikkut avammullu illuariartorluni siaruariar-tornikkut immap qaavata tarajuunera septemberimiit januarimut 30,7- imiit 33,4-mut allanngortittarpaa. Qaammataasakkut nakkutilli-inerup takutippaa sikuusarnerata sivisussusia ukiumiit ukiumut al-lanngorartorujussuusartoq. 1996-imi 1997-imilu januarimi sikusar-poq, kisiannili 2005-imi ataqatigiissumik sikunngitsututo-qaatigineqarsinnaalluni.
Immap qaavata kissatsinneqarnera tarajuunnginnerulertarneraluun-nit pissutigalugu oqinnerulertarnerata upernaakkut naalersarnermut pissutaaneranik nalinginnaasumik isumaqarnerup akerlianik mas-sakkut misissueqqissaarnerup takutippaa qaamarngup angumasaata ataani tarajuunerulerneq Upernaakkut Disko Bugtimi 1997-imi 2005-imilu naalernermut pissutaasartoq. Naalerneq ukiuni taakkunani marlunnit aprilip 20-ata missaani aallartittarpoq. Ikiariissaarnera qummoortumik sarfarnermik imalunniit immap oqimaannerusup Disko Bugtip itinerusortaanut pulararneranik pissuteqarunarpoq. Tamatuma kinguneranik immap qaavata issussusia saannerulersar-poq immap qaava Disko Bugtimiit anialersarmat.
Disko Bugtimi 1997-imi 2005-imilu misissuinerit takutippaat immap qaava 100 m ippertussusilik Disko Bugtimi nalunaaquttap kaavin-neratut sarfarfeqarluni sarfartartoq. Iterlammi tassani sinerissap sar-faakiammik immamillu tarajuusumik pisarpoq sarfamit Den Vest-grønlandske Strøm-imik taaguutilimmit. Erngup ilaa Disko Bugtip kujasinnerusortaatigut iterlammiit aniasarpoq. Kangisinnerusortaani 1997-imi misissueqqissaarnerit takutippaat immattaaq ilaa iterlammit anisartoq Sullorsuaq aqqutigalugu.
Nalunaarusiap uuma siunertaraa – tamatuma hydrografi-ata misis-soqqissaarneqarneratigut – suut biologisk-imik tunisassiornermi piffissami sumiiffinnilu ”hot spot”-iusinnaasut paaserusunne-

10
qarnerat, ooliamik aniasoortoqassagaluarpat sukkut annertuner-paamik immap økologianut sunniuteqarnerpaassagunarnera paasi-umallugu. Nalunaarusiaq Disko Bugtimi hydrografi-mik, tappiorar-nartut uumasuunerannik aammalu raajat aalisakkallu piaraasa Disko Bugtimi immanullu Kalaallit Nunaata kujataani kitaaniittumut qanoq siaruarsimatiginerannik paasinninnerunissamut iluaqutaassaaq. Tas-sunga atatillugu hydrografi-ip inuussutissallu immap ikerinnaaniit-tut ataqatigiinnerannik ilisimasaqarneq pingaartorujussuuvoq. Im-mikkut arajutsinaveersaartariaqarpoq hydrografisk diskontinnuitet, imaappoq sumiiffinni immat assigiinngitsut naapiffiini annertu-sisumik biologiskimik pisoqarfiunerulernissaa ilimagineqarsin-naammat. Taamaattut tassaapput økologi-iikut ooliamik aniasoorto-qassagaluarpat sunnerneqarnissamut immikkut misikkarissuseqartut sunniuteqarfiunerusussallu.

11
1� Introduction
The interest for oil exploration in the Artic areas is increasing due to increased oil prices, new technology and last but not least the re-duced extensions of ice cover. This will open previously ice covered areas and make the logistic to drill less complicated and reduce the exploration expenses. Recently, interests in the potential oil resources of West Greenland have been made and oil prospecting on the shelf outside the Greenland west coast is under consideration.
The Greenland community and economy are strongly dependent on exploitation of marine resources. The major export income originates from fishery of fish and crustaceans. Disko Bay and the fishing banks along West Greenland are in this connection very import nursery and feeding grounds for most of the exploited fish, birds and mammal stocks. Consequently an oil spill in these sensitive areas potentially may impact the marine productivity and economy of the Greenlandic community. Investigations of the environmental impact of an oil spill on the structure and function of the Arctic marine ecosystem are li-mited.
Disko Bay is situated about 300 km north of the polar circle (69º15’N, 53º33’W). Disko Bay is located at the southern border of the arctic sea ice, and is thus likely to be affected by changing temperatures. The break-up of sea ice in Disko Bay normally takes place between April and May but oscillates considerably between years thereby influenc-ing the timing of the phytoplankton spring bloom and the initiation of the pelagic production. The temporal and spatial patterns of pro-duction are very heterogeneous – in general blooms are triggered in the spring when the stratification keeps the plankton in the illumi-nated part of the water columns. Most nutrients in the surface layer are depleted after the main bloom and the phytoplankton have to rely on nutrients regenerated in the surface layers. Hot spots in relation to production are observed in frontal systems where mixed and strati-fied waster masses meet, e.g. at the edge of the freshwater plume leaving Disko Bay. Other important hot spots are shallow areas, e.g. the fishing banks or islands where deep nutrient rich water upwells to the surface (Møller & Nielsen 2000).
These highly productive areas are very important for the production of the succeeding links in the pelagic food web, and often enhanced concentrations of fish, birds and mammals are also located here. In this report we will try to pinpoint the temporal and spatial produc-tivity hot spots, since these areas will be particularly sensitive to an oil spill.
The upper 500 m of the ocean along the Greenland west coast for are formed in the Arctic Ocean, in the Greenland Sea, Irminger Sea and the North Atlantic west of Cape Farewell (Buch 1990). The East Greenland Current (EGC) transports the water along the Greenland east coast to the southern part, Cape Farewell. The EGC changes then name to the West Greenland Current (WGC), and continues to flow north-westward along the Greenland west coast. The current mainly

12
follows the steep bottom slope westward of the Greenland west coast but complex topography, such as the fishing banks, deflects the cur-rent, and clockwise circulation around the banks is sometimes pre-sent (Ribergaard 2004). Along the path, ice melts from glaciers and sea ice which decreases the surface salinity. One fraction of the WGC deflects to the west at about 64°N (Buch 1990), towards the Canadian West Coast, making the WGC weaker. At about 69°N one branch of the WGC enters Disko Bay. CTD casts from the summer period shows that the deeper part of Disko Bay has similar T/S-characte-ristics as the water observed in Fylla Bank at depths of about 100-200 m, located upstream in the WGC (Sloth 1983). The intermediate water in Disko Bay is cold polar water, and the surface layer is polar water mixed with ice-melted water from glaciers and sea ice (Buch 1990).
Here we present historical observations and analyses of hydrography, nutrients, plankton, and shrimp and fish larvae from Disko Bay and the banks along the Greenland west coast, south of Disko. We also present some model results from a three dimensional hydrodynamic model. We focus on periods where we have the most extensive data sets; these are the years 1996, 1997, and the first ice free year observed in Disko Bay 2005. We also present results from a hydrodynamic model, describing hydrography and ocean currents in the region. Of special interest are highly productive areas and regions where possi-ble oil spills may have the greatest impact. We combine model results and analyses of observations to identify upwelling and frontal zones. These regions are highly productive areas with large biological activi-ty. Oil spill in these regions will have potentially large negative im-pact on the marine life.

13
2� Materials and methods
2.1� Disko Bay
The report summarises data on temporal and spatial patterns in the water column structure collected in the Disko Bay area during the last decade. Disko Bay is a 10,000 km2 large bay on the western part of Greenland. It is located about 300 km north of the polar circle (69°15’N, 53°33’W). The Baffin Bay and the Banks of Disko border the bay. There are two entrances into Disko Bay. The southern entrance is about 60 km wide, and has a narrow channel that is about 500 m deep. Islands and shallow depths dominate, however, the topography at the entrance. The northern entrance, Vaigat, is a 100 km long channel with a sill depth of about 250 m.
The data are composed of time series data collected at a permanent station of Qeqertarsuaq and data collected over the entire bay during cruises with R/V Adolf Jensen, Greenland Institute of Natural Re-sources.
Ice conditions were determined through satellite observations, and the model results from a three dimensional hydrodynamic model were performed by the Danish Meteorological Institute (DMI).
2.2� The permanent station
Time series studies were conducted at the Arctic Station, which is located approximately 1 nautical mile off Qeqertarsuaq (69°15’N, 53°33’W) in Disko Bay, West Greenland. The depth at the Arctic Sta-tion is about 250 m.
2.2.1� Annual study The site was visited 52 times from April 1996 to June 1997. Sampling was conducted in regular intervals except in may 1996 where the boat was docked for three weeks. During the open water period, the sta-tion was visited with the research vessel Porsild (Arctic Station, Co-penhagen University), while dog sledges were used during the ice covered season. When the bay was ice covered, sampling was con-ducted using a tripod trough a hole in the sea ice. Sampling was con-ducted around local noon. Vertical profiles of temperature, salinity and fluorescence were recorded from the surface to the bottom using a Seabird CTD. The in situ fluorometer was calibrated against spec-trophotometrically measured chl-content in the water samples taken at the routine depths and a linear regression was conducted. The sa-linity probe was calibrated against a Guildline Portasal salinometer using samples from the monthly high resolution stations. The in situ fluorometer was calibrated against the spectrophotometrically deter-mined chlorophyll concentrations in the water samples.

14
2.3� Cruises: Adolf Jensen
Three cruises were made during the summer period with Adolf Jensen (Greenland Institute of Natural Resources); see Table 2.1. Salinity, temperature and fluorescence were sampled on stations along tran-sects from 65°N to 69°15’N on the Greenland west coast and in Disko Bay.
2.3.1� Nutrients Samples for the determination of nutrient concentration (NO2
-, NO3
-, PO4
3-, SiO4
3-) were frozen on board the ship. Measurements were car-ried out at the National Environmental Research Institute (NERI) on an automatic nutrient analyzer (Dansk Havteknik) following Grass-hoff (1976). All nutrient samples were analysed in duplicate with a precision of 0.06, 0.09 and 0.12 µM for nitrate, phosphorus and sili-cate, respectively.
2.3.2� Chlorophyll-a and phytoplankton Samples (1-2 litres) intended for chlorophyll-a measurements were placed in the dark and within 3 hours after collection filtered at the land-based laboratory onto GF/F filters, extracted in 96% ethanol (Jespersen & Christoffersen 1987) and measured spectrophotometrically (Strickland & Parsons 1972).
2.3.3� Zooplankton Mesozooplankton were collected at four depth intervals: 0-50, 50-100, 100-150 and 150-200 m using a plankton pump (900 l min-1, mouth opening 25 cm) equipped with a 50 µm mesh size net with a non-filtering cod-end or a modified WP-2 net (mesh size 50 µm). The pump was retrieved slowly through the water column to obtain depth-integrated samples. A flowmeter at the entrance measured the volume filtered. The samples were concentrated on a 45 µm filter, preserved in 2-4% formalin, and stored for later enumeration and biomass estimation. The samples were split by a plankton splitter to obtain sample sizes of approximately 500 individuals, and all identi-fiable zooplankton were identified to either species or genus and de-velopmental stage. Prosome lengths were measured on 10 individuals from each copepodite stage and total body length was measured on 25 to 50 nauplii. Carbon content was estimated from length-weight regressions (from the literature).
2.3.4� Fish and shrimp larvae abundance For ichtyoplankton and larger zooplankton sampling we used a ring net with a diameter of 2 m, equipped with a black net of 16 m length and 1 mm mesh size. Oblique hauls were carried out to 10 m above sea bottom (maximal depth 90 m) at a ship’s speed of 3 knots. The net was deployed and retrieved at speeds of ∼20 and 10 m min-1, respec-tively. A calibrated flowmeter in the opening of the net was used to estimate filtered volume of water. The fish larvae were immediately sorted from the sample and preserved in 96% ethanol. In the labora-

15
tory, the larvae were identified to species, and up to 50 individuals per species and station were length measured to standard length.
2.4� Ice conditions
The ice concentration in this study is monthly mean values from the period 1996-1998. The data are satellite observations from SSM/I and SSMR data, derived from the Nimbus-7 Scanning Multichannel Mi-crowave Radiometer (SMMR) and the Defense Meteorological Satel-lite Program’s (DMSP) DMSP-F8, -F11 and -F13. Special Sensor Micro-wave/Imager (SSM/I) has been generated using the Bootstrap Algo-rithm with revised sets of tie-points (Comiso 2003).
2.5� Model description
The hydrodynamic simulations were performed by the Danish Mete-orological Institute (DMI), using the Hybrid Coordinate Ocean Model (HYCOM). The model is described in detail by Bleck (2002). It is a pri-mitive equation ocean general circulation model which solves the three-dimensional prognostic equations for horizontal velocity, salt and temperature. The vertical coordinate is generalized. In the hybrid configuration, the vertical coordinate is isopycnal in the open, strati-fied ocean, but smoothly reverts to a terrain-following coordinate in shallow coastal regions, and to z-level coordinates in the mixed layer and/or unstratified seas. The model includes a thermodynamic re-presentation of sea ice, but lack sea ice dynamics (ice drift). The present model set up is described in detail in Ribergaard et al. (2006). The model domain is divided into two regions, one large scale region covering the entire Arctic Ocean and North Atlantic north of approximately 20°S. It has a horizontal resolution of approximate 50 km
Table 2.1 Table summarising the origin of the CTD data. See Figure 2.1 for location of the stations.
Time period Station no. Type of data
1996-04-22 - 1997-06-19 Arctic Station salinity, temperature, fluorescence
2005-02-22 - 2005-05-30 Arctic Station salinity, temperature, fluorescence
1996-06-25 - 1996-06-28 1-14 salinity, temperature, fluorescence
1996-06-30 - 1996-07-02 15-29 salinity, temperature, fluorescence
1996-07-02 - 1996-07-03 30-39 salinity, temperature, fluorescence
1996-07-04 - 1996-07-05 40-52 salinity, temperature, fluorescence
1997-06-10 - 1997-06-11 5-10 salinity, temperature, fluorescence
1997-06-12 - 1997-06-13 13-18 salinity, temperature, fluorescence
1997-06-13 - 1997-06-14 22-31 salinity, temperature, fluorescence
1997-06-14 - 1997-06-16 32-40 salinity, temperature, fluorescence
1997-06-11 - 1997-06-16 11-36* salinity, temperature, fluorescence
1998-08-20 - 1998-08-21 1-11 salinity, temperature, fluorescence
* Not all stations between 11 and 36. Only stations 11, 12, 16, 20, 24, and 36 are used.

16
and with 29 layers in the vertical. This coarser model is nested with a more high-resolution model, with a horizontal resolution of approxi-mately 10 km, and with 26 layers in the vertical. The model domain for the smaller region covers the entire shelf around Greenland, most of the Canadian Archipelago, the Baffin Bay, the Labrador Sea, the Irminger Basin, Denmark Strait, and half the Iceland and Greenland Sea including the Fram Strait. The nesting procedure between the two model domains is a one-way. This means that the simulations are performed sequential and that output from the larger domain is used as boundary condition for the smaller domain, but there is no feed-back of information from the smaller domain to the larger. The model is initialized with high resolution (1/4°) climatological temperature and salinity fields by Boyer et al. (2005). These fields are also used for the relaxation procedure of the model surface tempera-ture and salinity. The atmospheric forcing fields are taken from the DMI numerical weather prediction model DMI-HIRLAM-T (Yang et al. 2005) covering a large part of the northern hemisphere with a 0.15 degree resolution.

17
A
B
Figure 2.1 A) Overview of the Greenland west coast and station map for transects performed in June 1996. B) Bathymetry in Disko Bay and station map for transects performed in June 1997. The Arctic Station is located close to station 22, just south of Disko Bay.
�����������
�����������
����� �
� ��������������������
����� �

18
[Blank page]

19
3� Monthly mean ice conditions from 1996 to 1998 and 2005
The duration and extension of the ice cover in Disko Bay showed large interannual variability. Since ice reflects more than 50% of incoming solar radiation, it has a large impact on the pelagic primary produc-tion. When other factors favour plankton bloom, e.g. shallow mixed layer depth, net primary production in the water column starts when the ice disappears. Here we present ice concentrations based on SSM/I and SSMR satellite data during 1996, 1997 and 1998, with a special focus on the spring (Comiso 2003).
In April 1996, Disko Bay was fully ice covered, and the ice concentra-tion just outside the bay was about 80-90% (Figure 3.1A). The ice break up in Disko Bay started in May, with an ice concentration of about 80-90% (Figure 3.1B). In June the southern entrance to Disko Bay was ice free, and the ice concentration in the inner parts of the bay was typically 30%, and in the Vaigat 70%. During fall and early winter the ice concentration changed back and forth with periods of ice growth and periods of ice melt. Ice concentration was generally higher in the inner parts of the bay than at the entrance and in the central parts of Disko Bay. The minimum ice concentration for this particular winter season occurred in January 1997. The ice concentra-tion in Disko Bay was then typically 20%, and 60-70% in the Vaigat. The ice growth season started in February, and the ice concentration quickly reached 80-90%, and remained at high values during March and April (Figure 3.1C).
Ice melt in May reduced the ice cover down to about 30-40% in Disko Bay, but was as high as 80-90% in the Vaigat (Figure 3.1D). Along the Greenland east coast south of Disko Bay, the ice concentration was less than 10% in May. In June and July the southern entrance to Disko Bay was ice free, the inner parts had an ice concentration of about 30%, and in Vaigat the concentration was about 70-80%. Some ice remained in the bay throughout the summer, mostly along the inner part and in the Vaigat. The minimum ice concentration for the winter season 1997/1998 occurred in November.
In 1998 there was much less ice in the area than in 1996-1997. In April the ice concentration in Disko Bay and south of the Bay was typically 50% (Figure 3.1E). In May the southern entrance was ice free, and the concentration of ice in the inner parts of Disko Bay was 30-40% (Figure 3.1F). In June the concentration was 20-30% in the bay, and in July the bay was ice free. The first year with no ice observed in Disko Bay was 2005 (O.M. Tervo, personal observations).

20
A
B
C
D
E
F
Figure 3.1 Maps showing ice concentration from SSM/I and SSMR data (Comiso 2003) during A) April 1996, B) May 1996, C) April 1997, D) May 1997, E) April 1998 and F) May 1998. The data are derived from the Nimbus-7 Scanning Multichannel Microwave Radiometer (SMMR) and the Defense Meteorological Satellite Program’s (DMSP) DMSP-F8, -F11 and -F13, Special Sensor Microwave/Imager (SSM/I) has been generated using the Bootstrap Algorithm with revised sets of tie-points.
����� �
������
����

21
4� Observations of hydrography, chlorophyll, plankton and larvae in the Disko Bay region
In this chapter we present time and horizontal variability of hydro-graphy, chlorophyll, plankton and larvae in the Disko Bay region. Observed time variability of hydrography and chlorophyll during the periods April 1996 to June 1997 and spring 2005 are from the perma-nent station 1 nautical mile south of Qeqertarsuaq, Arctic Station. The analyses of the horizontal variability in temperature and fluorescence are based on measurements concluded in Disko Bay and the Green-land west coast south of Disko Bay during June 1996, June 1997 and August 1998.
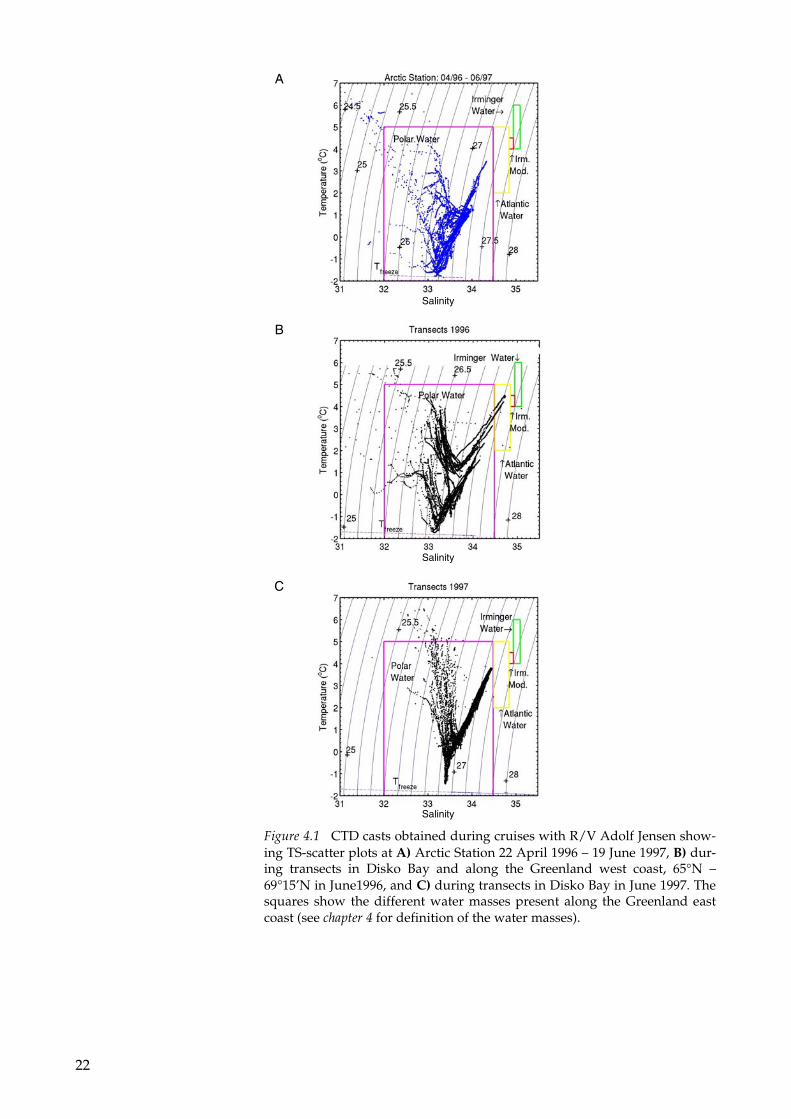
In this study we used the water mass definitions from Buch (1990), but broadening the salinity interval for polar water mass according to Rudels et al. (1999). The polar water mass originates from the upper layers of the Arctic Ocean, and has salinity (S) below 34.5 (Figure 4.1). Atlantic water that has a salinity interval of: 34.5 < S < 34.85 and tem-perature (T) around 4.5° C. In the Irminger Sea between Iceland and Greenland, Irminger water is formed, and has the following proper-ties: 34.95 <S < 35.1; 4° C < T < 6° C.
The observed T-S characteristics in June 1996 along the Greenland west coast showed that in the upper 150 m there was polar water mass and that there was a gradual cooling and decrease in the salinity of the water in the northern direction (Figure 4.1B). Warm Atlantic water was observed in the deeper parts of the zonal transects along 65°N and 66°N (see Figure 2.1A for location). The minimum tempera-ture at these two transects was about 1° C. In the two northern tran-sects, the minimum temperature was close to the freezing tempera-ture, and the salinity was below the lower limit for Atlantic water, that is 34.5. The T-S properties observed from April 1996 to June 1997 in Disko Bay at Arctic Station, 69°15’N, 53°33’W, and in the transects sampled in Disko Bay early summer in 1997 (see Figure 2.1A for loca-tion) showed that there was only polar water mass in Disko Bay (Figure 4.1). Ice melt from glaciers and sea ice in Disko Bay decreased the sur-face salinity below the lower limit of salinity for polar water (Figure 4.1A).
22
A
Salinity
B
Salinity
C
Salinity
Figure 4.1 CTD casts obtained during cruises with R/V Adolf Jensen show-ing TS-scatter plots at A) Arctic Station 22 April 1996 – 19 June 1997, B) dur-ing transects in Disko Bay and along the Greenland west coast, 65°N – 69°15’N in June1996, and C) during transects in Disko Bay in June 1997. The squares show the different water masses present along the Greenland east coast (see chapter 4 for definition of the water masses).

23
4.1� Annual cycle of temperature, salinity, and density
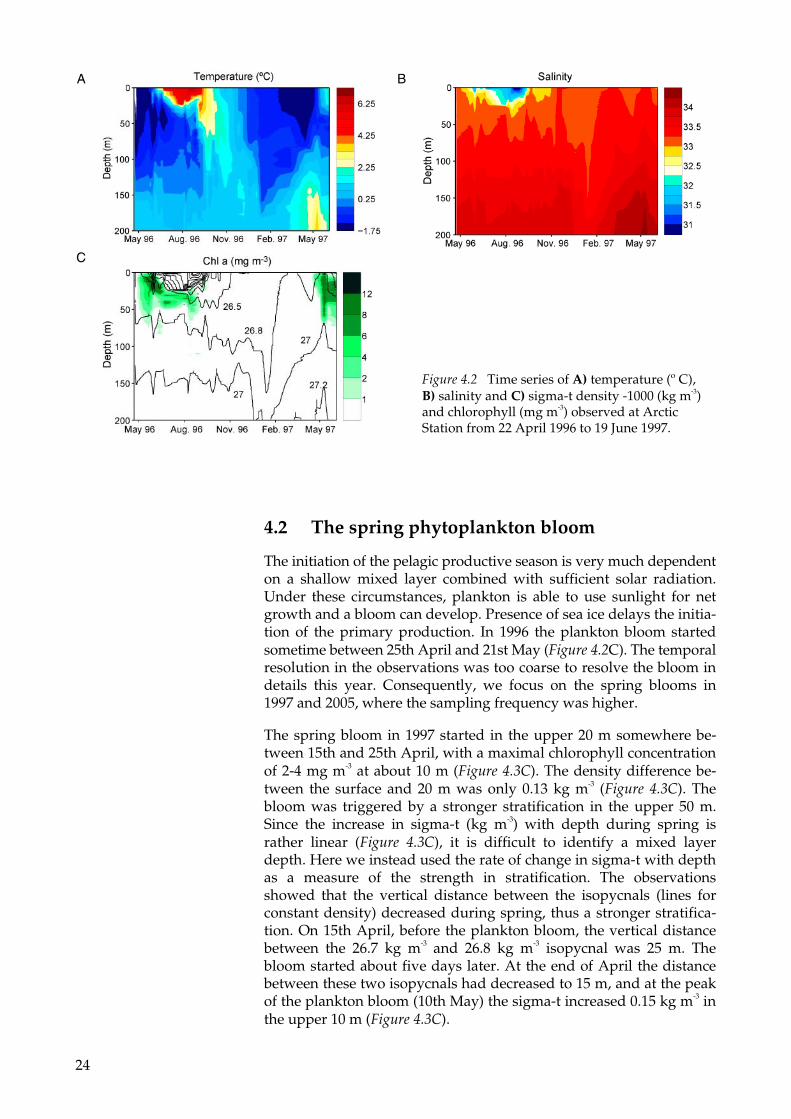
Observations at the 250 m deep station located 1 nautical mile south of Qeqertarsuaq (the Arctic Station) showed that the surface mixed layer was 50 m deep at the end of April 1996. The mixed layer tem-perature was close to freezing point (Figure 4.2A) and the mixed layer salinity was about 33.4 (Figure 4.2B). In May runoff from melting gla-ciers decreased the sea surface salinity down to about 32, and the mixed layer thickness to about 10 m. Intensified solar radiation in summer together with a thinner mixed layer increased the tempera-ture and consequently also the ice melt rate. At the end of August the sea surface temperature was about 7° C and the sea surface salinity had decreased down to about 30.5. Wind mixing increased the depth of the mixed layer from 10 m in June to 25 m in late August. In late summer, the stronger stratification inhibited vertical mixing of warm surface water with water from deeper layers. During September ad-vection from regions outside the bay increased the surface salinity from 30.5 to above 33. Convection could not have generated the in-crease in surface salinity. Vertical mixing would then decrease the salinity below the surface layer, which was not the case. Weak strati-fication in salinity together with continued cooling during fall strengthened the convection deeper down in the water column. In January the succeeding year, the mixed layer thickness had increased to 200 m and the temperature had reached the freezing point. Freez-ing temperature at the surface in January indicates the start of the ice growth season. In chapter 3 it was shown that the ice growth season was between January and April. During this period, the sea surface salinity was rather constant, meaning that brine rejection and advec-tion had insignificant effect on the surface salinity during the ice growth season. From February 1997 to May 1997 warm and saline water was advected from the sea, increasing the temperature and salinity in the deeper layers (below 100 m depth) (Figure 4.2). The stratification in spring was generated by a larger increase in salinity at the deeper layers than at the surface (see also section 4.2). Com-pared to 1996, the warming period, as determined from temperature and salinity, started about one week earlier in 1997, and two weeks earlier in 2005 (data not shown). Ice concentration in spring thus had to some extent an effect on the warming period. The monthly mean of observed ice concentration in Disko Bay in April 1996 was almost 100% in 1996, 70% in April 1997 and in 2005 Disko Bay was ice free the whole season (chapter 3). In May observed ice concentrations were 70-80% in 1996 and about 40% in 1997 (see chapter 3).
24
4.2� The spring phytoplankton bloom
The initiation of the pelagic productive season is very much dependent on a shallow mixed layer combined with sufficient solar radiation. Under these circumstances, plankton is able to use sunlight for net growth and a bloom can develop. Presence of sea ice delays the initia-tion of the primary production. In 1996 the plankton bloom started sometime between 25th April and 21st May (Figure 4.2C). The temporal resolution in the observations was too coarse to resolve the bloom in details this year. Consequently, we focus on the spring blooms in 1997 and 2005, where the sampling frequency was higher.
The spring bloom in 1997 started in the upper 20 m somewhere be-tween 15th and 25th April, with a maximal chlorophyll concentration of 2-4 mg m-3 at about 10 m (Figure 4.3C). The density difference be-tween the surface and 20 m was only 0.13 kg m-3 (Figure 4.3C). The bloom was triggered by a stronger stratification in the upper 50 m. Since the increase in sigma-t (kg m-3) with depth during spring is rather linear (Figure 4.3C), it is difficult to identify a mixed layer depth. Here we instead used the rate of change in sigma-t with depth as a measure of the strength in stratification. The observations showed that the vertical distance between the isopycnals (lines for constant density) decreased during spring, thus a stronger stratifica-tion. On 15th April, before the plankton bloom, the vertical distance between the 26.7 kg m-3 and 26.8 kg m-3 isopycnal was 25 m. The bloom started about five days later. At the end of April the distance between these two isopycnals had decreased to 15 m, and at the peak of the plankton bloom (10th May) the sigma-t increased 0.15 kg m-3 in the upper 10 m (Figure 4.3C).
A
B
C
Figure 4.2 Time series of A) temperature (º C), B) salinity and C) sigma-t density -1000 (kg m-3) and chlorophyll (mg m-3) observed at Arctic Station from 22 April 1996 to 19 June 1997.

25
Since the changes in salinity and temperature at greater depths occur at an earlier time than at the surface (Figure 4.3A & B), we suggest that the increased stratification discussed above was primarily gene-rated by upwelling or advection of water; not by changes at the sur-face due to heating or freshwater outflow. During the second half of May, melt water outflow from glaciers reduced the sea surface salinity with about 0.3 and the upper 5 m became highly stratified. The heat was trapped in the shallow mixed layer and the temperature in-creased rapidly from –0.5° C to 1.5° C (Figure 4.3A). The concentration of nutrients (not shown) and chlorophyll (Figure 4.3C) decreased ra-pidly. The decrease in plankton concentration may be due to rapid consumption of nutrients in the shallow surface layer or due to freshwater outflow from glaciers that contains extremely low concen-trations of nutrients. The highest phytoplankton biomass observed in late May and early June was found from 20 to 60 m depth (Figure 4.3C).
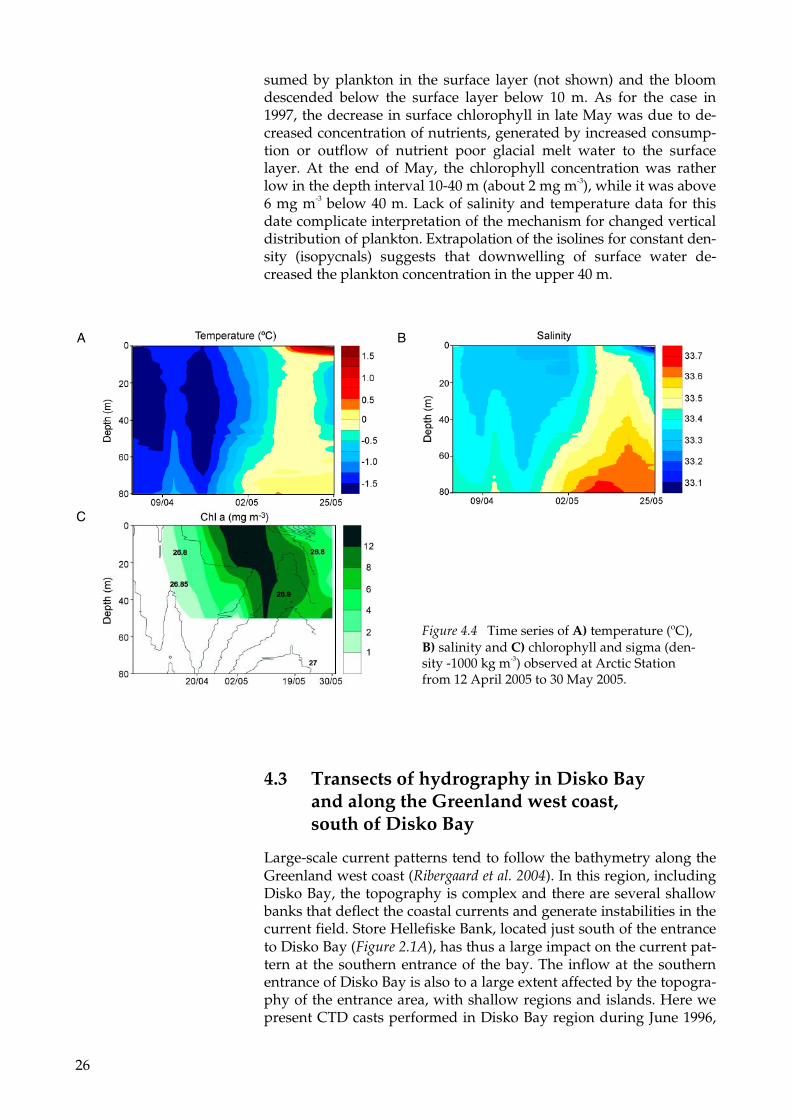
In early April 2005, the temperature in the upper 80 m was close to freezing point (Figure 4.4A), and the salinity increased by about 0.1 from the surface to 80 m (Figure 4.4B). The plankton bloom started around 20th of April (Fig. 4.4C). At this point the increase in salinity below the surface layer had generated a stratification (Figure 4.4B) that made it possible for plankton to stay in the upper layers. Note that only a density difference between the surface and 50 m of about 0.1 kg m-3 was needed to trigger the bloom (Figure 4.4C). A rather constant surface salinity together with continued increase in salinity below the surface layer in the beginning of May boosted the plankton bloom (Figure 4.4C). Freshwater outflow in the middle of May de-creased the mixed layer salinity and mixed layer depth down to 33.1 and five meters, respectively (Figure 4.4B). The nutrients rapidly con-
A
B
C
Figure 4.3 Time series of A) temperature (ºC), B) salinity and C) sigma-t (density -1000, kg m-3) and chlorophyll observed at Arctic Station from 10 April 1997 to 3 June 1997.
26
sumed by plankton in the surface layer (not shown) and the bloom descended below the surface layer below 10 m. As for the case in 1997, the decrease in surface chlorophyll in late May was due to de-creased concentration of nutrients, generated by increased consump-tion or outflow of nutrient poor glacial melt water to the surface layer. At the end of May, the chlorophyll concentration was rather low in the depth interval 10-40 m (about 2 mg m-3), while it was above 6 mg m-3 below 40 m. Lack of salinity and temperature data for this date complicate interpretation of the mechanism for changed vertical distribution of plankton. Extrapolation of the isolines for constant den-sity (isopycnals) suggests that downwelling of surface water de-creased the plankton concentration in the upper 40 m.
4.3� Transects of hydrography in Disko Bay and along the Greenland west coast, south of Disko Bay
Large-scale current patterns tend to follow the bathymetry along the Greenland west coast (Ribergaard et al. 2004). In this region, including Disko Bay, the topography is complex and there are several shallow banks that deflect the coastal currents and generate instabilities in the current field. Store Hellefiske Bank, located just south of the entrance to Disko Bay (Figure 2.1A), has thus a large impact on the current pat-tern at the southern entrance of the bay. The inflow at the southern entrance of Disko Bay is also to a large extent affected by the topogra-phy of the entrance area, with shallow regions and islands. Here we present CTD casts performed in Disko Bay region during June 1996,
A
B
C
Figure 4.4 Time series of A) temperature (ºC), B) salinity and C) chlorophyll and sigma (den-sity -1000 kg m-3) observed at Arctic Station from 12 April 2005 to 30 May 2005.

27
June 1997 (Figure 2.1), and briefly discuss the observations made in August 1998. Analyses of the CTD casts give information of the hori-zontal distribution of salinity, temperature, and fluorescence after the spring bloom. The analyses may also give some ideas of possible in-ternal wave activity and the baroclinic currents, which are currents generated by horizontal density differences and earth rotation. In steady state, the current is directed perpendicular, and to the right of the pressure gradient. For example, less dense water concentrated along the Greenland west coast generates a northward flowing coastal current. The analyses of the currents in sections 4.3.1 - 4.3.2 are based on the measurements at that particular time and may be more or less persistent.
4.3.1� June 1996 The West Greenland Current (WGC) originates from the Arctic Ocean and flows southward through the Fram Strait and along the Green-land east coast, turning northward again to the Greenland west coast. The WGC is located further offshore than the transect along 66°N (Figure 2.1), and at the transect along 65°N only the westernmost sta-tion (station no. 40) gives some information about the WGC (not shown). The distribution of salinity and temperature are therefore only briefly discussed below. The density variation in the transects was mainly determined by the distribution of the salinity and thus to a lesser extent by temperature. There was a 40 km wide low saline, warm core along the coast suggesting a northward surface current. Both transects (along 65°N and 66°N) crossed a shallow bank. West of the banks, at 50-140 m depth, there were cold cores along the bottom slope. From 50 to 150 m the salinity and density increased from the bottom slope towards the west, suggesting a southward baroclinic current. The transect along 65°N had deeper layers, where salinity below 150 m was above 34.5, and the isopycnals were sloping up-wards towards the bank. This suggests that there was a northward flowing current of Atlantic water. This water was about 2° C warmer than the layers above. Fluorescence was also measured along the transects south of 68°N, but the concentration was very low and therefore not discussed.
The transect along 67°30’N (Figure 2.1) is located just south of Disko Bay and crosses Store Hellefiske Bank. Along this transect, Store Hellefiske Bank is located about 50-100 km from the coast. The WGC is located at about 100 km to 150 km away from the coast, trapped along the steep bottom slope westward of Store Hellefiske Bank (Figure 4.5). The upper 25 m of the WGC had been diluted with freshwater from melting glaciers and sea ice. The solar heating during spring was trapped within this shallow layer, resulting in a relatively warm low saline layer with a temperature close to 0.5° C and a salinity of about 32.2-33.2. At greater depths, there was polar water present originating from the Arctic Ocean that had been in contact with the sea surface during the previous winter, which explains the cold and more saline water. Below 100 m the salinity and temperature in-creased with depth, but not high enough to be characterized as Atlan-tic water. Between the transects along 67°30’ N and 69°N, the WGC splits into three branches. One part continued northward, a second branch entered Disko Bay and the third continued to follow the bottom
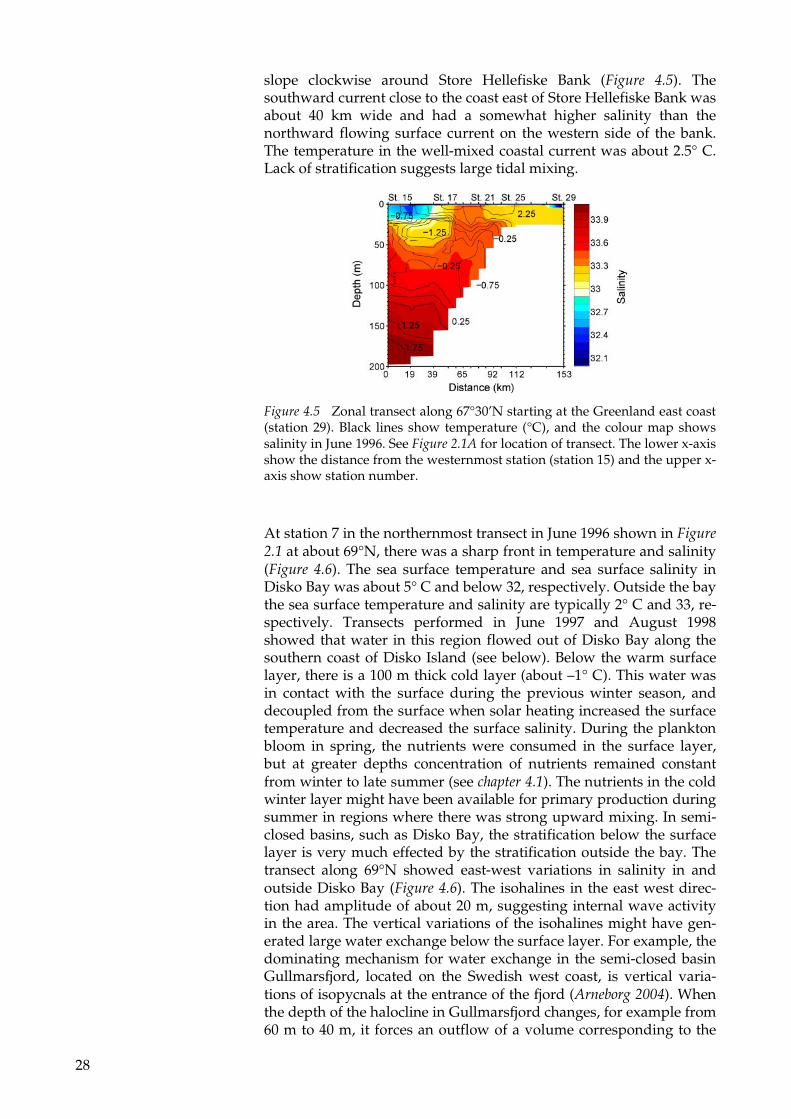
28
slope clockwise around Store Hellefiske Bank (Figure 4.5). The southward current close to the coast east of Store Hellefiske Bank was about 40 km wide and had a somewhat higher salinity than the northward flowing surface current on the western side of the bank. The temperature in the well-mixed coastal current was about 2.5° C. Lack of stratification suggests large tidal mixing.
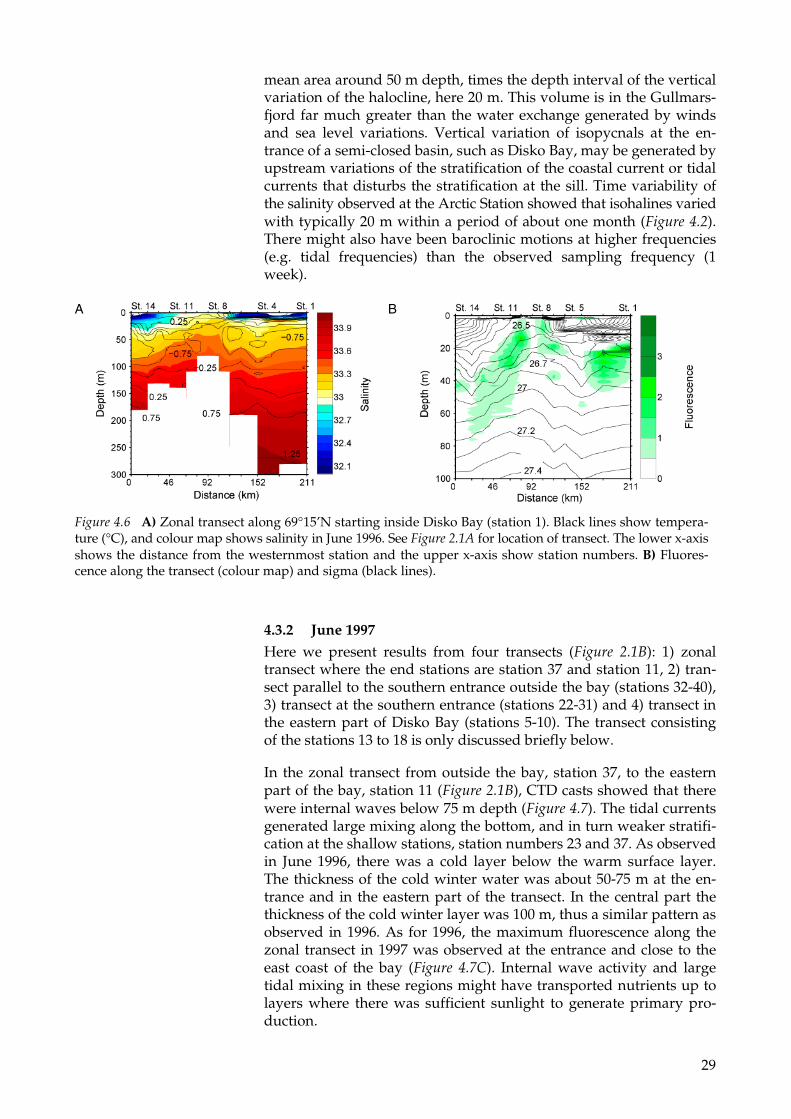
At station 7 in the northernmost transect in June 1996 shown in Figure 2.1 at about 69°N, there was a sharp front in temperature and salinity (Figure 4.6). The sea surface temperature and sea surface salinity in Disko Bay was about 5° C and below 32, respectively. Outside the bay the sea surface temperature and salinity are typically 2° C and 33, re-spectively. Transects performed in June 1997 and August 1998 showed that water in this region flowed out of Disko Bay along the southern coast of Disko Island (see below). Below the warm surface layer, there is a 100 m thick cold layer (about –1° C). This water was in contact with the surface during the previous winter season, and decoupled from the surface when solar heating increased the surface temperature and decreased the surface salinity. During the plankton bloom in spring, the nutrients were consumed in the surface layer, but at greater depths concentration of nutrients remained constant from winter to late summer (see chapter 4.1). The nutrients in the cold winter layer might have been available for primary production during summer in regions where there was strong upward mixing. In semi-closed basins, such as Disko Bay, the stratification below the surface layer is very much effected by the stratification outside the bay. The transect along 69°N showed east-west variations in salinity in and outside Disko Bay (Figure 4.6). The isohalines in the east west direc-tion had amplitude of about 20 m, suggesting internal wave activity in the area. The vertical variations of the isohalines might have gen-erated large water exchange below the surface layer. For example, the dominating mechanism for water exchange in the semi-closed basin Gullmarsfjord, located on the Swedish west coast, is vertical varia-tions of isopycnals at the entrance of the fjord (Arneborg 2004). When the depth of the halocline in Gullmarsfjord changes, for example from 60 m to 40 m, it forces an outflow of a volume corresponding to the
Figure 4.5 Zonal transect along 67°30’N starting at the Greenland east coast (station 29). Black lines show temperature (°C), and the colour map shows salinity in June 1996. See Figure 2.1A for location of transect. The lower x-axis show the distance from the westernmost station (station 15) and the upper x-axis show station number.
29
mean area around 50 m depth, times the depth interval of the vertical variation of the halocline, here 20 m. This volume is in the Gullmars-fjord far much greater than the water exchange generated by winds and sea level variations. Vertical variation of isopycnals at the en-trance of a semi-closed basin, such as Disko Bay, may be generated by upstream variations of the stratification of the coastal current or tidal currents that disturbs the stratification at the sill. Time variability of the salinity observed at the Arctic Station showed that isohalines varied with typically 20 m within a period of about one month (Figure 4.2). There might also have been baroclinic motions at higher frequencies (e.g. tidal frequencies) than the observed sampling frequency (1 week).
4.3.2� June 1997
Here we present results from four transects (Figure 2.1B): 1) zonal transect where the end stations are station 37 and station 11, 2) tran-sect parallel to the southern entrance outside the bay (stations 32-40), 3) transect at the southern entrance (stations 22-31) and 4) transect in the eastern part of Disko Bay (stations 5-10). The transect consisting of the stations 13 to 18 is only discussed briefly below.
In the zonal transect from outside the bay, station 37, to the eastern part of the bay, station 11 (Figure 2.1B), CTD casts showed that there were internal waves below 75 m depth (Figure 4.7). The tidal currents generated large mixing along the bottom, and in turn weaker stratifi-cation at the shallow stations, station numbers 23 and 37. As observed in June 1996, there was a cold layer below the warm surface layer. The thickness of the cold winter water was about 50-75 m at the en-trance and in the eastern part of the transect. In the central part the thickness of the cold winter layer was 100 m, thus a similar pattern as observed in 1996. As for 1996, the maximum fluorescence along the zonal transect in 1997 was observed at the entrance and close to the east coast of the bay (Figure 4.7C). Internal wave activity and large tidal mixing in these regions might have transported nutrients up to layers where there was sufficient sunlight to generate primary pro-duction.
A
B
Figure 4.6 A) Zonal transect along 69°15’N starting inside Disko Bay (station 1). Black lines show tempera-ture (°C), and colour map shows salinity in June 1996. See Figure 2.1A for location of transect. The lower x-axis shows the distance from the westernmost station and the upper x-axis show station numbers. B) Fluores-cence along the transect (colour map) and sigma (black lines).

30
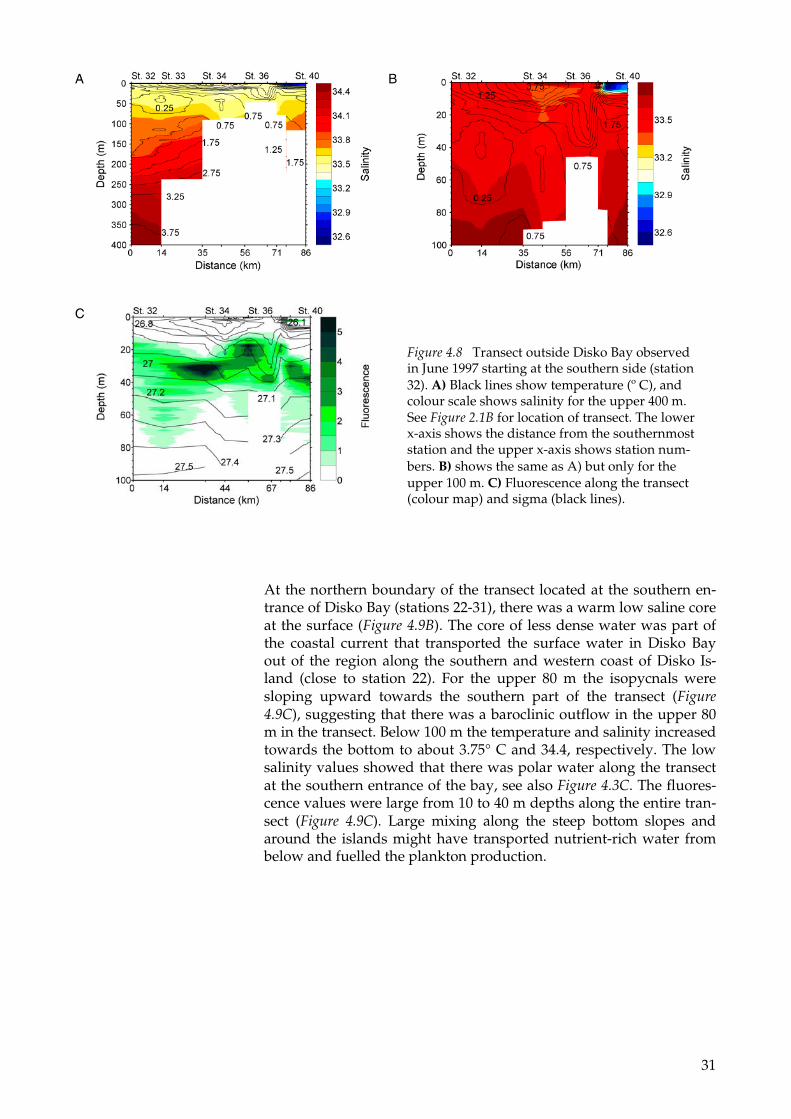
The salinity along the transect located outside Disko Bay (stations 32-40) was below 34.4. This means that there was polar water along the entire transect. Between two warm cores of about 5° C in the upper 10 m (Figure 4.8B), the temperature was lower and the salinity higher (Figure 4.8B), and thus more dense (Figure 4.8C). High values of fluo-rescence were also observed in this shallow part of the transect (Figure 4.8C). The dense water and large plankton concentration may be ex-plained by vertical upward mixing of subsurface nutrient rich waters to layers with sufficient light for plankton growth. The minimum temperature along the transect (0.25° C) was found in the southern part at a depth of 30-50 m (Figure 4.8B). The temperature and salinity increased up to about 3° C and 34.4 at a depth of 400 m. Between the stations 32 and 34, the isohalines and isotherms below 50 m were sloping upward towards north (Figure 4.8A), suggesting a baroclinic outflow of warm and saline water from Disko Bay.
A
B
C
Figure 4.7 Zonal transect observed in June 1997 along 69°15’N starting inside Disko Bay (station 11). A) Black lines show temperature (°C) and colour map shows salinity for the upper 350 m. See Figure 2.1B for location of transect. The lower x-axis shows the distance from the westernmost station and the upper x-axis shows station num-bers. B) shows the same as A) but only for the upper 100 m. C) Fluorescence along the transect (colour map) and sigma (black lines).
31
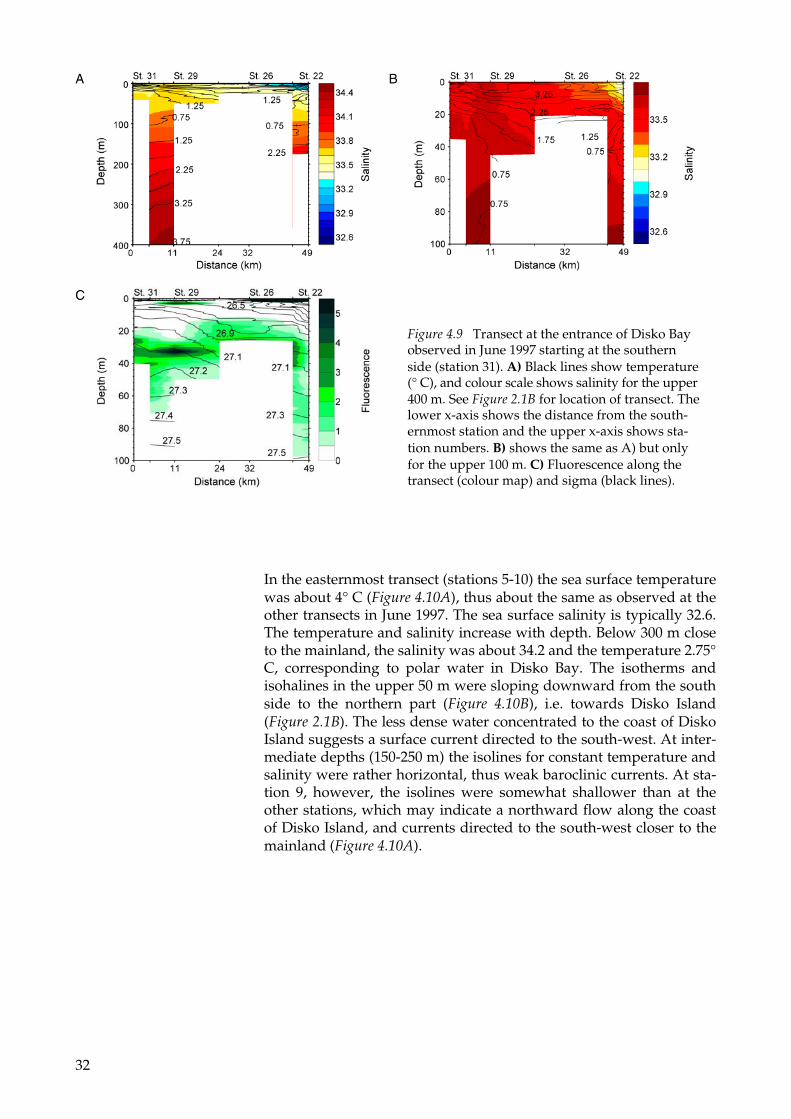
At the northern boundary of the transect located at the southern en-trance of Disko Bay (stations 22-31), there was a warm low saline core at the surface (Figure 4.9B). The core of less dense water was part of the coastal current that transported the surface water in Disko Bay out of the region along the southern and western coast of Disko Is-land (close to station 22). For the upper 80 m the isopycnals were sloping upward towards the southern part of the transect (Figure 4.9C), suggesting that there was a baroclinic outflow in the upper 80 m in the transect. Below 100 m the temperature and salinity increased towards the bottom to about 3.75° C and 34.4, respectively. The low salinity values showed that there was polar water along the transect at the southern entrance of the bay, see also Figure 4.3C. The fluores-cence values were large from 10 to 40 m depths along the entire tran-sect (Figure 4.9C). Large mixing along the steep bottom slopes and around the islands might have transported nutrient-rich water from below and fuelled the plankton production.
A
B
C
Figure 4.8 Transect outside Disko Bay observed in June 1997 starting at the southern side (station 32). A) Black lines show temperature (º C), and colour scale shows salinity for the upper 400 m. See Figure 2.1B for location of transect. The lower x-axis shows the distance from the southernmost station and the upper x-axis shows station num-bers. B) shows the same as A) but only for the upper 100 m. C) Fluorescence along the transect (colour map) and sigma (black lines).
32
In the easternmost transect (stations 5-10) the sea surface temperature was about 4° C (Figure 4.10A), thus about the same as observed at the other transects in June 1997. The sea surface salinity is typically 32.6. The temperature and salinity increase with depth. Below 300 m close to the mainland, the salinity was about 34.2 and the temperature 2.75° C, corresponding to polar water in Disko Bay. The isotherms and isohalines in the upper 50 m were sloping downward from the south side to the northern part (Figure 4.10B), i.e. towards Disko Island (Figure 2.1B). The less dense water concentrated to the coast of Disko Island suggests a surface current directed to the south-west. At inter-mediate depths (150-250 m) the isolines for constant temperature and salinity were rather horizontal, thus weak baroclinic currents. At sta-tion 9, however, the isolines were somewhat shallower than at the other stations, which may indicate a northward flow along the coast of Disko Island, and currents directed to the south-west closer to the mainland (Figure 4.10A).
A
B
C
Figure 4.9 Transect at the entrance of Disko Bay observed in June 1997 starting at the southern side (station 31). A) Black lines show temperature (° C), and colour scale shows salinity for the upper 400 m. See Figure 2.1B for location of transect. The lower x-axis shows the distance from the south-ernmost station and the upper x-axis shows sta-tion numbers. B) shows the same as A) but only for the upper 100 m. C) Fluorescence along the transect (colour map) and sigma (black lines).

33
Along the transect covering the stations 13 to 18, the isotherms and isohalines followed a similar pattern as in the easternmost transect (not shown). Some differences in the upper 100 m were present though, such as parallel isolines in the upper 25 m, suggesting no baroclinic currents in the surface layer at the time when the measure-ments were performed. In the central part of the transect at about 25-100 m, there was a cold and less saline core, similar to the zonal tran-sect discussed above (stations 11-37). The similar patterns in the hy-drography in the zonal transect (stations 11-37) and near meridional transect (stations 13-18) showed that there was a cold and low saline core in the central part of the bay, and warmer and more saline water towards the coast. The domelike structure in the central part of the bay also suggests that that there was a clockwise circulation along the coast consisting of warm and salty water, and cold less saline water that was more stagnant in the central part of the bay. Inflow from the WGC fed the circulation in the bay with warm and salty water. The minimum temperature observed at the southern entrance of the bay was 0.25° C (Figure 4.9B).
Transects in August 1998 also exhibited similar domelike patterns in hydrography (not shown). However, the temperature at the coast and in the central parts was about 1° C higher than in June 1997 and June 1996. The warmer water along the coast might also be an indication of upwelling or vertical mixing. The transects in August 1998 were located perpendicular to the south and southwest coast of Disko Is-land. The hydrography from these transects showed that the surface mixed layer was 20 m, thus 10 m thicker than in June 1996 and June
A
B
C
Figure 4.10 The easternmost transect at the en-trance of Disko Bay observed in June 1997 starting at the southern side (station 10) to the Disko Is-land coastline (station 5). A) Black lines show temperature (°C), and colour scale shows salinity for the upper 400 m. See Figure 2.1B for location of transect. The lower x-axis shows the distance from the southernmost station and the upper x-axis shows station numbers. B) shows the same as A) but only for the upper 100 m. C) Fluorescence along the transect (colour map) and sigma (black lines).

34
1997. The sea surface temperature and salinity in the bay were about 6° C and 32, respectively. The transect at the southern entrance of the bay followed a similar structure as in June 1997, with weak stratifica-tion in the upper 50 m in the shallow parts and close to the islands, and downward sloping isohalines from the central part of the tran-sect towards the southern side. The warmer and less saline water in the surface layer made the pycnocline stronger than in June the two previous years. The stronger pycnocline in late summer made it more difficult to mix nutrient-rich water from below and to generate pri-mary production.
4.4� The fate of the primary production, i.e. coupling to the higher trophic levels
The fishing banks along south western Greenland and the Disko Bay area are important spawning, nursery and fishing ground, especially for the northern shrimp (Pandalus borealis) and Greenland halibut (Reinhardtius hippoglossoides) (Buch et al. 2004, Simonsen et al. 2006). Through their early life, the larvae are spread by the currents from the spawning grounds. During their early life they are dependent of the plankton food until they settle to the bottom and feed on benthic invertebrates. In this chapter we summarize the knowledge about the pelagic food web with emphasis on the key processes responsible for the temporal and spatial distribution of shrimp and fish larvae.
4.4.1� Disko Bay The development of the spring bloom is the single most important event determining the production capacity of the arctic marine food webs. The onset of the bloom varies between years depending on duration of ice cover, hydrography and meteorological conditions as documented above (see 4.2). But when the water column is stabilized, the spring diatom bloom develops exponentially and quickly depletes the surface layer for nutrients after which it settles out of the euphotic zone (Figures 4.2, 4.3. 4.4).
Disko Bay off Qeqertarsuaq is the only locality along western Greenland where the annual dynamics of the plankton community have been investigated at high temporal resolution. During 1996 to 1997 a very intense sampling programme (Figure 4.11) was conducted from the Arctic Station (Levinsen et al. 2000, Madsen et al. 2001). The knowledge gained from this station will in the following be used as background for the evaluation of implications of oil spills in areas where the sampling effort is less intensive.
Copepods of the genus Calanus are key players in high latitude ma-rine ecosystems. They dominate the mesozooplankton communities, are significant grazers on the primary production (Nielsen & Hansen 1995 and Levinsen & Nielsen 2002) and constitute an important prey item for numerous fish, birds and whale populations. At the same time Calanus have a key role in the supply of high quality food to the benthic communities by acceleration of the vertical flux trough pro-duction of large fast sinking faecal pellets (Pedersen et al. 2006). In Greenland waters three species of Calanus totally dominate the meso-

35
zooplankton community during spring and early summer (Møller et al. 2006, Madsen et al. 2001). Calanus hyperboreus and Calanus glacialis are true arctic species inhabiting polar waters, while Calanus fin-marchicus is a temperate species associated with Atlantic waters (Hirche et al. 1991, Conover 1988). In Disko Bay the three species meet and co-exist in the same biomass (Madsen et al. 2001) being the northern border for C. finmarchicus and the southern for C. glacialis.
The Calanus have developed life strategies involving hibernation in deep cold waters during winter followed by ascend to the productive layers in early spring when the spring bloom develops, where spaw-ning, feeding and refuelling of lipid stores are initiated after which
A M J J A S O N D J F M A M J1996 1997
8000
6000
4000
2000
0
D
1600
800
1400
400
0
C
1200
900
600
300
0
B
30000
20000
10000
0
Biomass, Phytoplankton, mg m-2
Biomass, Ciliates, mg m-2
Biomass, Dinoflagellates, mg m-2
Biomass, Copepods, mg m-2
A
Figure 4.11 Annual cycle integrated biomass (mg C m-2) of the pelagic com-munity in Disko Bay off Qeqertarsuaq. A) integrated phytoplankton bio-mass, B) ciliates, C) heterotrophic dinoflagellates, and D) copepods. The blue bars indicate the ice cover. From Nielsen 2005.

36
the adults leave the surface layers in the late summer (Figure 4.12). Later in the season, the Calanus can be brought to the surface layers in connection with upwelling along the fishing banks or islands (Møller & Nielsen 2002) or in association with fronts, e.g. the freshwater influ-enced plume of the Jakobshavn ice glacier (Munk et al. 2003).
The main grazers in the surface layer after the larger zooplankters have left are developmental stages of copepods and microprotozoo-plankton (Figure 4.11).
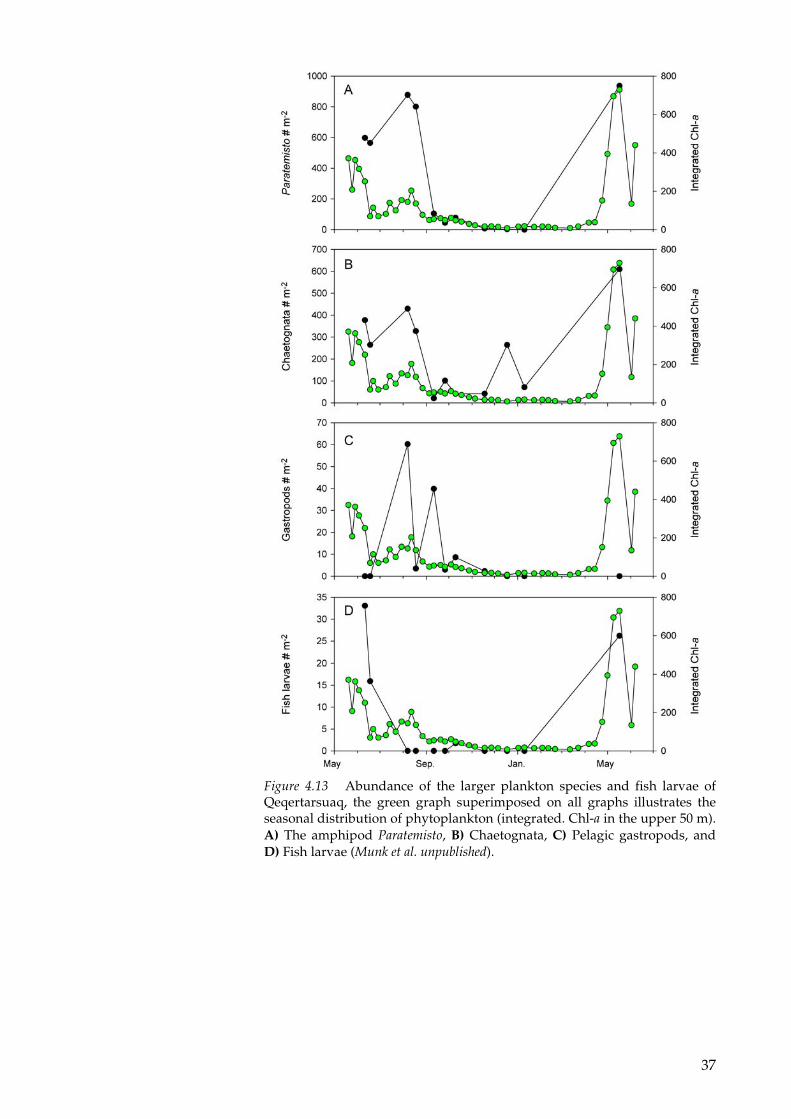
High-resolution knowledge about the seasonal distribution of the larger non-copepod zooplankton, e.g. amphipods, krill and shrimp and fish larvae in arctic waters is very limited. During the intensive investigations of the pelagic ecosystem off Qeqertarsuaq, the larger zooplankton and fish larvae were collected along with the other pela-gic parameters (Figure 4.13).
It is obvious that the peak abundance of the larger zooplankton, e.g. the amphipods Parathemisto, the chaetoganths, the pelagic gastro-pods, are very closely coupled to the spring bloom and the popula-tion of the Calanus in the surface water. After mid summer most of the larger zooplankters and fish larvae are more scattered and not present in the surface layer in high concentration.
150-250 m30
25
2
15
10
5
0JJ A S O N D J F M A M
Biomass mg C m-3
0-50 m
Calanus finmarchius
30
25
2
15
10
5
0
50-100 m30
25
2
15
10
5
0
150-250 m30
25
2-
15
10
5
0J J A S O N D J F M A M
Biomass mg C m-3
0-50 m
Calanus glacialis
30
25
2-
15
10
5
0
50-100 m30
25
2-
15
10
5
0
150-250 m30
25
2
15
10
5
0J J A S O N D J F M A M
Biomass mg C m-3
0-50 m
Calanus hyperboreus
30
25
2
15
10
5
0
50-100 m30
25
2
15
10
5
0
Figure 4.12 The mesozooplankton, i.e. the zooplankton > 200 µm, are totally dominated by three Calanus species The three Calanus species primarily oc-cur in the surface layers from April to June when they exploit their lipid stores after the spawning period. Later in the season they migrate to deeper water to their hibernation depths (Nielsen 2005).
37
Figure 4.13 Abundance of the larger plankton species and fish larvae of Qeqertarsuaq, the green graph superimposed on all graphs illustrates the seasonal distribution of phytoplankton (integrated. Chl-a in the upper 50 m). A) The amphipod Paratemisto, B) Chaetognata, C) Pelagic gastropods, and D) Fish larvae (Munk et al. unpublished).
38
4.4.2� The banks off western Greenland Information about the plankton dynamics and the marine ecosystem outside Disko Bay is based on a much lower temporal resolution than the investigation in the bay. Due to logistic constraints, most of the surveys outside the bay have been conducted during the open water period. However, the overall succession patterns resemble those de-scribed for Disko Bay.
In the past the investigations along the coast off south western Greenland were associated with fisheries research and exploitation of the marine resources. The main focus has been primary production (Smidt 1979) and the distribution of mesozooplankton, i.e. the direct link to the fish stock (Jespersen 1934, Ussing 1938, Smidt 1979, Digby 1953, Pedersen & Smidt 2000). These investigations have all demon-strated the prominent role of the large copepod genus Calanus in the marine ecosystem around Greenland.
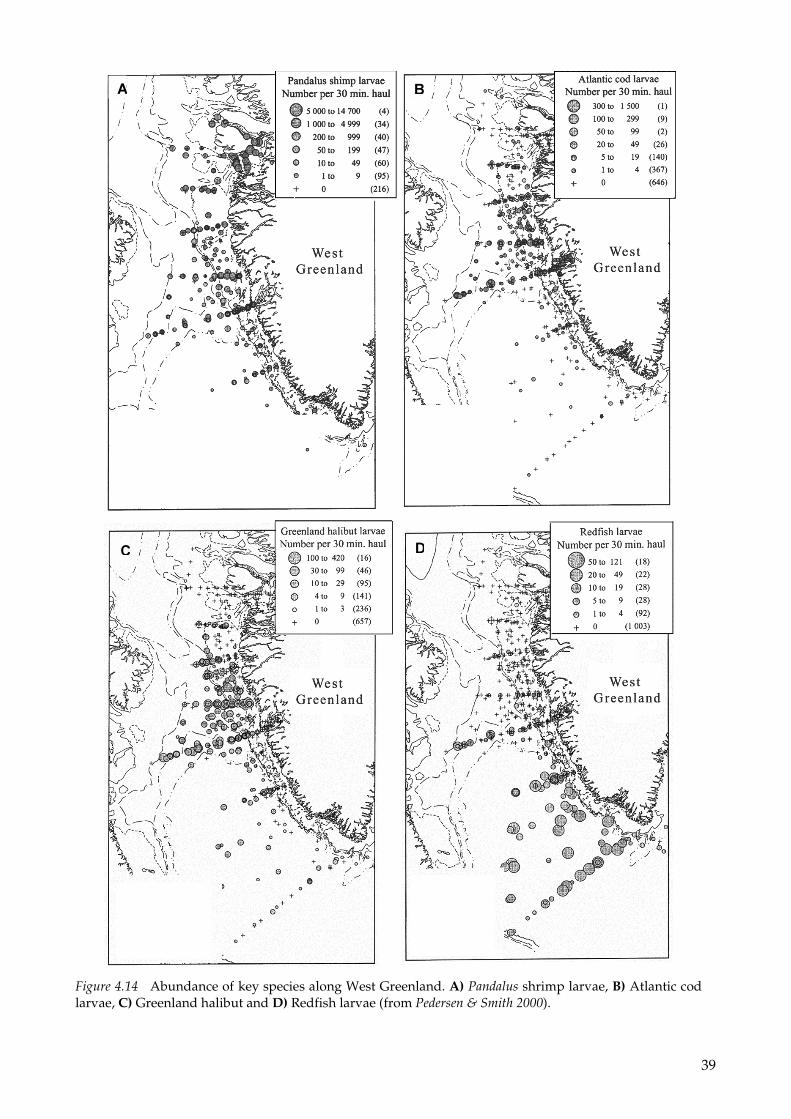
Pedersen & Smidt (2000) analyzed 34 years of zooplankton and shrimp and fish larvae samples taken along three transects during summer along the Greenland west coast. Figure 4.14 summarizes some of the key spp. from the paper. From the distribution maps the importance of the bank areas along the west coast is clearly illustrated since these areas host the highest abundances.
Recently, several surveys have investigated the horizontal distribu-tion of shrimp larvae (Pedersen et al. 2002, Storm & Pedersen 2003) and fish (Munk 2002, Simonsen et al. 2006) in relation to hydrography and their potential prey along West Greenland. An integrated part of these investigations were the establishment of a particle tracking model. To simulate larval drift, particles (larvae) were released in four areas along south-western Greenland assuming a pelagic life of 100 days duration (Ribergaard et al. 2004). The model illustrates how the fish larvae are concentrated above the fishing banks. The reten-tion times were significantly longer along the banks indicating that they act as retention areas. Despite pronounce difference in the year class strength, the simulations of shrimp larval drift for 1999 and 2000 were almost identical. The suggested model is a good first attempt to couple oceanographic models with dispersion of shrimp or fish larvae.
The model results are clearly corroborated by the results of the sam-pling programmes conducted along the coast. The cruises cover the main part of the productive season (May to July). They document that the important sites for the development of shrimp (Figure 4.15) and fish larvae are the slopes of the banks along the coast and the shelf break where the highest biomass of their copepod prey is also located (Simonsen et al. 2006). The banks are also very important feed-ing grounds for benthic feeding diving ducks (Mosbech & Johnson 1999, Mosbech et al. in press) and the banks and their slopes are impor-tant for pelagic feeding seabirds (Barret et al. in press) and marine mammals exploiting the enhanced biomass of invertebrates and fish.
39
Figure 4.14 Abundance of key species along West Greenland. A) Pandalus shrimp larvae, B) Atlantic cod larvae, C) Greenland halibut and D) Redfish larvae (from Pedersen & Smith 2000).
� �
� �

40
Figure 4.15 Distribution of Pandalus larvae biomass in relation to zooplankton and phytoplankton biomass June 2000. From Pedersen et al. 2002.

41
In June-July 1997 the fish larvae abundance was investigated in rela-tion to hydrography and plankton distribution along four transects perpendicular to the coast from Sukkertop Bank in the south to Disko Bank in the north (Munk et al. 2003). In general the highest larval abundance was found in connection with the high productive zones between different water masses (Figure 4.16).
To fully resolve the dynamics of the marine food web along the im-portant banks, intensive time series studies of coupled oceanographic and pelagic biology should be established. Special attention should be given to the early spring to improve our understanding of the food web dynamics along the banks.
4.4.3� Marginal ice zone (MIZ) in association with the west ice A major hydrographic discontinuity off West Greenland that has not received much attention is the marginal ice zone (MIZ). The term marginal ice zone (MIZ) is not a very well-defined term. Probably the most accepted definition is that of Wadhams (1986) who describes it as
A B
Figure 4.16 A) Abundance of fish larvae along the transects. The arrows indicate the position of the front at the shelf slope and B) Contouring of temperature (shading) and salinity (lines) along transect I-IV (from Munk et al. 2003).

42
“that part of the ice cover, which is close enough to the open ocean boundary to be affected by its presence”. The sea ice in Davis Strait near the west coast of Greenland, “the west ice”, clearly falls within the above definition.
Investigations of the distribution, production and the pelagic dynamics of the lower trophic levels along the “west ice” off the Greenland west coast are very limited. From other arctic areas, e.g. the Barents Sea, its is, however, well known that the marginal ice zones (MIZ) are areas of intense biological production, which are considered among the most dynamic areas in the world’s oceans (Falk-Petersen et al. 2000). This complex hydrodynamic at the ice edge plays an important role for production and distribution of pelagic organisms from bacteria to whales (Figure 4.17). A large number of birds winter along the MIZ in the West Greenland open water area also indicating that a high production must take place (Boertmann et al. 2004). Future investiga-tions have to consider the MIZ at the west ice, if the productivity of the important West Greenland ecosystem should be understood and managed in as sustainable manner.
Figure 4.17 Cartoon illustrating the pelagic dynamic at the MIZ. From Was-mann et al. 2003.

43
5� Model results
The model results analysed below are based on results from the model presented in section 2.5. The model sea surface salinity in Disko Bay was about 33 during winter 2004/2005. Freshwater run off from glacial ice melt into Disko Bay decreased the sea surface salinity in June (Figure 5.1A and B). The model sea surface salinity in the bay decreased down to 32 in early September. This agrees to some extent with the observed surface hydrography during the period April 1996 to June 1997, the period from where there are observations. The ob-served minimum salinity was about one lower than in the model, and the sea surface salinity started to increase again one month earlier than the observed time series at Arctic Station. Some differences be-tween the model and the observations are explained by the fact that 1996 was a year with severe ice conditions, while the winter 2004/ 2005 was a season with no ice. The model resolution was too coarse to produce any sharp frontal zones, but there were horizontal gradients in the model sea surface salinity (Figure 5.1) and sea surface tempera-ture (not shown) at the entrance of the bay from May to December.
The most frequent upwelling areas during the spring were located along the Greenland west coast both north and south of the Disko Bay entrances, and at the slopes of Store Hellefiske Bank (Figure 5.2A and B). In April, there was also some upwelling in Disko Bay and at the west coast of Disko Island (Figure 5.2A). The upwelling events in the area were mainly wind driven and occurred during northerly and north-westerly winds (Figure 5.3). It should be noted that large values
Figure 5.1 Model results showing two dimensional fields at a depth of 0 m. A) colours show the salinity and arrows the surface currents daily mean for 30 May 2005. B) is the same as A) but for 27 June 2005.

44
of vertical velocity at Store Hellefiske Bank shown in Figure 5.3 were not caused by wind driven upwelling. The large vertical velocity was instead generated by up- and downward motion due to strong tidal currents across a shallow sloping bottom.
Figure 5.2 A) The colours show monthly mean of upwelling at a depth of 20 m in April 2005 where positive is directed upward, and the arrows show wind velocity for the same period. B) is the same as A) but for May.
Figure 5.3 Daily mean values of model two dimensional fields at a depth of 20 m on 24 April 2005. The colour scale shows daily mean of upwelling velocity (m day-1), and the arrows show wind speed.

45
From March to May the salinity at 20 m depth increased with about 0.4, starting in the inner parts of the bay (Figure 5.4). The increase in salinity was caused by upward motion; similar evolution in stratifica-
Figure 5.4 Daily mean values of modelled salinity fields at a depth of 20 m on the dates A) 11 March 2005, B) 23 March 2005, C) 30 April 2005 and D) 12 June 2005. The colour scale shows the horizontal variation of salinity and the arrows show the surface currents.

46
tion was observed at Arctic Station in spring in 1997 and 2005. This shows that there is a general pattern of the hydrographic conditions that tend to increase the salinity in the bay by upwelling processes, starting in the inner parts of the bay. The horizontal distribution of the density difference between the surface and 20 m showed no frontal structure as observed in the CTD-transects in the Disko Bay region 1996, 1997 and 1998. This means that the model resolution is too coarse to resolve the regions with large vertical mixing and large pri-mary production.

47
6� Conclusions
The aim of this report is to support the identification of potential hot spots in time and space where an oil spill may have the worst conse-quences on the marine ecosystem. The present report provides an overview of the hydrography and plankton dynamics and shrimp and fish larvae distribution in Disko Bay, and the waters along south west Greenland.
In this context, knowledge about the interaction between hydrography and the pelagic food web is essential. Therefore attention is drawn to the identification of hydrodynamic discontinuities, i.e. sites where enhanced biological activity can be expected in the surface layers (Figure 6.1). These sites are particularly sensitive and areas where pronounced ecological effects of a potential oil spill can be expected.
Figure 6.1 Hydrographic discontinuities are often sites of enhanced biological activities. These can be defined in time, e.g. the shift from mixed water in the winter to stratified water in the spring or in space when two water masses meet or at the MIZ where the frontal zone will provide better growth condi-tions for plankton and the succeeding links in the food web (modified from Legendre & Demers 1984).

48
The triggering of the plankton blooms in 1997 and 2005 is a decrease in the mixed layer depth that is generated by upwelling of warm and saline water, while the surface salinity remains rather constant; thus not warming or freshening of the surface layer. In this respect, fresh-water outflow from glaciers or solar heating does not trigger the bloom. In fact, generation of a thin warm low saline layer concen-trates the plankton to a smaller depth interval, resulting in a faster depletion of nutrients in the surface layer. This process forces the plankton to descend to the layer below the mixed layer. The model also captures a similar pattern of the time variability. Severe ice con-ditions may delay or decrease the extent of the plankton bloom. When ice reflects most solar radiation, primary production in the surface layer starts in the open water areas. The year with severe ice (1996) had weaker bloom and started about one week later in spring than years with less or no ice (the years 1997 and 2005). The observa-tions in 1996 were, however, too sparse to be more specific about magnitude and timing of the bloom.
Freshwater outflow from glaciers in May-June generated a shallow surface layer, resulting in increased heating rate and sea ice melting rate. The warm low saline layer spread out in Disko Bay and in the end flowed out of Disko Bay along the south-southwest coast of Disko Island. In the shallow surface layer nutrients were depleted and the plankton descended to deeper nutrient-rich layer. During upwell-ing events, plankton blooms in the surface layer may temporally oc-cur. The primary producers are, however, not uniformly distributed in the cold layer below the surface layer. The hydrography transects in June showed that the high productive regions were concentrated to shallow regions and along steep bottom slopes. Upwelling or upward mixing of nutrient-rich water from below probably fed the plankton bloom in early summer. According to model results, upwelling oc-curred during northerly and north-easterly winds in regions along the Greenland west coast, at both entrances to Disko Bay, and on the steep slopes on the shallow banks south of Disko Bay.
As illustrated here, a characteristic feature of arctic marine ecosystems is that the productive cycle is very pulsed (Figure 4.11). Most of the higher trophic levels in the arctic ecosystem rely on the lipid that is accumulated in the Calanus. Consequently, a lot of the biological ac-tivity – e.g. spawning and growth of fish – is synchronised with the life cycle of Calanus. The investigation in Disko Bay clearly corrobo-rates the hypothesis that most of the biological activity in the surface layer is present in the spring and early summer in association with the spring bloom and the appearance of the Calanus populations (Fig-ures 4.11, 4.12 and 4.13). The peak abundance of shrimp and fish lar-vae is also observed in the early summer in association with the peak abundance of their plankton prey.
The review of the existing data and literature clearly illustrates that the surface distribution of phytoplankton and the key player in the arctic marine food web Calanus can be used as proxy for high biologi-cal activity of the higher trophic levels as well.
Special attention should therefore be given to implication of oil spills in connection with hydrodynamic discontinuities, i.e. the spring

49
bloom, fronts, upwelling areas and at the marginal ice zone where high surface concentrations of phytoplankton, zooplankton and shrimp and fish larvae can be expected.
In conclusion, the most sensitive season – i.e. where an oil spill can be expected to have the most severe ecological consequences – is April to June where high biological activity of the pelagic food web from phytoplankton to fish larvae are concentrated in the surface layers. On a horizontal scale the most important areas are the fronts in asso-ciation with the transition zone between different water masses. Later in the season, when the biological activity is more scattered or con-centrated at the pycnocline, ecological damage from an oil spill is assumed to be less severe.

50
[Blank page]

51
7� References
Arneborg, L. 2004: Turnover times for the water above sill level in Gullmar Fjord. - Continental Shelf Research 24: 443-460.
Barret, R.T., Chapdelaine, G., Anker-Nilssen, T., Mosbech, A., Monte-vecchi, W.A., Reid, J.B., & Veit, R.R. (in press): Seabird numbers and prey consumption in the North Atlantic. - ICES Journal of Ma-rine Science.
Bleck, R. 2002: An oceanic general circulation model framed in hybrid isopycnal-Cartesian coordinates. - Ocean Model 4: 55-88.
Boertmann, D., Lyngs, P., Merkel, F.R. & Mosbech, A. 2004: The sig-nificance of Southwest Greenland as winter quarters for seabirds. - Bird Conservation International 14(2): 87-112.
Boyer, T., Levitus, S., Garcia, H., Locarnini, R., Stephens, C. & An-tonov, J. 2005: Objective analyses of annual, seasonal, and monthly temperature and salinity for the World Ocean on a 0.25° grid. - In-ternational Journal of Climatology 25(7): 931-945.
Buch, E. 1990: A monograph on the physical environment of Green-land waters. - Greenland Fisheries Research Institute Report, 405 pp.
Buch, E, Pedersen, S.A. & Ribergaard, M.R. 2004: Ecosystem variability in West Greenland waters. - Journal of Northwest Atlantic Fishery Science 34: 13-28.
Comiso, J. 2001, updated 2003: Bootstrap sea ice concentrations for NIMBUS-7 SMMR and DMSP SSM/I, June to September 2001. - Boulder, CO, USA: National Snow and Ice Data Center. Digital media.
Conover, R.J. 1988: Comparative life histories in the genera Calanus and Neocalanus in high latitudes of the northern hemisphere. - Hy-drobiologia 167/168: 127-142.
Digby, P.S.B. 1953: Plankton production in Scoresby Sound, East Greenland - Journal of Animal Ecology 22: 289-322.
Falk-Petersen S, Hop, H., Budgell, W.P., Hegseth, E.N., Korsnes, R., Løyning, T.B., Ørbæk, J.B., Kawamura. T. & Shirasawa, K. 2000: Physical and ecological processes in the marginal ice zone of the northern Barents Sea during the summer melt period. - Journal of Marine Systems 27: 131-159.
Grasshoff, K. 1976: Methods for seawater analysis. - Verlag Chemie, Weinheim, New York, 317 pp.
52
Hirche, H.J., Baumann, M.E.M., Kattner, G. & Gradinger, R. 1991: Plankton distribution and the impact of copepod grazing on pri-mary production in Fram Strait, Greenland Sea. - Journal of Ma-rine Systems 2: 477-479.
Jespersen, P. 1934: Copepoda. The Godthaab Expedition 1928. - Med-delser om Grønland 79 (10): 1-166.
Jespersen, A.M. & Christoffersen, K. 1987: Measurements of chloro-phyll a from phytoplankton using ethanol as extraction solvent. - Archiv fur Hydrobiologie 109: 445-454.
Legendre, L. & Demers, S. 1984: Towards dynamic biological oceano-graphy and limnology. - Canadian Journal of Fisheries and Aqua-tic Sciences 41: 2-19.
Levinsen, H., Nielsen, T.G. & Hansen, B.W. 2000: Annual succession of marine protozoans in the arctic with emphasis on winter dy-namics. - Marine Ecology Progress Series 206: 119-134.
Levinsen, H. & Nielsen, T.G. 2002: The Trophic Role of Marine Pe-lagic Ciliates and Heterotrophic Dinoflagellates in Arctic and Temperate Coastal Ecosystems: A Cross-Latitude Comparison. - Limnology and Oceanography 47(2): 427-439.
Madsen, S.D., Nielsen, T.G. & Hansen, B.W. 2001: Annual population development and production by Calanus finmarchicus, C. glacialis and C. hyperboreus in Disko Bay, western Greenland. - Marine Bio-logy 139 (1): 75-93.
Mosbech, A. & Johnson, S.R. 1999: Late winter distribution and abundance of sea-associated birds in south-western Greenland, the Davis Strait and southern Baffin Bay. - Polar Research 18(1): 1-17.
Mosbech A., Danø R., Merkel F., Sonne C., Gilchrist G. & Flagstad F. (in press): Use of satellite telemetry to locate key habitats for King Eiders (Somateria spectabilis) in Western Greenland. - Proceedings from the conference Waterbirds around the World.
Munk, P. 2002: Larval sand lance (Ammodytes sp.) in the diet of small juvenile wolffish (Anarhichas sp.): predatory interactions in frontal waters off western Greenland. - Canadian Journal of Fisheries and Aquatic Sciences 59: 1759-1767.
Munk, P., Hansen, B.W., Nielsen, T.G. & Thomsen, H.A. 2003: Changes in plankton and fish larvae communities across hydro-graphic fronts off West Greenland. - Journal of Plankton Research 25(7): 815-830.
Møller, E.F. & Nielsen, T.G. 2000: Plankton community structure and carbon cycling off the western coast of Greenland, with emphasis on sources of DOM for the bacterial community. - Aquatic Micro-bial Ecology 22: 13-25

53
Møller, E.F., Nielsen, T.G. & Richardson, K. 2006: The zooplankton community in the Greenland Sea: Composition and role in carbon turnover. - Deep-Sea Research 53: 76-93.
Nielsen, T.G. 2005: Struktur og funktion af fødenettet i havets frie vandmasser. Doktordisputats. Afdeling for Marin Økologi. Dan-marks Miljøundersøgelser. 71 s.
Nielsen, T.G. & Hansen, B. 1995: Plankton Community Structure and Carbon Cycling on the Western Coast of Greenland During and After the Sedimentation of a Diatom Bloom. - Marine Ecology Progress Series 125: 239-257.
Pedersen, S.A. & Smidt, E.L.B. 2000: Zooplankton distribution and abundance in West Greenland waters, 1950-1984. - Journal of Northwest Atlantic Fishery Science 26: 45-102.
Pedersen, S.A., Simonsen, C.S. & Storm, L. 2002: Northern shrimp (Pandalus borealis) recruitment in West Greenland waters. Part I. Distribution of Pandalus shrimp larvae in relation to hydrography and plankton. - Journal of Northwest Atlantic Fishery Science 30: 19-46.
Pedersen, T.J., Nielsen, T.G., Michel, C., Møller, E.F., Tiselius, P., Thor, P., Olesen, M., Selander, E. & Gooding, S. 2006: Sedimenta-tion following the spring bloom in Disko Bay, West Greenland, with special emphasis on the role of copepods. - Marine Ecology Progress Series 314: 239-255.
Ribergaard, M.H., Pedersen, S.A., Ådlandsvik, B. & Kliem, N. 2004: Modelling the ocean circulation on the West Greenland shelf with special emphasis on northern shrimp recruitment. - Continental Shelf Research 24: 1505-1519.
Ribergaard, M.H., Kliem, N. & Jespersen, M. 2006: HYCOM for the North Atlantic Ocean with special emphasis on West Greenland Waters. - DMI technical report 06-07.
Rudels, B., Friedrich, H.J. & Quadfasel, D. 1999: The Arctic circumpolar boundary current. - Deep Sea Research II 46: 1023-1062.
Simonsen, C.S., Munk, P., Folkvord, A. & Pedersen, S.A. 2006: Feed-ing ecology of Greenland halibut and sandeel larvae off West Greenland. - Marine Biology online 25 February 2006.
Sloth P. 1983: Hydrografi i Disko Bugt 1980-1982. - Inst. of Physical Oceanography, University of Copenhagen, Internal report. In Da-nish.
Smidt, E.L.B. 1979: Annual cycles of primary production and of zoo-plankton at Southwest Greenland. - Greenland Bio-Science 1: 52 pp.
Storm, L. & Pedersen, S.A. 2003: Development and drift of northern shrimp larvae (Pandalus borealis) at West Greenland. - Marine Bio-logy 143: 1083-1093.
54
Strickland, J.D.H. & Parson, T.R. 1972: A practical handbook of sea-water analysis. - Bulletin of the Fisheries Research Board of Canada 167: 1-310.
Ussing, H.H. 1938: The biology of some important plankton animals in the fjord of East Greenland. - Meddelser om Grønland 100 (7): 1-108.
Wadhams, P. 1986: The ice cover. - In: Hurdle, B. G. (Ed.); The Nordic Seas. Springer Verlag, New York, pp. 21-86.
Wasmann, P., Bauerfeind, E., Fortier, M., Fukuchi, M., Hargrave, B., Moran, B., Noji, T., Nöthig, E.-M., Olli, K., Oeinert, R., Sasaki, H. & Shevchenko, V.P. 2003: Particulate organic cabon flux to the Arctic Sea floor. - In: Stein, R. & Macdonald, R.W. (Eds.); The organic car-bon cycle in the Arctic Ocean. Springer-Verlag Berlin Heidelberg, 323 pp.
Yang X., Petersen, C., Amstrup, B., Andersen, B.S., Feddersen, H., Kmit, M., Korsholm, U., Lindberg, K., Mogensen, K., Hansen Sass, B., Sattler, K. & Nielsen, N.W.: The DMI-HIRLAM upgrade in June 2004. - Technical Report 05-09. Danish Meteorological Institute, Copenhagen, Denmark.

National Environmental Research Institute
The National Environmental Research Institute, NERI, is a research institute of the Ministry of the Environment. In Danish, NERI is called Danmarks Miljøundersøgelser (DMU). NERI’s tasks are primarily to conduct research, collect data, and give advice on problems related to the environment and nature.
Addresses: URL: http://www.dmu.dk
National Environmental Research Institute ManagementFrederiksborgvej 399 Personnel and Economy SecretariatPO Box 358 Monitoring, Advice and Research SecretariatDK-4000 Roskilde Department of Policy AnalysisDenmark Department of Atmospheric Environ mentTel: +45 46 30 12 00 Department of Marine EcologyFax: +45 46 30 11 14 Department of Environmental Chemistry and Microbiology Department of Arctic Environment
National Environmental Research Institute Monitoring, Advice and Research SecretariatVejlsøvej 25 Department of Marine EcologyPO Box 314 Department of Terrestrial EcologyDK-8600 Silkeborg Department of Freshwater EcologyDenmarkTel: +45 89 20 14 00Fax: +45 89 20 14 14
National Environmental Research Institute Department of Wildlife Ecology and BiodiversityGrenåvej 14, KaløDK-8410 RøndeDenmarkTel: +45 89 20 17 00Fax: +45 89 20 15 15
Publications:NERI publishes professional reports, technical instructions, and an annual report in Danish. A R&D projects’ catalogue is available in an electronic version on the World Wide Web.Included in the annual report is a list of the publications from the current year.

Faglige rapporter fra DMU/NERI Technical Reports
2005Nr. 541: Regulatory odour model development: Survey of modelling tools and datasets with focus on building
effects. By Olesen, H.R. et al. 60 pp. (electronic)Nr. 542: Jordrentetab ved arealekstensivering i landbruget. Principper og resultater.
Af Schou, J.S. & Abildtrup, J. 64 s. (elektronisk)Nr. 543: Valuation of groundwater protection versus water treatment in Denmark by Choice Experiments and
Contingent Valuation. By Hasler, B. et al. 173 pp. (electronic)Nr. 544: Air Quality Monitoring Programme. Annual Summary for 2004, Part 1 Measurements.
By Kemp, K. et al. 64 pp. (electronic)Nr. 545: Naturbeskyttelse og turisme i Nord- og Østgrønland. Af Aastrup, P. et al. 131 pp. (electronic)Nr. 546: Environmental monitoring at the Nalunaq Mine, South Greenland, 2004.
By Glahder, C.M. & Asmund, G. 32 pp. (electronic)Nr. 547: Contaminants in the Atmosphere. AMAP-Nuuk, Westgreenland 2002-2004.
By Skov, H. et al. 43 pp (electronic)Nr. 548: Vurdering af naturtilstand. Af Fredshavn, J & Skov, F. 93 s. (elektronisk)Nr. 549: Kriterier for gunstig bevaringsstatus for EF-habitatdirektivets 8 marine naturtyper.
Af Dahl, K. et al. 39 s. (elektronisk)Nr. 550: Natur og Miljø 2005. Påvirkninger og tilstand. Af Bach, H. (red.) et al. 205 s., 200,00 kr. Nr. 551: Marine områder 2004 – Tilstand og udvikling i miljø- og naturkvaliteten. NOVANA.
Af Ærtebjerg, G. et al. 94 s. (elektronisk)Nr. 552: Landovervågningsoplande 2004. NOVANA. Af Grant, R. et al. 140 s. (elektronisk)Nr. 553: Søer 2004. NOVANA. Af Lauridsen, T.L. et al. 62 s. (elektronisk)Nr. 554: Vandløb 2004. NOVANA. Af Bøgestrand, J. (red.) 81 s. (elektronisk)Nr. 555: Atmosfærisk deposition 2004. NOVANA. Af Ellermann, T. et al. 74 s. (elektronisk)Nr. 557: Terrestriske naturtyper 2004. NOVANA. Af Strandberg, B. et al. 58 s. (elektronisk)Nr. 558: Vandmiljø og Natur 2004. Tilstand og udvikling – faglig sammenfatning.
Af Andersen, J.M. et al. 132 s. (elektronisk)Nr. 559: Control of Pesticides 2004. Chemical Substances and Chemical Preparations.
By Krongaard, T., Petersen, K.K. & Christoffersen, C. 32 pp. (electronic)Nr. 560: Vidensyntese indenfor afsætning af atmosfærisk ammoniak. Fokus for modeller for lokal-skala.
Af Hertel, O. et al. 32 s. (elektronisk)Nr. 561: Aquatic Environment 2004. State and trends – technical summary.
By Andersen, J.M. et al. 62 pp., DKK 100,00.Nr. 562: Nalunaq environmental baseline study 1998-2001. By Glahder, C.M. et al. 89 pp. (electronic)Nr. 563: Scientifi c and technical background for intercalibration of Danish coastal waters.
By Petersen, J.K.& Hansen, O.S. (eds.) et al. 72 pp. (electronic)
2006Nr. 564: Styringsmidler i naturpolitikken. Miljøøkonomisk analyse.
Af Schou, J.S., Hasler, B. & Hansen, L.G. 36 s. (elektronisk)Nr. 565: Dioxin in the Atmosphere of Denmark. A Field Study of Selected Locations. The Danish Dioxin
Monitoring Programme II. By Vikelsøe, J. et al. 81 pp. (electronic)Nr. 567: Environmental monitoring at the Nalunaq Gold Mine, south Greenland, 2005.
By Glahder, C.M. & Asmund, G. 35 pp. (electronic)Nr. 569: Anskydning af vildt. Konklusioner på undersøgelser 1997-2005. Af Noer, H. 35 s. (elektronisk)Nr. 572: Søerne i De Vestlige Vejler. Af Søndergaard, M. et al. 55 s. (elektronisk)Nr. 573: Monitoring and Assessment in the Wadden Sea. Proceedings from the 11. Scientifi c Wadden Sea
Symposium, Esbjerg, Denmark, 4.-8. April 2005. By Laursen, K. (ed.) 141 pp. (electronic)Nr. 574: Økologisk Risikovurdering af Genmodifi cerede Planter i 2005. Rapport over behandlede forsøgs-
udsætninger og markedsføringssager. Af Kjellsson, G., Damgaard, C. & Strandberg, M. 22 s. (elektronisk)Nr. 575: Miljøkonsekvenser ved afbrænding af husdyrgødning med sigte på energiudnyttelse. Scenarieanalyse for
et udvalgt opland. Af Schou, J.S. et al. 42 s. (elektronisk)Nr. 576: Overvågning af Vandmiljøplan II – Vådområder 2005. Af Hoffmann, C.C. et al. 127 s. (elektronisk)Nr. 577: Limfjordens miljøtilstand 1985 til 2003. Empiriske modeller for sammenhæng til næringsstoftilførsler,
klima og hydrografi . Af Markager, S., Storm, L.M. & Stedmon, C.A. 219 s. (elektronisk)Nr. 578: Limfjorden i 100 år. Klima, hydrografi , næringsstoftilførsel, bundfauna og fi sk i Limfjorden fra 1897 til
2003. Af Christiansen, T. et al. 85 s. (elektronisk)Nr. 579: Aquatic and Terrestrial Environment 2004. State and trends – technical summary.
By Andersen, J.M. et al. 136 pp. (electronic)

(Blank page)

581 Physical and
biological oceanography in West G
reenland w
aters w
ith emphasis on shrim
p and fish larvae d
istribution
National Environmental Research Institute 978-87-7772-931-7Ministry of the Environment ISSN 1600-0048
The report provides an overview of the hydrography and plankton dynamics and shrimp and fish larvae distribution in Disko Bay, and the waters along south west Greenland. Observations of hydrography and the plankton community in Disko Bay and on the banks along the Greenland south west coast show that marine life is mainly concentrated in transition zones between water masses, on the steep bottom slopes of the banks, and at the shallow parts of the entrance to Disko Bay. High production of the plankton community is also expected in the marginal ice zone west of the Greenland west coast, but due to insufficient amount of observations it cannot be confirmed in this study. The plankton bloom in Disko Bay is triggered by upwelling of saline and warmer water at the end of April. Onset of the plankton bloom, magnitude, and the distribution of the plankton community are highly affected by the large inter-annual variations of the ice extent in spring. Onset of the plankton bloom at the banks south of Disko Bay is also expected to take place in April. The zooplankton community, including fish and shrimp larvae, increases in abundance and are abundant in the surface layer during early summer. Later in the season the plank-ton community is more scattered, and mostly beneath the surface layer. The aim of the report is – based on an analysis of physical and biological oceano-graphy with emphasis on shrimp and fish larvae distribution – to support the identification of potential hot spots in time and space where an oil spill will have the largest consequences on the marine ecosystem. The most sensitive season – i.e. when an oil spill can be expected to have the most severe ecological conse-quences – is April to June when high biological activity of the pelagic food web from phytoplankton to fish larvae are con-centrated in the surface layers. On a horizontal scale the most important area is the fronts in association with the tran-sition zone between different water masses.