photosynthetic hco- utilization and oh-excretion in ... · angiosperms results in the production...
TRANSCRIPT
Plant Physiol. (1980) 66, 818-8220032-0889/80/66/08 18/05/$00.50/0
Photosynthetic HCO"- Utilization and OH- Excretion in AquaticAngiospermsLIGHT-INDUCED pH CHANGES AT THE LEAF SURFACE'
Received for publication October 30, 1979 and in revised form April 28, 1980
HIDDE B. A. PRINS, JAN F. H. SNEL, RIENDER J. HELDER, AND PIETER E. ZANSTRADepartment of Plant Physiology, University of Groningen, P. 0. Box 14, 9750 AA Haren (Gn.),The Netherlands
ABSTRACT
The utiiLzation ofHC03- as carbon source for photosynthesis by aquaticangiosperms results in the production of 1 mole OH- for each mole CO2assimilated. The OH- ions are subsequently released to the medium. Inseveral Potamogeton and Elodea species, the site of the HC03- influx andOH- efflux are spatially separated. Described here are light- and dark-induced pH changes at the lower and upper epidermis of the leaves ofPotamogeton lucens, Elodea densa, and Elodea canadensis.
In the light, two phases could be discerned. During the first phase, thepH increased at both sides of the leaves. This pH increase apparentlyresulted from CO2 fixation. During the second, so-called polar phase, thepH at the upper side increased further, but the pH at the lower sidedropped below the pH of the ambient solution. The pH drop at the lowerepidermis indicates that the K+ influx exceeds the net CO2 (HCO3- +C02) influx slightly. This may result either from a proton pump drving anextra K+ influx or from CO2 diffusion from the cells into the outer mediumpreviously taken up as HCO3-. In the dark, a CO2 gush was observed atboth sides. During the polar phase, the upper side becomes electricallynegative with respect to the lower side. Subsequent depolarization in thedark revealed that this potential difference consisted of a fast and a slowcomponent.
A number of aquatic plants can use HCO3- as well as CO22 asC source for photosynthetic C assimilation. Photosynthetic reduc-tion of HCO3 by these aquatics produces one OH- for each CO2molecule assimilated. The OH- ions are subsequently released bythe cells into the medium. This process plus the normal CO2fixation may raise the pH of the surrounding solution consider-ably, especially near the leaf surface. Several species of Potamo-geton and Elodea have a spatial separation between the site ofHCO3 influx and OH- efflux. These so-called polar plants takeup HCO3 at the morphologically lower side of the leaf andrelease OH- at the upper side (1, 2, 8, 27). A similar phenomenonhas been observed in Characeae in which the two ion fluxes arespatially separated as small bands along the cell (1 1-18, 26, 28).
Polar HCO3- uptake and subsequent OH- release in Potamo-
' This research was supported by the Foundation of Biophysics, part ofthe Netherlands Organization for the Advancement of Pure Research (Z.W. 0.).
2Abbreviations: CO2, CO2 in its molecular form, including both CO2and the hydrated form H2CO3; MCO2, sum of CO2, H2CO3, HCO3-, andC032-; PD, potential difference.
geton and Elodea are accompanied by cation transport from thelower to the upper side of the leaf and by the formation of anelectrical PD across the leaf, making the upper side negative withrespect to the lower side (5, 6, 7). Comparable PD were alsoobserved in Chara corallina cells. In these latter cells, electriccurrents are generated between the alkaline and acid regions andmay result in electrical PD of 7 mv between the centers of thebands (4, 18, 28). The highest value we observed so far with aPotamogeton lucens leaf was 40 mv, upper side negative.We analyzed the time course of the light induced pH changes
at both sides and the trans-leaf PD of leaves of Potamogeton andElodea with miniature pH and reference electrodes positionedagainst the leaf surface.
For comparison, we studied the pH changes at the leaf surfaceof Vallisneria spiralis, a HCO3 -fixing aquatic species with noseparation of the HCO3 and OH- transport sites, and of Ludwigianatans, a waterplant that used CO2 only as a C source for photo-synthesis.
MATERIALS AND METHODS
P. lucens and Elodea canadensis were grown in concrete tanksoutside the building, whereas Elodea densa, V. spiralis and L.natans were grown inside under artificial light as described earlier(21). All plants were cultivated in H20 at pH 7.8 to 9.5.The pH near the surface on both sides of the leaves was
measured simultaneously with two miniature pH electrodes (Mi-croelectrodes Ml 440) with the sensing bulb touching gently onthe leaf surface. Two reference electrodes (Microelectrodes Ml401) filled with 3 M KCI were also positioned with their tips verynear the leaf surface on both sides. These reference electrodeswere also used to measure the electrical PD across the leaf (Fig.1). The pH-sensitive part of the glass electrode is a hemisphere ofradius 0.75 mm and the wall is not of uniform thickness. The endwhich touches the leaf surface is much thinner and, thus, is themost sensitive part. To enlarge the contact between the sensingbulb and the leaf surface, we folded the leaf slightly around thebulbs (Fig. 1B) in a number of experiments. This did not signifi-cantly change the pH values measured at both sides. The experi-mental solution was in open connection with both sides of the leaf.There was no physical separation between upper and lower side.Thus diffusion from one side to the other was possible. However,the diffusion pathway is very long compared with the distancebetween the electrodes and the leaf surface. Using a different set-up, comparable to that used by Helder in earlier experiments (5-8), in which the solutions in contact with both sides were separated,we measured identical pH changes at the leaf surface as with theopen system described here.The pH near the leaf surface depends on the balance between
818 www.plantphysiol.orgon January 6, 2020 - Published by Downloaded from Copyright © 1980 American Society of Plant Biologists. All rights reserved.

HCO3- UTILIZATION BY AQUATIC ANGIOSPERMS
FIG. l. Experimental set up. A: high impedance amplifier; A' opera-
tional amplifier. 1, 2, and 3: pH at the upper leaf surface, pH at the lowersurface, and electrical PD across the leaf, respectively; these are allconnected to a multichannel recorder. The electrodes are drawn to scale.B: in a number of experiments, the leaf was slightly folded to increase thesurface area in contact with the sensitive area of the pH electrodes.
FIG. 2. Light- and dark-induced pH changes near the surface of P.lucens, V. spiralis, and L. natans leaves. pH changes observed with Vallis-neria and Ludwigia leaves were the same at both sides.
the diffusion of the substances involved and the rate of the pHaffecting process in the leaf. During the experiments the pH of thebulk solution did not change. Therefore, a constant ApH betweenthe leaf surface and the solution indicates a constant rate of thelatter process. In experiments, whole leaves of Elodea and leafstrips about 4 mm wide of the other species were used. In most ofthe experiments, a 1 mM KHCO3 solution was used. Normally thissolution was in contact with the surrounding air. Gaseous CO2diffusion, however, between the air and experimental solutionmust have been insignificant. The CO2 pressure of a 1 mm KHCO3solution (pH 8.3) equals that of normal air. The experiments withdifferent ambient pH values were done in a closed vessel. Controlexperiments at pH 8.3 in closed and open vessels showed identicalpH changes. All experiments were done at ambient room temper-ature (20-23 C).
RESULTS AND DISCUSSION
Effects of Light and Darkness. Figure 2 shows the effect of lighton the surface pH of a C02-absorbing leaf of L. natans [1 mmKHCO3 experimental solution (pH 8.3)]. The pH near the leafsurface increased in the light to a steady value of 9 due to CO2uptake. At this pH, the CO2 concentration can be calculated to be2.2 ,UM, assuming that the K+ concentration remains 1 mm near
the leaf surface. This corresponds to 66 ,il/l CO2 in a gas phase,which is in equilibrium with this solution, and is very near theCO2 compensation point as observed with C3 plants (30). The pHgradually decreased to 8.1 after turning off the light. Time coursesin light and darkness were similar. Presumably, the slightly lowerpH in the dark was caused by respiratory CO2.The effect of light on the leaf surface pH was more complicated
with the polar leaves of Potamogeton and Elodea. The pH changesat both sides in the light showed two distinct phases (Fig. 2). Thefirst phase lasted from 5 to 10 min, depending on the light intensityused. During this phase, the pH increased upon illumination to asemiconstant level of pH 8.7 and 8.9 for the lower and upper side,respectively, showing about the same rate for both sides. After thisa-polar phase, the pH at the upper side increased further, whereasthe pH at the lower side decreased to a value well below that ofthe experimental solution (pH 7.6) as in Figure 2.
Final pH values varied from leaf to leaf, depending on itsphysiological condition. At the upper side, the pH ranged between10.0 and 10.8 and at the lower side, between 6.5 and 8 [bathingsolution, 1 mm KHCO3 (pH 8.3)]. The light-induced pH changeswe observed in Potamogeton looked quite like the light-inducedpH changes seen in the alkaline and acid regions along the cellwall of C. corallina cells (12-15).The secondary rise of the pH at the upper side must result from
OH- release at this side following HCO3 assimilation at the lowerside which is accompanied by a pH drop here. In most of theexperiments, the second phase started simultaneously at both sidesof the leaf. Occasionally, we observed that one of the phasesstarted a few minutes later than the other (Fig. 3). This observationindicates that both processes are not directly and intimately cou-pled. During the second phase, the polarity of the leaves alsobecomes apparent in the electrical PD across the leaf which isgenerated during this phase (Fig. 4). Shown, too, is a smallelectrical PD across the leaf with reversed polarity during the firstphase, rendering the upper side slightly positive with respect tothe lower side. This small initial reversed PD was not alwayspresent but seems to be a normal pattern since it was quite oftenobserved. In C. corallina, the utilization of HCO3 and the sub-sequent release of OH- is accompanied by electric currents be-tween the acid and alkaline bands (4, 18, 28). In C. corallina, too,the cell surface PD is generated during the second phase and isabsent during the initial phase. From this cell surface PD, it hasbeen concluded that OH- transport in C. corallina is electrogenic(15). From cell membrane potential measurements in E. densaand simultaneous pH measurements, the same was concluded forthis plant (22). Preliminary experiments with K+ electrodesshowed that K+ transport through the leaf occurred only duringthe second phase.
pH11 light on light on
101
9
8-
7'W- 30 mii-4
FIG. 3. Examples of experiments in which the pH drop at the lowerside of a polar leaf preceded the secondary increase of pH at the upperside (A) and the reverse (B). A was a rare exception but B was quite oftenobserved with a time lag up to 5 min in some experiments.
Plant Physiol. Vol. 66, 1980 819
a
www.plantphysiol.orgon January 6, 2020 - Published by Downloaded from Copyright © 1980 American Society of Plant Biologists. All rights reserved.

Plant Physiol. Vol. 66, 1980
FIG. 4. Comparison of the light-induced pH changes which occurredat the upper and lower side of a P. lucens leaf with the light-inducedelectrical PD across it (upper side - lower side).
When the light was turned off the pH at both sides decreased.At the lower side, the pH reached a minimum after 5 to 10 mi,then it returned gradually to a value slightly below that of thesurrounding solution. At the upper side, the pH dropped at arather constant speed for a few minutes, often followed by a slightacceleration before a slowing down to a minimum. (This acceler-ation is just visible in Figure 2 P. lucens, but not in Fig. 4.) Acomparable bending was observed in the OH- transport deacti-vation curve in C. corallina (15). The minimum was reached afterabout 15 min. Thereafter, the pH increased slowly and finallystabilized after 50 min to a value somewhat higher than that atthe lower side. Eventually, the pH at both sides reached the samevalue. The final pH value in the dark was somewhat below thevalue of the bathing solution, apparently due to respiration.The electrical trans-leaf PD showed a rapid depolarization of a
few mv in the dark, followed by a shoulder or a small transientrepolarization (Fig. 4) and then a further depolarization at aboutthe same proportion as the decline of the pH gradients at theupper and lower side. Identical pH induction curves and trans-leaf PDs as in P. lucens were observed also in E. densa and E.canadensis.
Effect of Light Intensity. The typical shoulder or transientrepolarization of the trans-leafPD was not always observed in thedark. Notably, it was absent after a low light intensity. Also, thepH induction curves depended very much on the light intensityused (Fig. 5). At the lowest light intensity (2 w m2), only a slightincrease of the pH at both sides was observed; the secondarydecrease of the pH at the lower side and the continued increase atthe upper side were absent. The existence of a small electrical PDacross the leaf indicated that the leaf was still polar under theseconditions. At the higher light intensities, the characteristic pHinduction pattern was recognizable again. The lag period beforethe onset of the second phase decreased with increasing lightintensity in such a way that, at the highest light intensity (50 wm2), the shoulder of the first phase, normally observed at theupper side, was often hardly visible. This occurred especially withE. canadensis lea-ves. In C. corallina, too, the lag period before theonset of the major pH rise depends on the light intensity. In thisalga, there is a strong correlation between the HCO3 and OH-fluxes and membrane potential hyperpolarization. Both transportsystems may be voltage dependent. The role of the membranepotential may be especially important for the activation of OH-transport (16, 18). We also consider this for Elodea and Potamo-geton. The light-induced membrane hyperpolarization in theseplants is nearly completed before the onset of the major pHincrease (22). The time course of this hyperpolarization dependson the light intensity (23). Membrane potentials in Elodea and
H, lowerside 2
7L - 50 ttE across leaf, mV
-0 2
51- 30 min.
FIG. 5. Effect of light intensity on the light-induced pH changes andelectrical PD across a leaf of P. lucens. Incident light intensities are givenas w m 2. True light intensities at the leafwere less as the leafwas mountedmore or less parallel to the direction of the light beam.
Potamogeton were -200 to -250 mv in the light. Assuming acytoplasmic pH of 7 and 10.5 at the upper leaf surface, the Nernstequation predicts an equilibrium potential for OH- ofabout -200mv. Thus, OH- excretion may be a downhill process. On the otherhand, the HCO3 influx obviously requires energy under mostcircumstances, considering the highly negative membrane poten-tial. A minimum estimate of the CO2 pressure inside a photosyn-thesizing cell is the CO2 compensation point, which is about 60,ul/l or 2 ELM. Again, assuming the cytoplasmic pH to be 7, we cancalculate the minimum HCO3 concentration to be 8.3 uM, butactually the concentration is much higher as the cells perform netpliotosynthesis. Given a membrane potential of -200 mv, theNernst equation predicts a [HCO3JI in the medium of 23 mm forthermodynamic equilibrium. Actual HCO3 concentrations of theexperimental solutions were much lower and still induced rapidphotosynthesis. The same conclusion was reached for Chara (29).pH Changes at Vailisneria Leaves. With leaf strips of V. spiralis,
in which the sites of HCO3 influx and OH- efflux are notspatially separated, essentially the same two-phasic pH changewas observed at both sides of the leaf as with the upperside of aPotamogeton and Elodea leaf, except that the final pH reached inthe light with Vallisneria was somewhat lower, viz. 9.4 (Fig. 2). Inrecent experiments, somewhat higher values were obtained. Sim-ilar pH changes were observed with other nonpolar leaves asCeratophyllum sp. (results not shown here). These results showthat the typical two-phasic pH induction curve is not a singularityof polar leaves but is somehow linked to the assimilation ofHCO3- and release of OH-.Role of CO2 and HCO3. Comparison of the light-induced pH
changes near the leaf surface of L. natans with those at the upperand lower sides of Potamogeton and Elodea leaves suggests thatthe initial pH rise observed with the latter two species also resultsfrom CO2 fixation. In accordance with this view, the highest initialpH rise we observed with Potamogeton and Elodea leaves was upto 9 in a solution containing 1 mm KHCO3. The CO2 pressure atthis pH is in equilibrium with 66 ,ul/l CO2 in air. C3 plants havingCO2 compensation points of this magnitude will never bring thepH of the surrounding solution much higher than 9 by mere CO2fixation without concomitant HCO3 uptake and accompanyingOH- release. The following experiment confirmed this conclusion.Using a bathing solution of pH 9.8, XCO2 = I mm, the initial pHrise was absent (Fig. 6). The CO2 concentration was 0.3 jAM, whichcorresponds to 9 Au/l in a gas phase and is well below the CO2compensation point of C3 plants. On the other hand, at low pH(6.3), the reversed situation occurred: the initial pH rise was very
I
820 PRINS ET AL.
www.plantphysiol.orgon January 6, 2020 - Published by Downloaded from Copyright © 1980 American Society of Plant Biologists. All rights reserved.
HC03- UTILIZATION BY AQUATIC ANGIOSPERMS
pH7
pH
6 t
14 30min.
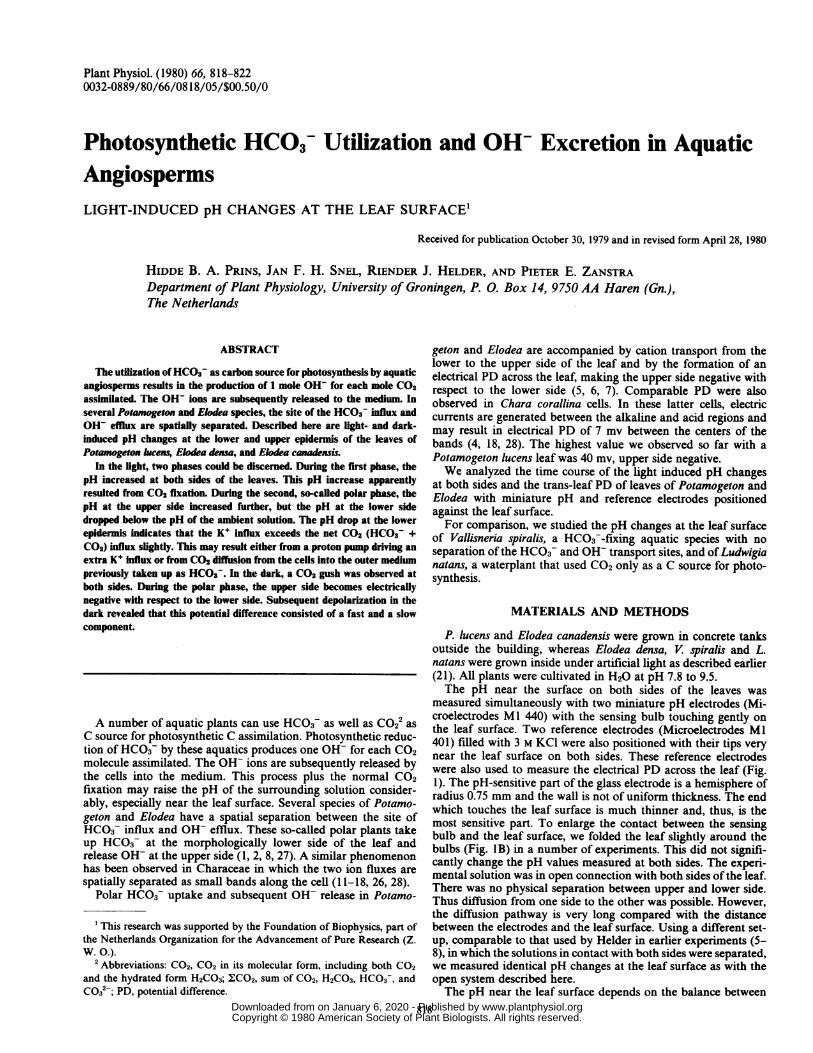
FIG. 6. Effect of ambient pH on the light-induced pH changes at theleaf surfaces of P. lucens. Above pH 8.3, the experimental solution con-
tained 1 mm KHCO3 + mm (KCI + KOH); the pH was set by the ratioKC1/KOH. Below pH 8.3, the solution contained 1 mm KHCO3 + I mM(KCI + HCQ); the pH was adjusted by changing the ratio KCl/HCl.
clear, but the secondary further increase at the upper side wasmuch reduced and the acidification at the lower side was absent.At a still lower pH (pH 5, not shown here), the increase at theupper side was reduced further and became practically equal tothat at the lower side.
Also, in C. corallina, the main pH rise in the alkaline bandsresulting from OH- release is preceded by a small initial pHincrease which may be caused by activation of an active OWtransport system (15). However, this seems unlikely because ofourresults with different ambient pH values and because the initialpH rise occurred also at the lower side. An initial pH increase inthe light has also been observed in the acid regions along the cellwall of C. corallina cells (14).The further pH rise at the upper side during the second phase
obviously results from OH- excretion. The secondary pH decreaseat the lower side is more difficult to interpret. A comparableacidification has been observed in the acid regions of C. corallinacells and near the ramps of the OW efflux site where it has beencalled the lateral OH- sink (14, 15). The pH of a K+- and HCO3-containing solution depends on the ratio MCO2/K+; an increase ofthis ratio is accompanied by a decrease of the pH. When pHvalues are not too high (pH < 9) and the K+ concentration is nottoo low, the ratio becomes insensitive to small changes of the K+concentration and can be calculated directly from the pH3 (8). AtpH 8.35, the ratio is 1. In Figure 7, this ratio is shown for thelower side of a Potamogeton leaf calculated from the data inFigure 2. ECO2/K' at the lower epidermis decreased from 1.02 inthe dark to 0.98 in the light during the initial phase due to CO2
3 As an example, the value of the ratio XCO2/K' = R is given here forpH 8.7 and 7 (the highest and lowest pH value shown in Fig. 7) for 1, 0.4,and 0.1 mm K+. Preliminary experiments with K+ electrodes showed that,with 1 mm KHCO3 ambient solution, the lowest K+ concentration observedat the leaf surface in the light was 0.4 mM. At pH 8.7, R = 0.981 for I mMK+, R = 0.976 for 0.4 mm, and R = 0.951 for 0.1 mM; at pH 7, R = 1.240for 1 mM K+, R = 1.240 for 0.4 mm K+, and R = 1.241 for 0.1 mm KV.
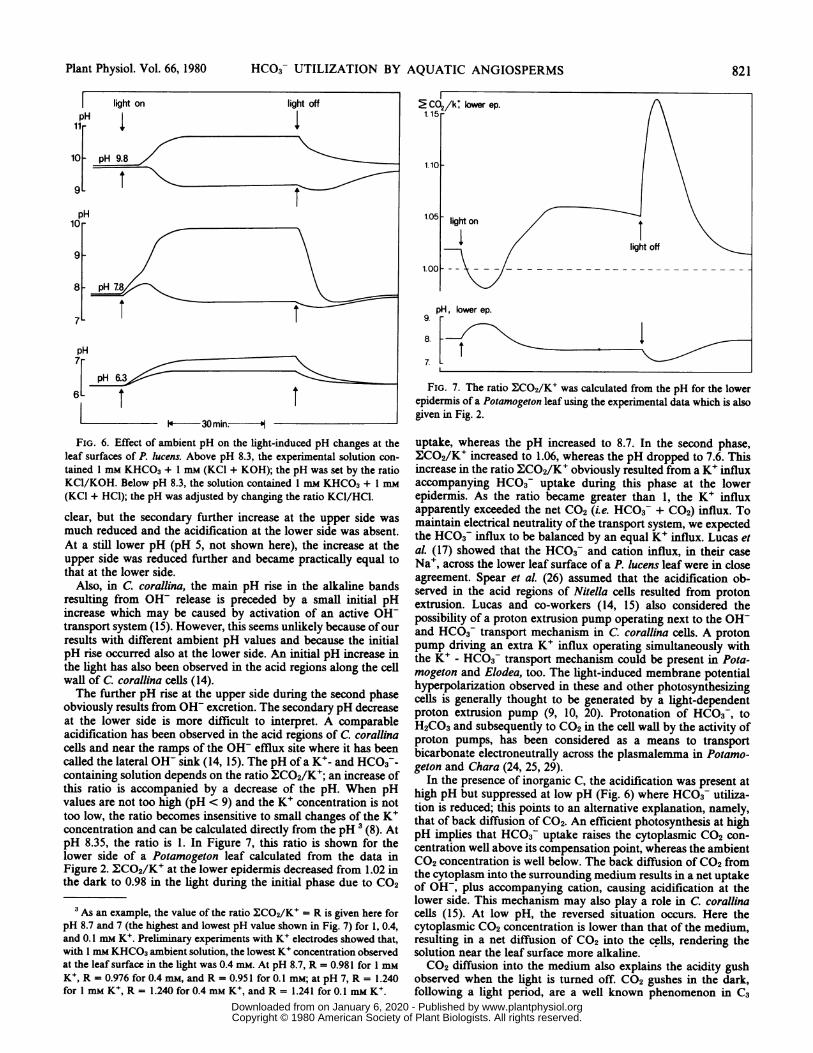
FIG. 7. The ratio E:CO2/K' was calculated from the pH for the lowerepidermis of a Potamogeton leaf using the experimental data which is alsogiven in Fig. 2.
uptake, whereas the pH increased to 8.7. In the second phase,ECO2/K' increased to 1.06, whereas the pH dropped to 7.6. Thisincrease in the ratio MCO2/K' obviously resulted from a K+ influxaccompanying HCO3- uptake during this phase at the lowerepidermis. As the ratio became greater than 1, the K+ influxapparently exceeded the net CO2 (i.e. HCO3 + CO2) influx. Tomaintain electrical neutrality of the transport system, we expectedthe HCO3 influx to be balanced by an equal K+ influx. Lucas etal. (17) showed that the HCO3- and cation influx, in their caseNa+, across the lower leaf surface of a P. lucens leaf were in closeagreement. Spear et al. (26) assumed that the acidification ob-served in the acid regions of Nitella cells resulted from protonextrusion. Lucas and co-workers (14, 15) also considered thepossibility of a proton extrusion pump operating next to the OH-and HCO3F transport mechanism in C. corallina cells. A protonpump driving an extra K+ influx operating simultaneously withthe K+ - HCO3 transport mechanism could be present in Pota-mogeton and Elodea, too. The light-induced membrane potentialhyperpolarization observed in these and other photosynthesizingcells is generally thought to be generated by a light-dependentproton extrusion pump (9, 10, 20). Protonation of HCO3 , toH2CO3 and subsequently to CO2 in the cell wall by the activity ofproton pumps, has been considered as a means to transportbicarbonate electroneutrally across the plasmalemma in Potamo-geton and Chara (24, 25, 29).
In the presence of inorganic C, the acidification was present athigh pH but suppressed at low pH (Fig. 6) where HCO3 utiliza-tion is reduced; this points to an alternative explanation, namely,that of back diffusion of CO2. An efficient photosynthesis at highpH implies that HCO3- uptake raises the cytoplasmic CO2 con-centration well above its compensation point, whereas the ambientCO2 concentration is well below. The back diffusion of CO2 fromthe cytoplasm into the surrounding medium results in a net uptakeof OH-, plus accompanying cation, causing acidification at thelower side. This mechanism may also play a role in C. corallinacells (15). At low pH, the reversed situation occurs. Here thecytoplasmic CO2 concentration is lower than that of the medium,resulting in a net diffusion of CO2 into the cells, rendering thesolution near the leaf surface more alkaline.CO2 diffusion into the medium also explains the acidity gush
observed when the light is turned off. CO2 gushes in the dark,following a light period, are a well known phenomenon in C3
Plant Physiol. Vol. 66, 1980 821
www.plantphysiol.orgon January 6, 2020 - Published by Downloaded from Copyright © 1980 American Society of Plant Biologists. All rights reserved.

Plant Physiol. Vol. 66, 1980
terrestrial plants, although they last only a few minutes there (3,30). An increased CO2 production during 40 min darkness follow-ing a light period was observed in Vallisneria leaves (21). X.CO2/K+ near the lower surface of a Potamogeton leaf showed a verymarked transient increase in the dark (Fig. 7). An increased K+influx under these conditions seems unlikely, therefore, indicatinga CO2 gush during the first 10 to 20 min in the dark.
CONCLUSIONS
In the leaves of Potamogeton and Elodea C02 and HC03- canbe used simultaneously for photosynthetic C assimilation. Theratio between the two processes depends on the pH near the lowerside of the leaf. The pH at this side is not solely determined bythat of the medium but depends on the relative ratesof CO2 andHCO3 influxes, CO2 efflux and other ion fluxes, notably of thecations. There are two possible mechanisms to explain the ob-served acidification at the lower epidermis: a light-driven protonextrusion pump or back diffusion of CO2 previously taken up asHCO3 by the cells. The present experiments do not allow adefinite conclusion as yet.
Considering the very negative membrane potential in the light,OH- transport at the upper epidermis may be a downhill process.On the other hand, HCO3 utilization obviously requires energyconsidering this same highly negative electrical potential. Theobservation that cells of the lower epidermis are transfer cellslends support to the view that the active step is HCO3 utilizationrather than OH- excretion (19). The role of K+ or any otheraccompanying cation remains to be elucidated.
Experiments, where pH measurements are combined with K+determinations, are in progress in order to test this model further.These will allow us to make more precise calculations of therelative rates of the CO2 and HCO3 fluxes. The light induced pHchanges reported here for some higher aquatic species are verysimilar to those observed in C. corallina. Preliminary experimentswith a number of other aquatic species showed that similar pHchanges can be observed in most of them. Future models will haveto take into account that the underlying mechanisms for theobserved pH changes apparently are the same in algae and higherspecies, polar as well as nonpolar.
Acknowledgments-We wish to thank Janet O'Brien for her correcting of themanuscript and Prof. P. J. C. Kuiper for his critical reading of the text.
LITERATURE CITED
1. ARENs K 1933 Physiologisch Polarisierter Massenaustausch und Photosynthesebei submersen Wasserpflanzen. Planta 20: 621-658
2. ARENS K 1938 Manganablagerungen bei Wasserpflanzen als folge des physiolo-gisch polarisierten Massenaustausch. Protoplasma 30: 104-129
3. DECKER JP 1955 A rapid, postillumination deceleration of respiration in greenleaves. Plant Physiol 30: 82-84
4. FERRIER JM, WJ LUCAS 1979 Plasmalemma transport ofOH- in Chara corallina.Further analysis of the diffusion system associated with OH- efflux. J Exp Bot30: 705-7 18
5. HELDER RJ 1975 Polar potassium transport and electrical potential differenceacross the leaf of Potamogeton lucens L. Proc Kon Ned Akad Wet C78: 189-197
6. HELDER RJ 1975 Flux ratios and concentration ratios in relation to electricalpotential differences and transport of rubidium ions across the leaf of Pota-mogeton lucens L. Proc Kon Ned Akad Wet C78: 376-388
7. HELDER RJ, J BOERMA 1973 Exchange and polar transport of rubidium ionsacross the leaves of Potamogeton. Acta Bot N&erl 22: 686-693
8. HELDER RJ, PE ZANSTRA 1977 Changes of the pH at the upper and lower surfaceof bicarbonate assimilating leaves of Potamogeton lucens L. Proc Kon NedAkad Wet C80: 421-436
9. JESCHIE WD 1970 Lichtabhangige Veranderungen des Membranpotentials beiBlattzellen von Elodea densa. Z Pflanzenphysiol 62: 158-172
10. JESCHKE WD 1972 Ueber denlichtgeforderten Influx von Lonen in Blattem vonElodea densa. Vergleich des Influx von K+ and Cl- ionen. Planta 103: 164-180
11. LUCAS WJ 1975 Photosynthetic fixation of "Carbon by internodal cells of Characorallina. J Exp Bot 26: 331-346
12. LUCAS WJ 1975 The influence of light intensity on the activation and operationof the hydroxyl efflux system of Chara corallina. J Exp Bot 26: 347-360
13. LUCAS WJ 1976 Plasmalemma transport of HCO3- and OH- in Chara corallina:non-antiporter systems. J Exp Bot 27: 19-31
14. LUCAS WJ, FA SMITH 1973 The formation of alkaline and acid regions at thesurface of Chara corallina cells. JExp Bot 24: 1-14
15. LUCAS WJ, JM FERRIER, J DAINTY 1977 Plasmalemma transport of OH inChara corallina. J Membr Biol 32: 49-73
16. LUCAS WJ, RM SPANSWICK, J DAINTY 1978 HC03 influx across the plasma-lemma of Chara corallina. Physiological and biophysical influence of 10 msK+. Plant Physiol 61: 487-493
17. LUCAS WJ, MT TYREE, A PETROV 1978 Characterization of photosynthetic'4Carbon assimilation by Potamogeton lucens L. J Exp Bot 29: 1409-1421
18. LUCAS WJ 1980 Control and synchronization of HCO3- and OH- transportduring photosynthetic assimilation of exogenous HCO3-. In RM Spanswick,WJ Lucas, J Dainty, eds, Membrane Transport in Plants: Current ConceptualIssues. Elsevier/North Holland, Amsterdam, pp 317-327
19. PATE JS, BES GUNNING 1972 Transfer cells. Annu Rev Plant Physiol 23: 173-196
20. POOLE RJ 1978 Energy coupling for membrane transport. Annu Rev PlantPhysiol 29: 437-461
21. PRINS HBA 1974 Photosynthesis and ion uptake in leaves of Vallisneria spiralisL. PhD thesis, University of Groningen, Haren, The Netherlands
22. PRINs HBA, RJ HELDER, PJC KUIPER 1978 Bicarbonate fixation and polar iontransport in leaves of Potamogeton and Elodea. Proc FESPP Meet, pp 20-21
23. PRINS HBA, RJ HARPER, N HIGINBOTHAM 1980 Membrane potentials of Vallis-neria leaf cells and their relation to photosynthesis. Plant Physiol 65: 1-5
24. PRINS HBA, RJ HELDER 1980 Photosynthetic use of HC03- by Elodea andPotamogeton, pH changes induced by HCO3-, C02, K+, and H+/OH trans-port. In RM Spanswick, WJ Lucas, J Dainty, eds, Membrane Transport inPlants; Current Conceptual Issues. Elsevier/North Holland, Amsterdam, pp625-626
25. PRINS HBA, JFH SNEL, RJ HELDER, PE ZANSTRA 1979 Photosynthetic bicarbon-ate utilization in the aquatic angiosperms Potamogeton and Elodea. HydrobiolBull 13: 106-111
26. SPEAR DG, JK BARR, CE BARR 1969 Localization of hydrogen ion and chlorideion fluxes in Nitella. J Gen Physiol 54: 397-414
27. STEEMANN NIELSEN E 1960 Uptake ofCO2 by the plant. In Encyclopedia of PlantPhysiology, Vol 5, Part 1. Springer, Berlin, pp 78-84
28. WALKER NA, FA SMITH 1977 Circulating electric currents between acid andalkaline zones associated with HCO3- assimilation in Chara. J Exp Bot 28:1190-1206
29. WALKER NA 1980 The transport systems of charophyte and chlorophyte giantalgae and their integration into modes of behavior. In RM Spanswick, WJLucas, J Dainty, eds, Membrane Transport in Plants: Current ConceptualIssues. Elsevier/North Holland, Amsterdam, pp 287-300
30. ZELITCH I 1971 Photosynthesis, Photorespiration and Plant Productivity. Aca-demic Press, New York, pp 145-160
822 PRINS ET AL.
www.plantphysiol.orgon January 6, 2020 - Published by Downloaded from Copyright © 1980 American Society of Plant Biologists. All rights reserved.