photocatalytic water splitting by yenting kuo b.a., national
TRANSCRIPT
PHOTOCATALYTIC WATER SPLITTING
by
YENTING KUO
B.A., National Central University, Taiwan, 2000 M.S., National Central University, Taiwan, 2002
AN ABSTRACT OF A DISSERTATION
submitted in partial fulfillment of the requirements for the degree
DOCTOR OF PHILOSOPHY
Department of Chemistry College of Arts and Science
KANSAS STATE UNIVERSITY Manhattan, Kansas
2011

Abstract
New photocatalystic materials Ti-In oxy(nitride) and nanosized Ru-loaded strontium
titanate doped with Rh (Ru/SrTiO3:Rh) have been synthesized. The textural and surface
characteristic properties were studied by nitrogen BET analysis, diffuse reflectance UV-vis
spectroscopy, X-ray photoelectron spectroscopy, transmission electron microscopy, scanning
electron microscopy and powder XRD. The photocatalytic properties were enhanced by the
binary metal oxides of titanium dioxide and indium oxide. The XRD patterns confirmed the
oxygen exchange between two metal oxides during the synthesis. Moreover, the presence of
titanium dioxide can help the stabilization of InN during hot NH3(g) treatment. On the other hand,
the particle sizes of aerogel prepared Ru/SrTiO3:Rh varied from 12 to 25 nm depended on
different Rh doping. A mixture of ethanol and toluene was found to be the best binary solvent for
supercritical drying, which yielded a SrTiO3 sample with a surface area of 130 m2
Enhanced photocatalytic hydrogen production under UV-vis light irradiation was
achieved by ammonolysis of intimately mixed titanium dioxide and indium oxide at high
temperatures. Gas chromatography monitored steadily the formation of hydrogen when
sacrificial (methanol or ethanol) were present. XRD patterns confirmed that the photocatalysts
maintain crystalline integrity before and after water splitting experiments. Moreover, the
presence of InN may be crucial for the increase of hydrogen production activities.
/g and an
average crystallite size of 6 nm.
These Ru/SrTiO3:Rh photocatalysts have been studied for photocatalytic hydrogen
production under visible light. The band gap of the bulk SrTiO3 (3.2 eV) does not allow response
to visible light. However, after doping with rhodium and loaded with ruthenium, the modified
strontium titanates can utilize light above 400 nm due to the formation of valence band or

electron donor levels inside of the band gap. Moreover, the surface areas of these photocatalysts
are much larger than conventional solid-state synthesized samples (1-2 m2
/g), which yielded
more Ru loading and reaction sites. The areogel and hydrothermal synthesized samples required
basic (alkaline) conditions for hydrogen generation facilitation compared with acidic conditions
for conventional solid-state samples.
PHOTOCATALYTIC WATER SPLITTING
by
YENTING KUO
B.A., National Central University, Taiwan, 2000 M.S., National Central University, Taiwan, 2002
A DISSERTATION
submitted in partial fulfillment of the requirements for the degree
DOCTOR OF PHILOSOPHY
Department of Chemistry College of Arts and Science
KANSAS STATE UNIVERSITY Manhattan, Kansas
2011
Approved by:
Major Professor Kenneth J. Klabunde

Copyright
YENTING KUO
2011
Abstract
New photocatalystic materials Ti-In oxy(nitride) and nanosized Ru-loaded strontium
titanate doped with Rh (Ru/SrTiO3:Rh) have been synthesized. The textural and surface
characteristic properties were studied by nitrogen BET analysis, diffuse reflectance UV-vis
spectroscopy, X-ray photoelectron spectroscopy, transmission electron microscopy, scanning
electron microscopy and powder XRD. The photocatalytic properties were enhanced by the
binary metal oxides of titanium dioxide and indium oxide. The XRD patterns confirmed the
oxygen exchange between two metal oxides during the synthesis. Moreover, the presence of
titanium dioxide can help the stabilization of InN during hot NH3(g) treatment. On the other hand,
the particle sizes of aerogel prepared Ru/SrTiO3:Rh varied from 12 to 25 nm depended on
different Rh doping. A mixture of ethanol and toluene was found to be the best binary solvent for
supercritical drying, which yielded a SrTiO3 sample with a surface area of 130 m2
Enhanced photocatalytic hydrogen production under UV-vis light irradiation was
achieved by ammonolysis of intimately mixed titanium dioxide and indium oxide at high
temperatures. Gas chromatography monitored steadily the formation of hydrogen when
sacrificial (methanol or ethanol) were present. XRD patterns confirmed that the photocatalysts
maintain crystalline integrity before and after water splitting experiments. Moreover, the
presence of InN may be crucial for the increase of hydrogen production activities.
/g and an
average crystallite size of 6 nm.
These Ru/SrTiO3:Rh photocatalysts have been studied for photocatalytic hydrogen
production under visible light. The band gap of the bulk SrTiO3 (3.2 eV) does not allow response
to visible light. However, after doping with rhodium and loaded with ruthenium, the modified
strontium titanates can utilize light above 400 nm due to the formation of valence band or

electron donor levels inside of the band gap. Moreover, the surface areas of these photocatalysts
are much larger than conventional solid-state synthesized samples (1-2 m2
/g), which yielded
more Ru loading and reaction sites. The areogel and hydrothermal synthesized samples required
basic (alkaline) conditions for hydrogen generation facilitation compared with acidic conditions
for conventional solid-state samples.
viii
Table of Contents
List of Figures ............................................................................................................................... xii
List of Tables ............................................................................................................................. xviii
List of Equations .......................................................................................................................... xix
Acknowledgements ...................................................................................................................... xxi
Dedication ................................................................................................................................... xxii
Preface ........................................................................................................................................ xxiii
Chapter 1 - Introduction .................................................................................................................. 1
References ................................................................................................................................... 5
Chapter 2 - Basis of photocatalytic water splitting ......................................................................... 6
References ................................................................................................................................. 11
Chapter 3 - Titanium-Indium Oxynitrides for Water Splitting. Photocatalysis vs. Light Induced
Catalyst Oxidation by Water ................................................................................................. 13
3.1 Introduction ......................................................................................................................... 13
3.2 Experimental ....................................................................................................................... 14
3.2.1 Preparation of Ti-In nitride composites ....................................................................... 14
3.2.2 Hydrogen Production ................................................................................................... 15
3.2.3 Characterization of Composites ................................................................................... 16
3.3 Results and Discussion ....................................................................................................... 16
3.3.1 Crystal Structure .......................................................................................................... 16
3.3.2 Elemental composition of the TiInOxYz composites .................................................. 23

ix
3.3.3 UV-Vis Diffuse Reflectance spectra ............................................................................ 25
3.3.4 X-ray Photoelectron Spectracopy ................................................................................ 27
3.3.5 Scanning Electron Microscopy .................................................................................... 32
Brunauer, Emmett, Teller (BET) surface area ...................................................................... 33
3.4 Conclusions ......................................................................................................................... 36
References ................................................................................................................................. 38
Chapter 4 - Hydrogen from ethanol solution under UV-visible light. Photocatalysts produced by
Nitriding Titanium nitride and Indium oxide Intimate mixtures to Form Ti-In nitride
composites ............................................................................................................................. 41
4.1 Introduction ......................................................................................................................... 41
4.2 Experimental Section .......................................................................................................... 42
4.2.1 Preparation of TiN/InN composites ............................................................................. 42
4.2.2Characterization of Catalysts ........................................................................................ 43
4.2.3 Photocatalytic Reactions .............................................................................................. 43
4.3 Results and Discussion ....................................................................................................... 44
4.3.1 Dependence of Photocatalytic Activity on Ammonolysis time ................................... 44
4.3.2 Crystal Structure .......................................................................................................... 48
4.3.3 UV-Visible Diffuse Reflectance Spectra ..................................................................... 52
4.3.4 SEM Observations ....................................................................................................... 54
4.3.5 X-ray Photoelectron Spectra ........................................................................................ 55
4.4 Conclusions ......................................................................................................................... 58
References ................................................................................................................................. 60
Chapter 5 - Synthesis and characterization of strontium titanate ................................................. 63
x
5.1 Literature review on strontium titanate ............................................................................... 63
5.2 Nanomaterials ..................................................................................................................... 66
5.3 Synthesis of titanates .......................................................................................................... 67
5.3.1 Introduction .................................................................................................................. 67
5.3.2 Solid-state synthesis ..................................................................................................... 68
5.3.3 Gas phase synthesis ...................................................................................................... 69
5.3.4 Aerosol technique ........................................................................................................ 72
5.3.5 Sol-gel technique ......................................................................................................... 74
5.3.6 Aerogel technique ........................................................................................................ 76
5.4 Temperature treatment ........................................................................................................ 77
5.4.1 Heat treatment .............................................................................................................. 79
5.5 Modification of titanates by doping .................................................................................... 82
References ................................................................................................................................. 87
Chapter 6 - Water Splitting under Visible Light using Aerogel Prepared Strontium Titanate
(SrTiO3 ) Nanomaterials Doped with Ruthenium and Rhodium Metals ............................... 91
6.1 Introduction ......................................................................................................................... 92
6.2 Materials and methods ........................................................................................................ 93
6.3 Results and discussion ........................................................................................................ 96
6.3.1 Strontium titanate calcination at different temperatures .............................................. 96
6.3.2 H2 generation of strontium titanate at different pHs .................................................... 99
6.3.3 Dependence of H2 evolution activity of aerogel Ru/SrTiO3
:Rh on different calcination
temperatures ........................................................................................................................ 100
xi
6.3.4 Dependence of H2 evolution activity of aerogel Ru/SrTiO3
:Rh on different Rh doping
amounts ............................................................................................................................... 103
6.3.5 Dependence of H2 evolution activity of aerogel Ru/SrTiO3
:Rh upon the different co-
catalyst Ru amounts ............................................................................................................ 105
6.3.6 Mechanism ................................................................................................................. 108
6.4 Conclusions ....................................................................................................................... 111
References ............................................................................................................................... 113

xii
List of Figures
Figure 1.1 Conversion of solar energy to hydrogen energy by using powdered photocatalysts. ... 2
Figure 1.2 Comparison between photosynthesis of green plants and photocatalytic water splitting
reaction.5 ................................................................................................................................. 4
Figure 1.3 Water splitting by electrochemical photolysis using TiO2 as photoelectrode.9 ............ 4
Figure 2.1 Main processes in photocatalytic water splitting. .......................................................... 7
Figure 2.2 Principle of water splitting using semiconductor photocatalysts. ................................. 8
Figure 2.3 Relationship between band structure of semiconductor and redox potentials of water
splitting.13 ................................................................................................................................ 9
Figure 2.4 Mechanism of overall water splitting using the Z-scheme photocatalysis system
driven by electron transfer photocatalysts. ............................................................................. 9
3.1 Experimental setup for nitridation of TiO2/In2O3 mixture. .................................................... 14
3.2 Experimental setup for hydrogen production measurement. .................................................. 15
3.3 Powder XRD patterns obtained by nitriding a mixture of TiO2 and In2O3 at different
ammonolysis temperatures (c) 700 oC (d) 750 oC (e) 800 oC (f) 850 oC for 20 hours under a
250 mL/ min flow rate of NH3. (a) TiO2 anatase (b) In2O3 (g) TiN. ................................... 19
3.4 Dependence of UV-vis hydrogen production activity of nitrided mixture of TiO2 and In2O3
at different ammonolysis temperatures (a) 700 oC (b) 750 oC (c) 800 oC (d) 850 oC for 20
hours under a 250 mL/ min flow rate of NH3. Catalyst (0.3g), an aqueous slurry mixed with
0.13 g sulfuric acid (pH : ~2.6); light source, high-pressure mercury lamp (450 W); inner
irradiation-type reaction vessel; reaction temperature was controlled between 20 to 25 oC. 20

xiii
3.5 Long term dependence of visible light hydrogen production activity of nitrided mixture of
TiO2 and In2O3 ( 750 oC ammonolysis temperatures for 18 hours under a 250 mL/ min flow
rate of NH3). Catalyst (0.3g), an aqueous solution mixed with 0.13 g sulfuric acid (pH :
~2.6); light source, high-pressure mercury lamp (450 W) with 2M NaNO2 solution as light
filter. Inner irradiation-type reaction vessel. Reaction temperature was controlled between
20 to 25 oC. ........................................................................................................................... 21
3.6 Dependence of UV-vis light hydrogen production activity of a nitrided mixture of TiO2 and
In2O3 at 700 oC ammonolysis temperatures for 20 hours under a 250 mL/ min flow rate of
NH3. Catalyst (0.3g), an 20 % ethanol aqueous solution; light source, high-pressure
mercury lamp (450 W). Inner irradiation-type reaction vessel. Reaction temperature was
controlled between 20 to 25 oC. ............................................................................................ 22
3.7 Long term dependence of visible light hydrogen production activity of nitrided mixture of
TiO2 and In2O3 (700 oC ammonolysis temperatures for 20 hours under a 250 mL/ min flow
rate of NH3). Catalyst (0.4 g), an 10 % methanol aqueous solution; light source, high-
pressure mercury lamp (450 W) with 2M NaNO2 solution as light filter. Inner irradiation-
type reaction vessel. Reaction temperature was controlled between 20 to 25 oC. ................ 23
3.8 Powder XRD patterns of (a) before (b) after hydrogen production from water under UV-vis
light obtained by nitriding a mixture of TiO2 and In2O3 at 850 oC for 20 hours under a 250
mL/min flow rate of NH3 . ..................................................................................................... 25
3.9 UV-Vis diffuse reflectance spectra of samples obtained by nitriding a mixture of TiO2 and
In2O3 at different ammonolysis temperatures (a) 700 oC (b) 750 oC (c) 800 oC (d) 850 oC
for 20 hours under a 250 mL/ min flow rate of NH3. (e) Titanium dioxide (f) Indium oxide.
............................................................................................................................................... 27
xiv
3.10 XPS spectra of samples obtained by nitriding a mixture of TiO2 and In2O3 at different
ammonolysis temperatures (a) 850 oC (b) 800 oC (c) 750 oC (d) 700 oC for 20 hours under a
250 mL/ min flow rate of NH3 . ............................................................................................. 30
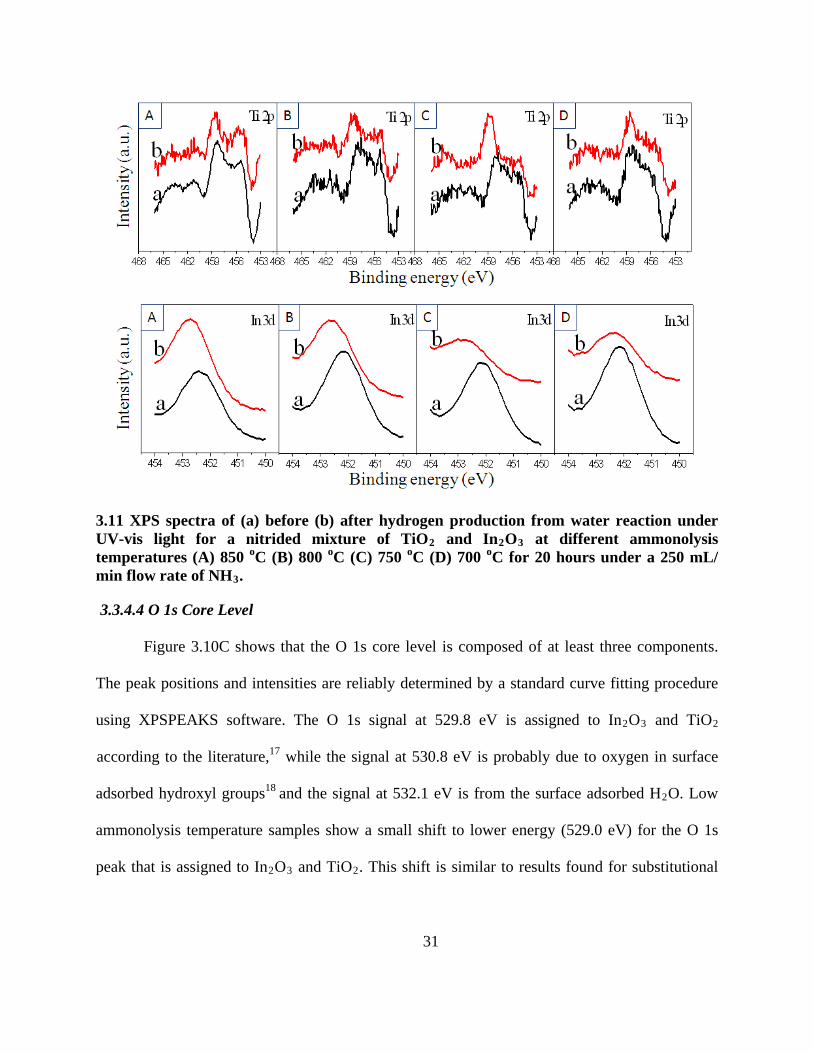
3.11 XPS spectra of (a) before (b) after hydrogen production from water reaction under UV-vis
light for a nitrided mixture of TiO2 and In2O3 at different ammonolysis temperatures (A)
850 oC (B) 800 oC (C) 750 oC (D) 700 oC for 20 hours under a 250 mL/ min flow rate of
NH3 . ...................................................................................................................................... 31
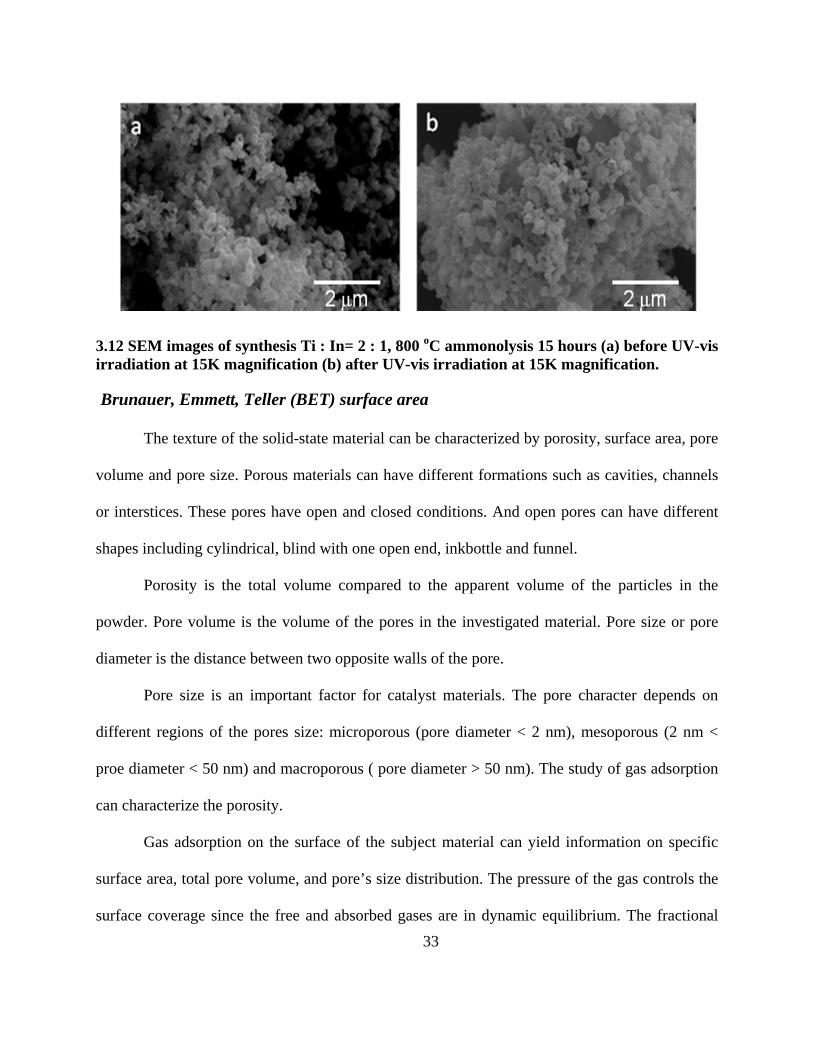
3.12 SEM images of synthesis Ti : In= 2 : 1, 800 oC ammonolysis 15 hours (a) before UV-vis
irradiation at 15K magnification (b) after UV-vis irradiation at 15K magnification. ........... 33
3.13 Five types of adsorption isotherms.22 .................................................................................... 35
4.1 Dependence of photocatalytic activity of mixture of TiN (13 h)/In2O3 at different
ammonolysis time for (a) 1 (b) 3 (c) 5 h at 750 oC under a 250 mL/ min flow rate of NH3.
Catalyst (0.3g), a 20 % ethanol aqueous solution, high-pressure mercury lamp (450 W);
inner irradiation-type reaction vessel. ................................................................................... 45
4.2 Dependence of photocatalytic activity of mixture of TiN (13 h)/In2O3 futher ammonolysis
for 3 h at 750 oC under a 250 mL/ min flow rate of NH3. Catalyst (0.3g), a 20 % ethanol
aqueous solution, high-pressure mercury lamp (450 W); inner irradiation-type reaction
vessel. .................................................................................................................................... 46
4.3 Dependence of photocatalytic activity of TiO2 nitridation 18 h under a 250 mL/ min flow
rate of NH3. Catalyst (0.3g), a 20 % ethanol aqueous solution, high-pressure mercury lamp
(450 W); inner irradiation-type reaction vessel. ................................................................... 47
xv
4.4 Dependence of photocatalytic activity of nitridation TiN (18 h)/In2O3 3 h at 750 oC under a
250 mL/ min flow rate of NH3. Catalyst (0.3g), a 20 % ethanol aqueous solution, high-
pressure mercury lamp (450 W); inner irradiation-type reaction vessel. .............................. 47
4.5 Powder XRD patterns of (a) TiN (13 h)/In2O3 mixture and different nitridation time of TiN
(13 h)/In2O3 for (b) 1 (c) 3 (d) 5 h at 750 oC under a 250 mL/min flow rate of NH3 . ......... 49
4.6 Schematic representation showing the particle size, different crystal sizes of compounds and
the ratio of compounds for the composite. Distribution number and crystal sizes are based
on the XRD data (figure 4.5). ............................................................................................... 50
4.7 Powder XRD patterns of (a) TiN (18 h)-In nitride ammonolysis 3 h (b) TiN (13 h)-In nitride
ammonolysis 3 h (c) TiN (13 h)/In2O3 mixture (d) TiN (18 h)/In2O3 mixture. ................... 51
4.8 Powder XRD patterns of TiN (13 h)/In2O3 mixture nitridation 1 h at 750 oC under a 250
mL/min flow rate of NH3 (a) before (b) after water splitting reaction. ................................ 52
4.9 Diffuse reflectance spectra of (a) In2O3 (b) TiN (13 h) (c) TiN (13 h)/In2O3 mixture and
different nitridation time of TiN (13 h)-In nitride for (d) 1 (e) 3 (f) 5 h at 750 oC under a 250
mL/min flow rate of NH3. (g) TiN (18 h)/In2O3 mixture (h) TiN (18 h)-In nitride for 3 h. 53
4.10 SEM images of (a) TiN (13 h)/In2O3 mixture and different nitridation time of TiN (13 h)-In
nitride for (b) 1 (c) 3 (d) 5 h at 750 oC under a 250 mL/min flow rate of NH3. (e) TiN (18
h)/In2O3 mixture (f) TiN (18 h)-In nitride ammonolysis 3 h. .............................................. 55
4.11 XPS spectra of (a) TiN (13 h)/In2O3 mixture and different nitridation time of TiN (13
h)/In2O3 for (b) 1 (c) 3 (d) 5 h at 750 oC under a 250 mL/min flow rate of NH3 . ............... 58
5.1 Perovskite (ABO3) UnitCell ................................................................................................... 63
5.2 Perovskite structure (BO6 and A2+ layers) .............................................................................. 65
5.3 Sintering by diffusion (path 1 - surface diffusion, path 2 - volume diffusion) ....................... 78
xvi
5.4 Temperature-pressure Diagram for Supercritical Drying, where C – Critical Point, SCF –
Super Critical Fluid, Tc – Critical Temperature, Pc – Critical Pressure.26, 37 ....................... 81
5.5 UV-Visible Absorption Spectra of a) Pure TiO2 and b) –d) Cr Ion-implanted TiO2 with Cr of
2.2, 6.6, and 13 x10-7 mol/g.38 ............................................................................................. 84
5.6 Diffuse reflectance spectra of SrTiO3:M(0.5%). M = (a) Mn, (b) Ru, (c) Rh, (d) Pd, (e) Ir,
and (f) Pt. A broken line represents a spectrum of nondoped SrTiO3.3 ................................ 85
6.1 Modified aerogel procedure from alkoxides for Ru/SrTiO3:Rh synthesis. ............................ 96
6.2 Powder XRD patterns of SrTiO3:Rh calcined in air at different temperatures. (a) as
synthesized (b) 300 oC (c) 400 oC (d) 500 oC. ...................................................................... 98
6.3 Dependence of H2 evolution activity of SrTiO3:Rh (1.5 wt% Ru, 1 mole% Rh, cal. 550 oC) at
different pHs under visible light in 10 vol% methanol-water solution. .............................. 100
6.4 Dependence of H2 evolution activity of SrTiO3:Rh (1.5 wt% Ru, 1 mole% Rh) upon different
calcination temperatures under visible light in 10 vol % methanol-water solution. ........... 102
6.5 Diffuse reflectance spectra of Rh-doped aerogel SrTiO3 (1.5 wt% Ru, 1.25 mole% Rh) from
different calcination temperatures (a) 450 oC (b) 500 oC (c) 550 oC (d) 600 oC (e) 650 oC.
............................................................................................................................................. 103
6.6 Dependence of H2 evolution activity of Rh-doped aerogel SrTiO3 (1.5 wt% Ru, cal. 500 oC)
at different doping amounts in 10 vol % methanol-water solution (pH = 12.4, adjusted by
NaOH) under visible light. .................................................................................................. 105
6.7 Diffuse reflectance spectra of Rh-doped aerogel SrTiO3 (1.5 wt% Ru, cal. 500 oC) from
different doping amounts (a) 1 mole% (b) 1.25 mole% (c) 1.5 mole% (d) 1.75 mole%. ... 106
6.8 TEM images of Rh-doped aerogel synthesis SrTiO3 (1.5 wt% Ru, cal. 500 oC) upon the
different Rh doping amount (a) 1 mole% (b) 1.25 mole% (c) 1.5 mole% (d) 1.75 mole%. 107
xvii
6.9 Dependence of H2 evolution activity of aerogel SrTiO3: Rh (1.25 mole % Rh, cal. 500 oC)
upon different amounts of co-catalyst Ru in 10 vol % methanol solution (pH = 12.4,
adjusted by NaOH) under visible light. .............................................................................. 108
6.10 Proposed schematic diagram for visible light response of Ru/SrTiO3:Rh photocatalyst. .. 110
6.11 XPS spectra of Ru/SrTiO3:Rh (1.25 mole % Rh, 1.5 wt% Ru, Cal. 500 oC) (a) C 1s (b) Ru
3p3/2 (c) Rh 3d5/2. ............................................................................................................. 111

xviii
List of Tables
3.1 Elemental analysis before and after hydrogen production reaction of Ti-In (oxy)nitride
(800 oC) under UV-vis light. ................................................................................................. 24
3.2 The maximum absorbance wavelength, Band Gap Energies and hydrogen production rates in
pure water of Ti-In (oxy)nitride samples prepared by different ammonolysis temperatures 26
4.1 BET and Photocatalystic activities of TiN/In2O3 with various nitridation times under UV -
Visible irradiation in 20 % ethanol solution ......................................................................... 46
4.2 Diffraction Data Powder X-Ray ............................................................................................. 49
4.3 Characterization Data for various samples: UV-vis Absorption Spectra ............................... 53
5.1 Wet Chemical methods for the synthesis of mixed metal oxides ........................................... 66
5.2 CVD based techniques ............................................................................................................ 72
5.3 Oxide Powders Prepared by the Aerosol Method21 ................................................................ 73
5.4 Critical Points of Some Solvents26 .......................................................................................... 81
6.1 Characteristic properties of SrTiO3:Rh (1 mole %) calcined in air at different temperatures.
............................................................................................................................................... 98

xix
List of Equations
CH4 + H2O → 4TU CO + 3H2 (1.1) ................................................................................................... 1
CO + H2O → 4TU CO2 + H2 (1.2) ...................................................................................................... 1
2d sinθ = nλ (3.1) ....................................................................................................................... 17
D = 𝐾𝜆𝐵 𝑐𝑜𝑠𝜃𝐵
(3.2) ....................................................................................................................... 17
TiIn0.029N0.63O1.4 + 0.65H2O 0.65H2 + TiO2 + 0.015In2O3 + 0.32N2 (3.3) ........ 24
1
𝑊(𝑃𝑜𝑃 −1)= 1
𝑊𝑚𝐶+ 𝐶−1
𝑊𝑚𝐶 ( 𝑃𝑃𝑜
) (3.4) .............................................................................................. 34
𝑆𝑡 = 𝑊𝑚𝑁𝐴𝐶𝑆𝑀
(3.5) ................................................................................................................... 34
𝑆 = 𝑆𝑡𝑤
(3.6) ............................................................................................................................... 34
𝑅𝐾 = −2𝛾𝑉𝑚𝑅𝑇𝑙𝑛( 𝑃𝑃𝑜
) (3.7) ................................................................................................................... 34
(1-x) MCO3 + xM’CO3 → M1-xM’x(CO3) → M1-xM’O (5.1) .................................................... 69
Si(OEt)4 → SiO2 + 2 C2H4 + 2 EtOH (5.2) .......................................................................... 71
2 H2 + O2 → 2 H2O (5.3) ........................................................................................................... 73
TiCl4 + 2 H2O → TiO2 + 4 HCl (5.4) ........................................................................................ 73
SiCl4 + 2 H2 + O2 → SiO2 + 4 HCl (5.5) ................................................................................... 74
≡M-OR + H2O → ≡M-OH + HOR (Hydrolysis) (5.6) .......................................................... 75
≡M-OH + ≡M-OR → ≡M-O-M≡ + HOR (Condensation) (5.7) ......................................... 75
2 ≡M-OH → ≡M-O-M≡ + H2O (Addition) (5.8) .................................................................. 75
M(OR)n + m H2O → M(OR)n-m(OH)n + m ROH (5.9) .......................................................... 76

xx
MOH + MOX → MOM + XOH (5.10) ..................................................................................... 76

xxi
Acknowledgements
Numerous people were helping me in the completion of this dissertation. First and
foremost, I am appreciative and thankful for the support of my supervisor: Professor Kenneth J.
Klabunde. He is the coolest adviser, who taught me how to scientifically approach and solve the
problems with resolute mind and diligently unremitting spirit. Modeling from him, I learn the
dedication to science and research.
I would like to thank my graduate committee members for taking time and efforts to have
active roles in my graduate studies at Kansas State University, Dr. Kenneth J. Klabunde, Dr.
Ryszard Jankowiak, Dr. Eric A. Maatta and Dr. Christopher M. Sorensen. I would like to thank
them for their help for useful and valuable suggestions and discussions.
I would also like to express my thanks and gratitude to several professors, who kindly
provided me their help: Professor Chun-Guey Wu built me the foundation of the chemistry.
Professor Eric A. Maatta generously helped me for the reference letters and encouragement.
Professor Christine Aikens generously helped me for the cover letters and presentation
preparation.
Besides the faculties, I would like to thank the staff of department of chemistry,
especially Jim Hodgson and Tobe Eggers, for their expertise support to all the experiments.
Last, but certainly not least, I would like to thank my family and friends for always
supporting me. You do not know how much your support means to me and without you standing
by me I would never have written this dissertation.

xxii
Dedication
The dissertation is dedicated to my parents and wife, Yufen. I give my deepest expression
of love and appreciation for their support and encouragement, and their sacrificed devotion to
help me to conquer my graduate program.

xxiii
Preface
It is essential that the student acquires an understanding of and a lively feeling for values.
He must acquire a vivid sense of the beautiful and of the morally good. Otherwise he with his
specialized knowledge more closely resembles a well-trained dog than a harmoniously
developed person.
By Albert Einstein

1
Chapter 1 - Introduction
The increase of energy requirement and decrease of fossil fuel result in the urgent
development of renewable energy. Because of high fabrication costs, insufficient light
absorption1 and inefficient charge transfer,2 photovoltaic2 and electrochemical solar cells2-4 are
still not economical. On the other hand, hydrogen is a clean energy when it is used in fuel cells
and only produces water. Moreover, ammonia synthesis in the industrial world also needs a large
scale source of H2. However, the largest hydrogen source in the present day is mainly from fossil
fuels as well as natural gas by steam reforming.5
CH4 + H2O CO + 3H2
CO + H
(1.1)
2O CO2 + H2
(1.2)
The reaction requires natural gas and emits CO2. Hydrogen has to be produced from
water using natural energies such as sunlight for great economic and environmental interests.
Therefore, direct splitting of water using a particulate photocatalyst would be a good way to
produce clean and recyclable hydrogen on a large scale.6 There are several ways for solar
hydrogen production from water.
(i) Electrolysis of water using a solar cell, a hydroelectric power generater, etc.
(ii) Reforming of biomass.
(iii) Photocatalytic or photoelectrochemical water splitting (mimic photosynthesis).
Using a powdered photocatalyst for water splitting is the most simple method, as shown
in figure 1.1. In a process that mimics photosynthesis, photocatalyst powders dispersed in water

2
absorb solar energy and convert water into H2 and O2. Even though the separation of H2 and O2
evolved from the water splitting reaction is a disadvantage, the problem can be solved by using a
Z-scheme photocatalyst system. Furthermore, powdered photocatalysts have an advantage for
large-scale application of water splitting because of its simplicity. Therefore, H2
from
photocatalytic water splitting is a green and sustainable chemistry which can overcome energy
and environmental issues resulting in an energy revolution.
Figure 1.1 Conversion of solar energy to hydrogen energy by using powdered photocatalysts.
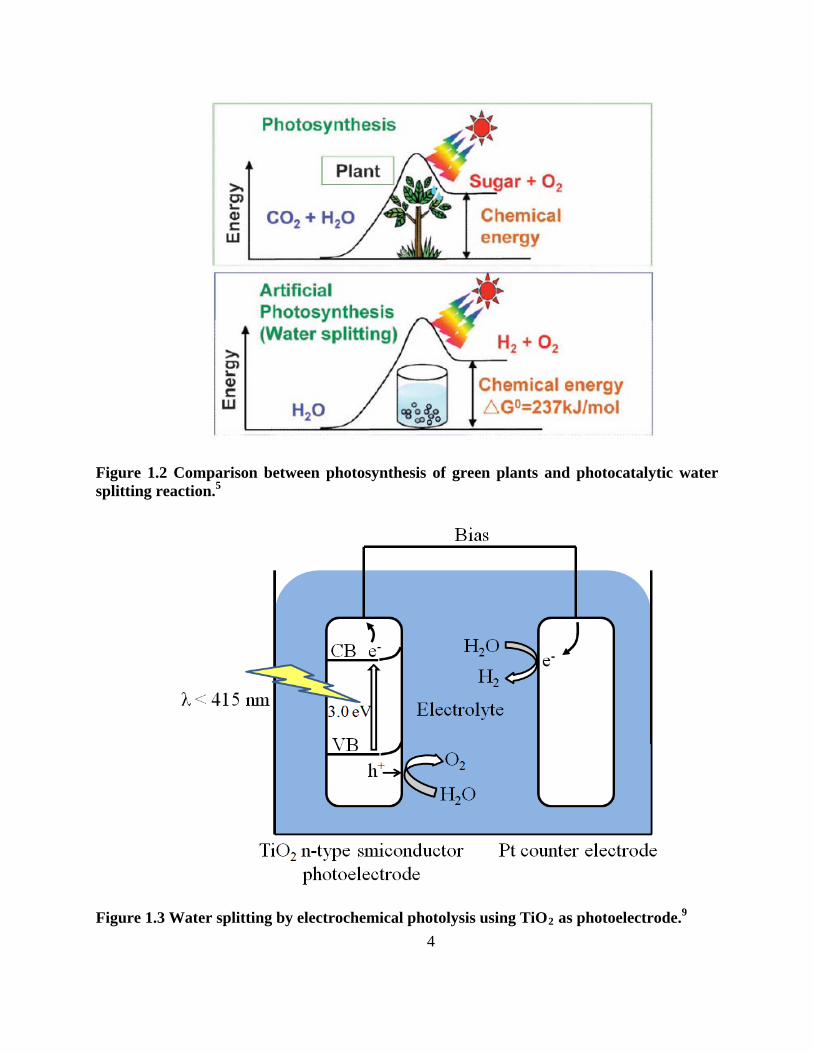
The water splitting reaction is the conversion of solar energy to chemical energy
accompanied with a positive change in the Gibbs free energy as shown in Figure 1.2.5 It mimics
the photosynthesis of green plants. Therefore, photocatalytic water splitting has the perspective
of an artificial photosynthesis in chemistry. Base d on the Gibbs free energy change of uphill
reactions, photocatalytic water splitting is distinguished from photocatalytic degradation
reactions such as photo-oxidation of organic compounds using oxygen molecules that are
3
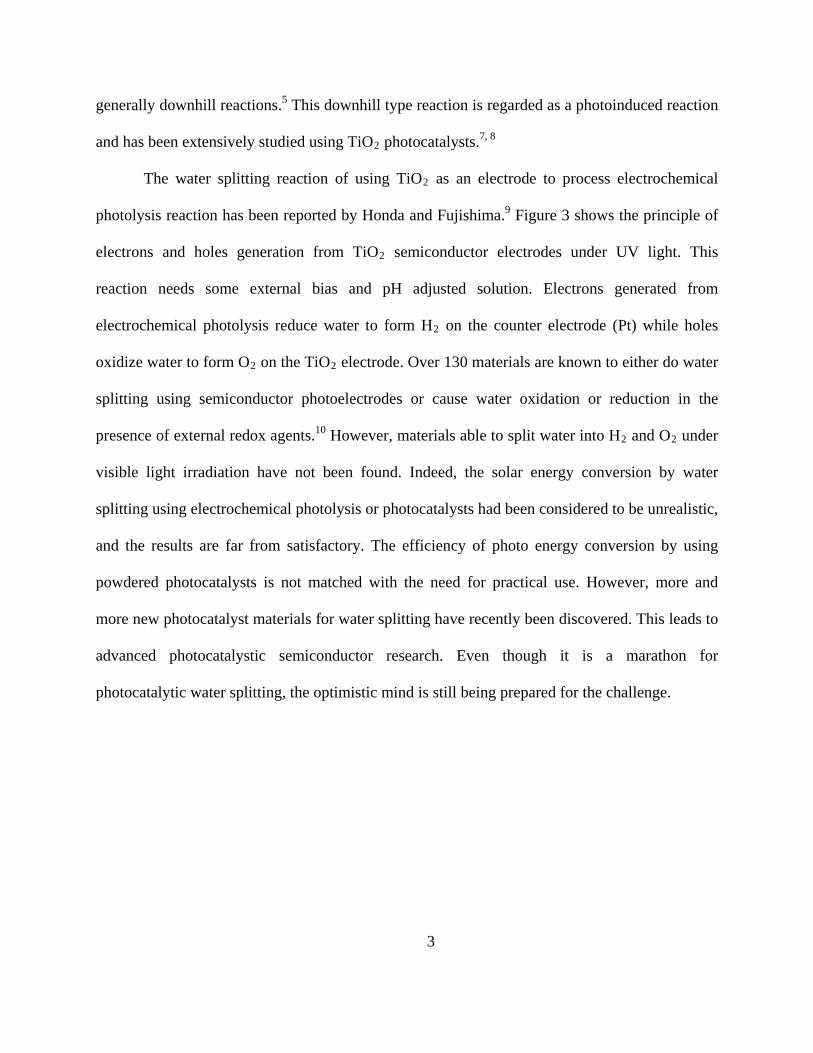
generally downhill reactions.5 This downhill type reaction is regarded as a photoinduced reaction
and has been extensively studied using TiO2 photocatalysts.7, 8
The water splitting reaction of using TiO2
9
as an electrode to process electrochemical
photolysis reaction has been reported by Honda and Fujishima. Figure 3 shows the principle of
electrons and holes generation from TiO2 semiconductor electrodes under UV light. This
reaction needs some external bias and pH adjusted solution. Electrons generated from
electrochemical photolysis reduce water to form H2 on the counter electrode (Pt) while holes
oxidize water to form O2 on the TiO2
10
electrode. Over 130 materials are known to either do water
splitting using semiconductor photoelectrodes or cause water oxidation or reduction in the
presence of external redox agents. However, materials able to split water into H2 and O2 under
visible light irradiation have not been found. Indeed, the solar energy conversion by water
splitting using electrochemical photolysis or photocatalysts had been considered to be unrealistic,
and the results are far from satisfactory. The efficiency of photo energy conversion by using
powdered photocatalysts is not matched with the need for practical use. However, more and
more new photocatalyst materials for water splitting have recently been discovered. This leads to
advanced photocatalystic semiconductor research. Even though it is a marathon for
photocatalytic water splitting, the optimistic mind is still being prepared for the challenge.
4
Figure 1.2 Comparison between photosynthesis of green plants and photocatalytic water splitting reaction.5
Figure 1.3 Water splitting by electrochemical photolysis using TiO29 as photoelectrode.
5
References
1. Law, M.; Greene, L. E.; Johnson, J. C.; Saykally, R.; Yang, P. D., Nanowire dye-sensitized solar cells. Nature Materials 2005, 4, (6), 455-459.
2. Huynh, W. U.; Dittmer, J. J.; Alivisatos, A. P., Hybrid nanorod-polymer solar cells. Science 2002, 295, (5564), 2425-2427.
3. Bach, U.; Lupo, D.; Comte, P.; Moser, J. E.; Weissortel, F.; Salbeck, J.; Spreitzer, H.; Gratzel, M., Solid-state dye-sensitized mesoporous TiO2
4. Gratzel, M., Photoelectrochemical cells. Nature 2001, 414, (6861), 338-344.
solar cells with high photon-to-electron conversion efficiencies. Nature 1998, 395, (6702), 583-585.
5. Kudo, A.; Miseki, Y., Heterogeneous photocatalyst materials for water splitting. Chemical Society Reviews 2009, 38, (1), 253-278.
6. Bard, A. J.; Fox, M. A., Artificial Photosynthesis: Solar Splitting of Water to Hydrogen and Oxygen. Accounts of Chemical Research 1995, 28, (3), 141-145.
7. Fujishima, A.; Rao, T. N.; Tryk, D. A., Titanium dioxide photocatalysis. Journal of Photochemistry and Photobiology C: Photochemistry Reviews 2000, 1, (1), 1-21.
8. Sheppard, L. R.; Bak, T.; Nowotny, J.; Nowotny, M. K., Titanium dioxide for solar-hydrogen V. Metallic-type conduction of Nb-doped TiO2
9. Fujishima, A.; Honda, K., electrochemical photolysis of water at a semiconductor electrode. Nature 1972, 238, (5358), 37.
. International Journal of Hydrogen Energy 2007, 32, (14), 2660-2663.
10. Osterloh, F. E., Inorganic Materials as Catalysts for Photochemical Splitting of Water. Chemistry of Materials 2008, 20, (1), 35-54.

6
Chapter 2 - Basis of photocatalytic water splitting
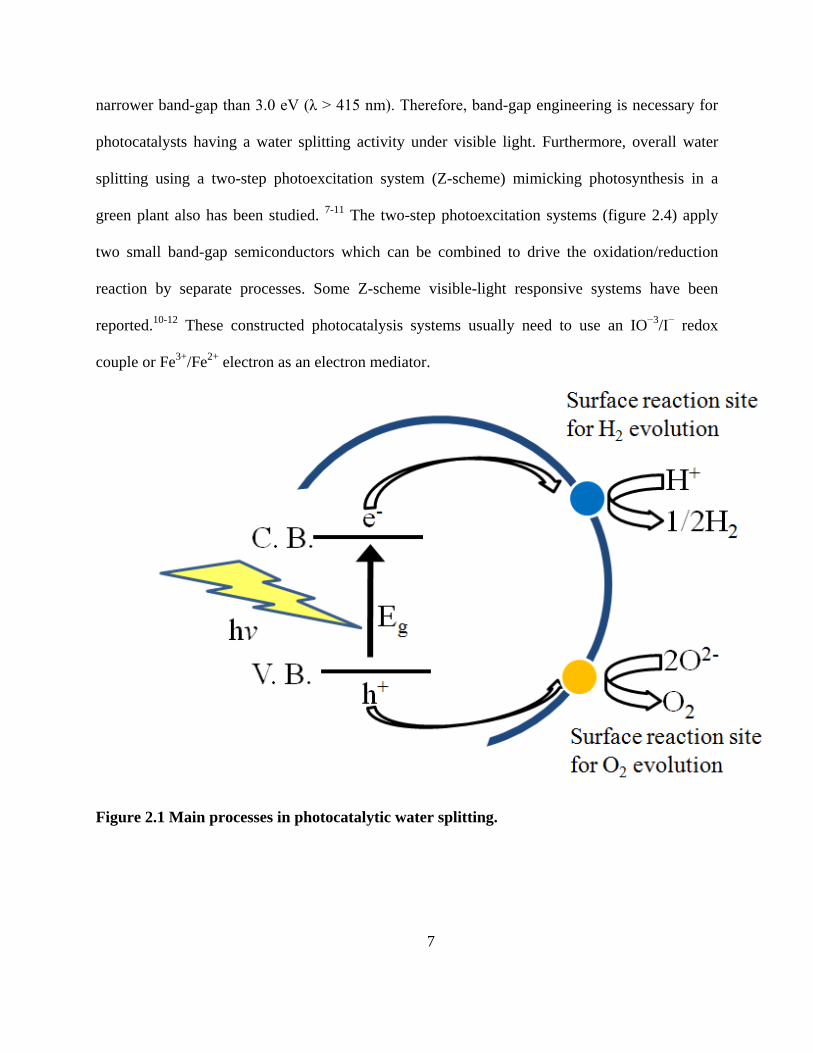
Figure 2.1 shows the process of photocatalytic semiconductor water splitting. The first
step is based on photon absorption and forming electron-hole pairs. The band structure of
semiconductors strongly affects photocatalytic properties. For H2
1
evolution to happen, the
conduction band potential of the semiconductor must higher than proton reduction potential of
0.0 V vs NHE at pH = 0 (-0.41 V at pH = 7). The potential of valance band edge must exceed
the oxidation potential of water of +1.23 V vs NHE at pH = 0 (+0.82 V at pH = 7) as shown in
figure 2.2. Moreover, the band levels usually shift with a change in pH (-0.059 V/pH) of solution
for oxide materials. 2-4 Band-gap of semiconductor which does not match with oxidation or
reduction potential usually requires a bias voltage, pH adjustment or external redox reagents to
drive the reaction. Based on these criteria, a band-gap energy of 1.23 eV is a theoretical
minimum requirement for driving the water splitting reaction, which corresponds to a
wavelength of 1100 nm light. Band levels of various semiconductors materials are shown in
figure 2.3. The band gap achieved so far is 2.3 eV in NiO/RuO2-Ni:InTaO45. , 6 Band-gap levels
of ZrO2, KTaO3, SrTiO3 and TiO2 are suitable for water splitting. But these materials are only
active for water splitting when they are loaded with co-catalysts such as Pt, Ru or Rh. The band-
gap of CdS seems to have a suitable visible light absorption to drive water splitting. But S2- in
CdS is oxidized rather than H2O by photogenerated holes. This reaction is called photocorrosion
and often results in metal sulfide photocatalyst s having a short lifetime. However, CdS is an
excellent photocatalyst for H2 evolution under visible light irradiation if a hole scavenger is
present. For O2 evolution, WO3 is a good photocatalyst under visible light with an electron
acceptor such as Ag+ and Fe3+. If the photocatalyst is visible-light-driven, it should have a
7
narrower band-gap than 3.0 eV (λ > 415 nm). Therefore, band-gap engineering is necessary for
photocatalysts having a water splitting activity under visible light. Furthermore, overall water
splitting using a two-step photoexcitation system (Z-scheme) mimicking photosynthesis in a
green plant also has been studied. 7-11 The two-step photoexcitation systems (figure 2.4) apply
two small band-gap semiconductors which can be combined to drive the oxidation/reduction
reaction by separate processes. Some Z-scheme visible-light responsive systems have been
reported.10-12 These constructed photocatalysis systems usually need to use an IO−3/I− redox
couple or Fe3+/Fe2+ electron as an electron mediator.
Figure 2.1 Main processes in photocatalytic water splitting.

8
The second step involves charge separation and migration. The separated charges migrate
to surface reaction sites and react with water. The recombination of electron-hole pairs
suppresses the photocatalytic water splitting reaction. Therefore, crystallinity and particle size
strongly affect water splitting activity. The high crystalline quality results in a small amount of
defects. Because the defects act as trapping and recombination centers for photogenerated
electrons and holes, they result in a decrease in photocatalytic activity. On the other hand, the
migration distance of photogenerated electrons and holes to reaction sites on the surface are
based on particle size. When particle size becomes small, the distance becomes short, which
results in a decreased probability of recombination and a higher activity.
Figure 2.2 Principle of water splitting using semiconductor photocatalysts.

9
Figure 2.3 Relationship between band structure of semiconductor and redox potentials of water splitting.13
Figure 2.4 Mechanism of overall water splitting using the Z-scheme photocatalysis system driven by electron transfer photocatalysts.
10
The surface chemical reactions are the final step. Surface character (active sites) and
quantity (surface area) strongly affect this step. The photogenerated electrons and holes will
recombine with each other even if they carry thermodynamically sufficient potentials for water
splitting, when the active sites for redox reactions do not exist on the surface. Pt, NiO, Rh and
RuO2 are usually used as co-catalysts for active sites for H2 evolution. These co-catalysts help
the oxide photocatalysts, which normally do not have high enough conduction band levels to
reduce water and produce H2. O2 evolution usually does not need co-catalysts, even though the
process needs 4-electron oxidation of water on active sites. This is the characteristic point of
heterogeneous photocatalysts being different from homogeneous photocatalysts for which O2
evolution with 4-electron oxidation of H214O is a challenging reaction. Moreover, the evolved H2
and O2 can easily react with each other and turn back to water. Therefore, co-catalyst should not
aid the back reactions on the reactive sites. The Fe3+/Fe2+ electron mediator is indispensable for
overall water splitting using the Z-scheme system employing Pt/SrTiO3: Rh because the iron ion
not only shuttles the carriers but also suppresses a back reaction to form water from evolved H2
and O27 on the Pt cocatalyst by covering the Pt surface with iron species. , 12, 15 In contrast to the
Pt cocatalyst, a Ru cocatalyst is an effective cocatalyst that does not enhance the back reaction.8
Many materials of photovoltaic, phosphors and dielectric are also photocatalysts.
However, the significant difference between the photocatalyst and the other materials is that
chemical reactions are involved in the photocatalytic process, but not in the other physical
properties.14 Photocatalytic activities are achieved only when three steps are simultaneously
completed. Thus, crystalline quality, particle size and reactive sites on the surface are required
for photocatalysts. Photocatalysts need to be highly functional materials.

11
References
1. Osterloh, F. E., Inorganic Materials as Catalysts for Photochemical Splitting of Water. Chemistry of Materials 2007, 20, (1), 35-54.
2. Grätzel, M., Energy resources through photochemistry and catalysis. Academic Press: New York, 1983; p xiv, 573 p.
3. Nozik, A. J., Photoelectrochemistry: Applications to Solar Energy Conversion. Annual Review of Physical Chemistry 1978, 29, (1), 189-222.
4. Gurevich, I. U. I. A.; Pleskov, I. U. V., Semiconductor photoelectrochemistry. Consultants Bureau: New York, 1986; p xxv, 422 p.
5. Zou, Z.; Arakawa, H., Direct water splitting into H2 and O2
6. Zou, Z.; Ye, J.; Sayama, K.; Arakawa, H., Direct splitting of water under visible light irradiation with an oxide semiconductor photocatalyst. Nature 2001, 414, (6864), 625-627.
under visible light irradiation with a new series of mixed oxide semiconductor photocatalysts. Journal of Photochemistry and Photobiology A: Chemistry 2003, 158, (2-3), 145-162.
7. Sasaki, Y.; Nemoto, H.; Saito, K.; Kudo, A., Solar Water Splitting Using Powdered Photocatalysts Driven by Z-Schematic Interparticle Electron Transfer without an Electron Mediator. The Journal of Physical Chemistry C 2009, 113, (40), 17536-17542.
8. Sasaki, Y.; Iwase, A.; Kato, H.; Kudo, A., The effect of co-catalyst for Z-scheme photocatalysis systems with an Fe3+/Fe2+ electron mediator on overall water splitting under visible light irradiation. Journal of Catalysis 2008, 259, (1), 133-137.
9. Fujihara, K.; Ohno, T.; Matsumura, M., Splitting of water by electrochemical combination of two photocatalytic reactions on TiO2
10. Sayama, K.; Mukasa, K.; Abe, R.; Abe, Y.; Arakawa, H., Stoichiometric water splitting into H and O using a mixture of two different photocatalysts and an IO3-/I- shuttle redox mediator under visible light irradiation. Chemical Communications 2001, (23), 2416-2417.
particles. Journal of the Chemical Society, Faraday Transactions 1998, 94, (24), 3705-3709.
11. Abe, R.; Takata, T.; Sugihara, H.; Domen, K., Photocatalytic overall water splitting under visible light by TaON and WO3 with an IO3-/I- shuttle redox mediator. Chemical Communications 2005, (30), 3829-3831.
12
12. Kato, H.; Hori, M.; Konta, R.; Shimodaira, Y.; Kudo, A., Construction of Z-scheme type heterogeneous photocatalysis systems for water splitting into H2 and O2
13. Serpone, N.; Pelizzetti, E., Photocatalysis : fundamentals and applications. Wiley: New York, 1989; p x, 650 p.
under visible light irradiation. Chemistry Letters 2004, 33, (10), 1348-1349.
14. Kudo, A.; Miseki, Y., Heterogeneous photocatalyst materials for water splitting. Chemical Society Reviews 2009, 38, (1), 253-278.
15. Kato, H.; Sasaki, Y.; Iwase, A.; Kudo, A., Role of Iron Ion Electron Mediator on Photocatalytic Overall Water Splitting under Visible Light Irradiation Using Z-Scheme Systems. Bulletin of the Chemical Society of Japan 2007, 80, (12), 2457-2464.

13
Chapter 3 - Titanium-Indium Oxynitrides for Water Splitting.
Photocatalysis vs. Light Induced Catalyst Oxidation by Water
3.1 Introduction
Osterloh1 has recently reviewed inorganic materials for photochemical water splitting.
Over 130 inorganic materials/composites are mentioned. Most successful composites contain
co-catalysts, and NiO modified La/K/TaO32, and NiO modified La4CaTi5O17
3 appear to be the
most efficient photocatalysts yet reported.
Metal nitrides and metal-oxynitride composites have also received some study.1 For
example, Domen and coworkers investigated a solid solution of GaN and ZnO with RuO2
4
nanoparticles to achieve overall water splitting. , 5 These studies revealed that the photocatalytic
activity for water splitting depends on the crystallinity and composition of the material.
Another study describes advanced visible-light-driven photocatalysts by focusing on the
refinement of non-oxide-type photocatalysts; this study used Nitrogen to replace Oxygen in TiO2
to form TiO2-xNx6. , 7 Additionally, Poznyak and co-workers8 have investigated the
photoelectrochemical properties of nanocrystalline TiO2/In2O3 composite solids. It was shown
that TiO2/In2O3 composites allow efficient separation of photogenerated charge carriers
occurring in interconnected TiO2 and In2O3
9
particles, owing to the favorable energetics of the
conduction bands of these oxides. Another report shows that nitrogen-doped In2O3 thin film
electrodes are effective for photocatalytic water splitting. Therefore, it may be possible to
combine the TiO2 property of formation of electrons and holes by absorbing light and then using
the interconnection between TiO2 and In2O3 to transfer the holes to In2O3. We considered that
partially nitrided composites of titanium and indium oxides may be effective in water splitting

14
under visible light. In our research, optimal preparation conditions were investigated in order to
achieve the best hydrogen production. Reported herein are our results with pure water and with
Ethanol-water solutions.
3.2 Experimental
3.2.1 Preparation of Ti-In nitride composites
Composite powders were prepared by heating a mixture of 0.92 g (1.2 × 10⁻² mol)
anatase TiO2 powder (Sigma-Aldrich, anatase, nanopowder, <25nm, 99.7%) and 3.2 g (1.2 × 10-
2 mol) In2O3 powder (Sigma-Aldrich, nanopowder, <100nm, 99.9%) at different temperatures
under NH3 flow (250 mL/min) for 20 hours as shown in Figure 3.1 (The reaction chamber
diameter is 4.5 cm). The mole ratio of Ti to In in the starting material (TiO2 and In2O3) was 1/1,
which should give a Ti:In ratio of 1:2. After 20 hours of ammonolysis, the sample was cooled to
room temperature under NH3
flow.
3.1 Experimental setup for nitridation of TiO2/In2O3 mixture.

15
3.2.2 Hydrogen Production
The reactions were carried out in a glass-enclosed reaction chamber connected to a gas
circulation and evacuation system with a quartz inner irradiation-type reaction vessel shown in
figure 3.2. The apparatus contained 400 ml distilled water solution with 0.13 g sulfuric acid and
0.30 g of the composite Ti-In (oxy)nitride. The reactant solution was evacuated and filled with
argon three times to remove air completely, followed by irradiation ( λ > 400 nm) under a 450 W
high-pressure Hg lamp via a quartz tube that was air filled for full spectrum UV-vis studies, or
filled with 2 M NaNO3 aqueous solution for visible light studies. The reaction temperature was
controlled between 20 to 25 oC. H2
production was monitored during the reaction with an online
GC system (GOMAC model) employing a Supelco molecular 80/100 sieve 5A column with Ar
as the carrier gas and a thermal conductivity detector (TCD).
3.2 Experimental setup for hydrogen production measurement.
16
3.2.3 Characterization of Composites
The prepared samples were studied by powder X-ray diffraction (XRD; Bruker D8 X-ray
diffractometer with Cu Kα radiation), scanning electron microscopy (SEM; Hitachi S-3500 N),
UV-visible diffuse reflectance spectroscopy (DRS; Varian Cary 500 Scan). The Brunauer,
Emmett, Teller (BET) surface area was measured with a Quantachrome NOVA-1200 instrument
at liquid nitrogen temperature. X-ray photoelectron spectroscopy (XPS) was conducted using a
SPECS Sage100 spectrometer operating in the fixed analyzer transmission mode using
achromatic Mg Kα (1253.6 eV) radiation at 240 W (12 kV and 20 mA) using a water-cooled X-
ray gun cap and evacuated with turbomolecular pumping. The base pressure of the chamber was
about 2 × 10⁻⁸ Torr, and the energy scales were calibrated using copper and the separation
between photoelectron peaks generated by Mg and Al Kα X-rays. Survey spectra were collected
with a pass energy of 30 eV; a pass energy of 15 eV was used for both core and valence band
spectra. Many of the spectra were calibrated by taking the C 1s peak due to residual hydrocarbon
as being at 284.4 eV.
3.3 Results and Discussion
3.3.1 Crystal Structure
The structure of materials can be determined by Powder X-ray diffraction (XRD). But
this technique has a limitation for disordered and amorphous materials. The XRD pattern is
unique for each material, so there is no identical pattern for different substances. There is a lot of
available data containing standard patterns that people can use to identify pure substance or
crystalline phases by simple searching and matching procedures.
17
The arrangement of atoms in the crystal can be observed when an X-ray beam excites the
atoms in the solid sample. The electrons of these atoms start to oscillate and form a constructive
interference. The diffracted beam in the same phase mutually reinforces one another.
The theta angle (θ) of incident and reflected rays diffraction can be explained by Bragg’s
Law. The unit cell dimensions (d) can be express:
2d sinθ = nλ (3.1)
The crystallite sizes of samples can be calculated from the XRD spectra using the Debye-
Scherrer equation:
D = 𝑲𝝀𝑩 𝒄𝒐𝒔𝜽𝑩
(3.2)
Where D is the thickness of the crystal (Å); K is a constant depends on the crystallite
shape; λ is the X-ray wavelength (1.54051 Å for CuKα); θB
Figure 3.3 shows XRD patterns from samples obtained by nitriding a mixture of TiO
is the Bragg angle (between incident
and diffracted beam); B is FWHM (Full-Width Half-Maximum) in radians.
2
and In2O3 at several ammonolysis temperatures. TiO2, In2O3 and TiN data are shown for
comparison. All composites’ patterns are similar to TiN and the peak assignments are based on
the ICSD database. None of the diffraction peaks of starting materials were observed, indicating
that the obtained samples were not physical mixtures of TiO2 and In2O3. The peak around 34o
corresponds to both InN and In metal. The XRD data demonstrate that an ammonolysis
temperature above 850 oC, caused an increase of In metal formation (which was generally lost
due to it volatility). It is known that In2O3
10
is reduced to metallic Indium upon ammonolysis of
Indium oxide by anhydrous ammonia above 650 oC. Indeed, we found that starting with only
In2O3 and then nitridation, indium metal was produced under the action of hot NH3. The high
ammonolysis temperature not only reduced In3+ into In, but also could cause InN decomposition.

18
Decomposition temperatures reported for InN range from 500 oC for thin films11, 12 to 710 oC. In
our research, even when the ammonolysis temperature was above 700 oC, some InN persisted
when TiO2 was also present as a co-reactant. Therefore, combining TiO2 and In2O3 not only
created H2 production activity, but also helped to stabilize InN, and Indium Nitride is a key for
H2
generation performance. Normally, we found that the stronger the peak intensity for InN, the
higher the efficiency of the hydrogen production. The full width at half maximum (FWHM) for
the InN XRD peak varied for 700 oC, 750 oC, 800 oC and 850 oC ammonolysis temperature
samples and at 43o were 0.61, 0.48, 0.49 and 0.49 degree, respectively. Therefore, hydrogen
production was highest (samples d, e of Figure 3.3) when the crystallites were smaller.
19
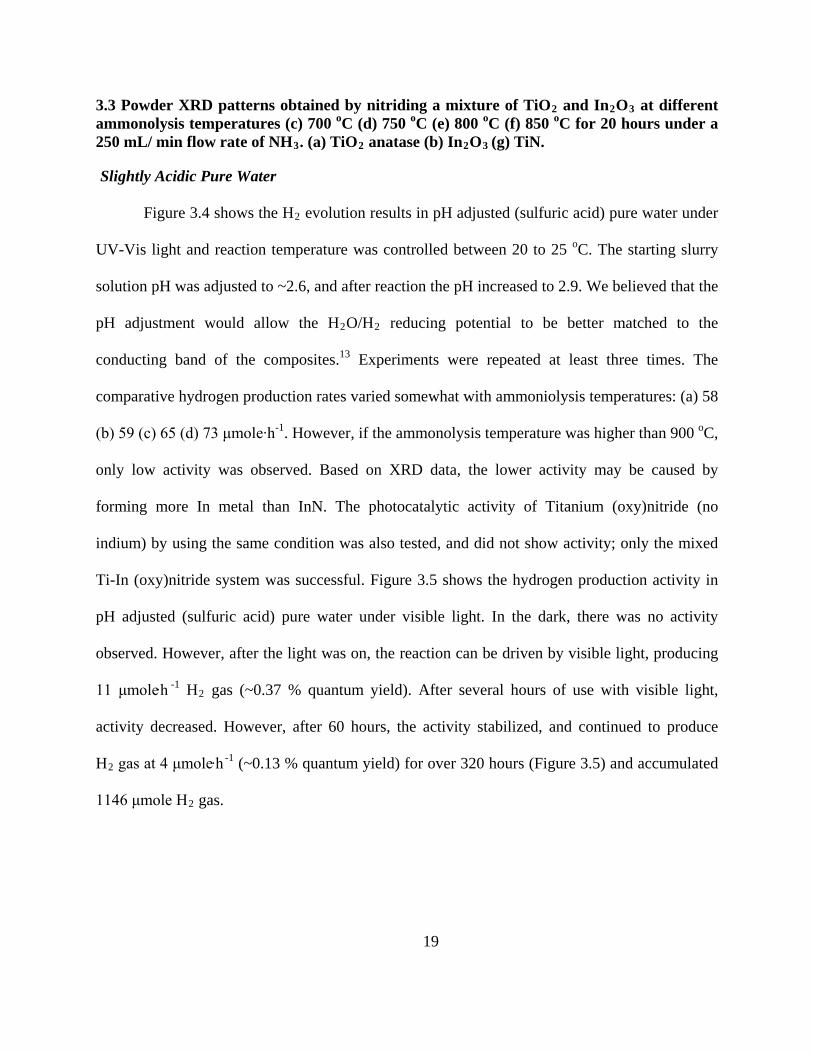
3.3 Powder XRD patterns obtained by nitriding a mixture of TiO2 and In2O3 at different ammonolysis temperatures (c) 700 oC (d) 750 oC (e) 800 oC (f) 850 oC for 20 hours under a 250 mL/ min flow rate of NH3. (a) TiO2 anatase (b) In2O3
Slightly Acidic Pure Water
(g) TiN.
Figure 3.4 shows the H2 evolution results in pH adjusted (sulfuric acid) pure water under
UV-Vis light and reaction temperature was controlled between 20 to 25 oC. The starting slurry
solution pH was adjusted to ~2.6, and after reaction the pH increased to 2.9. We believed that the
pH adjustment would allow the H2O/H2
13
reducing potential to be better matched to the
conducting band of the composites. Experiments were repeated at least three times. The
comparative hydrogen production rates varied somewhat with ammoniolysis temperatures: (a) 58
(b) 59 (c) 65 (d) 73 μmole∙h-1. However, if the ammonolysis temperature was higher than 900 oC,
only low activity was observed. Based on XRD data, the lower activity may be caused by
forming more In metal than InN. The photocatalytic activity of Titanium (oxy)nitride (no
indium) by using the same condition was also tested, and did not show activity; only the mixed
Ti-In (oxy)nitride system was successful. Figure 3.5 shows the hydrogen production activity in
pH adjusted (sulfuric acid) pure water under visible light. In the dark, there was no activity
observed. However, after the light was on, the reaction can be driven by visible light, producing
11 μmole∙h -1 H2 gas (~0.37 % quantum yield). After several hours of use with visible light,
activity decreased. However, after 60 hours, the activity stabilized, and continued to produce
H2 gas at 4 μmole∙h -1 (~0.13 % quantum yield) for over 320 hours (Figure 3.5) and accumulated
1146 μmole H2 gas.

20
3.4 Dependence of UV-vis hydrogen production activity of nitrided mixture of TiO2 and In2O3 at different ammonolysis temperatures (a) 700 oC (b) 750 oC (c) 800 oC (d) 850 oC for 20 hours under a 250 mL/ min flow rate of NH3. Catalyst (0.3g), an aqueous slurry mixed with 0.13 g sulfuric acid (pH : ~2.6); light source, high-pressure mercury lamp (450 W); inner irradiation-type reaction vessel; reaction temperature was controlled between 20 to 25 oC.

21
3.5 Long term dependence of visible light hydrogen production activity of nitrided mixture of TiO2 and In2O3 ( 750 oC ammonolysis temperatures for 18 hours under a 250 mL/ min flow rate of NH3). Catalyst (0.3g), an aqueous solution mixed with 0.13 g sulfuric acid (pH : ~2.6); light source, high-pressure mercury lamp (450 W) with 2M NaNO2
Water with Ethanol as a Sacrificial Agent
solution as light filter. Inner irradiation-type reaction vessel. Reaction temperature was controlled between 20 to 25 oC.
Sacrificial reagents are often employed to evaluate activity for H214 production. Figure
3.6 shows the dependence of UV-Vis light activity of Ti-In (oxy)nitride (700 oC ammonyolysis)
in 20 % ethanol solution. It showed no activity in the dark. After turning on the light, the
hydrogen production activity was observed at a high rate (222 μmole∙h -1) and very stable. This
reaction was carried out for 50 hours and produced 9019 µmoles of hydrogen.

22
3.6 Dependence of UV-vis light hydrogen production activity of a nitrided mixture of TiO2 and In2O3 at 700 oC ammonolysis temperatures for 20 hours under a 250 mL/ min flow rate of NH3
Fig. 3.7 shows the dependence of visible light activity of Ti-In (oxy)nitride (700 oC
ammonyolysis) in 10 % methanol solution. It showed no activity in the dark. Moreover, the
control experiment (experiment without catalyst) also shows no H
. Catalyst (0.3g), an 20 % ethanol aqueous solution; light source, high-pressure mercury lamp (450 W). Inner irradiation-type reaction vessel. Reaction temperature was controlled between 20 to 25 oC.
2 production under visible light
at any time. After turning on the light, hydrogen production activity was observed (~0.5 μmole∙h-
1) and very stable. This reaction was carried out for 200 hours.
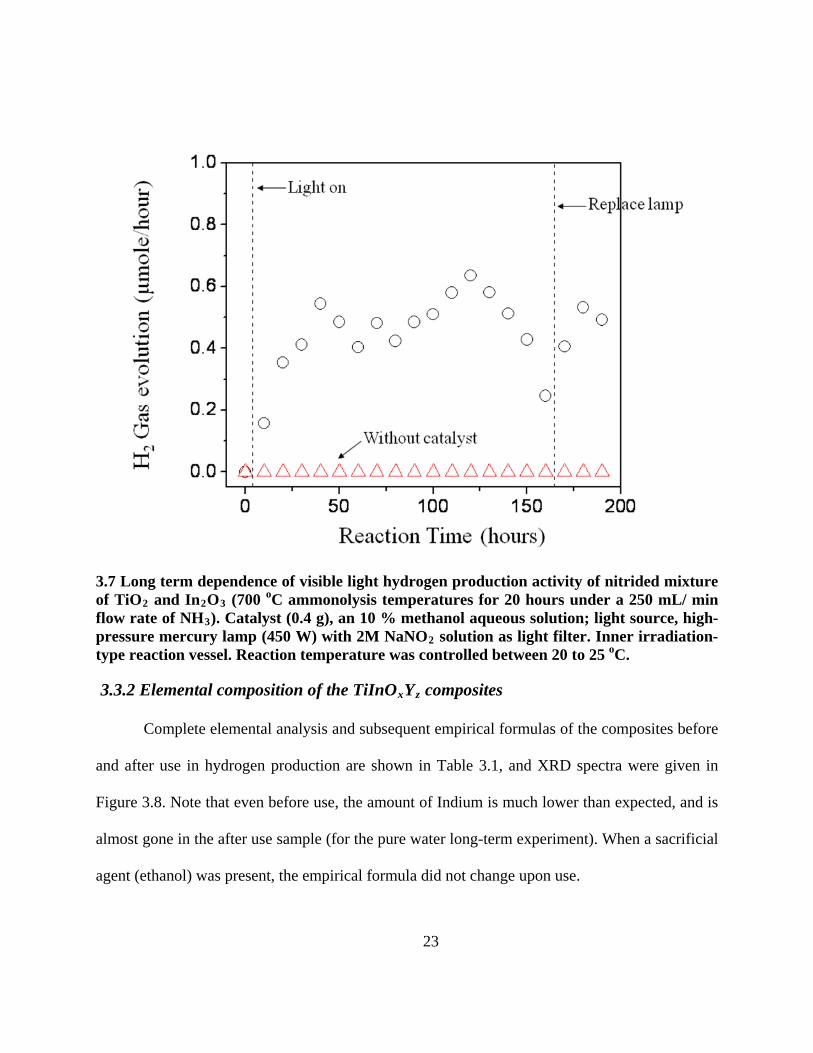
23
3.7 Long term dependence of visible light hydrogen production activity of nitrided mixture of TiO2 and In2O3 (700 oC ammonolysis temperatures for 20 hours under a 250 mL/ min flow rate of NH3). Catalyst (0.4 g), an 10 % methanol aqueous solution; light source, high-pressure mercury lamp (450 W) with 2M NaNO2
3.3.2 Elemental composition of the TiInO
solution as light filter. Inner irradiation-type reaction vessel. Reaction temperature was controlled between 20 to 25 oC.
xYz
Complete elemental analysis and subsequent empirical formulas of the composites before
and after use in hydrogen production are shown in Table 3.1, and XRD spectra were given in
Figure 3.8. Note that even before use, the amount of Indium is much lower than expected, and is
almost gone in the after use sample (for the pure water long-term experiment). When a sacrificial
agent (ethanol) was present, the empirical formula did not change upon use.
composites
24
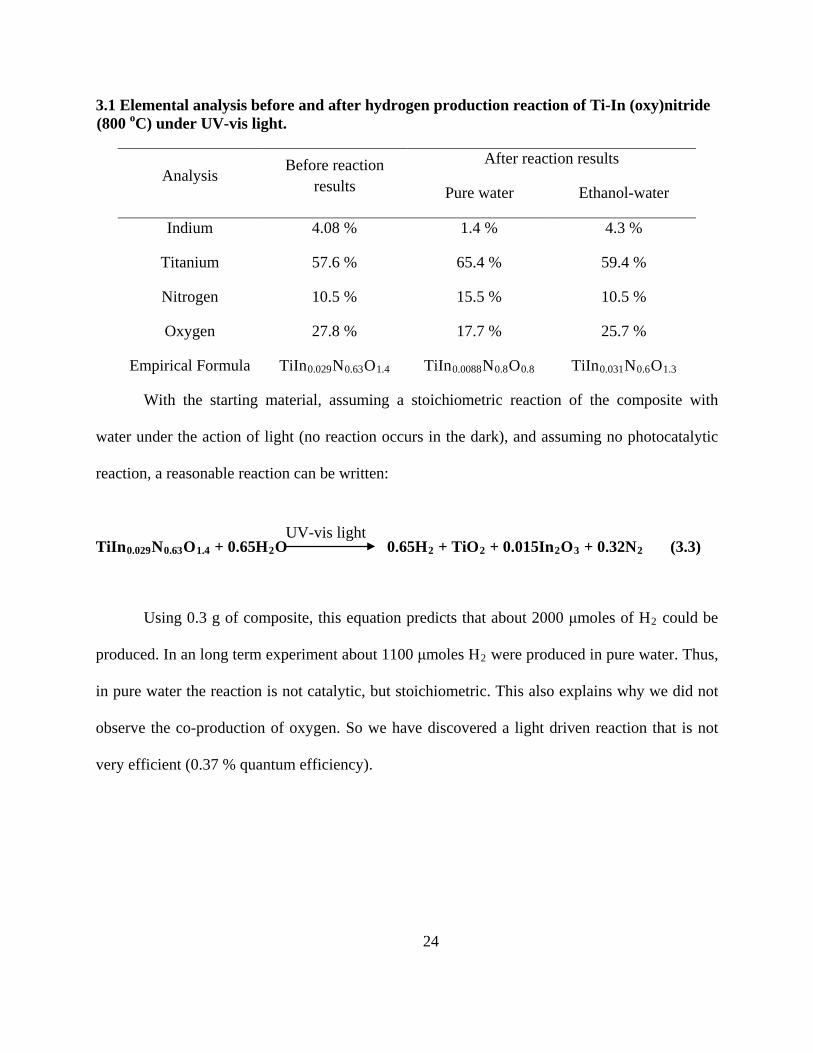
3.1 Elemental analysis before and after hydrogen production reaction of Ti-In (oxy)nitride
Analysis
(800 oC) under UV-vis light.
Before reaction results
After reaction results
Pure water Ethanol-water
Indium 4.08 % 1.4 % 4.3 %
Titanium 57.6 % 65.4 % 59.4 %
Nitrogen 10.5 % 15.5 % 10.5 %
Oxygen 27.8 % 17.7 % 25.7 %
Empirical Formula TiIn0.029N0.63O TiIn1.4 0.0088N0.8O TiIn0.8 0.031N0.6O
With the starting material, assuming a stoichiometric reaction of the composite with
water under the action of light (no reaction occurs in the dark), and assuming no photocatalytic
reaction, a reasonable reaction can be written:
1.3
TiIn0.029N0.63O1.4 + 0.65H2O 0.65H2 + TiO2 + 0.015In2O3 + 0.32N2
(3.3)
Using 0.3 g of composite, this equation predicts that about 2000 μmoles of H2 could be
produced. In an long term experiment about 1100 μmoles H2 were produced in pure water. Thus,
in pure water the reaction is not catalytic, but stoichiometric. This also explains why we did not
observe the co-production of oxygen. So we have discovered a light driven reaction that is not
very efficient (0.37 % quantum efficiency).
UV-vis light
25
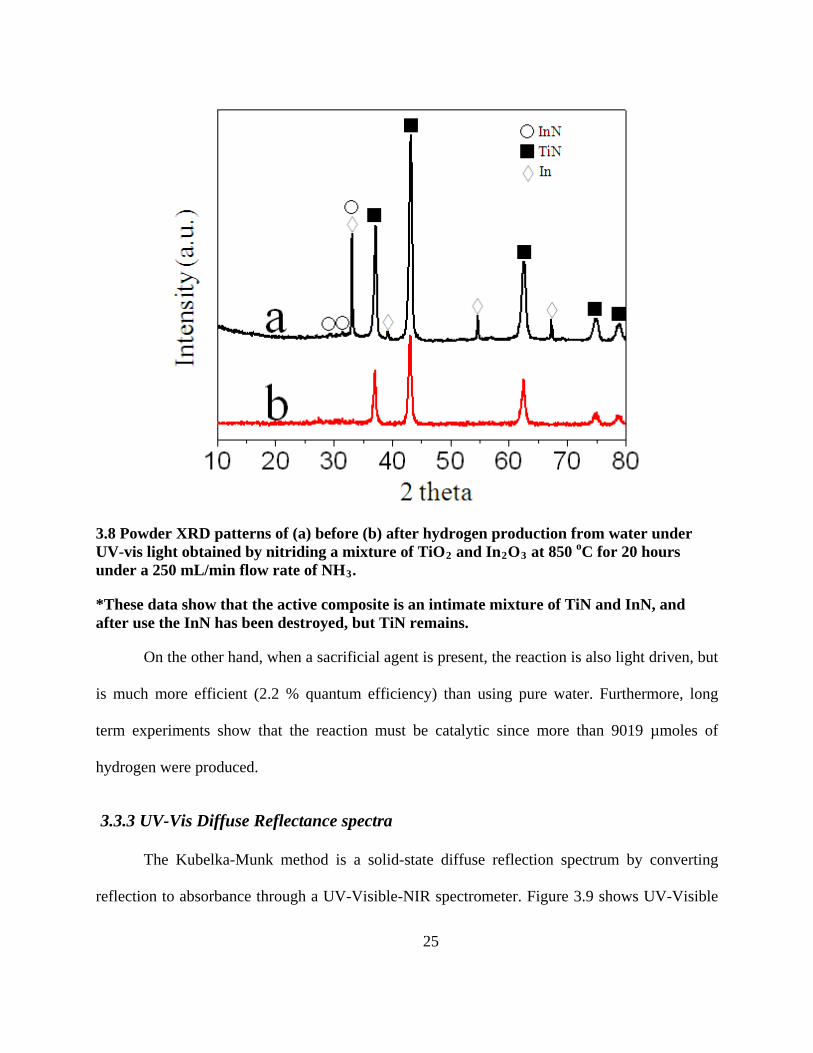
3.8 Powder XRD patterns of (a) before (b) after hydrogen production from water under UV-vis light obtained by nitriding a mixture of TiO2 and In2O3 at 850 oC for 20 hours under a 250 mL/min flow rate of NH3
*These data show that the active composite is an intimate mixture of TiN and InN, and after use the InN has been destroyed, but TiN remains.
.
On the other hand, when a sacrificial agent is present, the reaction is also light driven, but
is much more efficient (2.2 % quantum efficiency) than using pure water. Furthermore, long
term experiments show that the reaction must be catalytic since more than 9019 µmoles of
hydrogen were produced.
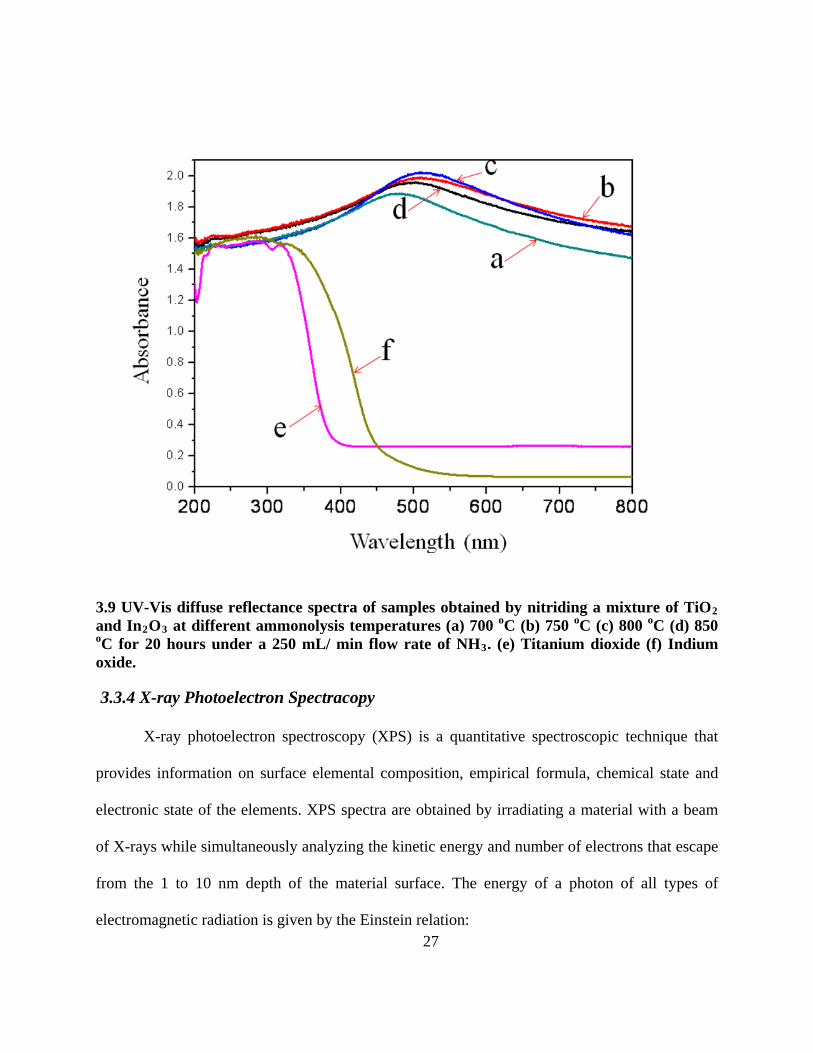
3.3.3 UV-Vis Diffuse Reflectance spectra
The Kubelka-Munk method is a solid-state diffuse reflection spectrum by converting
reflection to absorbance through a UV-Visible-NIR spectrometer. Figure 3.9 shows UV-Visible

26
diffuse reflectance spectra for solid composites prepared by 20 hours of nitriding over several
ammonolysis temperatures, along with TiO2 and In2O3
3.2 The maximum absorbance wavelength, Band Gap Energies and hydrogen production rates in pure water of Ti-In (oxy)nitride
for comparison. The UV-Visible spectra
for the nitrided catalysts show a special phenomenon of having maximum absorbance in the
visible region. Table 3.2 shows the maximum absorbance wavelength and band gap energies of
Ti-In (oxy)nitride samples prepared by different ammonolysis temperatures. It demonstrates that
the maximum absorbance can be adjusted by different synthetic methods. Based on UV-Visible
spectra, the hydrogen production is affected by total absorbance and maximum absorbance
position. The shorter the wavelength maximum, but still in the visible range, the higher the
activity (Table 3.2).
Ammonolysis
samples prepared by different ammonolysis temperatures
temperature
Surface Area
(m2/g)
Maximum
absorbance
Wavelength (nm)
Band gap (eV)
H2
700 oC
gas evolution (μmmole.h-1)
12.4 625 1.98 58
750 oC 13.5 465 2.67 59
800 oC 22 525 2.36 65
850 oC 8.5 470 2.64 73
27
3.9 UV-Vis diffuse reflectance spectra of samples obtained by nitriding a mixture of TiO2 and In2O3 at different ammonolysis temperatures (a) 700 oC (b) 750 oC (c) 800 oC (d) 850 oC for 20 hours under a 250 mL/ min flow rate of NH3
3.3.4 X-ray Photoelectron Spectracopy
. (e) Titanium dioxide (f) Indium oxide.
X-ray photoelectron spectroscopy (XPS) is a quantitative spectroscopic technique that
provides information on surface elemental composition, empirical formula, chemical state and
electronic state of the elements. XPS spectra are obtained by irradiating a material with a beam
of X-rays while simultaneously analyzing the kinetic energy and number of electrons that escape
from the 1 to 10 nm depth of the material surface. The energy of a photon of all types of
electromagnetic radiation is given by the Einstein relation:
28
E = hv (3.3)
Where h is Planck constant ( 6.62 x 10⁻³⁴ J s ) and v is frequency (Hz) of the radiation.
The sample is placed in an ultrahigh vacuum environment and photoelectron spectroscopy uses
monochromatic sources of radiation (i.e. photons of fixed energy). The x-ray photon is absorbed
by an atom in a molecule or solid, leading to the ionization and emission of a core (inner shell)
electron. The electron energy analyser records kinetic energy distribution of the emitted
photoelectrons (i.e. the number of emitted photoelectrons as a function of their kinetic energy)
resulting in a photoelectron spectrum. The spectrum represents the surface composition, which is
obtained by counting the number of photoelectrons and Auger electrons as a function of their
energy. The energy corresponding to each peak is characteristic of an element present in the
sampled volume. The spectrum peak area is a measure of the relative amount of the element. The
peak shape and precise position indicates the chemical state for the element. However, XPS is a
surface sensitive technique because only the electrons generated near the surface can escape and
are detected. Due to inelastic collisions within the sample's atomic structure, photoelectrons of
interest have relatively low kinetic energy. Those photoelectrons that originate more than 20 to
50 Å below the surface cannot escape with sufficient energy to be detected.
We have examined four areas of the XPS spectra for several samples: the Ti 2p region
(466-453 eV), In 3d region (450-454 eV), the O 1s region (525-537 eV), and the N 1s region
(394-400 eV).

29
3.3.4.1 C 1s Core Level
The survey spectra of all the Ti-In (oxy)nitride powders confirmed the presence of Ti, In,
O, N and C. The binding energies (BEs) were calibrated using the C 1s energy of 284.4 eV as an
internal calibration.
3.3.4.2 Ti 2p Core Level
The Ti 2p3/2 has three peaks (Figure 3.10A), 458.5 eV, 457 eV and 455.6 eV. Ti 2p5/2
10
has
three peaks, 463.9 eV, 462.5 eV and 461.3 eV. They are in agreement with the values reported in
the literature for Ti4+, Ti3+ and Ti2+, respectively. , 15 The XPS data show that the ammonolysis
process can reduce Ti4+ to lower oxidation states. Moreover, the low ammonolysis temperature
samples have a higher ratio of Ti4+, which shows that higher ammonia treatment temperature
causes more reduction of Ti4+ into Ti3+ or Ti2+.
Figure 3.11 shows a comparison of XPS spectra before and after the H2 production
reaction in pure water (different ammonolysis temperatures). In the Ti 2p XPS spectra, the Ti3+
or Ti2+ peaks still can be observed after the photocatalytic reaction, indicating that H2
3.3.4.3 In 3d Core Level
production
is not the result of reducing water by oxidizing Ti3+ or Ti2+ to Ti4+.
As shown in Figure 3.10B, The In core spin orbit split to the 3d5/2
9
peak at 444.5 eV.
These results are close to the reported values for bulk InN (444.3 eV). , 16 Therefore, XPS
further confirms the formation of InN.
Regarding the XPS spectra after photocatalytic reaction, In 3d3/2 XPS spectra (Figure
3.11) show loss of intensity for low ammonolysis temperature samples, which suggests that the

30
lower temperatures yield less stable nitrides. But if the ammonolysis temperature exceeds 850o C,
most of the In was sublimed and lost, and only TiN remained. The resulting sample had poor H2
production activity. Therefore, a suitable ammonolysis temperature is very important, which has
to be high enough to allow N doping, but not too high to further reduce In3+ into In metal. All In
3d3/2
XPS spectra (Figure 3.11) show the shifting to higher BE after the reaction, which indicates
that some of the doped nitrogen was replaced by oxygen.
3.10 XPS spectra of samples obtained by nitriding a mixture of TiO2 and In2O3 at different ammonolysis temperatures (a) 850 oC (b) 800 oC (c) 750 oC (d) 700 oC for 20 hours under a 250 mL/ min flow rate of NH3.
31
3.11 XPS spectra of (a) before (b) after hydrogen production from water reaction under UV-vis light for a nitrided mixture of TiO2 and In2O3 at different ammonolysis temperatures (A) 850 oC (B) 800 oC (C) 750 oC (D) 700 oC for 20 hours under a 250 mL/ min flow rate of NH3
3.3.4.4 O 1s Core Level
.
Figure 3.10C shows that the O 1s core level is composed of at least three components.
The peak positions and intensities are reliably determined by a standard curve fitting procedure
using XPSPEAKS software. The O 1s signal at 529.8 eV is assigned to In2O3 and TiO2
17according to the literature, while the signal at 530.8 eV is probably due to oxygen in surface
adsorbed hydroxyl groups18 and the signal at 532.1 eV is from the surface adsorbed H2O. Low
ammonolysis temperature samples show a small shift to lower energy (529.0 eV) for the O 1s
peak that is assigned to In2O3 and TiO2. This shift is similar to results found for substitutional
32
N-doped TiO2 samples, in which the P25 TiO2 sample shows an O 1s peak at 530.8 eV, versus a
shift to 530.0 eV that is observed for the nitrogen-doped TiO219 samples.
3.3.4.5 N 1s Core Level
The N 1s XPS spectrum in Figure 3.10D has two components: 396.9 eV and 396.2 eV.
The N 1s XPS data confirms the N is substitutional instead of interstitial. 6, 7, 20 The 396.9 eV
peak could be assigned to Ti-N, and In-N is at 396.2 eV because Ti has a higher electronegativity
than In. The XPS high-resolution spectra of N 1s show the 850 oC ammonolysis sample’s peak at
396.7 eV with a slight shift to 396.1 eV for the 700 o C sample (Figure 3.10D). The difference of
0.6 eV between these two N 1s peaks correlates with InN formation for the N 1s state in
substitutional sites. Therefore, the data (Figure 3.10D) shows more formation of N in
substitutional sites under higher ammonolysis temperature conditions.
3.3.5 Scanning Electron Microscopy
Figure 3.12 shows the SEM images of the catalyst before and after H2 production
reaction for comparison. After the loss of In, the overall morphology did not change much.
Therefore, the morphology is not the major factor that affects H2 production efficiency.
33
3.12 SEM images of synthesis Ti : In= 2 : 1, 800 oC ammonolysis 15 hours (a) before UV-vis irradiation at 15K magnification (b) after UV-vis irradiation at 15K magnification.
Brunauer, Emmett, Teller (BET) surface area
The texture of the solid-state material can be characterized by porosity, surface area, pore
volume and pore size. Porous materials can have different formations such as cavities, channels
or interstices. These pores have open and closed conditions. And open pores can have different
shapes including cylindrical, blind with one open end, inkbottle and funnel.
Porosity is the total volume compared to the apparent volume of the particles in the
powder. Pore volume is the volume of the pores in the investigated material. Pore size or pore
diameter is the distance between two opposite walls of the pore.
Pore size is an important factor for catalyst materials. The pore character depends on
different regions of the pores size: microporous (pore diameter < 2 nm), mesoporous (2 nm <
proe diameter < 50 nm) and macroporous ( pore diameter > 50 nm). The study of gas adsorption
can characterize the porosity.
Gas adsorption on the surface of the subject material can yield information on specific
surface area, total pore volume, and pore’s size distribution. The pressure of the gas controls the
surface coverage since the free and absorbed gases are in dynamic equilibrium. The fractional
34
surface coverage at different pressures and a set of temperature can give adsorption isotherms.
Therefore, surface area and porosity can be calculated by mathematical analysis of the adsorption
isothermal data. Nitrogen is a common gas used as the adsorbate since its intermediate value of
C constant (50-250) and allows calculating the cross-sectional area of and adsorbate.
The Branauer-Emmet-Teller equation 3.4 is used to determine the surface area of the
material.21
𝟏
𝑾(𝑷𝒐𝑷 −𝟏)= 𝟏
𝑾𝒎𝑪+ 𝑪−𝟏
𝑾𝒎𝑪 ( 𝑷𝑷𝒐
) (3.4)
W is the weight of the absorbed gas at relative pressure P/Po, C is a constant related to
the energy of adsorption in the first adsorbed layer, and Wm is the weight of a monolayer of
adsorbate. The total surface of the sample can be calculated by equation 3.5.
𝑺𝒕 = 𝑾𝒎𝑵𝑨𝑪𝑺𝑴
(3.5)
N is an Avogadro’s number (6.023 × 10²³ molecules/mol) and M is a molecular weight of
the adsorbate, and Acs
The specific surface area can be calculated from the total surface area and the weight of
the sample in equation 3.6.
is a cross-sectional area (16.2 Å at 77 K).
𝑺 = 𝑺𝒕𝒘
(3.6)
The total pore volume can be calculated from the amount of gas adsorbed at relative
pressure close to unity. And the pore size distribution can be calculated from the desorption
branch of the isotherm by the Kelvin equation shown in equation 3.7.
𝑹𝑲 = −𝟐𝜸𝑽𝒎𝑹𝑻𝒍𝒏( 𝑷𝑷𝒐
) (3.7)
Here, γ is a surface tension of nitrogen at the boiling point (8.85 ergs/cm2 at 77 K), Vm is
the molar volume of liquid nitrogen (34.6 cm3/mol), R is a gas constant (8.314 × 10⁷ ergs/deg
35
mol), T is a boiling point of nitrogen (77 K), P/Po is a relative pressure of nitrogen and RK
Surface information such as area and porosity can be obtained by analyzing gas
adsorption of the material. Through the introduction of a known gas volume (such as nitrogen),
then measuring the equilibrium pressure, can yield adsorption isothermal data, which is obtained
by measuring the quantities of released gas from the sample at a relative low pressure.
is
Kelvin radius of the pore.
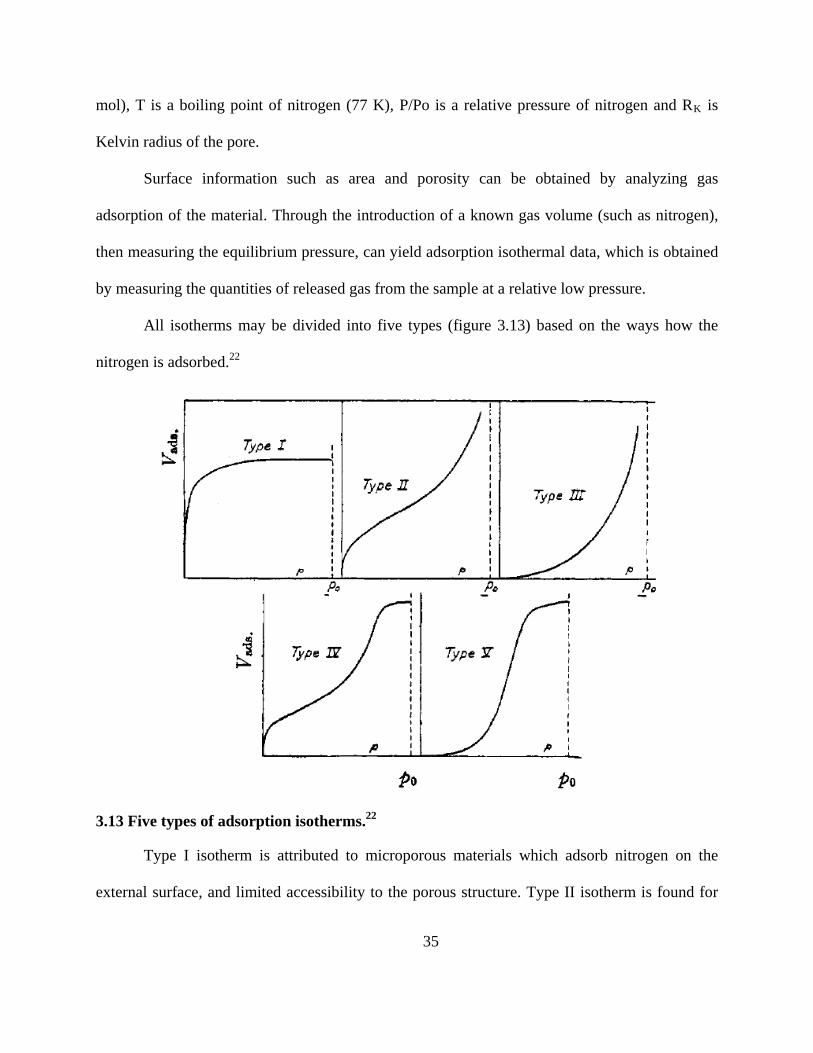
All isotherms may be divided into five types (figure 3.13) based on the ways how the
nitrogen is adsorbed.22
3.13 Five types of adsorption isotherms.22
Type I isotherm is attributed to microporous materials which adsorb nitrogen on the
external surface, and limited accessibility to the porous structure. Type II isotherm is found for
36
nonporous or macroporous materials which can absorb multilayers of nitrogen. Type III isotherm
shows which materials have less heat of adsorption than the heat of adsorbate liquefaction, with
an additional adsorption that interacts with the adsorbed layers. Type IV isotherm represents
mesoporous materials with the mesopores filled by higher elevated pressures. Type V isotherm is
similar to the type III but more common for mesoporous materials.
The adsorption and desorption branches in type I, II and III isotherms are the same and
only rarely show hysteresis. But Type IV and V isotherms have hysteresis effects between
adsorption and desorption. Most of the time, it is caused by bottleneck shape of pores materials
and differences in the meniscus of the condensing and evaporation nitrogen.23, 24
The surface area increased from 12.4 to 22 m2/g, when ammonolysis temperature
increased from 700 to 800 oC, but decreased at 850 oC (Table 3.2, page 26). Another interesting
finding was that the surface area of the Ti-In (oxy)nitride (800 oC, ammonolysis 15 hours)
increased substantially, from 42 m2/g at the start of the UV experiment, to 98 m2/g after reaction
(and loss of activity). This change in surface area/ unit mass could be due to the loss of some
Indium, as substantiated by elemental analysis results, and the formation of additional pores.
3.4 Conclusions
A novel Ti-In (oxy)nitride was prepared by nitridation of TiO2 and In2O3 under an NH3
flow of 250 mL∙min-1. This preparation of (oxy)nitride provides a new strategy to synthesize InN
at high temperature (> 700 oC). And Ti4+ could be reduced to 3+ and 2+ upon ammonia
treatment with In2O3 presence. The change in the product with nitridation temperature was
examined, and it was revealed that an active mixed nitride/oxide phase formed above 700 oC of
nitridation. However, temperature above 900 oC caused Indium metal to form, which is volatile

37
at 900 oC and was lost, resulting in mainly TiN formation, and no hydrogen evolution activity.
The XRD and XPS spectra confirmed that the prepared powders had nitrogen substituted at some
of the oxygen sites in the TiO2 and In2O3
25
. The maximum UV-Visible diffuse reflectance spectra
absorbance varied with nitridation temperature from 700 oC to 850 oC, and the oxygen 2p and
nitrogen 2p XPS spectra showed a different valance band structure. The optimum preparation
conditions for Ti-In (oxy)nitride in order to achieve high hydrogen evolution are thus considered
to be nitridation at 850 oC under NH3
Use of these materials for reaction with water to form hydrogen revealed that: (1) in the
absence of a sacrificial agent to soak up the holes of the electro-hole pair, the reaction was not
catalytic, but instead a UV and visible light driven stoichiometric reaction took place that
continued for hundreds of hours; (2) in the presence of a sacrificial agent (methanol) the reaction
did become photocatalytic and continued for hundreds of hours producing hydrogen under
visible light irradiation at a constant rate.
flow at 250 mL∙min -1. The composite produced under
these conditions minimizes Indium loss by reduction to Indium metal and subsequent
volatilization, but some Indium is retained as InN that is stabilized in the structure, and is
important in hydrogen production.
38
References
1. Osterloh, F. E., Inorganic Materials as Catalysts for Photochemical Splitting of Water. Chemistry of Materials 2007, 20, (1), 35-54.
2. Kato, H.; Asakura, K.; Kudo, A., Highly Efficient Water Splitting into H2 and O2 over Lanthanum-Doped NaTaO3
3. G. Kim, H.; W. Hwang, D.; Kim, J.; G. Kim, Y.; S. Lee, J., Highly donor-doped (110) layered perovskite materials as novel photocatalysts for overall water splitting. Chemical Communications 1999, (12), 1077-1078.
Photocatalysts with High Crystallinity and Surface Nanostructure. Journal of the American Chemical Society 2003, 125, (10), 3082-3089.
4. Sato, J.; Saito, N.; Yamada, Y.; Maeda, K.; Takata, T.; Kondo, J. N.; Hara, M.; Kobayashi, H.; Domen, K.; Inoue, Y., RuO2-Loaded β-Ge3N4
5. Maeda, K.; Takata, T.; Hara, M.; Saito, N.; Inoue, Y.; Kobayashi, H.; Domen, K., GaN:ZnO Solid Solution as a Photocatalyst for Visible-Light-Driven Overall Water Splitting. Journal of the American Chemical Society 2005, 127, (23), 8286-8287.
as a Non-Oxide Photocatalyst for Overall Water Splitting. Journal of the American Chemical Society 2005, 127, (12), 4150-4151.
6. Irie, H.; Watanabe, Y.; Hashimoto, K., Nitrogen-concentration dependence on photocatalytic activity of TiO2-xNx
7. Asahi, R.; Morikawa, T.; Ohwaki, T.; Aoki, K.; Taga, Y., Visible-light photocatalysis in nitrogen-doped titanium oxides. Science 2001, 293, (5528), 269-271.
powders. Journal of Physical Chemistry B 2003, 107, (23), 5483-5486.
8. Poznyak, S. K.; Talapin, D. V.; Kulak, A. I., Structural, Optical, and Photoelectrochemical Properties of Nanocrystalline TiO2-In2O3
9. Reyes-Gil, K. R.; Reyes-Garcia, E. A.; Raftery, D., Nitrogen-doped In
Composite Solids and Films Prepared by Sol-Gel Method. The Journal of Physical Chemistry B 2001, 105, (21), 4816-4823.
2O3
10. Schwenzer, B.; Loeffler, L.; Seshadri, R.; Keller, S.; Lange, F. F.; DenBaars, S. P.; Mishra, U. K., Preparation of indium nitride micro- and nanostructures by ammonolysis of indium oxide. Journal of Materials Chemistry 2004, 14, (4), 637-641.
thin film electrodes for photocatalytic water splitting. Journal of Physical Chemistry C 2007, 111, (39), 14579-14588.
11. Trainor, J.; Rose, K., Some properties of inn films prepared by reactive evaporation. Journal of Electronic Materials 1974, 3, (4), 821-828.
39
12. Guo, Q.; Kato, O.; Yoshida, A., Thermal stability of indium nitride single crystal films. Journal of Applied Physics 1993, 73, (11), 7969-7971.
13. Abe, R.; Sayama, K.; Sugihara, H., Development of New Photocatalytic Water Splitting into H2 and O2 using Two Different Semiconductor Photocatalysts and a Shuttle Redox Mediator IO3
14. Kudo, A.; Miseki, Y., Heterogeneous photocatalyst materials for water splitting. Chemical Society Reviews 2009, 38, (1), 253-278.
-/I-. The Journal of Physical Chemistry B 2005, 109, (33), 16052-16061.
15. Idriss, H.; Pierce, K. G.; Barteau, M. A., Synthesis of Stilbene from Benzaldehyde by Reductive Coupling on TiO2
16. Maruyama, T.; Yorozu, K.; Noguchi, T.; Seki, Y.; Saito, Y.; Araki, T.; Nanishi, Y., Surface treatment of GaN and InN using (NH
(001) Surfaces. Journal of the American Chemical Society 1994, 116, (7), 3063-3074.
4)2Sx
17. Donley, C.; Dunphy, D.; Paine, D.; Carter, C.; Nebesny, K.; Lee, P.; Alloway, D.; Armstrong, N. R., Characterization of indium-tin oxide interfaces using X-ray photoelectron spectroscopy and redox processes of a chemisorbed probe molecule: Effect of surface pretreatment conditions. Langmuir 2002, 18, (2), 450-457.
. physica status solidi (c) 2003, 0, (7), 2031-2034.
18. Asai, N.; Inoue, Y.; Sugimura, H.; Takai, O., Electrochromic Reaction of InN Thin Films. Journal of The Electrochemical Society 1999, 146, (6), 2365-2369.
19. Chen, X.; Burda, C., Photoelectron Spectroscopic Investigation of Nitrogen-Doped Titania Nanoparticles. The Journal of Physical Chemistry B 2004, 108, (40), 15446-15449.
20. Sano, T.; Negishi, N.; Koike, K.; Takeuchi, K.; Matsuzawa, S., Preparation of a visible light-responsive photocatalyst from a complex of Ti4+ with a nitrogen-containing ligand. Journal of Materials Chemistry 2004, 14, (3), 380-384.
21. Brunauer, S.; Emmett, P. H.; Teller, E., Adsorption of Gases in Multimolecular Layers. Journal of the American Chemical Society 1938, 60, (2), 309-319.
22. Brunauer, S.; Deming, L. S.; Deming, W. E.; Teller, E., On a Theory of the van der Waals Adsorption of Gases. Journal of the American Chemical Society 1940, 62, (7), 1723-1732.
23. McBain, J. W., An Explanation of Hysteresis in the Hydration and Dehydration of Gels. Journal of the American Chemical Society 1935, 57, (4), 699-700.
24. Cohan, L. H., Sorption Hysteresis and the Vapor Pressure of Concave Surfaces. Journal of the American Chemical Society 1938, 60, (2), 433-435.

40
25. Maeda, K.; Teramura, K.; Takata, T.; Hara, M.; Saito, N.; Toda, K.; Inoue, Y.; Kobayashi, H.; Domen, K., Overall Water Splitting on (Ga1-xZnx)(N1-xOx
) Solid Solution Photocatalyst: Relationship between Physical Properties and Photocatalytic Activity. The Journal of Physical Chemistry B 2005, 109, (43), 20504-20510.

41
Chapter 4 - Hydrogen from ethanol solution under UV-visible light.
Photocatalysts produced by Nitriding Titanium nitride and Indium
oxide Intimate mixtures to Form Ti-In nitride composites
Photocatalytic production of hydrogen gas from 20 % ethanol-water was accomplished
with Ti-In nitride composites. These materials were produced by nitriding a TiO2 with ammonia
at a high temperature, then adding In2O3 and further ammonolysis for different periods of time.
The catalysts were very stable and continued to produce H2 gas at 920 μmole∙h-1∙g-1 for 50 hours
and accumulated 12.8 mmole H2 gas. The water splitting photocatalytic reaction can be driven
by UV-vis light, maximum producing H2
4.1 Introduction
gas at 1277 μmole∙h -1∙g-1. It is critical that we
understand how having high, stable activity is possible. We used XPS, X-ray (XRD), UV-Vis
diffuse reflectance spectrometry, and BET surface area and pore size distribution for further
characterization.
Titanium Dioxide is a well known photocatalyst1, 2 but absorbs only in the ultraviolet
region for photochemical reactions. In order to extend the utilization of solar energy; many
approaches aim to modify the TiO2
3
to enhance visible light application. One way is to substitute
Cr, Fe or Ni for Ti. , 4 Such substitution could improve TiO2 absorption into the visible light
region (> 450 nm) and those catalysts demonstrated photocatalytic activity to decompose NO
into N2, O2 and N24O. Another approach is to create Ti3+ sites by introducing oxygen vacancies
in TiO25. And it is also reported that by doping NH4Cl or NH4OH into TiO2, the TiO2
6
can be
sensitive to visible light. Moreover, Hashimoto has reported a nitrogen-doped TiO2 by
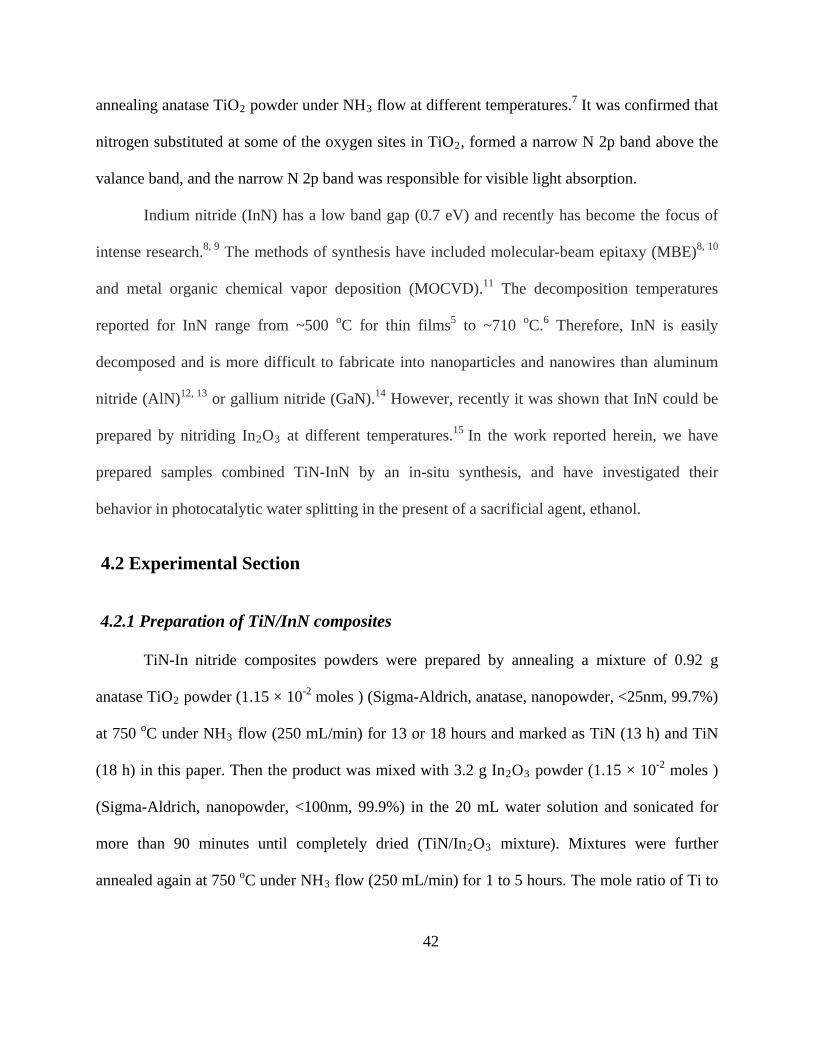
42
annealing anatase TiO2 powder under NH37 flow at different temperatures. It was confirmed that
nitrogen substituted at some of the oxygen sites in TiO2
Indium nitride (InN) has a low band gap (0.7 eV) and recently has become the focus of
intense research.
, formed a narrow N 2p band above the
valance band, and the narrow N 2p band was responsible for visible light absorption.
8, 9 The methods of synthesis have included molecular-beam epitaxy (MBE)8, 10
and metal organic chemical vapor deposition (MOCVD).11 The decomposition temperatures
reported for InN range from ~500 oC for thin films5 to ~710 oC.6 Therefore, InN is easily
decomposed and is more difficult to fabricate into nanoparticles and nanowires than aluminum
nitride (AlN)12, 13 or gallium nitride (GaN).14 However, recently it was shown that InN could be
prepared by nitriding In2O315 at different temperatures. In the work reported herein, we have
prepared samples combined TiN-InN by an in-situ synthesis, and have investigated their
behavior in photocatalytic water splitting in the present of a sacrificial agent, ethanol.
4.2 Experimental Section
4.2.1 Preparation of TiN/InN composites
TiN-In nitride composites powders were prepared by annealing a mixture of 0.92 g
anatase TiO2 powder (1.15 × 10⁻² moles ) (Sigma-Aldrich, anatase, nanopowder, <25nm, 99.7%)
at 750 oC under NH3 flow (250 mL/min) for 13 or 18 hours and marked as TiN (13 h) and TiN
(18 h) in this paper. Then the product was mixed with 3.2 g In2O3 powder (1.15 × 10⁻² moles )
(Sigma-Aldrich, nanopowder, <100nm, 99.9%) in the 20 mL water solution and sonicated for
more than 90 minutes until completely dried (TiN/In2O3 mixture). Mixtures were further
annealed again at 750 oC under NH3 flow (250 mL/min) for 1 to 5 hours. The mole ratio of Ti to

43
In in the starting material (TiO2 and In2O3) was 1/1. In all of the ammonolysis procedures, the
samples were finally cooled to room temperature under NH3
4.2.2Characterization of Catalysts
flow.
The prepared samples were studied by powder X-ray diffraction (XRD; Bruker D8 X-ray
diffractometer with Cu Kα radiation), scanning electron microscopy (SEM; Hitachi S-3500 N),
UV-visible diffuse reflectance spectroscopy (DRS; Varian Cary 500 Scan). The Brunauer,
Emmett, Teller (BET) surface areas were measured with a Quantachrome NOVA-1200
instrument at liquid nitrogen temperature. X-ray photoelectron spectroscopy (XPS); a SPECS
Sage100 spectrometer was used operating in the fixed analyzer transmission mode using
achromatic Mg Kα (1253.6 eV) radiation at 240 W (12 kV and 20 mA) using a water-cooled X-
ray gun cap and evacuated with turbomolecular pumping. The base pressure of the chamber was
about 2 × 10⁻⁸ Torr, and the energy scales were calibrated using copper and the separation
between photoelectron peaks generated by Mg and Al Kα X-rays. Survey spectra were collected
with a pass energy of 30 eV; a pass energy of 15 eV was used for both core and valence band
spectra. Many of the spectra were calibrated by taking the C 1s peak due to residual hydrocarbon
as being at 284.4 eV.
4.2.3 Photocatalytic Reactions
The reactions were carried out in a glass-enclosed reaction chamber connected to a gas
circulation and evacuation system with a quartz inner irradiation-type reaction vessel. The
reaction was performed in a 345 ml 20 % ethanol solution and containing 0.3 g of the composite
catalyst sample. The reactant solution was evacuated and filled with argon 3 times to remove air
completely, followed by irradiation under a 450 W high-pressure Hg lamp. H2 production was

44
monitored during the reaction with an online GC system (GOMAC model) employing a Supelco
molecular 80/100 sieve 5A column with Ar as the carrier gas and a thermal conductivity detector
(TCD).
4.3 Results and Discussion
4.3.1 Dependence of Photocatalytic Activity on Ammonolysis time
Figure 4.1 shows the water splitting reactivity results of the photocatalysis in 20%
ethanol solution under UV-vis light. Nitridation of the TiN/In2O3 sample for one hour produced
a catalyst with very good stability for producing H2 gas at 839 μmol.h-1.g-1. As the nitridation
time increased to 3 h, the sample was less stable. Interestingly, the water splitting activity
increased with time, and leveled off at about 920 to 950 μmol.h-1.g-1 in trail after trial of
different samples made under the same conditions. This was also true of the 5 h sample. Indeed,
after the fourth trial a steady activity of 1080 μmol.h-1.g-1 was achieved and remained stable
for more than 50 h of reaction (figure 4.2). The total amount of H2 gas evolved over 50 h under
UV-Visible irradiation of the nitridation 3 h sample was 12.8 mmole, much greater than the
amount of catalyst employed; hence, proving that the H2 gas generation is not a stoichiometric
reaction. In order to compare the activity without adding In2O3, figure 4.3 shows the
photoactivity of TiN (18 h). Every 5 hours water splitting reaction time, the glass-enclosed
system was evacuated and refilled with the argon gas, then restarted using by the same sample.
The sample was tested for 15 hours, and did not have a very good performance and was quite
unstable.
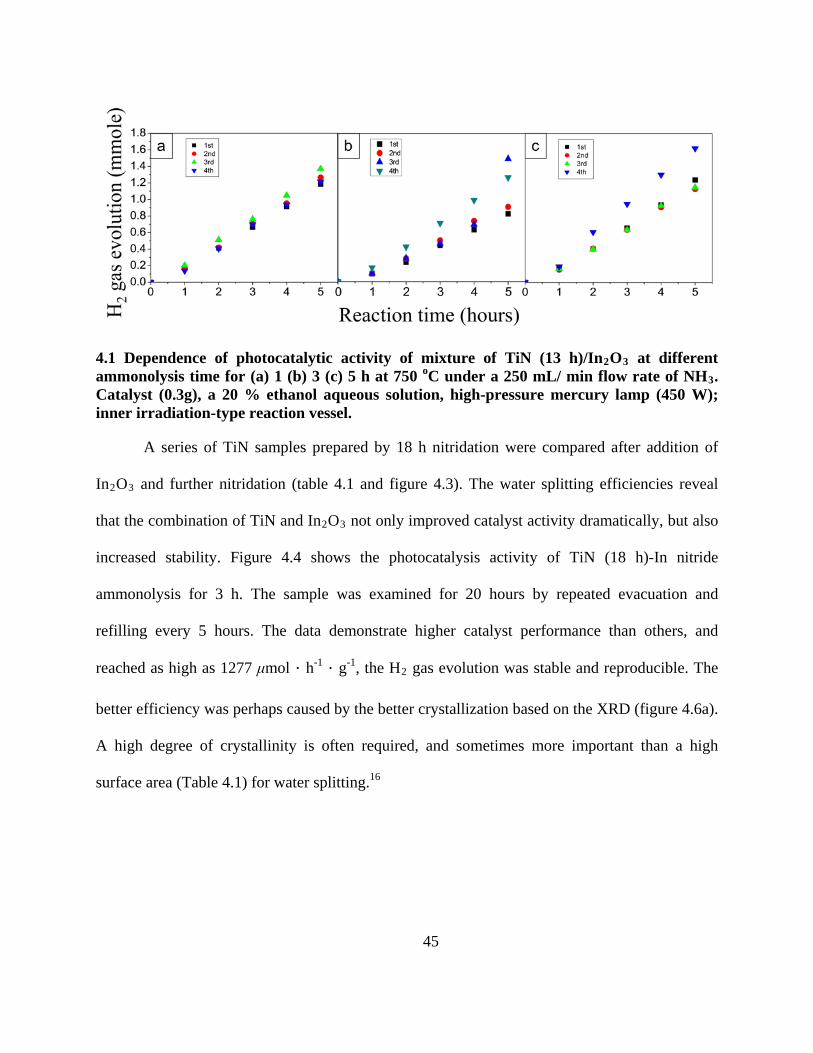
45
4.1 Dependence of photocatalytic activity of mixture of TiN (13 h)/In2O3 at different ammonolysis time for (a) 1 (b) 3 (c) 5 h at 750 oC under a 250 mL/ min flow rate of NH3
A series of TiN samples prepared by 18 h nitridation were compared after addition of
In
. Catalyst (0.3g), a 20 % ethanol aqueous solution, high-pressure mercury lamp (450 W); inner irradiation-type reaction vessel.
2O3 and further nitridation (table 4.1 and figure 4.3). The water splitting efficiencies reveal
that the combination of TiN and In2O3 not only improved catalyst activity dramatically, but also
increased stability. Figure 4.4 shows the photocatalysis activity of TiN (18 h)-In nitride
ammonolysis for 3 h. The sample was examined for 20 hours by repeated evacuation and
refilling every 5 hours. The data demonstrate higher catalyst performance than others, and
reached as high as 1277 μmol.h-1.g-1, the H2
16
gas evolution was stable and reproducible. The
better efficiency was perhaps caused by the better crystallization based on the XRD (figure 4.6a).
A high degree of crystallinity is often required, and sometimes more important than a high
surface area (Table 4.1) for water splitting.

46
4.2 Dependence of photocatalytic activity of mixture of TiN (13 h)/In2O3 futher ammonolysis for 3 h at 750 oC under a 250 mL/ min flow rate of NH3
4.1 BET and Photocatalystic activities of TiN/In
. Catalyst (0.3g), a 20 % ethanol aqueous solution, high-pressure mercury lamp (450 W); inner irradiation-type reaction vessel.
2O3
Catalyst
with various nitridation times under UV -Visible irradiation in 20 % ethanol solution
Nitridation time (hours)
H2 Surface Area gas evolution photocatalytic activity
(μmol.h-1.g-1) (m2/g)
TiN (18 h) 18 147
TiN(13 h)-In nitride 1 839 2.0
TiN(13 h)-In nitride 3 749 2.4
TiN(13 h)-In nitride 5 855 4.5
TiN(18 h)-In nitride 3 1277 4.6

47
4.3 Dependence of photocatalytic activity of TiO2 nitridation 18 h under a 250 mL/ min flow rate of NH3
*Every 5 hours water splitting reaction time, the glass-enclosed system was evacuated and refilled with the argon gas, then restarted using by the same sample. The procedures were repeated for 3 times.
. Catalyst (0.3g), a 20 % ethanol aqueous solution, high-pressure mercury lamp (450 W); inner irradiation-type reaction vessel.
4.4 Dependence of photocatalytic activity of nitridation TiN (18 h)/In2O3 3 h at 750 oC under a 250 mL/ min flow rate of NH3. Catalyst (0.3g), a 20 % ethanol aqueous solution, high-pressure mercury lamp (450 W); inner irradiation-type reaction vessel.
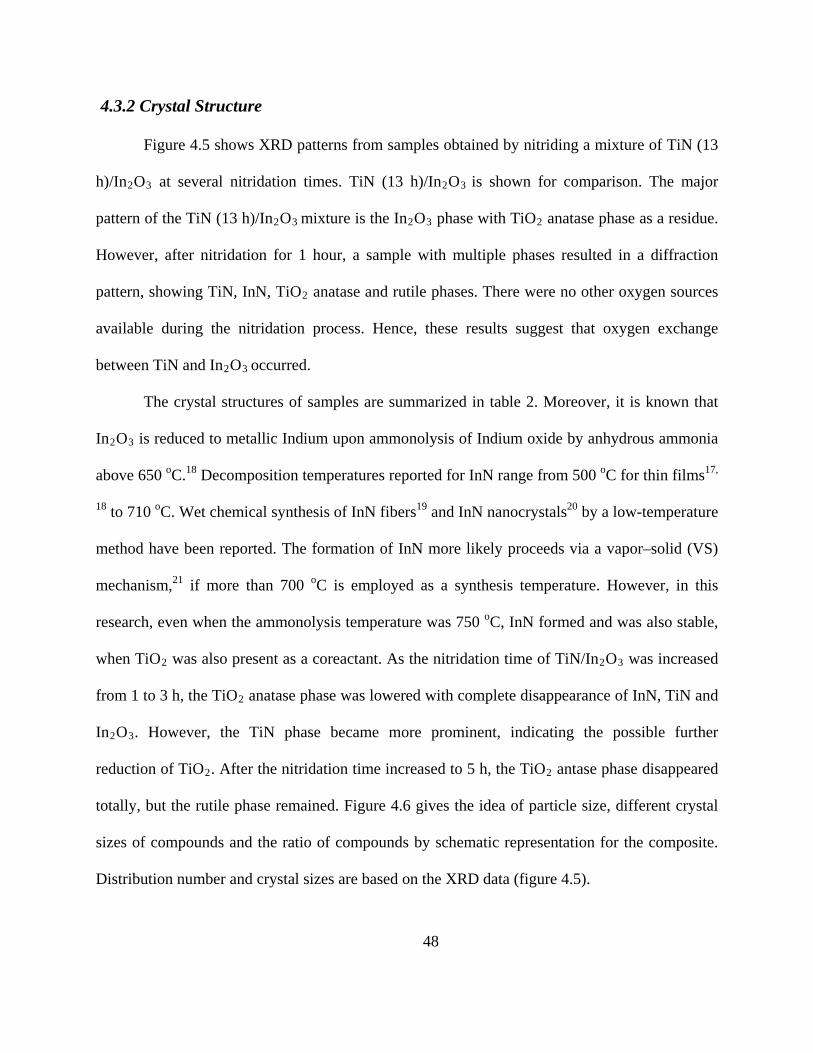
48
4.3.2 Crystal Structure
Figure 4.5 shows XRD patterns from samples obtained by nitriding a mixture of TiN (13
h)/In2O3 at several nitridation times. TiN (13 h)/In2O3 is shown for comparison. The major
pattern of the TiN (13 h)/In2O3 mixture is the In2O3 phase with TiO2 anatase phase as a residue.
However, after nitridation for 1 hour, a sample with multiple phases resulted in a diffraction
pattern, showing TiN, InN, TiO2 anatase and rutile phases. There were no other oxygen sources
available during the nitridation process. Hence, these results suggest that oxygen exchange
between TiN and In2O3
The crystal structures of samples are summarized in table 2. Moreover, it is known that
In
occurred.
2O3
17
is reduced to metallic Indium upon ammonolysis of Indium oxide by anhydrous ammonia
above 650 oC.18 Decomposition temperatures reported for InN range from 500 oC for thin films ,
18 to 710 oC. Wet chemical synthesis of InN fibers19 and InN nanocrystals20 by a low-temperature
method have been reported. The formation of InN more likely proceeds via a vapor–solid (VS)
mechanism,21 if more than 700 oC is employed as a synthesis temperature. However, in this
research, even when the ammonolysis temperature was 750 oC, InN formed and was also stable,
when TiO2 was also present as a coreactant. As the nitridation time of TiN/In2O3 was increased
from 1 to 3 h, the TiO2 anatase phase was lowered with complete disappearance of InN, TiN and
In2O3. However, the TiN phase became more prominent, indicating the possible further
reduction of TiO2. After the nitridation time increased to 5 h, the TiO2 antase phase disappeared
totally, but the rutile phase remained. Figure 4.6 gives the idea of particle size, different crystal
sizes of compounds and the ratio of compounds by schematic representation for the composite.
Distribution number and crystal sizes are based on the XRD data (figure 4.5).
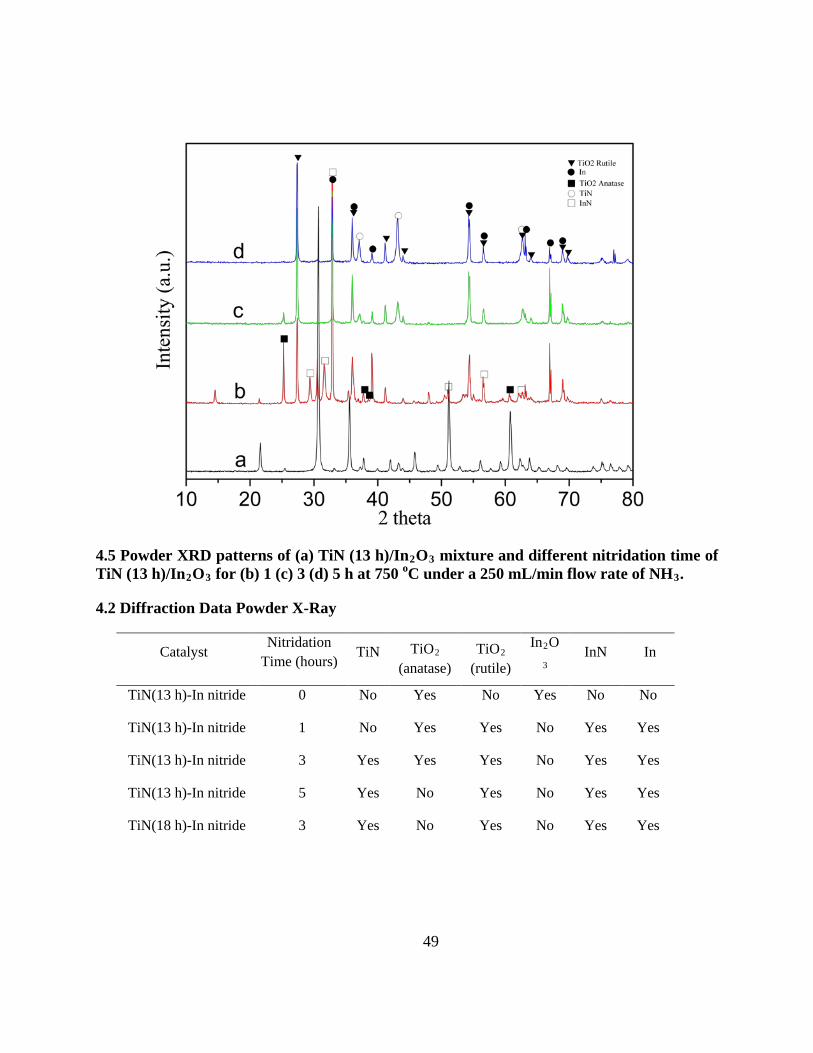
49
4.5 Powder XRD patterns of (a) TiN (13 h)/In2O3 mixture and different nitridation time of TiN (13 h)/In2O3 for (b) 1 (c) 3 (d) 5 h at 750 oC under a 250 mL/min flow rate of NH3
4.2 Diffraction Data Powder X-Ray
.
Catalyst Nitridation
Time (hours) TiN TiO
(anatase) 2 TiO
(rutile) 2 In2O
InN 3
In
TiN(13 h)-In nitride 0 No Yes No Yes No No
TiN(13 h)-In nitride 1 No Yes Yes No Yes Yes
TiN(13 h)-In nitride 3 Yes Yes Yes No Yes Yes
TiN(13 h)-In nitride 5 Yes No Yes No Yes Yes
TiN(18 h)-In nitride 3 Yes No Yes No Yes Yes

50
Figure 4.7 shows XRD patterns of TiN (13 h)/In2O3, TiN (18 h)/In2O3, TiN (13 h)-In
nitride and TiN (18 h)-In nitride. TiN(13 h)/In2O3 and TiN(18 h)/In2O3 are identical in patterns,
with the In2O3 phase as major with TiO2 anatase phase as minor. After further nitridation for 3 h
the two nitride samples both show the arising of the TiO2 rutile phase. However, TiN (13 h)-In
nitride has more TiO2 anatase phase, and TiN (18 h)-In nitride has more In and InN phases. The
crystallization conditions of these two samples are different. The full width at half maximum
(FWHM) of TiN (18 h)-In nitride is 0.2 degree, and TiN (13 h)-In nitride is 0.3 degree. This
indicates that the nitridation time of TiO2 can affect the interaction between TiN and In2O3
,
resulting in various crystal phase compositions.
4.6 Schematic representation showing the particle size, different crystal sizes of compounds and the ratio of compounds for the composite. Distribution number and crystal sizes are based on the XRD data (figure 4.5).
Figure 4.8 shows the XRD patterns before and after water splitting reaction. The patterns
are almost the same after 20 h of reaction time, indicating the stability of the catalyst.

51
4.7 Powder XRD patterns of (a) TiN (18 h)-In nitride ammonolysis 3 h (b) TiN (13 h)-In nitride ammonolysis 3 h (c) TiN (13 h)/In2O3 mixture (d) TiN (18 h)/In2O3 mixture.

52
4.8 Powder XRD patterns of TiN (13 h)/In2O3 mixture nitridation 1 h at 750 oC under a 250 mL/min flow rate of NH3
4.3.3 UV-Visible Diffuse Reflectance Spectra
(a) before (b) after water splitting reaction.
Figure 4.9 shows UV-Visible diffuse reflectance spectra of different TiN (13 h)-In nitride
samples along with In2O3, TiN (13 h), TiN (18 h)/In2O3 mixture and TiN (13 h)/In2O3 mixture
for comparison. In2O3 and TiO2 are wide band gap materials with band gaps of 2.8 and 3.2 eV,
respectively. As nitridation time increases from 1 to 5 hours, the absorption of visible light of
each sample increased (>400 nm). The color of the specimens changed from gray to black by
different nitridation time, also the absorption edge of each sample shifted slightly to longer
wavelength (table 4.3), and exhibited a broad absorption extending well into the visible region.
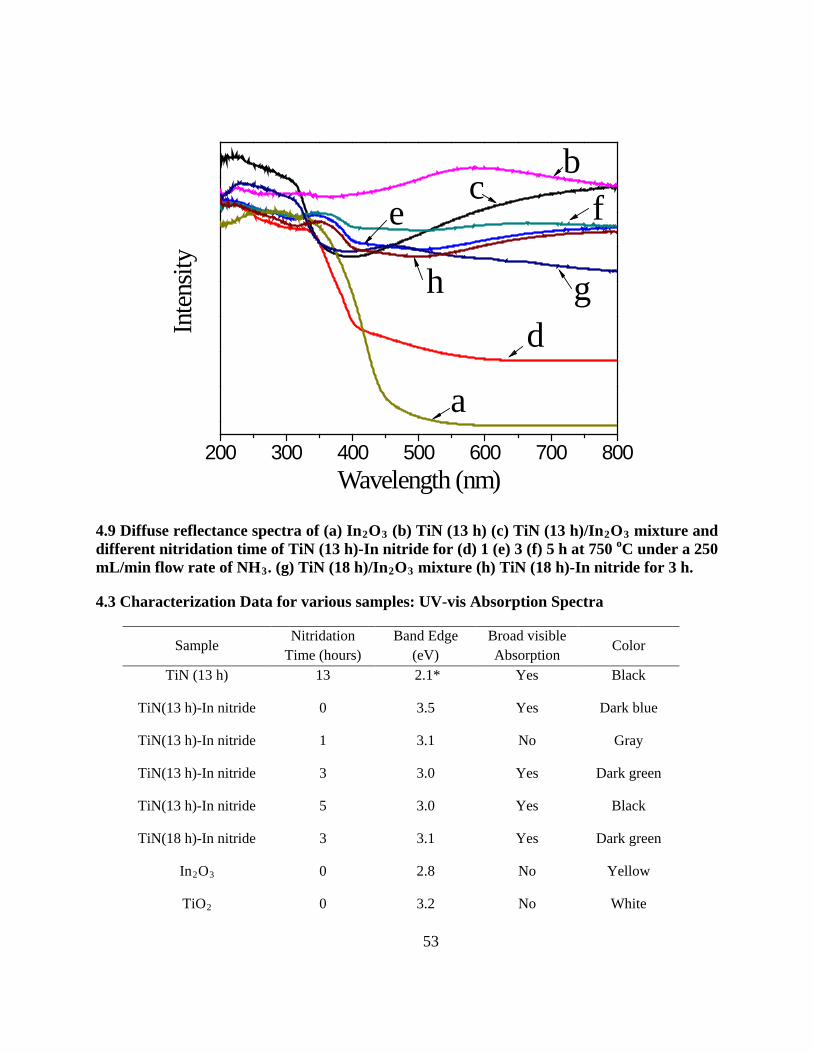
53
200 300 400 500 600 700 800
h g
fe
d
cb
Inten
sity
Wavelength (nm)
a
4.9 Diffuse reflectance spectra of (a) In2O3 (b) TiN (13 h) (c) TiN (13 h)/In2O3 mixture and different nitridation time of TiN (13 h)-In nitride for (d) 1 (e) 3 (f) 5 h at 750 oC under a 250 mL/min flow rate of NH3. (g) TiN (18 h)/In2O3
4.3 Characterization Data for various samples: UV-vis Absorption Spectra
mixture (h) TiN (18 h)-In nitride for 3 h.
Sample Nitridation
Time (hours) Band Edge
(eV) Broad visible Absorption
Color
TiN (13 h) 13 2.1* Yes Black
TiN(13 h)-In nitride 0 3.5 Yes Dark blue
TiN(13 h)-In nitride 1 3.1 No Gray
TiN(13 h)-In nitride 3 3.0 Yes Dark green
TiN(13 h)-In nitride 5 3.0 Yes Black
TiN(18 h)-In nitride 3 3.1 Yes Dark green
In2O 0 3 2.8 No Yellow
TiO 0 2 3.2 No White
54
4.3.4 SEM Observations
The morphologies of the prepared samples were observed by SEM. Figure 4.10 shows
SEM images of TiN (13 h)/In2O3 and TiN (18 h)/In2O3 mixtures and their further nitridation
(various times) samples. The information of particle size and morphology are collected into table
4. Two of the samples have smaller size and spherical-like particles. After further nitridation for
1 h, the TiN (13 h)-In nitride particle size increased. As the nitridation time increased to 3 h and
5 h, the morphology changed and turned into a layered structure. Moreover, nitridation 5 h TiN
(13 h)-In nitride yielded more cubic architecture with sharper edges, similar to the 3 h TiN (13
h)-In sample (figure 10c). The SEM revealed that mixing with In2O3 resulting in morphology
change and size increase. But after mixing with In2O3 and ammonolysis for only 1 h, the
morphology and size had changed. Therefore, the SEM images also show that the interaction
between TiN and In2O3 causes a change in morphology.

55
4.10 SEM images of (a) TiN (13 h)/In2O3 mixture and different nitridation time of TiN (13 h)-In nitride for (b) 1 (c) 3 (d) 5 h at 750 oC under a 250 mL/min flow rate of NH3. (e) TiN (18 h)/In2O3
4.3.5 X-ray Photoelectron Spectra
mixture (f) TiN (18 h)-In nitride ammonolysis 3 h.
We have examined four areas of the XPS spectra for several samples: the Ti 2p region
(466-453 eV), In 3d region (450-454 eV), the O 1s region (525-537 eV), and the N 1s region
(394-400 eV).
56
4.3.5.1 C 1s Core Level
The survey spectra of all the Ti-In nitride powders confirmed the presence of Ti, In, O, N
and C. The binding energies (BEs) were calibrated using the C 1s energy of 284.4 eV as an
internal calibration.
4.3.5.2 Ti 2p Core Level
The Ti 2p peak (figure 4.11A), 457.85 eV is in good agreement with the value reported in
the literature for N-doped TiO222. The XPS data shows that the ammonolysis process can cause
the BE to shift to lower values with increased nitridation time. The XPS data are consistent with
the XRD results. The Ti in TiN/In2O3 mixture had more N-doped in the beginning, after 1 h
further nitridation of the mixture, the Ti scavenged oxygen from In2O3 as the TiO2
4.3.5.3 In 3d Core Level
anatase phase
increased (as shown in the XRD pattern figure 4.5b); thus, the peak shifted to higher BE. As the
nitridation time increased to 3 h, more N atoms were doped into the system. The peak shifted to
lower BE again, when the nitridation time increased.
As shown in figure 4.11B, the In 3d peak of the TiN(13 h)/In2O3 mixture appears at
451.5 eV, and is very similar to the value of commercial In2O322. And the longer ammonolysis
time samples show a shift to a lower BE. This BE shift suggests a reduction of the In cation
valence state. This situation has been seen in In bonding to oxygen in In2O3
23
that results in a
higher BE than In bonding to nitrogen in InN. This is also consistent for TiO2 and
substitutional N-doped TiO2
24
, in which the lower BE of the Ti 2p peak after nitrogen treatment
can be attributed to nitrogen substitutional doping. , 25 Therefore, we can conclude that this
lower BE shift suggests that N-substitution modifies the electronic interaction of In with the
57
oxygen anions.25 As N is less electron negative than O, the electron density around the anions
decreases, increasing the electron density around the cations and caused the BE shift.25
4.3.5.4 O 1s Core Level
Figure 4.11D shows that the O 1s core level is composed of at least three components.
The peak positions and intensities are reliably determined by a standard curve fitting procedure
using XPSPEAKS software. The O 1s signal at 529.8 eV is assigned to metal oxide according to
the literature,26 while the signal at 530.8 eV is probably due to oxygen in surface adsorbed
hydroxyl groups27 and the signal at 532.1 eV is from the surface adsorbed H2
4.3.5.5 N 1s Core Level
O.
The N 1s XPS spectrum in figure 11C has the peak position at 395.4 eV. In the report,23
if the In2O3
28
was doped by ethyenediamine, which was described as substitutional doping, the N
1s peak is ~398 eV. The big difference of 2.6 eV between these two N 1s peaks correlates with
the theoretical calculations of the relative values for the N 1s state in substitutional versus
interstitial sites with a higher core level BE for the interstitial site. Therefore, the N 1s XPS
data confirms the N is substitutional instead of interstitial doping.
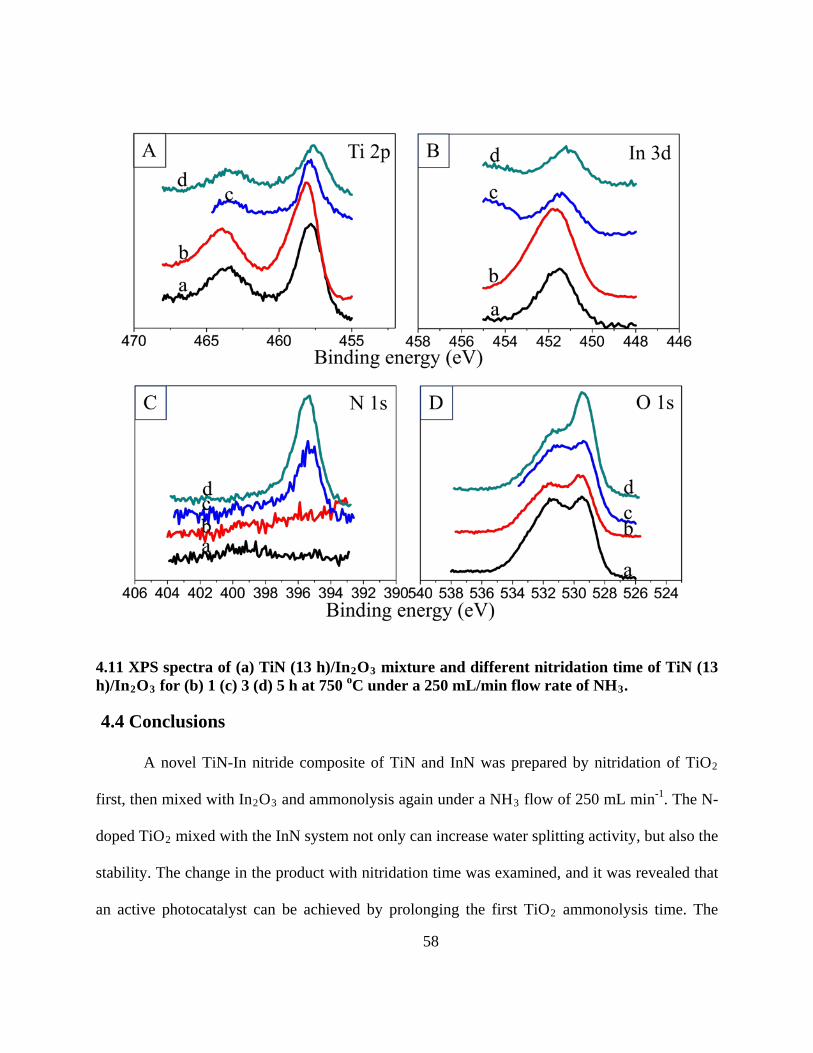
58
4.11 XPS spectra of (a) TiN (13 h)/In2O3 mixture and different nitridation time of TiN (13 h)/In2O3 for (b) 1 (c) 3 (d) 5 h at 750 oC under a 250 mL/min flow rate of NH3
4.4 Conclusions
.
A novel TiN-In nitride composite of TiN and InN was prepared by nitridation of TiO2
first, then mixed with In2O3 and ammonolysis again under a NH3 flow of 250 mL min-1. The N-
doped TiO2 mixed with the InN system not only can increase water splitting activity, but also the
stability. The change in the product with nitridation time was examined, and it was revealed that
an active photocatalyst can be achieved by prolonging the first TiO2 ammonolysis time. The
59
XRD and XPS spectra confirmed that the prepared powders had nitrogen substituted at some of
the oxygen sites in the TiO2 and In2O3
29
. The UV-Visible diffuse reflectance spectra absorbance
varied with nitridation time from 1 to 5 h, whereas the oxygen 2p and nitrogen 2p electrons
content changed and resulted in different valance band structure. The optimum preparation
conditions for TiN-In nitride in order to achieve high photocatalytic activity for water splitting
are thus considered to be nitridation at 750 oC under NH3 flow at 250 mL min-1 TiO2 for 18 h
then adding In2O3, and further nitriding 3 h. The produced catalyst under these conditions has
high crystallinity, which was achieved by complete reaction between starting materials, and the
catalyst can stably generate H2 gas maximum at 1277 μmol.h-1.g-1.
60
References
1. Heller, A., Chemistry and Applications of Photocatalytic Oxidation of Thin Organic Films. Accounts of Chemical Research 1995, 28, (12), 503-508.
2. Linsebigler, A. L.; Lu, G.; Yates, J. T., Photocatalysis on TiO2 Surfaces: Principles, Mechanisms, and Selected Results. Chemical Reviews 1995, 95, (3), 735-758.
3. Borgarello, E.; Kiwi, J.; Graetzel, M.; Pelizzetti, E.; Visca, M., Visible light induced water cleavage in colloidal solutions of chromium-doped titanium dioxide particles. Journal of the American Chemical Society 1982, 104, (11), 2996-3002.
4. Yamashita, H.; Ichihashi, Y.; Takeuchi, M.; Kishiguchi, S.; Anpo, M., Characterization of metal ion-implanted titanium oxide photocatalysts operating under visible light irradiation. Journal of Synchrotron Radiation 1999, 6, (3), 451-452.
5. Nakamura, I.; Negishi, N.; Kutsuna, S.; Ihara, T.; Sugihara, S.; Takeuchi, E., Role of oxygen vacancy in the plasma-treated TiO2
6. Sato, S., Photocatalytic activity of NOx-doped TiO2 in the visible light region. Chemical Physics Letters 1986, 123, (1-2), 126-128.
photocatalyst with visible light activity for NO removal. Journal of Molecular Catalysis a-Chemical 2000, 161, (1-2), 205-212.
7. Irie, H.; Watanabe, Y.; Hashimoto, K., Nitrogen-concentration dependence on photocatalytic activity of TiO2-xNx
8. Yu, J. C.; Yu; Ho; Jiang; Zhang, Effects of F- Doping on the Photocatalytic Activity and Microstructures of Nanocrystalline TiO2 Powders. Chemistry of Materials 2002, 14, (9), 3808-3816.
powders. Journal of Physical Chemistry B 2003, 107, (23), 5483-5486.
9. Wu, J.; Walukiewicz, W.; Shan, W.; Yu, K. M.; Ager, J. W.; Haller, E. E.; Lu, H.; Schaff, W. J., Effects of the narrow band gap on the properties of InN. Physical Review B 2002, 66, (20), 201403.
10. Wu, J.; Walukiewicz, W.; Yu, K. M.; Ager Iii, J. W.; Haller, E. E.; Lu, H.; Schaff, W. J.; Saito, Y.; Nanishi, Y., Unusual properties of the fundamental band gap of InN. Applied Physics Letters 2002, 80, (21), 3967-3969.
11. Matsuoka, T.; Okamoto, H.; Nakao, M.; Harima, H.; Kurimoto, E., Optical bandgap energy of wurtzite InN. Applied Physics Letters 2002, 81, (7), 1246-1248.
12. Faulhaber, S.; Loeffler, L.; Hu, J.; Kroke, E.; Riedel, R.; Lange, F. F., Synthesis of nanocrystalline aluminum-gallium nitride (A1(x)Ga(1-x)N; x=0.1 to 0.5) with oxide precursors via ammonolysis. Journal of Materials Research 2003, 18, (10), 2350-2358.

61
13. Kroke, E.; Loeffler, L.; Lange, F. F.; Riedel, R., Aluminum nitride prepared by nitridation of aluminum oxide precursors. Journal of the American Ceramic Society 2003, 85, (12), 3117-3119.
14. Kisailus, D.; Choi, J. H.; Lange, F. F., GaN nanocrystals from oxygen and nitrogen-based precursors. Journal of Crystal Growth 2003, 249, (1-2), 106-120.
15. Schwenzer, B.; Loeffler, L.; Seshadri, R.; Keller, S.; Lange, F. F.; DenBaars, S. P.; Mishra, U. K., Preparation of indium nitride micro- and nanostructures by ammonolysis of indium oxide. Journal of Materials Chemistry 2004, 14, (4), 637-641.
16. Kudo, A.; Miseki, Y., Heterogeneous photocatalyst materials for water splitting. Chemical Society Reviews 2009, 38, (1), 253-278.
17. Trainor, J. W.; Rose, K., Some Properties of InN Films Prepared by Reactive Evaporation. Journal of Electronic Materials 1974, 3, (4), 821-828.
18. Guo, Q.; Kato, O.; Yoshida, A., Thermal-stability of Indium Nitride Single-crystal Films. Journal of Applied Physics 1993, 73, (11), 7969-7971.
19. Dingman, S. D.; Rath, N. P.; Markowitz, P. D.; Gibbons, P. C.; Buhro, W. E., Low-Temperature, Catalyzed Growth of Indium Nitride Fibers from Azido-Indium Precursors. Angewandte Chemie International Edition 2000, 39, (8), 1470-1472.
20. Xiao, J. P.; Xie, Y.; Tang, R.; Luo, W., Benzene thermal conversion to nanocrystalline indium nitride from sulfide at low temperature. Inorganic Chemistry 2003, 42, (1), 107-111.
21. Levitt, A. P., Whisker technology. Wiley-Interscience: New York,, 1970; p xii, 478 p.
22. Reyes-Gil, K. R.; Reyes-Garcia, E. A.; Raftery, D., Nitrogen-doped In2O3
23. Lee, I. J.; Kim, J. Y.; Shin, H. J.; Kim, H. K., Near-edge x-ray absorption fine structure and x-ray photoemission spectroscopy study of the InN epilayers on sapphire(0001) substrate. Journal of Applied Physics 2004, 95, (10), 5540-5544.
thin film electrodes for photocatalytic water splitting. Journal of Physical Chemistry C 2007, 111, (39), 14579-14588.
24. Chen, X.; Burda, C., Photoelectron Spectroscopic Investigation of Nitrogen-Doped Titania Nanoparticles. The Journal of Physical Chemistry B 2004, 108, (40), 15446-15449.
25. Sathish, M.; Viswanathan, B.; Viswanath, R. P.; Gopinath, C. S., Synthesis, characterization, electronic structure, and photocatalytic activity of nitrogen-doped TiO2 nanocatalyst. Chemistry of Materials 2005, 17, (25), 6349-6353.
62
26. Donley, C.; Dunphy, D.; Paine, D.; Carter, C.; Nebesny, K.; Lee, P.; Alloway, D.; Armstrong, N. R., Characterization of indium-tin oxide interfaces using X-ray photoelectron spectroscopy and redox processes of a chemisorbed probe molecule: Effect of surface pretreatment conditions. Langmuir 2002, 18, (2), 450-457.
27. Asai, N.; Inoue, Y.; Sugimura, H.; Takai, O., Electrochromic Reaction of InN Thin Films. Journal of The Electrochemical Society 1999, 146, (6), 2365-2369.
28. Di Valentin, C.; Pacchioni, G.; Selloni, A.; Livraghi, S.; Giamello, E., Characterization of Paramagnetic Species in N-Doped TiO2
29. Maeda, K.; Takata, T.; Hara, M.; Saito, N.; Inoue, Y.; Kobayashi, H.; Domen, K., GaN:ZnO Solid Solution as a Photocatalyst for Visible-Light-Driven Overall Water Splitting. Journal of the American Chemical Society 2005, 127, (23), 8286-8287.
Powders by EPR Spectroscopy and DFT Calculations. The Journal of Physical Chemistry B 2005, 109, (23), 11414-11419.
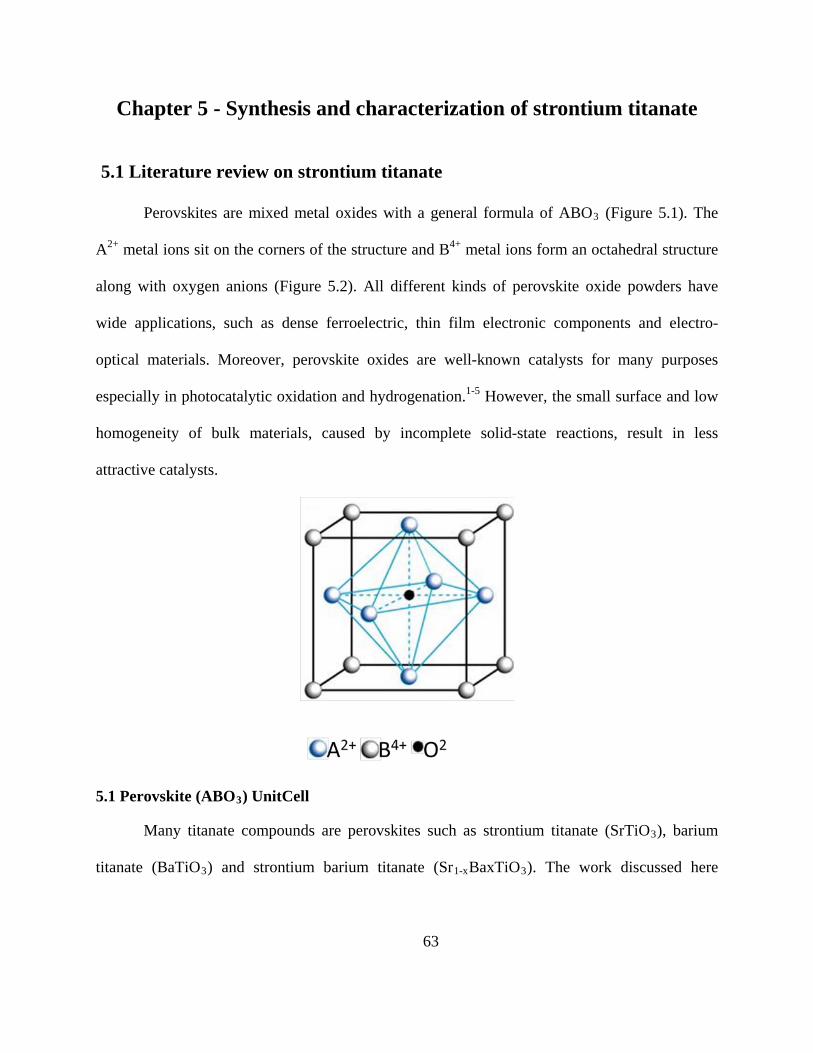
63
Chapter 5 - Synthesis and characterization of strontium titanate
5.1 Literature review on strontium titanate
Perovskites are mixed metal oxides with a general formula of ABO3
1-5
(Figure 5.1). The
A2+ metal ions sit on the corners of the structure and B4+ metal ions form an octahedral structure
along with oxygen anions (Figure 5.2). All different kinds of perovskite oxide powders have
wide applications, such as dense ferroelectric, thin film electronic components and electro-
optical materials. Moreover, perovskite oxides are well-known catalysts for many purposes
especially in photocatalytic oxidation and hydrogenation. However, the small surface and low
homogeneity of bulk materials, caused by incomplete solid-state reactions, result in less
attractive catalysts.
5.1 Perovskite (ABO3
Many titanate compounds are perovskites such as strontium titanate (SrTiO
) UnitCell
3), barium
titanate (BaTiO3) and strontium barium titanate (Sr1-xBaxTiO3). The work discussed here
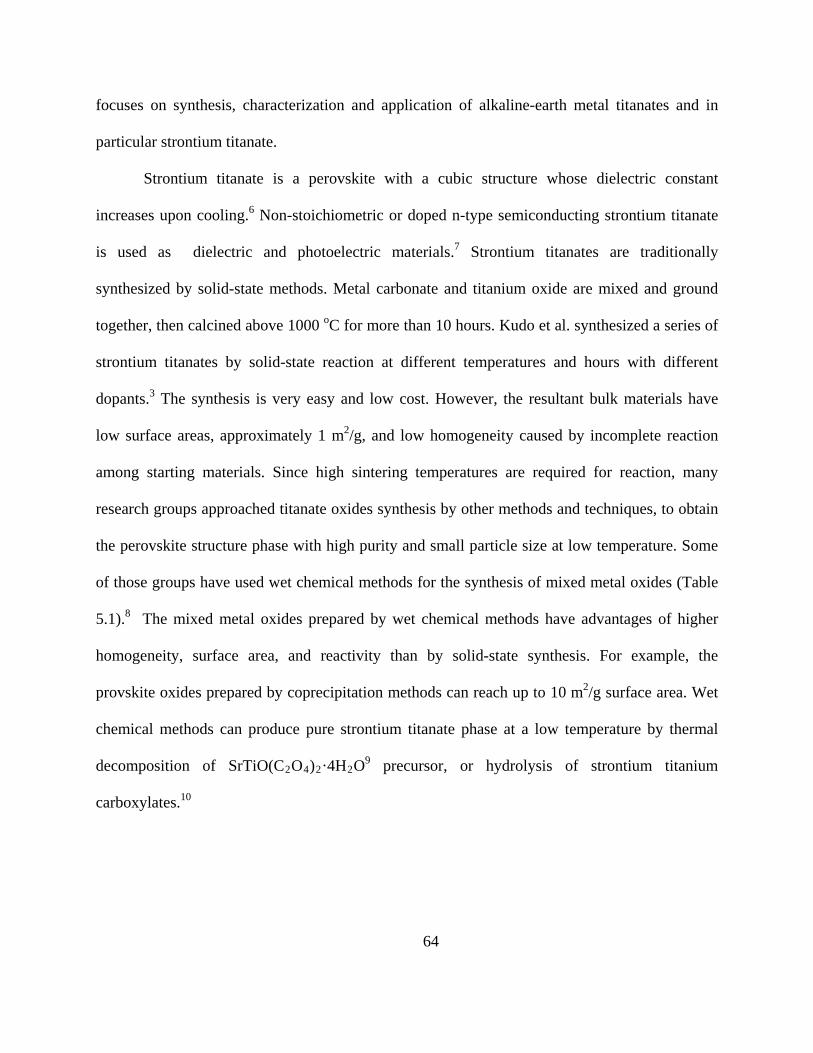
64
focuses on synthesis, characterization and application of alkaline-earth metal titanates and in
particular strontium titanate.
Strontium titanate is a perovskite with a cubic structure whose dielectric constant
increases upon cooling.6 Non-stoichiometric or doped n-type semiconducting strontium titanate
is used as dielectric and photoelectric materials.7 Strontium titanates are traditionally
synthesized by solid-state methods. Metal carbonate and titanium oxide are mixed and ground
together, then calcined above 1000 oC for more than 10 hours. Kudo et al. synthesized a series of
strontium titanates by solid-state reaction at different temperatures and hours with different
dopants.3 The synthesis is very easy and low cost. However, the resultant bulk materials have
low surface areas, approximately 1 m2/g, and low homogeneity caused by incomplete reaction
among starting materials. Since high sintering temperatures are required for reaction, many
research groups approached titanate oxides synthesis by other methods and techniques, to obtain
the perovskite structure phase with high purity and small particle size at low temperature. Some
of those groups have used wet chemical methods for the synthesis of mixed metal oxides (Table
5.1).8 The mixed metal oxides prepared by wet chemical methods have advantages of higher
homogeneity, surface area, and reactivity than by solid-state synthesis. For example, the
provskite oxides prepared by coprecipitation methods can reach up to 10 m2/g surface area. Wet
chemical methods can produce pure strontium titanate phase at a low temperature by thermal
decomposition of SrTiO(C2O4)2·4H29O precursor, or hydrolysis of strontium titanium
carboxylates.10
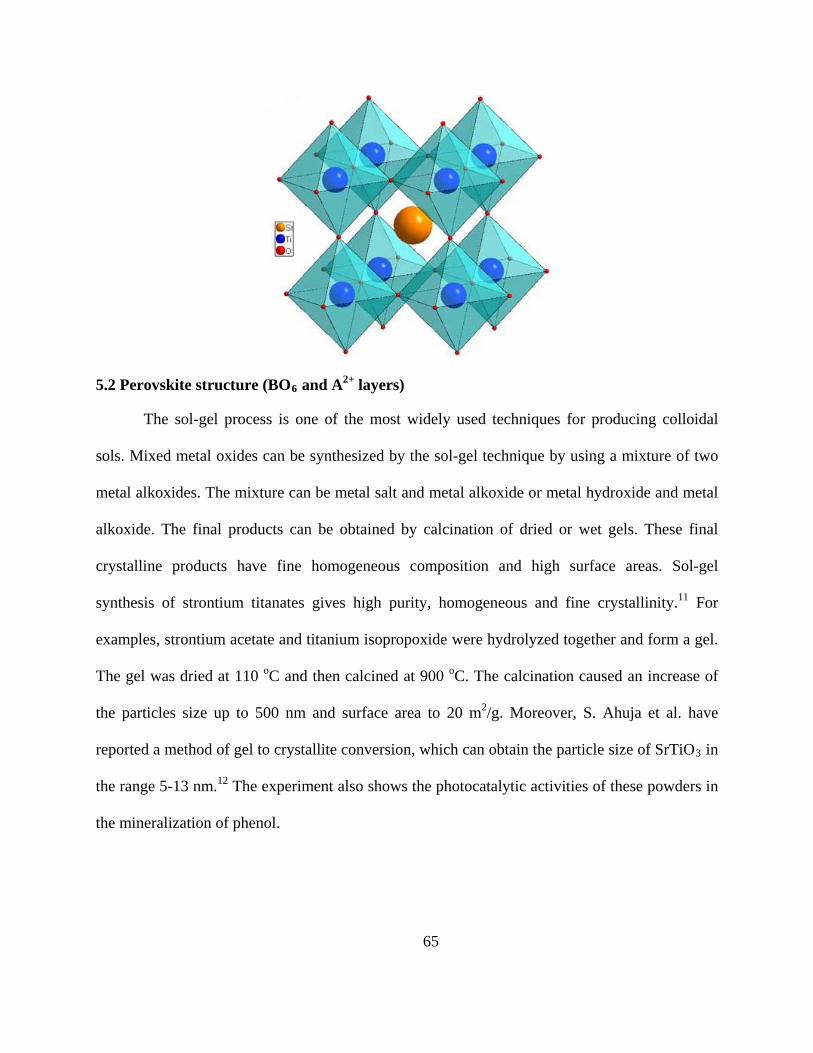
65
5.2 Perovskite structure (BO6
The sol-gel process is one of the most widely used techniques for producing colloidal
sols. Mixed metal oxides can be synthesized by the sol-gel technique by using a mixture of two
metal alkoxides. The mixture can be metal salt and metal alkoxide or metal hydroxide and metal
alkoxide. The final products can be obtained by calcination of dried or wet gels. These final
crystalline products have fine homogeneous composition and high surface areas. Sol-gel
synthesis of strontium titanates gives high purity, homogeneous and fine crystallinity.
and A2+ layers)
11 For
examples, strontium acetate and titanium isopropoxide were hydrolyzed together and form a gel.
The gel was dried at 110 oC and then calcined at 900 oC. The calcination caused an increase of
the particles size up to 500 nm and surface area to 20 m2/g. Moreover, S. Ahuja et al. have
reported a method of gel to crystallite conversion, which can obtain the particle size of SrTiO3
12
in
the range 5-13 nm. The experiment also shows the photocatalytic activities of these powders in
the mineralization of phenol.
66
5.1 Wet Chemical methods for the synthesis of mixed metal oxides
Process Method
Thermal decomposition
Oxalate
Citrate
Peroxide
Acetate
Complex cyanide
Evaporative Decomposition Spray pyrolysis
Liquid Mix
Sol-gel process
Mixed-alkoxide
Carboxy-alkoxide
Hydroxide-alkoxide
Hydrothermal synthesis Hydroxides
5.2 Nanomaterials
The properties of materials are strongly affected by particle size, crystallinity and surface
area. The particle size of nanomaterials is intermediate between single atoms and crystalline
solids of 100 nm or less. The small sizes of materials result in a larger surface areas, which
exhibit unexpected and new properties compared with bulk materials. 13, 14 Moreover, the surface
area is not the only factor affected; reactivity and optical band gap are also affected. The band
gap influences the light absorption of the materials and significantly affects photocatalytic
activities. It is the result of finite size when some of the electronic bands are converted into
molecular orbitals. Also, surface atoms have a higher ratio compared with bulk atoms resulting
in differences of chemical and physical properties compared with a single atom or the bulk
materials, and some properties become quantized. Because of those interesting properties, every
field of materials science, such as chemistry, physics, biochemistry and engineering are

67
exploring the new applications of those nano-size materials for varied purposes like electronics,
optics, catalysis and solar energy conversion. 15 The synthesis of the desired particle size, shape
and surface structure are widely studied.
For semiconductor nanoparticles, the band gap between the conductance band and
valance band gets bigger when the size of particles get smaller, resulting in a blue shift of the
absorption edge. Moreover, these nanoparticles have non-linear optical properties because of
induced polarization, which is affected by the intensity of incident light. The electric properties
of the nanomaterials are changed by the different sizes.14 The electrical conductivity of
nanoparticles decreases along with the transition of electronic band structure from bulk into
separated molecular orbitals. Also, the sintering and miscibility of the nanomaterials are affected
by size; smaller particles can achieve homogeneity of a certain phase at relatively lower
temperatures.
5.3 Synthesis of titanates
5.3.1 Introduction
There are many ways for the synthesis of nanomaterials. Milling can decrease the sizes of
bulk materials to a certain level. However, the resultant products are not homogeneous and could
be contaminated by the milling media. For gas-phase synthesis, the reactions can be carried out
by aerosol, chemical vapor deposition (CVD), solvated metal atom dispersion method (SMAD)
or others. The aerosol applies heat treatment of the dispersed droplets of precursor.16 In the
SMAD process, metals are vaporized and trapped in the frozen organic solvent matrix. For the
wet chemical synthesis, there are xerogel, aerogel, hydrothermal, microemulsion and others
methods. Microemulsion forms small droplets in the solution and each one is a reactor for
68
synthesis of nanoparticles. In hydrothermal, the precursors of metal oxides are sealed into an
autoclave and heated up to make a high pressure environment. In aerogel synthesis, sol is formed
first and then a gel network. The gel is treated by supercritical drying to preserve the network
from collapse and preserve pore structure and high surface area.
5.3.2 Solid-state synthesis
Different inorganic solids can react with each other as molten liquids or gas phase, and
high temperatures are required. The process includes many interfacial reactions such as solid-gas
or solid-liquid. It has been applied for metal oxides synthesis for a long time. For example, the
ceramic method is one of the oldest solid-state syntheses.17 The advantages of the method are
low cost, easily available precursors and simplicity. But it also has problems of unexpected
phases, inhomogeneity of dopants and observation of reaction progress is not easy.
The solid-state reaction starts from nuclei formation at the interfaces between reactants.
The reaction rate depends on the diffusion of ions from the reacting materials and decreases
when the counter ions become difficult to move around. Therefore, it requires high temperature
to provide enough energy for ion transport. And the starting precursors have to be well mixed by
grinding in order to increase contact between surfaces. Since the solid-state reaction relies on the
interaction between starting precursors, the final oxide products can gain oxide form the
atmosphere by decomposition of compounds. For example, the YBa2Cu3O7-x can be synthesized
by mixing yttrium oxide, barium peroxide and cupric oxide, then calcinated in the air. And
barium peroxide can be replaced by barium carbonate. When barium carbonate is used in the
reaction, it decomposes at high temperature and produces highly reactive barium oxide. A
similar reaction can be achieved by using precursors in citrates and acetates or nitrates. An
69
alternative way for solid-state synthesis is using co-precipitation or precursor methods.18 Because
the cations are closer to each other in this situation, a lower temperature is required to proceed
with the reaction.
For the co-precipitation method, the metal salts (carbonates, oxalates, formats or citrates)
are dissolved in water then co-precipitated by concentration of the solution. The precipitated
compounds are later treated with a high temperature. The reaction is shown in equation 5.1.
(1-x) MCO3 + xM’CO3 → M1-xM’x(CO3) → M1-x
M’O (5.1)
For the precursor methods, two different metal oxides co-exist as one material. For
example, barium titanate can be synthesized by slowly heating of the barium titania citrate in air
to burn out the organic matter. This method can obtain a higher purity and more accurate
stoichiometry than other ceramic methods.
5.3.3 Gas phase synthesis
Using gaseous precursors or intermediates for synthesis of metal oxides is fairly
common. There are many choices for reaction in gas phase, such as chemical transport, or
aerosol methods.
5.3.3.1 Chemical vapor deposition (CVD) technique
CVD is often used for crystal growth and for the purification of solids. Purification is
carried out by treating solid A with gaseous agent B, then transport of gaseous product AB
followed by decomposition back to solid A and gaseous agent B. For example, chromium oxide
can be synthesized by using halides as the solid A and water as the transport agent, gaseous agent
70
B. The reaction is a continual process, and the equilibrium constant depends on the temperature.
Therefore, the desired final AB product can be achieved by adjusting temperature. And the final
AB product can continuously flow.
Chemical vapor deposition (CVD) can be used to prepare fine thin films and coatings of
inorganic materials. Various metal oxides can be deposited to form thin films on substrates. The
process of film deposition can be carried out at a relatively lower temperature than the melting
point of the material. The basic idea of CVD is that vapor phases of volatile precursors reach the
heated substrate in the reaction chamber to form a new film of materials. Precursors are adsorbed
onto the surface of substrate, and then react with substrate to form a thin film. The basic CVD
components include the precursor delivery system, reactor, and pumping system to remove by-
products of the reaction. The reactor can operate up to 800°C, and pressure is controlled between
0.1 mbar to 1 bar. This technique is widely used in industry for hard coatings such as cutting
tools or engine parts.19 There are also other applications such as three-dimensional
microelectronic components, coatings on glass, and catalyst coatings and layered architecture in
solar cells.
A lot of precursors can be used for the CVD process, for example, metal hydrides (SiH4),
metal alkoxides (Si(OEt)4), metal alkyls (AliBu3, GaEt3), and volatile metal halides (TiCl4) in
the presence of an oxygen source (O2, N2O, or water). Organometallic precursors are more
widely used, since they are more volatile than the inorganic metal compounds. However, lower
thermal stability causes easier decomposition and contamination. More than one metal precursor
can be deposited simultaneously to produce mixed-metal oxide films, but the desired formula is
difficult to be obtained. Because precursors or their intermediates have different volatilities and
reactivity, the final product may have unexpected excess or deficiency of one agent. For
71
example, when a lead titanate (PbTiO3
Silicon oxide (SiO
) is synthesized by CVD, there is lead deficiency of lead
caused by a higher desorption rate to the substrate and higher volatility of the lead oxide (PbO).
On the other hand, a precursor with all stoichiometric elements for the product can be used.
2) films are common insulation and passivation layers in electronics.
The insulation of Silicon oxide helps to separate and protect semiconductor layers in microcircuit
electronic devices. Silicon alkoxides (tetraalkoxysilane, TEOS) are the precursors to produce
SiO2
thin film without an external oxygen source.
Si(OEt)4 → SiO2 + 2 C2H4
+ 2 EtOH (5.2)
The decomposition temperature of the alkoxides is 750ºC with or without outside oxygen
sources. But the quality of the films can be enhanced by using oxygen in the air to remove the
carbon contamination. Moreover, if ozone is used as the oxygen source, not only can the
decomposition temperature be reduced to 300 oC, but also results in a good quality of the
product.
The CVD based techniques are summarized in the table 5.2. The vapor phase epitaxy
(VPE) technique can grow epitaxial crystalline films with crystallographic orientation and single
crystal lattice. The OMCVD and OMVPE techniques apply organometallic compound precursors
with metal-carbon bonds. MOCVD technique uses the metal-organic precursors without any
metal-carbon bonds (alkoxide, amines).

72
5.2 CVD based techniques
Acronym Full Name of the Techniques
CVD
VPE
OMCVD
OMVPE
MOCVD
MOVPE
PACVD
LCVD
Chemical Vapor Deposition
Vapor Phase Epitaxy
Organometallic Chemical Vapor Deposition
Organometallic Vapor Phase Epitaxy
Metal-organic Chemical Vapor Deposition
Metal-organic Vapor Phase Epitaxy
Plasma-assisted Chemical Vapor Deposition
Laser-induced Chemical Vapor Deposition
5.3.4 Aerosol technique
The aerosol technique uses a suspension of fine solid particles or liquid droplets in a gas
and passed through a heated region.20 The reaction with gas and pyrolysis of precursor give the
product particles. The solvent is dried out using high temperature and yield the solid particles.
However, often hollow particles may form due to the precipitation of solutes.
Many ultrafine particles (< 100 nm) of oxides were obtained by the aerosol process
(Table 5.3). The presence of oxygen is required for oxides production. Moreover, mixed-metal
oxides can be prepared by using a precursor mixture (for example SiCl4 and TiCl4). The
resultant aerogel samples usually agglomerate together due to the weak van der Waals forces.
Compared with the chemical vapor deposition method, which uses substrate surface adsorbed
gaseous precursors which then react to form the solid, the solid particles are produced right in the
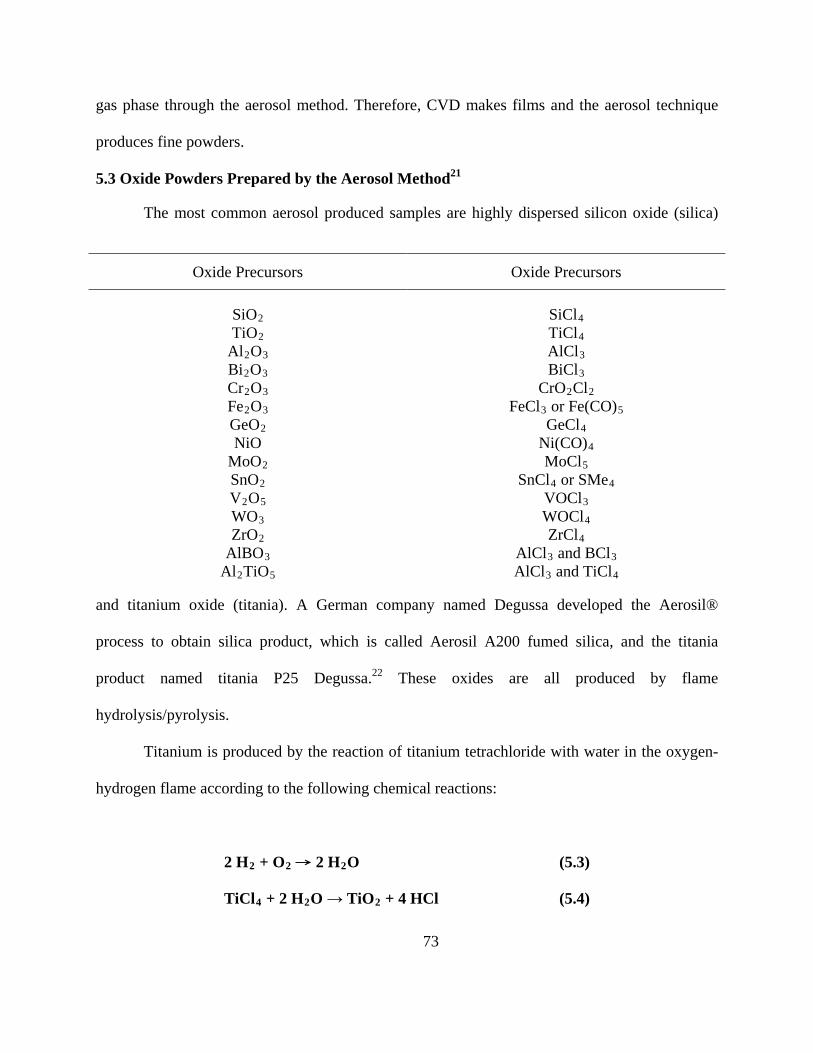
73
gas phase through the aerosol method. Therefore, CVD makes films and the aerosol technique
produces fine powders.
5.3 Oxide Powders Prepared by the Aerosol Method21
The most common aerosol produced samples are highly dispersed silicon oxide (silica)
and titanium oxide (titania). A German company named Degussa developed the Aerosil®
process to obtain silica product, which is called Aerosil A200 fumed silica, and the titania
product named titania P25 Degussa.22 These oxides are all produced by flame
hydrolysis/pyrolysis.
Titanium is produced by the reaction of titanium tetrachloride with water in the oxygen-
hydrogen flame according to the following chemical reactions:
2 H2 + O2 → 2 H2
TiCl
O (5.3)
4 + 2 H2O → TiO2
Oxide Precursors
+ 4 HCl (5.4)
Oxide Precursors
SiOTiO
2
Al2
2OBi
3 2O
Cr3
2OFe
3 2O
GeO3
NiO 2
MoOSnO
2
V2
2OWO
5
ZrO3
AlBO2
Al3
2TiO
SiCl
5
TiCl4
AlCl4
BiCl3
CrO3
2ClFeCl
2 3 or Fe(CO)GeCl
5
Ni(CO)4
MoCl4
SnCl5
4 or SMeVOCl
4
WOCl3
ZrCl4
AlCl4
3 and BClAlCl
3 3 and TiCl4

74
The overall reaction gives a highly dispersed titanium oxide sample combined with
hydrogen chloride as a byproduct. This titanium oxide is a light powder composed with up to 40
nm diameter and a high surface area of 50 m2/g spherical particles. And it is widely used as a
pigment for paints.
Fumed silica is obtained by the similar flame hydrolysis reaction:
SiCl4 + 2 H2 + O2 → SiO2
+ 4 HCl (5.5)
Fumed silica and aerosol titania are widely used as the filler for rubber, additive for
drilling fluids, plastics, paints, creams, tablets, cosmetic powders, toners, and toothpastes. The
aerosol materials have high surface areas and low density. In the aerosol process, products are
produced at the expense of energy. However, the products from aerosol methods sometimes
cause the formation of hollow particles, which may be due to differences in nucleation and
growth rate of the precursors.
5.3.5 Sol-gel technique
The sol-gel technique is one of the most widely used soft chemical methods for the metal
and semimetal oxides synthesis. In this process, an oxide network is built by hydrolysis of
alkoxides, followed by gelation and finally by removal of the solvent.23 In contrast to the
conventional solid-state method, a wet chemical synthesis can yield products which are
homogenous nanosized oxides with high purity, and lower temperatures are required. It involves
a colloidal sol which is converted into a gel during the aging.24 The aging process is a controlled
hydrolysis of metal-organic compounds (alkoxides) in an organic solvent. The sol-gel process
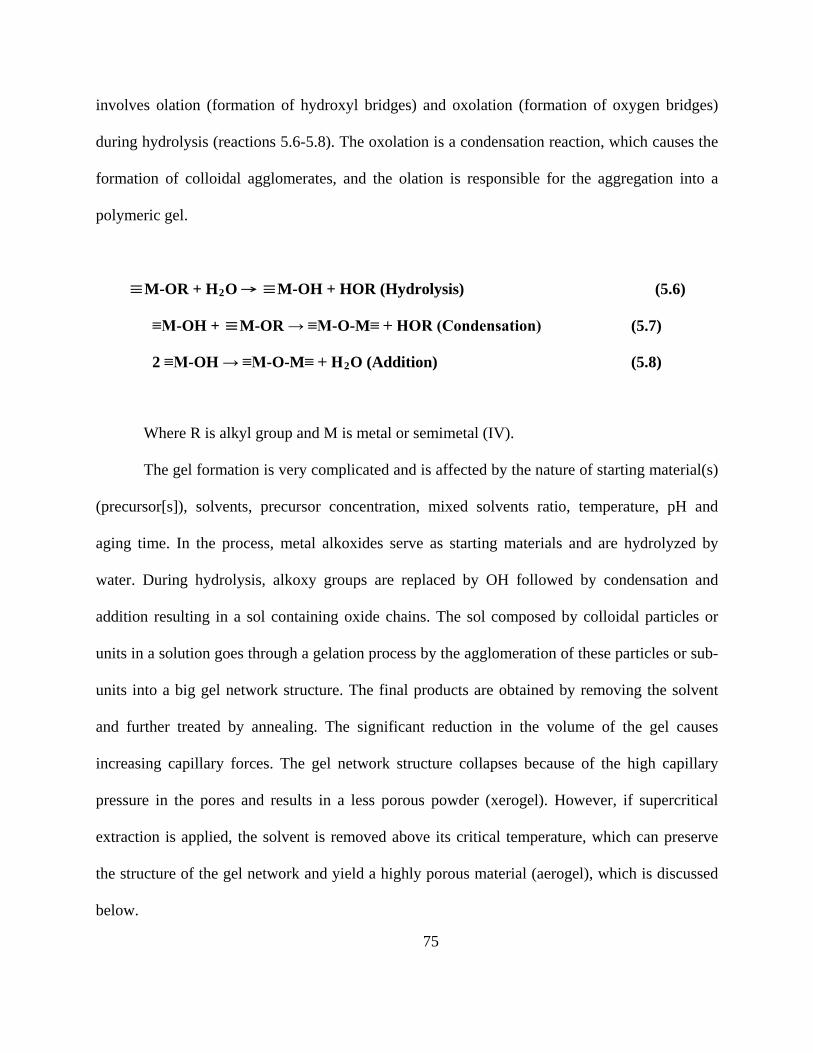
75
involves olation (formation of hydroxyl bridges) and oxolation (formation of oxygen bridges)
during hydrolysis (reactions 5.6-5.8). The oxolation is a condensation reaction, which causes the
formation of colloidal agglomerates, and the olation is responsible for the aggregation into a
polymeric gel.
≡M-OR + H2
≡M-OH + ≡M-OR → ≡M-O-M≡ + HOR (Condensation) (5.7)
O → ≡M-OH + HOR (Hydrolysis) (5.6)
2 ≡M-OH → ≡M-O-M≡ + H2
O (Addition) (5.8)
Where R is alkyl group and M is metal or semimetal (IV).
The gel formation is very complicated and is affected by the nature of starting material(s)
(precursor[s]), solvents, precursor concentration, mixed solvents ratio, temperature, pH and
aging time. In the process, metal alkoxides serve as starting materials and are hydrolyzed by
water. During hydrolysis, alkoxy groups are replaced by OH followed by condensation and
addition resulting in a sol containing oxide chains. The sol composed by colloidal particles or
units in a solution goes through a gelation process by the agglomeration of these particles or sub-
units into a big gel network structure. The final products are obtained by removing the solvent
and further treated by annealing. The significant reduction in the volume of the gel causes
increasing capillary forces. The gel network structure collapses because of the high capillary
pressure in the pores and results in a less porous powder (xerogel). However, if supercritical
extraction is applied, the solvent is removed above its critical temperature, which can preserve
the structure of the gel network and yield a highly porous material (aerogel), which is discussed
below.

76
5.3.6 Aerogel technique
The sol-gel method can prepare samples as a three dimensional porous solid. Because of
liquid-vapor interfacial tension, the polymeric network could be destroyed during the drying.
However, if the solvent is removed by supercritical drying, the structure can be prevented from
collapse.25-28 Under the supercritical extraction of the solvent, the gel is processed with heat and
pressure, giving rise to a nanocrystalline product with homogeneous composition, high porosity,
and large surface area.29, 30
Mixed oxides can be prepared by the sol-gel method to cogelate a mixture of metal
precursors. Alcohol will be produced by the following hydrolysis of the metal alkoxide (5.9). A
condensation reaction (5.10) of the partial hydrolyzed intermediate takes place to form a metal-
oxygen-metal bridge (M-O-M) by either the removal of water (X is H) or alcohol (X is R).
M(OR)n + m H2
MOH + MOX → MOM + XOH (5.10)
O → M(OR)n-m(OH)n + m ROH (5.9)
After the condensation, the reaction yields MOM, MOM’, and M’OM’ (where M and M’
are different metals). The final products may consist of three dimensional crosslinked networks
with oxo-bridged metals. In mixed-metal aerogels, each metal site has several possible
combinations of bridged neighbors. However, mixed metal oxides can result in two separate
oxide phases (oxide segregation), or of one phase with cationic substitution in the lattice,
depending on the solubility of the metal oxides in each other.31
Generally, different alcohols are used for the aerogel synthesis. For mixed metal oxide
systems, one metal alkoxide is mixed with the other metal salt (nitrate, acetate, acetylacetonate,
77
citrate, or carbonate) through the acid-alkoxide route, or metal alkoxide is mixing with metal
hydroxide through the hydroxide-alkoxide route followed by hydrolysis (gelation). The
combination of acid anions or hydroxide leads to a faster gelation. However, it also causes
impurities in the samples, which can be removed by calcination.12, 24, 31 Recently, strontium
titanate aerogel synthesis using mixed two metal alkoxides was carried out to achieve a better
gelation and prevent the formation of impurities.32 Since strontium oxides tend to produce a
carbonate phase, during hydrolysis, supercritical drying, and calcination procedures, reagents
have to be prevented from exposure to CO2, thus supercritical solvent extraction was executed in
a N2
The influence of solvent on the aerogel properties has been widely studied in our research
group.
atmosphere.
33, 34 It was found that a solvent mixture of alcohol and toluene affected the hydrolysis of
the aerogel, and resulted in higher surface areas of aerogels compared to pure alcohol solvents.32
The presence of the hydrophobic solvent may reduce surface tension in gel pores and thereby
prevent sintering .33 Therefore, toluene used as solvent not only accelerated the hydrolysis but
also gelation processes. The resultant samples consisted of a more porous structure with less
dense wet gels and a lower mass fractal dimension.34 Finally, the excess of toluene in solvent
was removed by supercritical drying in the autoclave to prevent the gel from stress and shrinkage
and yielded a higher surface area.
5.4 Temperature treatment
In the final process, heat treatment is usually needed for the preparation of the oxide
products. The drying by heating the samples leads to the collapse of the network structure and a
smaller surface area. Heating the powders at high temperatures forces the particles of the

78
powders to fuse together. Further heat treatment can produce dense solids. Different materials
such as ceramics and ironware can be produced in this way. But the sintering process is
undesirable for some nanomaterials, if a porous powder or monolith are desired.
In the heating process, particles were agglomerated to decrease the total surface area to
lower free surface energy. Surfaces within particles have different chemical potentials based on
the curvature. The convex surface has a positive surface energy, while the concave surface has a
negative free energy. Mass transport goes through the diffusion process from the surface of
convex particle to the concave interparticle. The driving force of sintering is greater for smaller
particles, and nanoparticles can undergo significant increase of particle sizes.
The vacancy concentrations may decide the driving force for the diffusion of mass flow.
Mass transportation has two main paths, which are surface diffusion and volume diffusion. In the
surface diffusion, vacancies go from the neck surface to the convex surface, so the mass flow
goes oppositely from the convex surface to the neck (Figure 5.3, path 1). In the volume diffusion,
vacancies in the grain boundaries and/or dislocations in the grain matrix move in the volume to
the surface while the mass flow tend to fill the place of moved vacancies (Figure 5.3, path 2).
5.3 Sintering by diffusion (path 1 - surface diffusion, path 2 - volume diffusion)
79
5.4.1 Heat treatment
In the heat treatment, reaction of particles goes through three main steps. The first step
includes the fusing of particles together and the mass transfer from the convex to concave
surfaces. In this step, the total pore volume and distance between particles decreases slightly.
During the second step, diffusion and mass transfer processes occur and cause an increase in
density and growing of interparticle necks and decrease in pore diameters and distances between
particles. The final step creates a dense material with no remaining pores.
Particle size, shape, and packing are directly affected by heat treatment, especially for
smaller particles, the mass transport happens faster and starts at lower temperatures. Larger
particles growing by consuming smaller particles leads to a coarsening process. The influence of
particles with a high surface area to volume ratio is bigger. During the agglomeration, a larger
contact area between particles may cause a faster sintering and densification of the material.
5.4.1.1 Calcination
Calcination is required for decomposition of the precursor or the degradation of the
impurities in the product to release gases (H2O and CO2
35
, or other gaseous products of
degradation) in the open atmosphere (air, oxygen, nitrous oxide, or ozone). Metal oxides
prepared by wet chemical methods usually include organic residues from the organic
components during the synthesis, such as physisorbed solvent, ligands, or modifiers. Studies on
different aerogels showed that calcination at 300-500ºC is necessary to remove these organic
residues, but it is still possible that a small amount remains in the pores and on the surface of the
aerogel.

80
Calcination conditions have a significant influence on final characteristics of particle size,
particle shape, surface area, crystallinity and phase purity. The organic residuals on the surface
also cause samples having different physical and chemical properties. The reactive and catalytic
activity of the samples may decrease because of covered active sites of the material.
5.4.1.2 Drying
There are several techniques which can help to dry just prepared wet gels. In the drying
process, the wet gel always results in a collapsed network. Supercritical drying, low-temperature
supercritical drying, and freeze-drying techniques have been applied to avoid the network
structure from shrinkage.36
In the supercritical drying process, the solvent in pores is transferred into a supercritical
fluid (SCF). When solvent is above its critical pressure and critical temperature, it includes
properties of liquid and gas together; therefore, there is no liquid-vapor interface and capillary
pressure. During the supercritical drying, a gel is placed into an autoclave and heated as
described steps showed in Figure 5.4. In the process, the solvent does not cross the liquid–gas
phase boundary, so the gel structure is preserved from collapsing by capillary forces when
solvent is vented out in the form of gas. After venting the aerogel is cooled down to room
temperature in an inert atmosphere (N2).
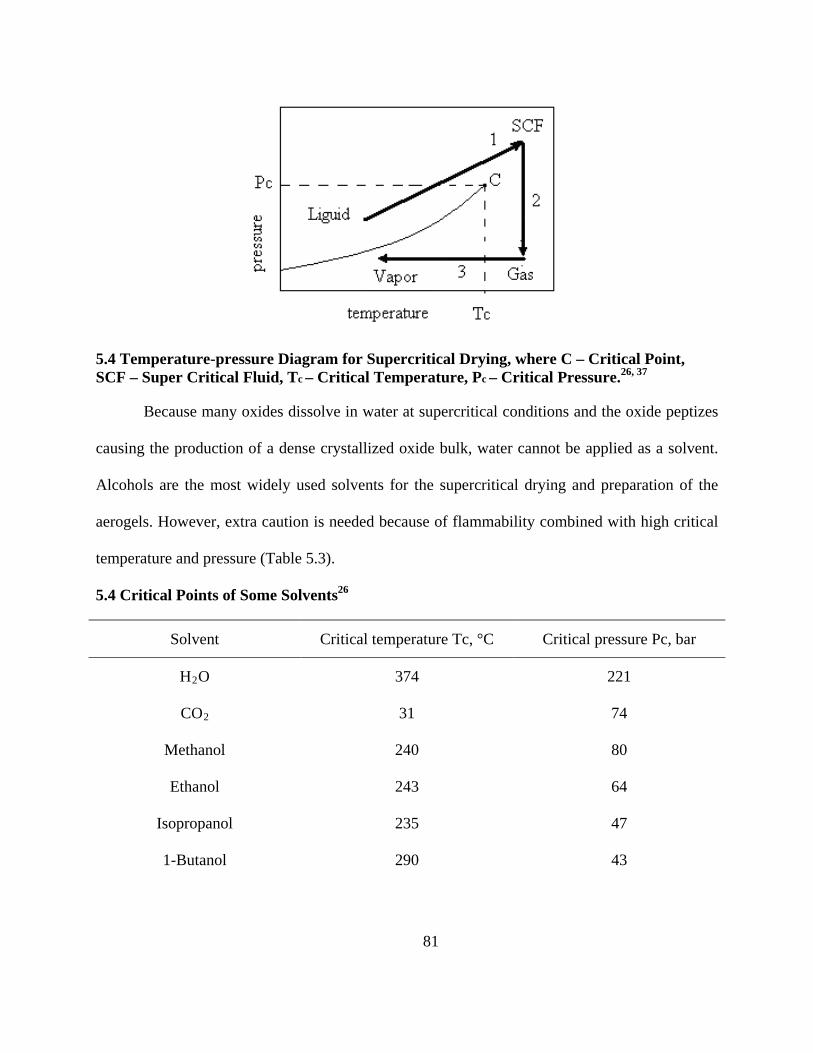
81
5.4 Temperature-pressure Diagram for Supercritical Drying, where C – Critical Point, SCF – Super Critical Fluid, Tc – Critical Temperature, Pc – Critical Pressure.26, 37
Because many oxides dissolve in water at supercritical conditions and the oxide peptizes
causing the production of a dense crystallized oxide bulk, water cannot be applied as a solvent.
Alcohols are the most widely used solvents for the supercritical drying and preparation of the
aerogels. However, extra caution is needed because of flammability combined with high critical
temperature and pressure (Table 5.3).
5.4 Critical Points of Some Solvents26
Solvent Critical temperature Tc, °C Critical pressure Pc, bar
H2 374 O 221
CO 31 2 74
Methanol 240 80
Ethanol 243 64
Isopropanol 235 47
1-Butanol 290 43
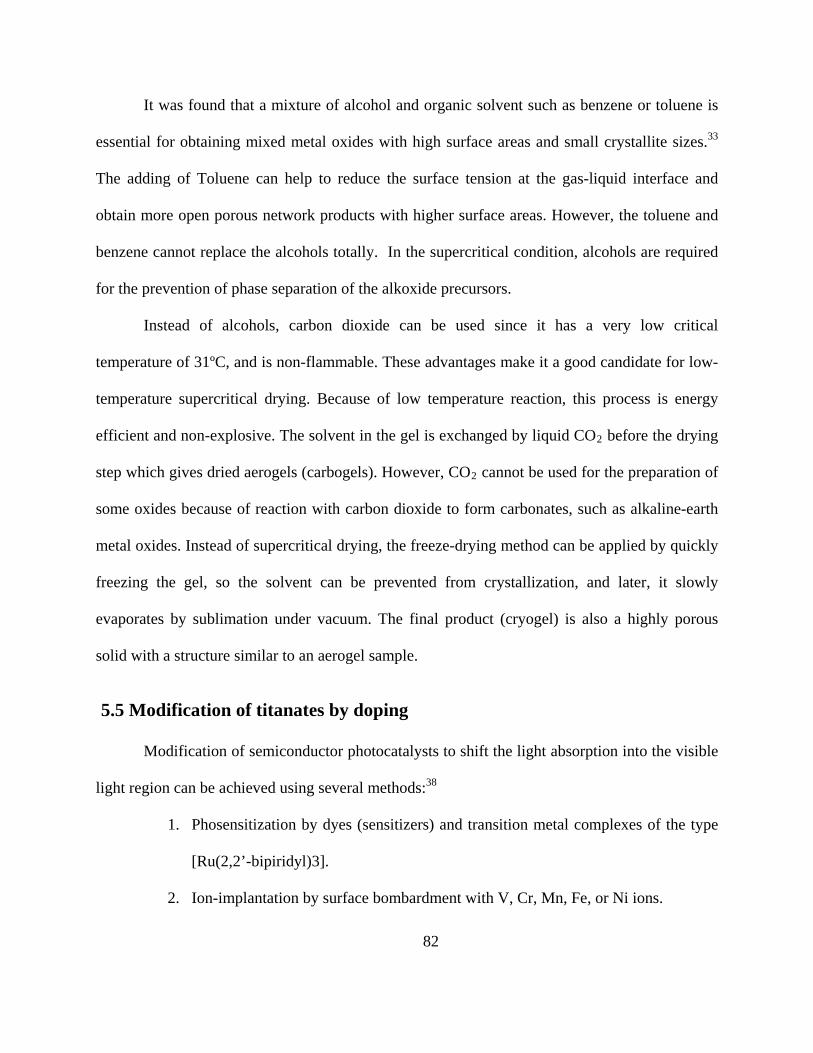
82
It was found that a mixture of alcohol and organic solvent such as benzene or toluene is
essential for obtaining mixed metal oxides with high surface areas and small crystallite sizes.33
The adding of Toluene can help to reduce the surface tension at the gas-liquid interface and
obtain more open porous network products with higher surface areas. However, the toluene and
benzene cannot replace the alcohols totally. In the supercritical condition, alcohols are required
for the prevention of phase separation of the alkoxide precursors.
Instead of alcohols, carbon dioxide can be used since it has a very low critical
temperature of 31ºC, and is non-flammable. These advantages make it a good candidate for low-
temperature supercritical drying. Because of low temperature reaction, this process is energy
efficient and non-explosive. The solvent in the gel is exchanged by liquid CO2 before the drying
step which gives dried aerogels (carbogels). However, CO2
5.5 Modification of titanates by doping
cannot be used for the preparation of
some oxides because of reaction with carbon dioxide to form carbonates, such as alkaline-earth
metal oxides. Instead of supercritical drying, the freeze-drying method can be applied by quickly
freezing the gel, so the solvent can be prevented from crystallization, and later, it slowly
evaporates by sublimation under vacuum. The final product (cryogel) is also a highly porous
solid with a structure similar to an aerogel sample.
Modification of semiconductor photocatalysts to shift the light absorption into the visible
light region can be achieved using several methods:38
1. Phosensitization by dyes (sensitizers) and transition metal complexes of the type
[Ru(2,2’-bipiridyl)3].
2. Ion-implantation by surface bombardment with V, Cr, Mn, Fe, or Ni ions.
83
3. Doping with V, Cr, Rh, Mn, Fe, Co, Ni, or Cu metals.
4. Doping with S, N, or F nonmetals.
5. Impregnation or incorporation with fullerenes (C60).
The modification of photocatalysts using doping with transition metal ions creates a
forbidden band level between the band gap to enhance the visible light absorption. Our group has
developed a way to modify the UV photocatalytic materials so that they can respond to visible
irradiation.39-41 These photocatalysts allow absorption of visible light due to being doped with
metal ions during the synthesis. These novel nanosized catalysts may have a higher
photocatalytic activity than bulk catalyst using visible light. Since nanomaterials have
advantages of more surface area and active sites on the surface, the doping of strontium titanate
nanoparticles can yield enhanced photocatalytic activity in visible light.
Ion implantation is a very effective method and can significantly enhance the adsorption
of visible light by the sample. Figure 5.5 shows that Cr implanted TiO2
38
has an increase in
absorption of visible light with increasing of the concentration of implanted chromium. The big
disadvantage of this method is the high cost of catalyst production.

84
5.5 UV-Visible Absorption Spectra of a) Pure TiO2 and b) –d) Cr Ion-implanted TiO2 with Cr of 2.2, 6.6, and 13 x10-7 mol/g.38
Instead of Ion-implantation, semiconductor catalysts can be doped with transition metals
by wet chemical methods, and a variety of transition and noble metals were used for the doping
of photocatalysts to enhance the visible light absorption (Figure 5.5).3 Electron donor levels were
created between the Ti 3d and O 2p band gap by the dopants and caused the visible light
response.
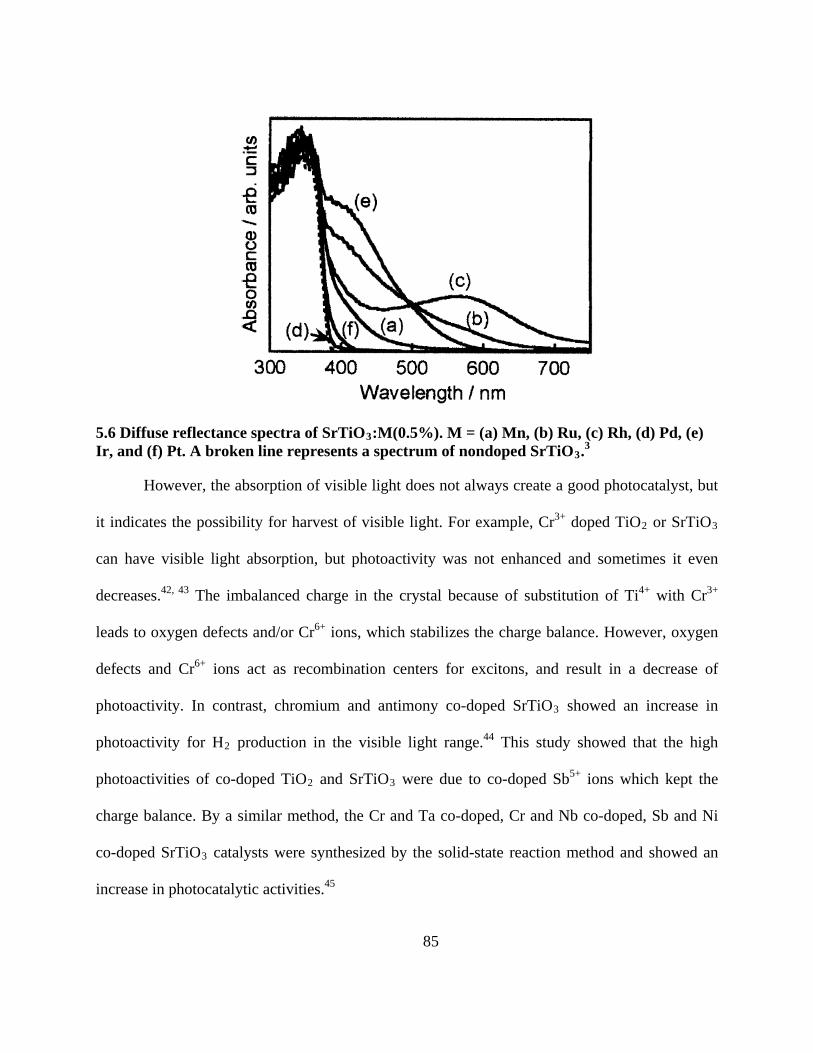
85
5.6 Diffuse reflectance spectra of SrTiO3:M(0.5%). M = (a) Mn, (b) Ru, (c) Rh, (d) Pd, (e) Ir, and (f) Pt. A broken line represents a spectrum of nondoped SrTiO3
3.
However, the absorption of visible light does not always create a good photocatalyst, but
it indicates the possibility for harvest of visible light. For example, Cr3+ doped TiO2 or SrTiO3
42
can have visible light absorption, but photoactivity was not enhanced and sometimes it even
decreases. , 43 The imbalanced charge in the crystal because of substitution of Ti4+ with Cr3+
leads to oxygen defects and/or Cr6+ ions, which stabilizes the charge balance. However, oxygen
defects and Cr6+ ions act as recombination centers for excitons, and result in a decrease of
photoactivity. In contrast, chromium and antimony co-doped SrTiO3 showed an increase in
photoactivity for H244 production in the visible light range. This study showed that the high
photoactivities of co-doped TiO2 and SrTiO3 were due to co-doped Sb5+ ions which kept the
charge balance. By a similar method, the Cr and Ta co-doped, Cr and Nb co-doped, Sb and Ni
co-doped SrTiO3
45
catalysts were synthesized by the solid-state reaction method and showed an
increase in photocatalytic activities.
86
Doping TiO2
46
with Fe3+, Mo5+, Ru3+, Os3+, Re5+, V4+ and Rh3+ did enhance the
photoactivity for carbon tetrachloride reduction and chloroform oxidation, but doping with Co3+
and Al3+ caused a decrease of photoactivity.
Instead of doping cations, the doping of titania with anions has been reported, which
achieved the substitution of O2- by anions in the lattice of TiO2 to form TiO2-xFx, TiO2-xNx, or
TiO2-xSx47-49. If nitrogen was used as dopant for SrTiO3, anion defects form charge imbalance
and caused problems, since the defects can act as electron-hole recombination centers. But
charge could be balanced by adding F– ion, which combined with N3- to replace two O2-. N
doped SrTiO3 had a lower photoactivity under visible light irradiation than the N and F co-doped
sample.
87
References
1. Osterloh, F. E., Inorganic Materials as Catalysts for Photochemical Splitting of Water. Chemistry of Materials 2008, 20, (1), 35-54.
2. Sasaki, Y.; Nemoto, H.; Saito, K.; Kudo, A., Solar Water Splitting Using Powdered Photocatalysts Driven by Z-Schematic Interparticle Electron Transfer without an Electron Mediator. The Journal of Physical Chemistry C 2009, 113, (40), 17536-17542.
3. Konta, R.; Ishii, T.; Kato, H.; Kudo, A., Photocatalytic Activities of Noble Metal Ion Doped SrTiO3
4. Kudo, A.; Miseki, Y., Heterogeneous photocatalyst materials for water splitting. Chemical Society Reviews 2009, 38, (1), 253-278.
under Visible Light Irradiation. In The Journal of Physical Chemistry B, American Chemical Society: 2004; Vol. 108, pp 8992-8995.
5. Kim, J.; Hwang, D.; Kim, H.; Bae, S.; Lee, J.; Li, W.; Oh, S., Highly Efficient Overall Water Splitting Through Optimization of Preparation and Operation Conditions of Layered Perovskite Photocatalysts. Topics in Catalysis 2005, 35, (3), 295-303.
6. Rooksby, H. P., Compounds of the structural type of calcium titanate. Nature 1945, 155, (3938), 484-484.
7. Burn, I.; Neirman, S., Dielectric-Properties of Donor-Doped Polycrystalline SrTiO3
8. Padmini, P.; Kutty, T. R. N., Wet chemical syntheses of ultrafine multicomponent ceramic powders through gel to crystallite conversion. Journal of Materials Chemistry 1994, 4, (12), 1875-1881.
. Journal of Materials Science 1982, 17, (12), 3510-3524.
9. Gallagher, P. K.; Schrey, F.; Dimarcello, F. V., Preparation of Semiconducing Titanates by Chemical Methods. Journal of the American Ceramic Society 1963, 46, (8), 359-365.
10. Riman, R. E.; Landham, R. R.; Bowen, H. K., Synthesis of Uniform Titanium and 1-1 Strontium-Titanium Carboxyhydrosols by Controlled Hydrolysis of Alkoxymetal Carboxylate Precursors. Journal of the American Ceramic Society 1989, 72, (5), 821-826.
11. Pfaff, G., Sol-gel synthesis of strontium titanate powders of various compositions. Journal of Materials Chemistry 1993, 3, (7), 721-724.
12. Ahuja, S.; Kutty, T. R. N., Nanoparticles of SrTiO3 prepared by gel to crystallite conversion and their photocatalytic activity in the mineralization of phenol. Journal of Photochemistry and Photobiology A: Chemistry 1996, 97, (1-2), 99-107.
88
13. Rossetti, R.; Nakahara, S.; Brus, L. E., Quantum size effects in the redox potentials, resonance Raman spectra, and electronic spectra of CdS crystallites in aqueous solution. The Journal of Chemical Physics 1983, 79, (2), 1086-1088.
14. Brus, L. E., Electron--electron and electron-hole interactions in small semiconductor crystallites: The size dependence of the lowest excited electronic state. The Journal of Chemical Physics 1984, 80, (9), 4403-4409.
15. Zunger, A.; Wagner, S.; Petroff, P., New materials and structures for photovoltaics. Journal of Electronic Materials 1993, 22, (1), 3-16.
16. Gurav, A.; Kodas, T.; Pluym, T.; Xiong, Y., Aerosol Processing Processing of Materials. Aerosol Science and Technology 1993, 19, (4), 411-452.
17. Lengauer, W., Characterization of nitrogen distribution profiles in fcc transition metal nitrides by means of Tc measurements. Surface and Interface Analysis 1990, 15, (6), 377-382.
18. Rao, C. N. R., Chemical synthesis of solid inorganic materials. Materials Science and Engineering: B 1993, 18, (1), 1-21.
19. Hintermann, H. E., Tribological and protective coatings by chemical vapour deposition. Thin Solid Films 1981, 84, (3), 215-243.
20. Drygas, M.; Czosnek, C.; Paine, R. T.; Janik, J. F., Aerosol-assisted vapor phase synthesis of powder composites in the target system GaN/TiN for potential electronic applications. Materials Research Bulletin 2005, 40, (7), 1136-1142.
21. Schubert, U.; Hüsing, N., Synthesis of inorganic materials. Wiley-VCH: Weinheim New York, 2000; p xvii, 396 p.
22. Wagner, E.; Brünner, H., Aerosil, Herstellung, Eigenschaften und Verhalten in organischen Flüssigkeiten. Angewandte Chemie 1960, 72, (19-20), 744-750.
23. Gopalakrishnan, J., Chimie Douce Approaches to the Synthesis of Metastable Oxide Materials. Chemistry of Materials 1995, 7, (7), 1265-1275.
24. Hubert-Pfalzgraf, L. G.; Daniele, S.; Decams, J. M.; Vaissermann, J., The Quest for Single-Source Precursors for BaTiO3; and SrTiO3
25. Kistler, S. S., Coherent Expanded-Aerogels. The Journal of Physical Chemistry 1932, 36, (1), 52-64.
. Journal of Sol-Gel Science and Technology 1997, 8, (1), 49-53.
26. Brinker, C. J.; Scherer, G. W., Sol-gel science : the physics and chemistry of sol-gel processing. Academic Press: Boston, 1990; p xiv, 908 p.

89
27. Campbell, L. K.; Na, B. K.; Ko, E. I., Synthesis and characterization of titania aerogels. Chemistry of Materials 1992, 4, (6), 1329-1333.
28. Carnes, C. L.; Kapoor, P. N.; Klabunde, K. J.; Bonevich, J., Synthesis, Characterization, and Adsorption Studies of Nanocrystalline Aluminum Oxide and a Bimetallic Nanocrystalline Aluminum Oxide/Magnesium Oxide. Chemistry of Materials 2002, 14, (7), 2922-2929.
29. Klabunde, K. J.; Stark, J.; Koper, O.; Mohs, C.; Park, D. G.; Decker, S.; Jiang, Y.; Lagadic, I.; Zhang, D., Nanocrystals as Stoichiometric Reagents with Unique Surface Chemistry. The Journal of Physical Chemistry 1996, 100, (30), 12142-12153.
30. López, T.; Hernández, J.; Gómez, R.; Bokhimi, X.; Boldú, J. L.; Muñoz, E.; Novaro, O.; García-Ruiz, A., Synthesis and Characterization of TiO2
31. Cho, W.-S.; Hamada, E., Synthesis of ultrafine BaTiO
−MgO Mixed Oxides Prepared by the Sol−Gel Method†. Langmuir 1999, 15, (18), 5689-5693.
3
32. Demydov, D.; Klabunde, K. J., Characterization of mixed metal oxides (SrTiO
particles from polymeric precursor: their structure and surface property. Journal of Alloys and Compounds 1998, 266, (1-2), 118-122.
3 and BaTiO3
33. Utamapanya, S.; Klabunde, K. J.; Schlup, J. R., Nanoscale metal oxide particles/clusters as chemical reagents. Synthesis and properties of ultrahigh surface area magnesium hydroxide and magnesium oxide. Chemistry of Materials 1991, 3, (1), 175-181.
) synthesized by a modified aerogel procedure. Journal of Non-Crystalline Solids 2004, 350, 165-172.
34. Diao, Y.; Walawender, W. P.; Sorensen, C. M.; Klabunde, K. J.; Ricker, T., Hydrolysis of Magnesium Methoxide. Effects of Toluene on Gel Structure and Gel Chemistry. Chemistry of Materials 2002, 14, (1), 362-368.
35. Schneider, M.; Baiker, A., Aerogels in Catalysis. Catalysis Reviews: Science and Engineering 1995, 37, (4), 515 - 556.
36. Tewari, P. H.; Hunt, A. J.; Lofftus, K. D., Ambient-temperature supercritical drying of transparent silica aerogels. Materials Letters 1985, 3, (9-10), 363-367.
37. Schubert, U.; Hüsing, N., Synthesis of inorganic materials. 2nd, rev. and updated ed.; Wiley-VCH: Weinheim ; [Great Britain], 2005; p xx, 409 p.
38. Kaneko, M.; Okura, I., Photocatalysis : science and technology. Kodansha ; Springer: Tokyo Berlin ; New York, 2002; p xvi, 356 p.
39. Wang, J.; Uma, S.; Klabunde, K. J., Visible light photocatalysis in transition metal incorporated titania-silica aerogels. Applied Catalysis B: Environmental 2004, 48, (2), 151-154.
90
40. Uma, S.; Rodrigues, S.; Martyanov, I. N.; Klabunde, K. J., Exploration of photocatalytic activities of titanosilicate ETS-10 and transition metal incorporated ETS-10. Microporous and Mesoporous Materials 2004, 67, (2-3), 181-187.
41. Martyanov, I. N.; Uma, S.; Rodrigues, S.; Klabunde, K. J., Decontamination of Gaseous Acetaldehyde over CoOx-Loaded SiO2
42. Herrmann, J.-M.; Disdier, J.; Pichat, P., Effect of chromium doping on the electrical and catalytic properties of powder titania under UV and visible illumination. Chemical Physics Letters 1984, 108, (6), 618-622.
Xerogels under Ambient, Dark Conditions. Langmuir 2005, 21, (6), 2273-2280.
43. Mackor, A.; Blasse, G., Visible-light induced photocurrents in SrTiO3-LaCrO3
44. Kato, H.; Kudo, A., Visible-Light-Response and Photocatalytic Activities of TiO
single-crystalline electrodes. Chemical Physics Letters 1981, 77, (1), 6-8.
2 and SrTiO3
45. Ishii, T.; Kato, H.; Kudo, A., H
Photocatalysts Codoped with Antimony and Chromium. The Journal of Physical Chemistry B 2002, 106, (19), 5029-5034.
2 evolution from an aqueous methanol solution on SrTiO3
46. Choi, W.; Termin, A.; Hoffmann, M. R., The Role of Metal Ion Dopants in Quantum-Sized TiO
photocatalysts codoped with chromium and tantalum ions under visible light irradiation. Journal of Photochemistry and Photobiology A: Chemistry 2004, 163, (1-2), 181-186.
2
47. Asahi, R.; Morikawa, T.; Ohwaki, T.; Aoki, K.; Taga, Y., Visible-Light Photocatalysis in Nitrogen-Doped Titanium Oxides. Science 2001, 293, (5528), 269-271.
: Correlation between Photoreactivity and Charge Carrier Recombination Dynamics. The Journal of Physical Chemistry 1994, 98, (51), 13669-13679.
48. Yu, J. C.; Yu; Ho; Jiang; Zhang, Effects of F- Doping on the Photocatalytic Activity and Microstructures of Nanocrystalline TiO2
49. Umebayashi, T.; Yamaki, T.; Tanaka, S.; Asai, K., Visible Light-Induced Degradation of Methylene Blue on S-doped TiO
Powders. Chemistry of Materials 2002, 14, (9), 3808-3816.
2
. Chemistry Letters 2003, 32, (4), 330-331.

91
Chapter 6 - Water Splitting under Visible Light using Aerogel
Prepared Strontium Titanate (SrTiO3
In our laboratories, nanostructured strontium titanate visible-light-driven photocatalysts
containing rhodium and ruthenium were synthesized by a modified aerogel synthesis using
ruthenium chloride and rhodium nitrate as dopants precursors, and titanium isopropoxide and
strontium metal for the metal sources. The well-defined crystalline SrTiO
) Nanomaterials Doped with
Ruthenium and Rhodium Metals
3 structure was
confirmed by X-ray diffraction (XRD). After calcination at 500 °C, diffuse reflectance
spectroscopy showed an increase of light absorption at 370 nm due to the presence of Rh3+;
however an increase of calcination temperature to 600 °C led to a decrease in intensity, probably
due to loss of surface area. An increase in rhodium doping also led to an increase in absorption at
370 nm; however, these higher amounts of dopant lowered photocatalytic activity. The modified
aerogel synthesis allows greatly enhanced H2 production performance from an aqueous methanol
solution under visible light irradiation, compared with lower surface area conventional materials.
We believe this enhanced activity is due to higher surface areas while still yielding high quality
nanocrystalline materials. Furthermore, the surface properties of these nanocrystalline aerogel
materials are different, as exhibited by higher activities in alkaline solutions, while conventional
materials (via high temperature solid-state synthesis methods) only exhibit reasonable hydrogen
production in acidic solutions. Moreover, an aerogel synthesis approach gives the possibility of
thin-film formation and ease of incorporation for practical solar devices.
92
6.1 Introduction
Many photocatalysts have been reported for water splitting under UV-Vis light.
However, visible-light-driven photocatalysts are of more interest because sun-light possesses a
larger portion of visible light. Fewer materials for water splitting under visible light have been
reported. Domen and coworkers have reported GaN-ZnO and GeZnN2
1-3
-ZnO solid solutions for
overall water splitting under visible light. However, these oxy(nitride) photocatalysts need the
assistance of co-catalysts such as Cr2O3-Rh2O3 to be active. On the other hand, two-step
photocatalysis systems for overall water splitting mimicking photosynthesis in green plants have
been broadly studied. These Z-scheme photocatalysis systems are composed of two
photocatalysts, which generate H2 and O2 by different catalysts along with a reversible redox
couple. The redox couple acts an electron mediator to transfer electrons from the O2 production
photocatalyst to the H2 production photocatalyst. Fujihara et al. achieved overall water splitting
using a system consisting of Pt/TiO2-Br and TiO2
4
-Fe3+ components, but it only worked under
UV light irradiation. Some other visible-light-driven systems also have been reported.5-7
Sayama et al. and Abe et al. reported Z-scheme photocatalysis systems using an IO3− /I− redox
couple as an electron mediator.5, 6 Moreover, Kudo et al and Mills et al. observed visible-light-
driven Z-scheme photocatalysis systems using Pt/SrTiO3:Rh for H28 evolution, BiVO4
9,
Bi2MoO610, and WO3
11 for O27 evolution along with Fe3+/Fe2+ couple as a electron mediator. , 12
However, a Pt co-catalyst not only assists water splitting reactions but also back-recombination
reactions, such as water formation from evolved H2 and O2
13
. In contrast to Pt, a Ru co-catalyst is
an effective cocatalyst that does not enhance the back reaction. Therefore, Ru may be a better
choice than Pt to be the reaction sites for H2 generation on the surface of composites as a co-
catalyst.
93
SrTiO3:Rh is a proven photocatalyst with high activity for H2
8
evolution in methanol-
water solution under visible light. The unique character of doped Rh has reversible oxidation
states (+3, +4, etc.) in SrTiO3. Therefore, the SrTiO3:Rh photocatalyst is activated by the help of
reduction of Rh(IV) to Rh(III) during H2
8
evolution in an aqueous methanol solution under
visible light irradiation.
In this study, we report that crystalline SrTiO3
14
:Rh can be prepared by a modified aerogel
procedure. The synthesis of mixed metal oxides by sol-gel or aerogel methods can be achieved
by the co-gelation of metal precursors to form single-phase nanosized strontium titanate.
However, the product often consists of two separate oxide phases. In this research, the mixed
alkoxide route through the mixing of two metal alkoxides results in a better gelation and higher
purity of final product. The supercritical drying procedure allows higher surface areas and
uniform pore structure, and helps to prevent strontium oxides from forming a carbonate phase by
reacting with CO2
14-16
in air during hydrolysis. The influence of solvent on the aerogel process also
has been previously studied in our research group. It was found that two different polarities
of a mixed solvent system can help to control the hydrolysis of the aerogel resulting in a higher
surface area. The added hydrophobic solvent may reduce tension in gel pores and further prevent
sintering.15 Therefore, we used mixed ethanol-toluene as a solvent to perform the aerogel
synthesis.
6.2 Materials and methods
All procedures were performed under argon, because strontium metal is sensitive to water
and oxygen. All autoclave treatments for supercritical drying were performed on a Parr 4843
instrument. SrCO ( ≥ 99.9% trace metals basis), TiO2 (nanopowder, ~21 nm particle size, ≥
94
99.5% trace metals basis ), Rh2O3 (powder, 99.8% ), RuCl3 · nH2O (99.98% trace metals basis),
Titanium (IV) isopropoxide (97%), absolute ethanol (200 proof), calcium hydrate (powder,
99.99% trace metals basis), toluene strontium metal (99% dendritic pieces), and Rhodium(III)
nitrate solution ~10 % (w/w) (Rh in > 5 wt. % HNO3
Synthesis of strontium titanium oxide doped with rhodium was carried out by a
conventional solid-state reaction.
) were used as received.
8, 13 The starting materials, SrCO3, TiO2 and Rh2O3 were mixed
in a mortar according to the ratio Sr/Ti/Rh = 1.07:0.99:0.01. The mixture was calcined at 1273 K
for 10 h in air. Ru (1.0 wt %) co-catalyst (working as active sites for H2 evolution) were loaded
on the photocatalysts by photodeposition from aqueous methanol solutions (10 vol%) containing
RuCl3 · nH213O. The cocatalyst-loaded photocatalysts were collected by filtration and washed
with water.
The modified aerogel procedure for mixed metal oxides employs the preparation of metal
alkoxide mixtures in an ethanol–toluene solvent, hydrolysis, cogelation of alkoxide mixture, and
supercritical drying of the solvent. The scheme for aerogel-prepared SrTiO3:Rh by a modified
aerogel procedure is presented in figure 6.1. SrTiO3:Rh aerogels were prepared in ethanol
mixture with toluene in a toluene-to-ethanol volume ratio of 1.5. Ethanol was dried by boiling
with CaH2 overnight and collected by distillation before use. In a 250 ml flask, 0.02 mol (1.75 g)
of Sr metal was allowed to react with 40 ml of ethanol under a flow of argon and constant
stirring. In a separate 250 ml flask, 0.02 mol (5.9 mL) of titanium isopropoxide was added to 40
ml of ethanol with similar stirring under Ar, allowing a 1:1 stoichiometric ratio between Sr and
Ti. After this, 60 ml of toluene was added into each flask forming clear solutions. The alkoxide
solutions were mixed together and stirred and rhodium nitrate added in a different mole ratio (1
% ~). Then this mixture was hydrolyzed with a stoichiometric amount of doubly distilled water

95
by a slow, dropwise addition. The slow water hydrolysis transformed a solution of alkoxides into
a slightly milky wet gel (gel in ethanol–toluene solution). The viscous solution was left for aging
by vigorously stirring at room temperature for 1 h.
The wet gel was transferred to a 600 ml glass liner and placed in an autoclave. The
autoclave was flushed with nitrogen, and then pressurized to 100 psi (6.9 bar, 6.9 ×10⁵ Pa). The
reactor was slowly heated to 265 oC. The pressure increased from 100 to 700 psi (48.3 bar, 48.3
× 105 Pa) upon heating. At 265 oC, the solvent vapors were removed by quick venting to the
atmosphere, followed by flushing the reactor with nitrogen to remove any remaining solvent
vapors. Finally the autoclave was cooled to room temperature. The residual solvent that was
removed by calcination of the resulting SrTiO3:Rh powders in air at different temperatures. Ru
co-catalysts were loaded on photocatalysts by photodeposition from aqueous methanol solutions
(10 vol%) containing RuCl3 · nH213O. The cocatalyst-loaded photocatalysts were collected by
filtration and washed with water.

96
6.1 Modified aerogel procedure from alkoxides for Ru/SrTiO3
6.3 Results and discussion
:Rh synthesis.
6.3.1 Strontium titanate calcination at different temperatures
SrTiO3:Rh samples were synthesized by the aerogel method and calcined at different
temperatures. Figure 6.2 shows the XRD patterns of SrTiO3:Rh treated previously at different
calcination temperatures. The XRD patterns confirm the well-defined crystalline SrTiO3
structure. These samples do not require high-temperature treatments to initiate a phase transition
from amorphous to crystalline. The Rhodium could not be observed in the XRD pattern, because
it was loaded at only 1 mole %. The crystallite sizes of different calcination temperature samples
97
are shown in table 6.1. The highest surface area that we obtained is 130 m2/g, which is much
higher than that achieved by solid-state or hydrothermal synthesis methods. Table 6.1 shows the
higher calcination temperature, the larger the crystallite size obtained from the XRD pattern.
This shows that the higher calcination temperature can improve the crystal structure and reduce
the defects by atom rearrangement. The better crystalline nature may result in a higher water
splitting activity. However, the surface area and the total pore volume decrease when a higher
calcination temperature was applied. Surface area is also very important for a catalyst. A large
surface can increase the water-catalyst interface resulting in a better activity. Therefore, the
highest catalytic activity achievement must be balanced at a certain point between crystallinity
and surface area. Moreover, calcination is a necessary treatment for most catalysts. It can remove
the residues of solvent or other organic agents, which were used during the synthesis. The
different calcination temperatures for the resulting samples also have been tested, which shows
that 500 oC is the turning point of calcination temperature influence between crystallinity,
surface area, and solvent residue removal (note the dramatic decrease of surface area, table 6.1).
The water splitting reactions were conducted in a 10 vol % methanol solution after further
doping with Ru as a co-catalyst. Ru is used as a co-catalyst for the hydrogen production. It can
be homogeneously doped by the photodeposition method.8
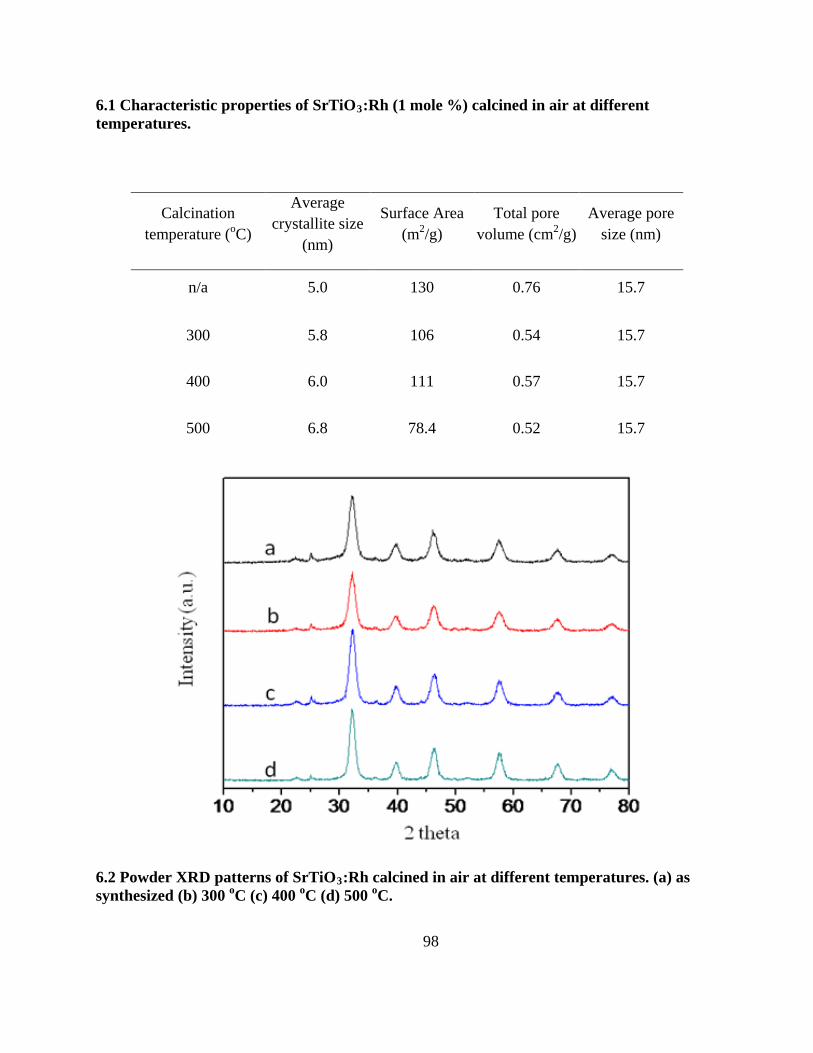
98
6.1 Characteristic properties of SrTiO3
:Rh (1 mole %) calcined in air at different temperatures.
6.2 Powder XRD patterns of SrTiO3:Rh calcined in air at different temperatures. (a) as synthesized (b) 300 oC (c) 400 oC (d) 500 oC.
Calcination temperature (oC)
Average crystallite size
(nm)
Surface Area (m2/g)
Total pore volume (cm2/g)
Average pore size (nm)
n/a 5.0 130 0.76 15.7
300 5.8 106 0.54 15.7
400 6.0 111 0.57 15.7
500 6.8 78.4 0.52 15.7
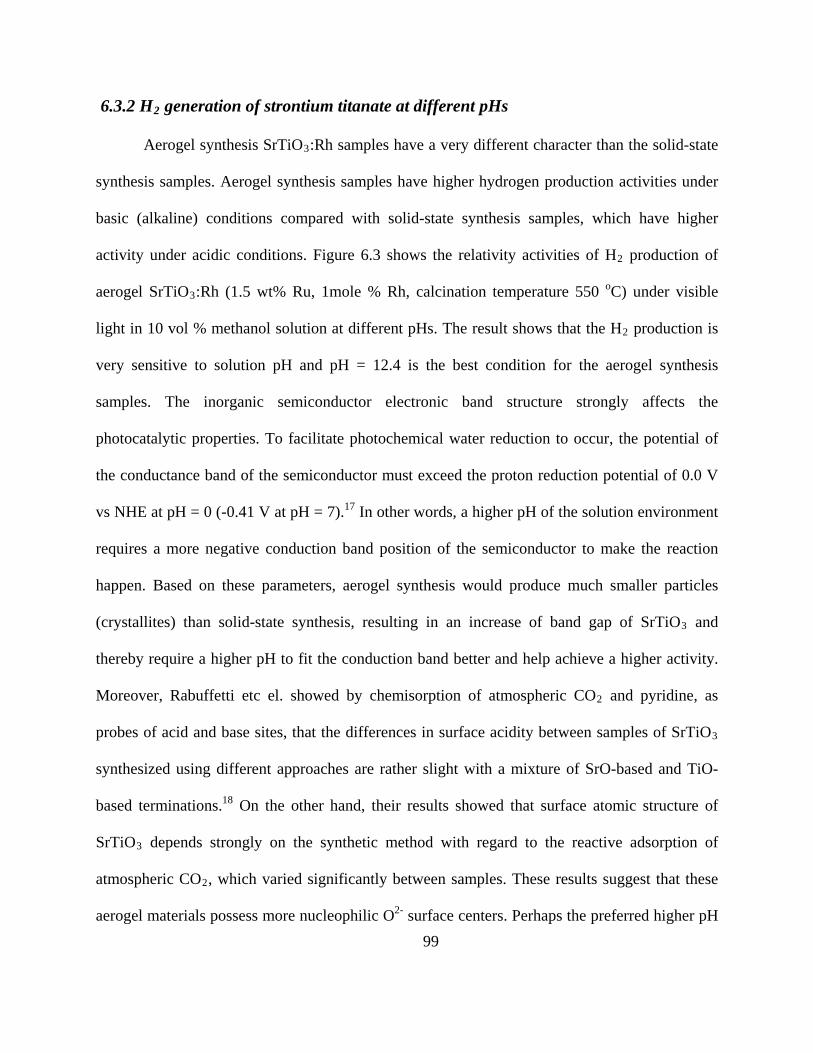
99
6.3.2 H2
Aerogel synthesis SrTiO
generation of strontium titanate at different pHs
3:Rh samples have a very different character than the solid-state
synthesis samples. Aerogel synthesis samples have higher hydrogen production activities under
basic (alkaline) conditions compared with solid-state synthesis samples, which have higher
activity under acidic conditions. Figure 6.3 shows the relativity activities of H2 production of
aerogel SrTiO3:Rh (1.5 wt% Ru, 1mole % Rh, calcination temperature 550 oC) under visible
light in 10 vol % methanol solution at different pHs. The result shows that the H2
17
production is
very sensitive to solution pH and pH = 12.4 is the best condition for the aerogel synthesis
samples. The inorganic semiconductor electronic band structure strongly affects the
photocatalytic properties. To facilitate photochemical water reduction to occur, the potential of
the conductance band of the semiconductor must exceed the proton reduction potential of 0.0 V
vs NHE at pH = 0 (-0.41 V at pH = 7). In other words, a higher pH of the solution environment
requires a more negative conduction band position of the semiconductor to make the reaction
happen. Based on these parameters, aerogel synthesis would produce much smaller particles
(crystallites) than solid-state synthesis, resulting in an increase of band gap of SrTiO3 and
thereby require a higher pH to fit the conduction band better and help achieve a higher activity.
Moreover, Rabuffetti etc el. showed by chemisorption of atmospheric CO2 and pyridine, as
probes of acid and base sites, that the differences in surface acidity between samples of SrTiO3
18
synthesized using different approaches are rather slight with a mixture of SrO-based and TiO-
based terminations. On the other hand, their results showed that surface atomic structure of
SrTiO3 depends strongly on the synthetic method with regard to the reactive adsorption of
atmospheric CO2, which varied significantly between samples. These results suggest that these
aerogel materials possess more nucleophilic O2- surface centers. Perhaps the preferred higher pH

100
reaction conditions help preserve those reaction O2- sites, that seem to be important in the overall
water splitting mechanism.
6.3 Dependence of H2 evolution activity of SrTiO3
6.3.3 Dependence of H
:Rh (1.5 wt% Ru, 1 mole% Rh, cal. 550 oC) at different pHs under visible light in 10 vol% methanol-water solution.
2 evolution activity of aerogel Ru/SrTiO3
SrTiO
:Rh on different
calcination temperatures
3:Rh samples with different calcination temperatures show a variation in H2
evolution activity (figure 6.4) (pH = 12.4, adjusted by NaOH under visible light, with a
conventional solid-state synthesized sample for comparison). The results show that a calcination
temperature of 550 oC has the best activity. The calcination temperatures strongly affected the
nanoparticle surface condition. Figure 6.5 shows the diffuse reflectance spectra of Rh-doped

101
aerogel SrTiO3
19
(1.5 wt% Ru, 1.25 mole% Rh) with different calcination temperatures. The
decrease of absorption between 500 nm to 800 nm when calcination temperatures were increased
from 450 oC to 500 oC may be due to loss of organic contaminants. Indeed, figure 6.5c
corresponds to the most active catalysts with calcination at 550 oC. The absorption band in the
visible region at 420 nm is attributed to Rh3+. We believe that Rh3+ is an important visible light
chromophore, and is present even up to 550 oC. Thus, it is likely that the Rh3+ sites are important
for light induced exciton formation. However, except the 284.4 eV binding energy of C (figure
6.11a), which is normally used as an internal calibration, there are still exiting other signals of
carbons in the XPS spectrum indicting that even after treated with 500 oC, the residues from
precursors could not be completely removed.
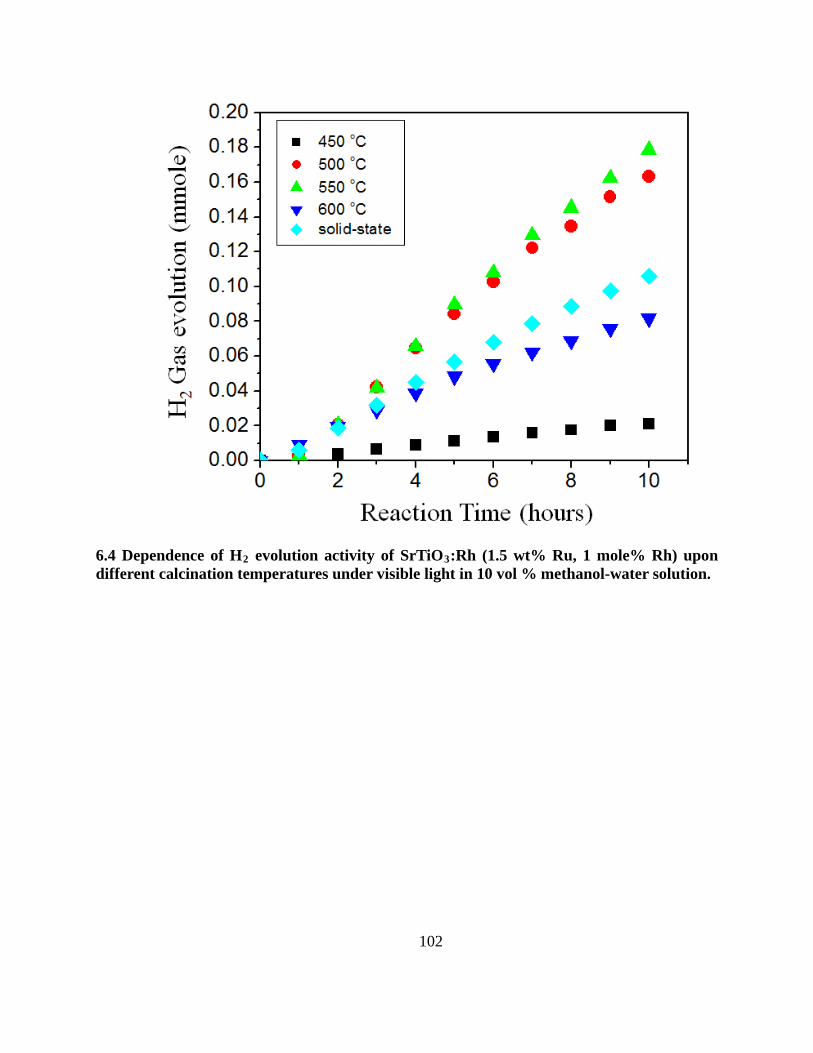
102
6.4 Dependence of H2 evolution activity of SrTiO3:Rh (1.5 wt% Ru, 1 mole% Rh) upon different calcination temperatures under visible light in 10 vol % methanol-water solution.
103
6.5 Diffuse reflectance spectra of Rh-doped aerogel SrTiO3
6.3.4 Dependence of H
(1.5 wt% Ru, 1.25 mole% Rh) from different calcination temperatures (a) 450 oC (b) 500 oC (c) 550 oC (d) 600 oC (e) 650 oC.
2 evolution activity of aerogel Ru/SrTiO3
SrTiO
:Rh on different Rh
doping amounts
3:Rh samples with different amounts of Rh have been synthesized by the modified
aerogel method. Figure 6.6 shows dependence of H2 evolution activity of Rh-doped aerogel
SrTiO3 (1.5 wt% Ru, cal. 500 oC) upon the different doping amount in 10 vol % methanol
solution (pH = 12.4, adjusted by NaOH) under visible light along with a conventional solid-state
synthesized sample for comparison. The optimal doping amount is Ru/SrTiO3:Rh(1.25 mole %
Rh) (figure 6.6). The highest hydrogen production can generate ~54 % more H2 gas than a solid-
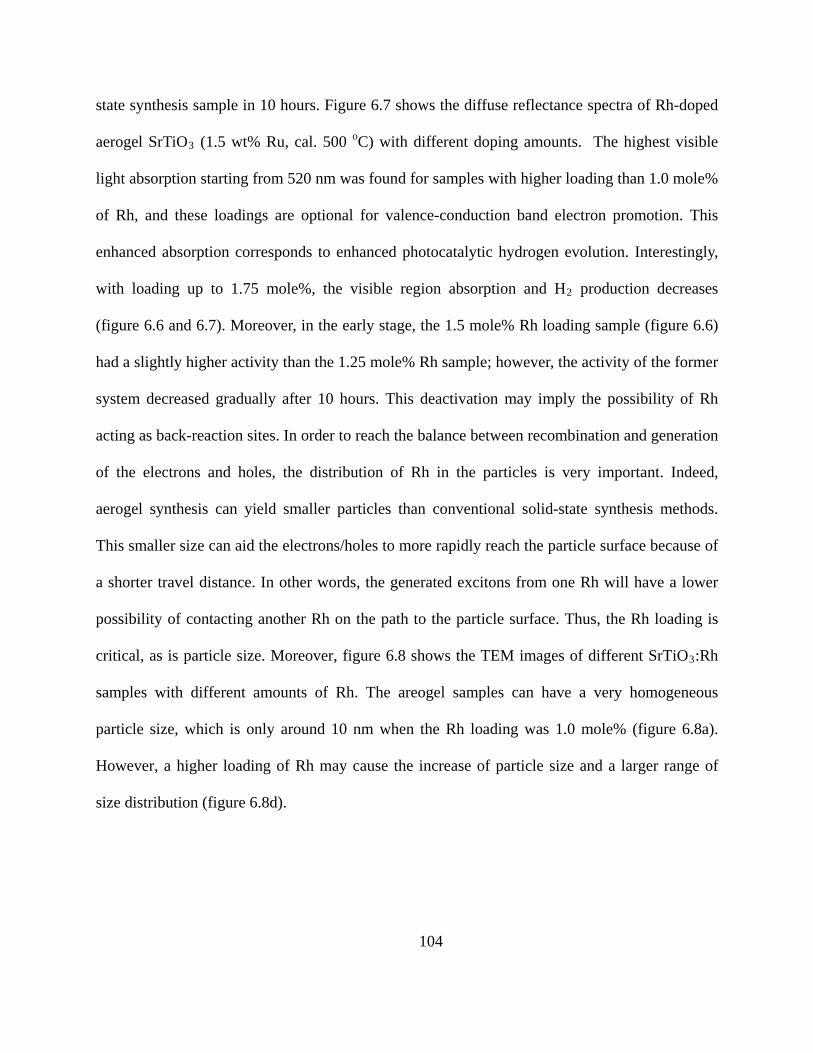
104
state synthesis sample in 10 hours. Figure 6.7 shows the diffuse reflectance spectra of Rh-doped
aerogel SrTiO3 (1.5 wt% Ru, cal. 500 oC) with different doping amounts. The highest visible
light absorption starting from 520 nm was found for samples with higher loading than 1.0 mole%
of Rh, and these loadings are optional for valence-conduction band electron promotion. This
enhanced absorption corresponds to enhanced photocatalytic hydrogen evolution. Interestingly,
with loading up to 1.75 mole%, the visible region absorption and H2 production decreases
(figure 6.6 and 6.7). Moreover, in the early stage, the 1.5 mole% Rh loading sample (figure 6.6)
had a slightly higher activity than the 1.25 mole% Rh sample; however, the activity of the former
system decreased gradually after 10 hours. This deactivation may imply the possibility of Rh
acting as back-reaction sites. In order to reach the balance between recombination and generation
of the electrons and holes, the distribution of Rh in the particles is very important. Indeed,
aerogel synthesis can yield smaller particles than conventional solid-state synthesis methods.
This smaller size can aid the electrons/holes to more rapidly reach the particle surface because of
a shorter travel distance. In other words, the generated excitons from one Rh will have a lower
possibility of contacting another Rh on the path to the particle surface. Thus, the Rh loading is
critical, as is particle size. Moreover, figure 6.8 shows the TEM images of different SrTiO3:Rh
samples with different amounts of Rh. The areogel samples can have a very homogeneous
particle size, which is only around 10 nm when the Rh loading was 1.0 mole% (figure 6.8a).
However, a higher loading of Rh may cause the increase of particle size and a larger range of
size distribution (figure 6.8d).
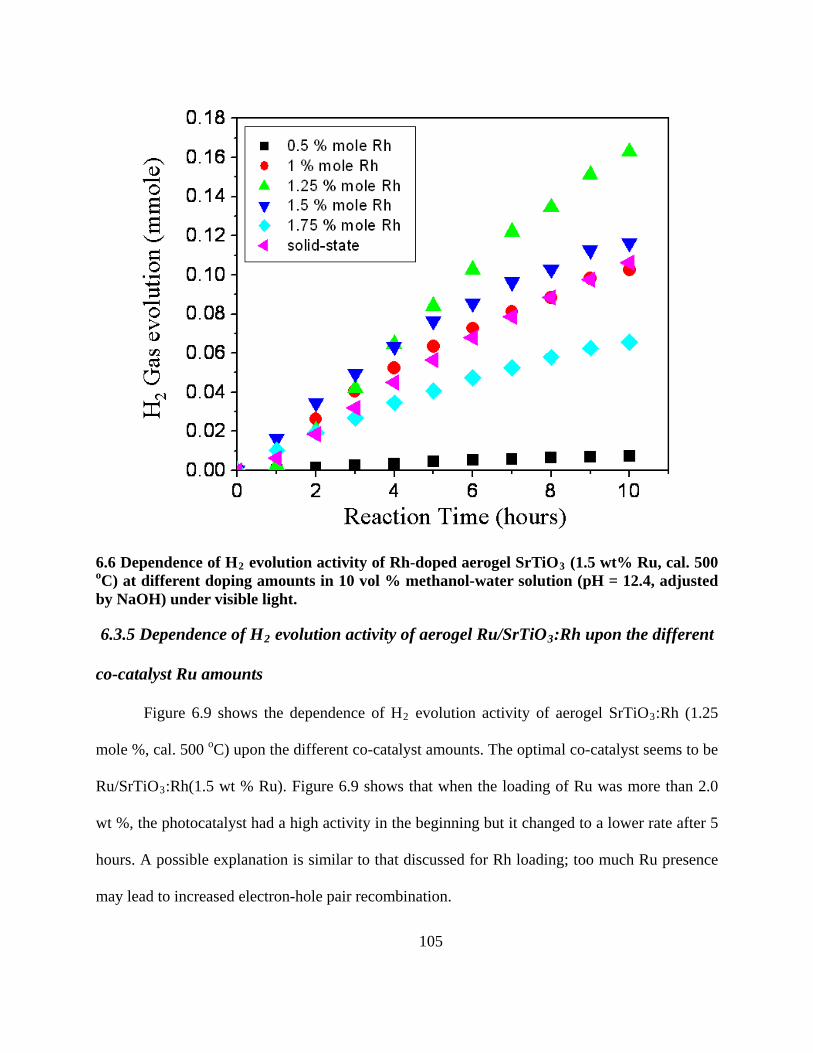
105
6.6 Dependence of H2 evolution activity of Rh-doped aerogel SrTiO3
6.3.5 Dependence of H
(1.5 wt% Ru, cal. 500 oC) at different doping amounts in 10 vol % methanol-water solution (pH = 12.4, adjusted by NaOH) under visible light.
2 evolution activity of aerogel Ru/SrTiO3
Figure 6.9 shows the dependence of H
:Rh upon the different
co-catalyst Ru amounts
2 evolution activity of aerogel SrTiO3:Rh (1.25
mole %, cal. 500 oC) upon the different co-catalyst amounts. The optimal co-catalyst seems to be
Ru/SrTiO3:Rh(1.5 wt % Ru). Figure 6.9 shows that when the loading of Ru was more than 2.0
wt %, the photocatalyst had a high activity in the beginning but it changed to a lower rate after 5
hours. A possible explanation is similar to that discussed for Rh loading; too much Ru presence
may lead to increased electron-hole pair recombination.

106
6.7 Diffuse reflectance spectra of Rh-doped aerogel SrTiO3 (1.5 wt% Ru, cal. 500 oC) from different doping amounts (a) 1 mole% (b) 1.25 mole% (c) 1.5 mole% (d) 1.75 mole%.
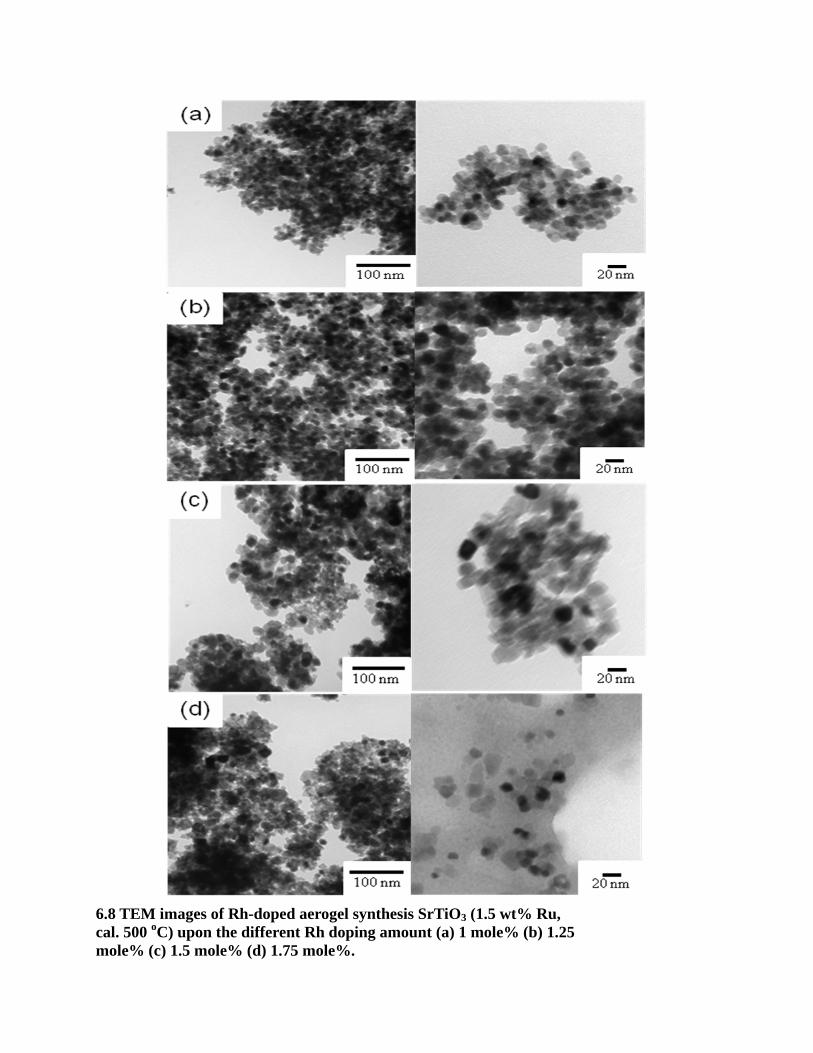
107
6.8 TEM images of Rh-doped aerogel synthesis SrTiO3 (1.5 wt% Ru, cal. 500 oC) upon the different Rh doping amount (a) 1 mole% (b) 1.25 mole% (c) 1.5 mole% (d) 1.75 mole%.
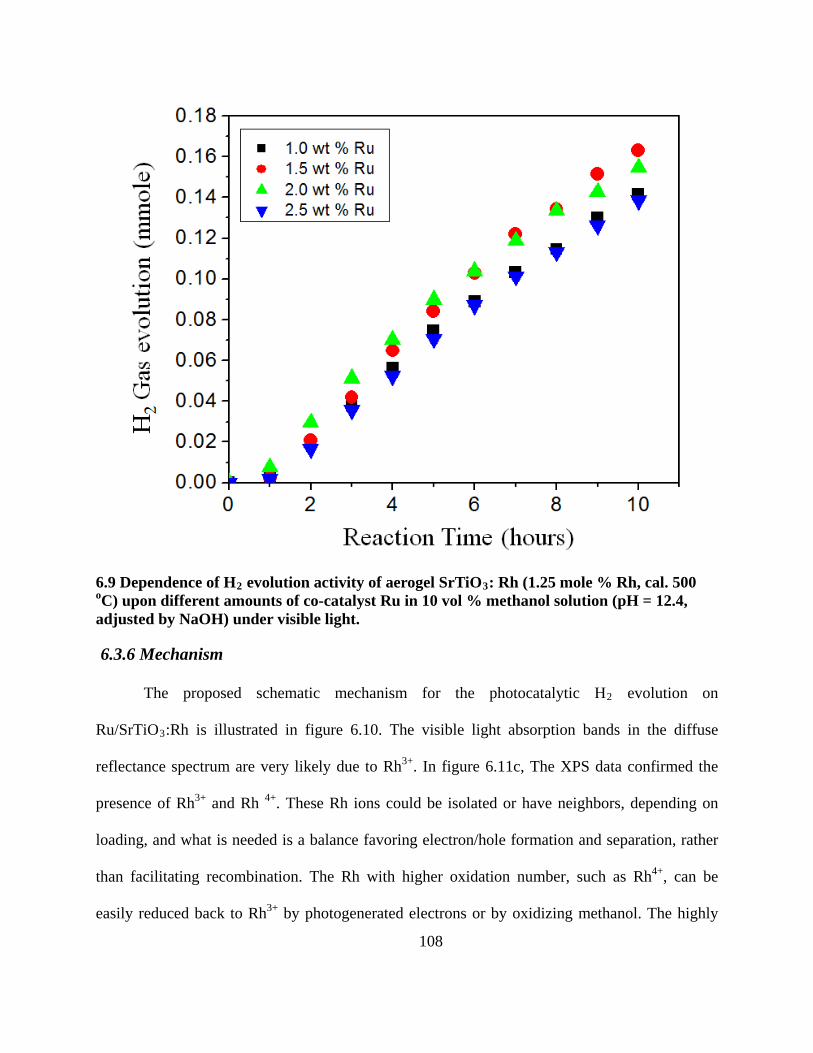
108
6.9 Dependence of H2 evolution activity of aerogel SrTiO3
6.3.6 Mechanism
: Rh (1.25 mole % Rh, cal. 500 oC) upon different amounts of co-catalyst Ru in 10 vol % methanol solution (pH = 12.4, adjusted by NaOH) under visible light.
The proposed schematic mechanism for the photocatalytic H2 evolution on
Ru/SrTiO3:Rh is illustrated in figure 6.10. The visible light absorption bands in the diffuse
reflectance spectrum are very likely due to Rh3+. In figure 6.11c, The XPS data confirmed the
presence of Rh3+ and Rh 4+. These Rh ions could be isolated or have neighbors, depending on
loading, and what is needed is a balance favoring electron/hole formation and separation, rather
than facilitating recombination. The Rh with higher oxidation number, such as Rh4+, can be
easily reduced back to Rh3+ by photogenerated electrons or by oxidizing methanol. The highly
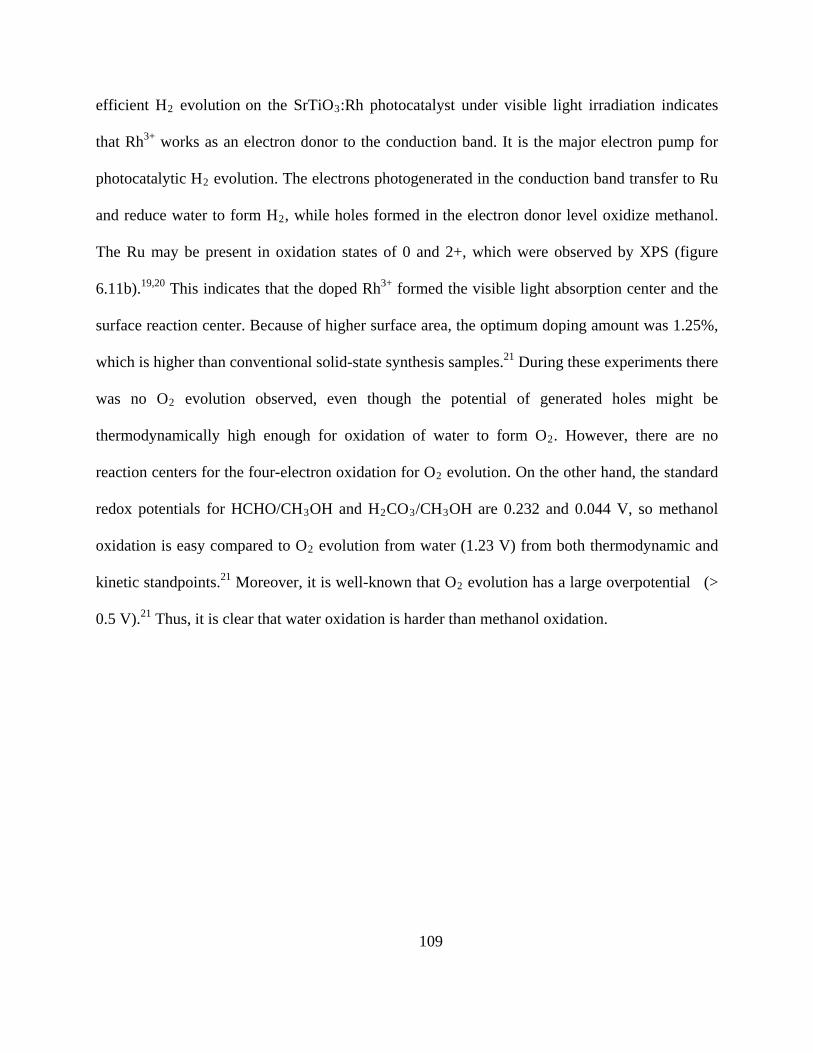
109
efficient H2 evolution on the SrTiO3:Rh photocatalyst under visible light irradiation indicates
that Rh3+ works as an electron donor to the conduction band. It is the major electron pump for
photocatalytic H2 evolution. The electrons photogenerated in the conduction band transfer to Ru
and reduce water to form H2
21
, while holes formed in the electron donor level oxidize methanol.
The Ru may be present in oxidation states of 0 and 2+, which were observed by XPS (figure
6.11b).19,20 This indicates that the doped Rh3+ formed the visible light absorption center and the
surface reaction center. Because of higher surface area, the optimum doping amount was 1.25%,
which is higher than conventional solid-state synthesis samples. During these experiments there
was no O2 evolution observed, even though the potential of generated holes might be
thermodynamically high enough for oxidation of water to form O2. However, there are no
reaction centers for the four-electron oxidation for O2 evolution. On the other hand, the standard
redox potentials for HCHO/CH3OH and H2CO3/CH3OH are 0.232 and 0.044 V, so methanol
oxidation is easy compared to O2 evolution from water (1.23 V) from both thermodynamic and
kinetic standpoints.21 Moreover, it is well-known that O2
21
evolution has a large overpotential (>
0.5 V). Thus, it is clear that water oxidation is harder than methanol oxidation.
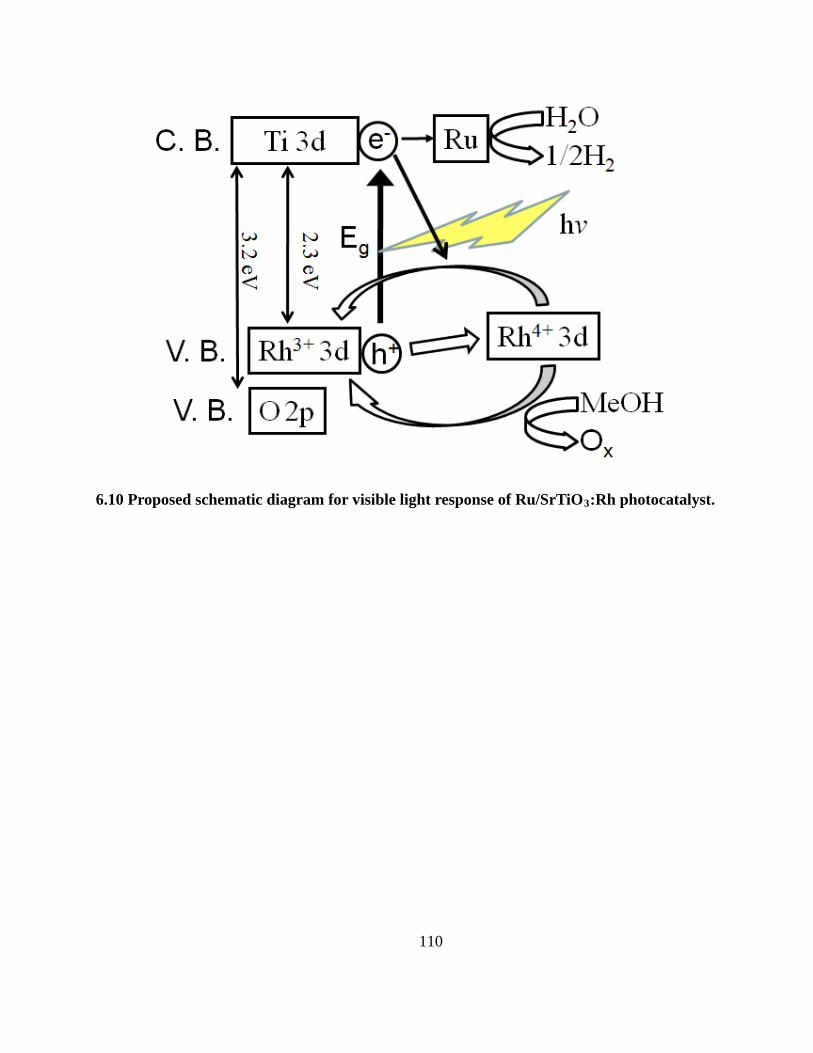
110
6.10 Proposed schematic diagram for visible light response of Ru/SrTiO3:Rh photocatalyst.
111
6.11 XPS spectra of Ru/SrTiO3
6.4 Conclusions
:Rh (1.25 mole % Rh, 1.5 wt% Ru, Cal. 500 oC) (a) C 1s (b) Ru 3p3/2 (c) Rh 3d5/2.
We have used a modified aerogel synthesis method to prepare nanostructured high
surface area Ru/SrTiO3:Rh oxide photocatalysts that are active for H2 evolution from an aqueous
methanol solution under visible light irradiation. The aerogel method also provides for thin-film
fabrication and increases possible applications. The visible light response was due to the
transition from the electron donor level formed by Rh3+ ions to the conduction band composed of

112
Ti 3d orbitals of SrTiO38. The absorption band in the visible light region from 400 nm to 520 nm
directly corresponded to photocatalytic hydrogen evolution activity. The optimal synthesis
condition is 1.25 mole % Rh, 1.5 wt % Ru, calcination temperature at 550 oC and pH = 12.4
aqueous methanol solution. The solution for hydrogen generation has to be basic (alkaline),
which is unique from most other photocatalytic water splitting materials. The calcination
temperature and dopant amount of Rh are two major factors that affect H2 evolution.
113
References
1. Maeda, K.; Takata, T.; Hara, M.; Saito, N.; Inoue, Y.; Kobayashi, H.; Domen, K., GaN:ZnO Solid Solution as a Photocatalyst for Visible-Light-Driven Overall Water Splitting. Journal of the American Chemical Society 2005, 127, (23), 8286-8287.
2. Maeda, K.; Teramura, K.; Lu, D.; Takata, T.; Saito, N.; Inoue, Y.; Domen, K., Photocatalyst releasing hydrogen from water. Nature 2006, 440, (7082), 295-295.
3. Lee, Y.; Terashima, H.; Shimodaira, Y.; Teramura, K.; Hara, M.; Kobayashi, H.; Domen, K.; Yashima, M., Zinc Germanium Oxynitride as a Photocatalyst for Overall Water Splitting under Visible Light. The Journal of Physical Chemistry C 2007, 111, (2), 1042-1048.
4. Fujihara, K.; Ohno, T.; Matsumura, M., Splitting of water by electrochemical combination of two photocatalytic reactions on TiO2
5. Sayama, K.; Mukasa, K.; Abe, R.; Abe, Y.; Arakawa, H., Stoichiometric water splitting into H and O using a mixture of two different photocatalysts and an IO3-/I- shuttle redox mediator under visible light irradiation. Chemical Communications 2001, (23), 2416-2417.
particles. Journal of the Chemical Society, Faraday Transactions 1998, 94, (24), 3705-3709.
6. Abe, R.; Takata, T.; Sugihara, H.; Domen, K., Photocatalytic overall water splitting under visible light by TaON and WO3
7. Kato, H.; Hori, M.; Konta, R.; Shimodaira, Y.; Kudo, A., Construction of Z-scheme type heterogeneous photocatalysis systems for water splitting into H
with an IO3-/I- shuttle redox mediator. Chemical Communications 2005, (30), 3829-3831.
2 and O2
8. Konta, R.; Ishii, T.; Kato, H.; Kudo, A., Photocatalytic Activities of Noble Metal Ion Doped SrTiO
under visible light irradiation. Chemistry Letters 2004, 33, (10), 1348-1349.
3
9. Kudo, A.; Omori, K.; Kato, H., A Novel Aqueous Process for Preparation of Crystal Form-Controlled and Highly Crystalline BiVO
under Visible Light Irradiation. In The Journal of Physical Chemistry B, American Chemical Society: 2004; Vol. 108, pp 8992-8995.
4
10. Shimodaira, Y.; Kato, H.; Kobayashi, H.; Kudo, A., Photophysical Properties and Photocatalytic Activities of Bismuth Molybdates under Visible Light Irradiation. The Journal of Physical Chemistry B 2006, 110, (36), 17790-17797.
Powder from Layered Vanadates at Room Temperature and Its Photocatalytic and Photophysical Properties. Journal of the American Chemical Society 1999, 121, (49), 11459-11467.

114
11. Darwent, J. R.; Mills, A., Photo-oxidation of water sensitized by WO3
12. Kato, H.; Sasaki, Y.; Iwase, A.; Kudo, A., Role of Iron Ion Electron Mediator on Photocatalytic Overall Water Splitting under Visible Light Irradiation Using Z-Scheme Systems. Bulletin of the Chemical Society of Japan 2007, 80, (12), 2457-2464.
powder. Journal of the Chemical Society, Faraday Transactions 2: Molecular and Chemical Physics 1982, 78, (2), 359-367.
13. Sasaki, Y.; Iwase, A.; Kato, H.; Kudo, A., The effect of co-catalyst for Z-scheme photocatalysis systems with an Fe3+/Fe2+ electron mediator on overall water splitting under visible light irradiation. Journal of Catalysis 2008, 259, (1), 133-137.
14. Demydov, D.; Klabunde, K. J., Characterization of mixed metal oxides (SrTiO3 and BaTiO3
15. Utamapanya, S.; Klabunde, K. J.; Schlup, J. R., Nanoscale metal oxide particles/clusters as chemical reagents. Synthesis and properties of ultrahigh surface area magnesium hydroxide and magnesium oxide. Chemistry of Materials 1991, 3, (1), 175-181.
) synthesized by a modified aerogel procedure. Journal of Non-Crystalline Solids 2004, 350, 165-172.
16. Diao, Y.; Walawender, W. P.; Sorensen, C. M.; Klabunde, K. J.; Ricker, T., Hydrolysis of Magnesium Methoxide. Effects of Toluene on Gel Structure and Gel Chemistry. Chemistry of Materials 2001, 14, (1), 362-368.
17. Osterloh, F. E., Inorganic Materials as Catalysts for Photochemical Splitting of Water. Chemistry of Materials 2008, 20, (1), 35-54.
18. Rabuffetti, F. A.; Stair, P. C.; Poeppelmeier, K. R., Synthesis-Dependent Surface Acidity and Structure of SrTiO3
19. Salyn, Y. V.; Nefedov, V. I.; Maiorova, A. G.; Kuznetsova, G. N., X-RAY ELECTRON STUDY OF PLATINUM(III) COMPOUNDS WITH ACETAMIDE. Zhurnal Neorganicheskoi Khimii 1978, 23, (3), 829-831.
Nanoparticles. The Journal of Physical Chemistry C 2010, 114, (25), 11056-11067.
20. McEvoy, A. J.; Gissler, W., ESCA SPECTRA AND ELECTRONIC-PROPERTIES OF SOME RUTHENIUM COMPOUNDS. Physica Status Solidi a-Applied Research 1982, 69, (1), K91-K96.
21. Sasaki, Y.; Nemoto, H.; Saito, K.; Kudo, A., Solar Water Splitting Using Powdered Photocatalysts Driven by Z-Schematic Interparticle Electron Transfer without an Electron Mediator. The Journal of Physical Chemistry C 2009, 113, (40), 17536-17542.