photocatalytic and electrochemical combined treatment...
TRANSCRIPT

A
fbbspor©
K
1
crivotatmca
pttt
0d
Journal of Hazardous Materials 149 (2007) 371–378
Photocatalytic and electrochemical combinedtreatment of textile wash water
M.G. Neelavannan ∗, M. Revathi, C. Ahmed BashaCentral Electrochemical Research Institute, Karaikudi 630006, India
Received 28 July 2006; received in revised form 1 April 2007; accepted 2 April 2007Available online 12 April 2007
bstract
Various chemical and physical processes for treatment of textile effluent are not destructive but they only transfer the contaminants from oneorm to another. The presence of high concentration of organic dye and total dissolved solids (TDS) in the effluent that are not removed byiological treatment must be eliminated by an alternative method to the conventional ones is the advanced oxidation process (AOP). A procionlue dye effluent was treated by photo and electrochemical oxidation process as well as by combining photocatalytic degradation using TiO2
uspensions. Chemical oxygen demand (COD) and colour removal can be used to follow the degradation of the organic pollutant. The effects of
H, current density, flow rate of effluent that passes into the reactor and supporting electrolyte were studied. Comparative studies were carried outn photocatalytic and electrochemical process to degrade the procion blue. The maximum COD reduction and colour removal were 96 and 100%,espectively. Photodegradation efficiency of dye was high when photolysis was carried out in the presence of 40 mg/l of TiO2.2007 Elsevier B.V. All rights reserved.
rddwmceSwrmTldw
eywords: Electrooxidation; Photocatalytic; Degradation; Titanium oxide; Dye
. Introduction
Textile industry can be classified into three categories, viz.otton, wool and synthetic fibers depending upon the raw mate-ial used. Generation of wastewater from a textile dye industrys due to the processing operations employed during the con-ersion of fiber to textile fabric. It was estimated that 1–15%f dye was lost during dyeing process hence these textile indus-ries produce large quantities of highly coloured effluents, whichre generally toxic and resistant to destructive action by normalreatment methods. With the new and more stringent environ-
ental policies, the textile industry is bound to face the dauntinghallenges of improving its conventional system of managementnd control of its effluent discharge.
The carcinogenic nature of these dyes and their precursorsose an environmental threat [1–3]. In the process industries,
he cotton yarns are dyed using procion blue reactive dyes. Inextile industry this particular dye is obtained from the combina-ion of four different dyes such as reactive black, reactive green,∗ Corresponding author. Tel.: +91 4565227550; fax: +91 4565227779.E-mail address: [email protected] (M.G. Neelavannan).
pecikfm
304-3894/$ – see front matter © 2007 Elsevier B.V. All rights reserved.oi:10.1016/j.jhazmat.2007.04.025
eactive navy blue and reactive yellow. About 60% of reactiveyes applied on to the cotton fabrics and yarn is hydrolyzed andischarged as the effluent. The dye house releases two types ofastewater, viz., dye bath water and rinse water. The rinse waterainly consists of complex dyestuff and various intermediate
omplexes. It was noticed that in a typical factory the efflu-nt from the dye bath had the COD 5000–6000, TDS 52,000,S 2000 mg/l and pH 9. After dyeing, the fabrics are washedith water to remove the excess dye present in the fabrics by
insing. The wastewater generated due to this operation is com-only called as ‘wash water’ having the value of COD 400–860,S 4000, TDS 3200 mg/l and pH 8. The environmental pol-
ution due to dye bath water is very high. The treatment ofye bath water is also very tedious when compared to washater.Various chemical and physical processes such as chemical
recipitation methods and separation of pollutants, coagulation,lectro coagulation and elimination by adsorption on activatedarbon, etc., are not destructive but they only transfer the contam-
nants from one form to another, therefore, a new and differentind of pollution problem is being faced which in turn callsor further treatment [4–6]. In the recent years, an alternativeethod to the conventional ones is the advanced oxidation pro-
3 Hazardous Materials 149 (2007) 371–378
csp
oTrcdnbeetn
wZeb[u
iuptaon[
aticfvscbatddoo
2
2
aopc
tF
2
F
2
pcteerflrpr
2
together with an ammeter and voltmeter connected to elec-trolytic flow cell (4). The main component of the experimentalsetup is electrochemical flow cell, whose design is based on plateand frame, filter press type arrangement. The electrochemical
Fig. 2. Experimental setup of photo-electrochemical treatment process: (1)
72 M.G. Neelavannan et al. / Journal of
ess (AOP) based on the generation of very reactive speciesuch as hydroxyl radicals that oxidize a broad range of organicollutants non-selectively and quickly [7,8].
The photocatalytic oxidation of organic pollutants (advancedxidation process) has recently received much attention.his is an attractive method to destroy a variety of toxic,
ecalcitrant organic pollutants, both aliphatic and aromaticompounds in wastewater. A particular attention has beenirected towards heterogeneous photocatalytic degradation tech-ique, which makes use of suitable semiconductor, irradiatedy a light source whose energy is higher than or at leastqual to their band gap. Titanium dioxide has been the mostxtensively utilized as photocatalyst, due to its high activityogether with its chemically non-photo corrosives and inertature.
Advanced oxidation process like photocatalysis systemhich includes a combination of semiconductor (e.g., TiO2,nO, CdS, Fe2O3 and ZnS) and UV light [9]. Due to a fasterlectro less transfer to molecular oxygen, TiO2 is found toe more efficient for photocatalytic degradation of pollutants10]. However, widespread use of TiO2 and platinum catalyst isneconomic for large-scale water treatment operation.
Photocatalytic reaction occurs when charge separation isnduced in a large band gap semiconductor by excitation withltraviolet radiation [9–12]. The appeal of this technology is therospect of complete mineralization of the pollutants into pollu-ion free compounds to environment in addition to the abundancend relatively low cost, chemically stable and non-toxic naturef the catalyst. However, the practical application of this tech-ology has been limited due to its low photocatalytic efficiency11].
In this paper, to augment the overall efficiency of the process,study of photocatalytic phenomena in combination with poten-
iality of Ti/TiO2/RuO2-coated anode in the electrolysis processs investigated. Efficiencies of photocatalysis, electrochemi-al and photo and electrochemical treatments were comparedor procion blue abatement and COD reduction. The effect ofarious experimental parameters such as pH, concentration ofupporting electrolyte, current densities and photocatalyst con-entration on the degradation efficiency of the effluent has alsoeen studied. The result showed that combined photocatalyticnd electrochemical process could be efficiently used to degradehe procion blue up to 98 and 100% removal of colour. The degra-ation efficiency was also increased with increase of currentensity and concentration of NaCl. Photodegradation efficiencyf dye was small when photolysis was carried out in the absencef TiO2.
. Materials and methods
.1. Materials
Procion blue dye, TiO2 (Anatase form), H2SO4, NaOH, NaCl
nd Na2CO3 were of laboratory reagent grade and used with-ut further purification. Synthetic effluent was prepared fromrocion blue (a commercially available Reactive Blue dye). Theolour index of the dye was 61211 CI Reactive Blue. It con-rraUt
Fig. 1. Structure of procion blue.
ains one chromogenic system. The structure of dye is shown inig. 1.
.2. Apparatus
The schematic diagram of experimental setup is shown inig. 2, which consists of the following four parts.
.2.1. Solution flow partThe effluent flow part consists of a reservoir (1), double head
eristaltic pump (2), thin film photo reactor (3), electrochemi-al flow reactor (4) and for flow of the effluent 4 mm siliconeubes were used to interconnect them. The effluent flow wasffected by means of a batch recirculation system. The efflu-nt from the reservoir is passed at required flow rate to photoeactor on adjusting the rpm of peristaltic pump, the effluentows down as thin film on the wall of the photo reactor andeaches the electrolytic cell and from the cell, the effluent isumped using the second head of the peristaltic pump back to theeservoir.
.2.2. The current flow partIt consists of a multi-output dc regulated power supply (5)
eservoir containing synthetic effluent, (2) peristaltic pump, (3) photocatalyticeactor, (4) electrochemical flow cell with Ti/RuO2-coated expanded mesh anodend stainless steel cathode, (5) dc regulated power supply (0–2 A, 0–30 V), (6)V lamp (6 W), (7) magnetic stirrer and (8) enlarged view for depicting falling
hin film.

Hazar
rTcwad
2
st5tlnitat5
tplem
2
(t
2
eaocmtdmstT
2
bfpatTu6
(woa
%
wmA
3
setwc5catpHiiwere carried out under batch recirculation conditions for 7 h
TC
S
PEPP
M.G. Neelavannan et al. / Journal of
eactor consists of titanium expanded mesh anode coated withiO2/RuO2 and has an area of 0.4 dm2 and the stainless steelathode of size 70 mm × 70 mm × 1 mm is fixed in a PVC frameith gaskets. The reactor holdup is 130 ml. Necessary provisions
re made for inlet of the effluent into the reactor as well as forischarge of the effluent from the outlet of reactor.
.2.3. UV irradiation partThe light flow part consists of UV lamp (6 W), the light
ources with a photo reactor (3). The thin film photo reac-or comprises a titanium cylindrical container of diameter0 mm and height of 270 mm. The inside wall of the reac-or is coated with RuO2/TiO2 catalytically active immobilizedayer of about 10 � thickness by thermal decomposition tech-ique [12] which consisted of the following steps: dissolutionn isopropanol of RuCl3; varnish application on the pre-reated titanium base; drying at 80 ◦C; thermal decompositiont 500 ◦C; cooling and repeating the above operation till we gethe required layer thickness, finally post-heat treat for 2 h at00 ◦C.
In order to store and allow the effluent along inside walls ofhe reactor a PVC cup is fixed on the top of the container. Aencil type 6 W medium pressure, mercury vapour immersionamp (λ = 365 nm) of 25 mm diameter and 270 mm height ismployed as a source for UV irradiation. Provisions are alsoade for effluent entry and exit to the photo reactor.
.2.4. Dispersion of TiO2
This part consists of a magnetic stirrer (7) and the reservoir1) containing effluent with TiO2 in suspension. The volume ofhe reservoir is 1000 ml.
.3. Analysis of COD
In order to determine the extent of degradation of the efflu-nt chemical oxygen demand (COD) was measured. The CODs the name implies is the oxygen requirement of a sample forxidation of organic and inorganic matter. COD is generallyonsidered as the oxygen equivalent of the amount of organicatter oxidizable by potassium dichromate. The organic mat-
er of the sample is oxidized with a known excess of potassiumichromate in a 50% sulfuric acid solution. The excess dichro-
ate is titrated with a standard solution of ferrous ammoniumulfate solution. The COD of all samples were determined byhe dichromate closed reflux method using Merck ThemoreactorR620.
wuor
able 1onditions of experiment in each treatment process
chemes Dye (mg/l) pH Supporting electr
NaCl Na2C
hoto 50 – – –lectrochemical 50 2 3 1.5hoto and electrochemical 50 2 3 1.5hotocatalytic and electrochemical 50 2 3 1.5
dous Materials 149 (2007) 371–378 373
.4. Determination of concentration of dye
The selection of suitable wavelength in the spectrum cane made during the course of preparing the calibration curveor the unknown samples. The particular wavelength, whichrovides a maximum absorbance value, will be considereds a best choice of wavelength. Procion blue standard solu-ions show maximum absorbance at a wavelength of 605 nm.he UV–vis spectra of all the effluent were measured bysing a spectrophotometer Spectroquant NOVA 60 at λmax =05 nm.
A series of standard solutions of procion blue dye10–50 mg/l) was prepared along with blanks. Using the selectedavelength filter at a time, calibration curves are plotted in termsf absorbance versus concentration and the concentration ofctual samples can then be read directly.
Colour removal was calculated by following formula:
Colour removal = 100[ABSM
o − ABSM]
ABSMo
(1)
here ABSM is the average of absorbance values at its maxi-um absorbency value of visible wavelength (λmax). ABSM
o andBSM are the values before and after the degradation process.
. Experimental
The experimental arrangement shown in Fig. 2 includes aetup for photo thin film phenomena, photo slurry process andlectrochemical cell for treatment. With the aid of experimen-al setup the following four different schemes of experimentsere conducted. For each experiment of the degradation of pro-
ion blue dye, a solution containing known concentration of dye0 mg/l with the supporting electrolyte, usually with the mixtureontaining 3 g/l of NaCl and 1.5 g/l of Na2CO3, was preparednd it was allowed to equilibrate for 30 min in the darkness, thenhe prepared sample was transferred to a 1000 ml reservoir. TheH values were adjusted at desired level using dilute NaOH andCl and thus the pH values were measured with pH meter and
t was set at pH 2. The effluent was continuously stirred dur-ng the treatment process using a magnetic stirrer. Experiments
ith the flow rate of 20 ml/min. The above conditions were fixednless otherwise stated. COD and colour were determined peri-dically to know the extent of degradation of the effluent in theeservoir.
olyte (g/l) Flow rate (ml/min) CD (A/dm2) TiO2 (mg/l)
O3
20 – –20 2.0 –20 2.0 –20 2.0 40

3 Hazar
3
awtptadc
3
bttstad
3
tfcaaceN4t
3
pptdunesifvemFaca
3
rIietwms
opwtbrflol
C
waror
rcc
C
C
woattaeti
i
74 M.G. Neelavannan et al. / Journal of
.1. Photooxidation
Photooxidation occurs when the effluent is passed throughphoto reactor for degradation. In this reactor, the effluent,hich contains dye without any TiO2 suspension, is allowed
o flow as thin film along the walls of the reactor. UV lamp isrovided inside the reactor for UV irradiation to initiate the reac-ion. Here effluent was recirculated for further degradation. CODnd colour were determined periodically to know the extent ofegradation of the effluent in the reservoir. The experiment wasonducted as per the conditions shown in Table 1.
.2. Electrochemical oxidation
In this system, the type of degradation that was carried outy electrolysis was without lamp and TiO2 in the suspension inhe effluent. Anode, cathode and supporting electrolyte initiatehe degradation with the conditions stated in Table 1. In thisystem the effluent was allowed into an electrochemical reac-or. The effluent was recirculated for further degradation. CODnd colour were determined periodically to know the extent ofegradation of the effluent in the reservoir.
.3. Photo and electrochemical oxidation
This is the combined system of degradation. In this scheme,he effluent was allowed for treatment first into the photo reactoror photooxidation. The same effluent was sent to the electro-hemical reactor for further treatment. In this case both photond electrochemical oxidation takes place at different flow ratend current density. The effluent was treated at four differenturrent densities 0.5, 1.0, 1.5, 2.0 A/dm2 as well as with differ-nt supporting electrolyte concentrations of 1, 2, 3, 4, 5 g/l ofaCl. The liquid flow rate into the system was varied as 15, 30,5, 60, 75, 90 ml/min. The experiments were carried out underhe conditions given in Table 1.
.4. Photocatalytic and electrochemical oxidation
In the photocatalytic and electrochemical oxidation the sus-ension of TiO2 was added in the effluent. TiO2 acted ashotocatalyst and it improves the degradation efficiency. Thenhe lamp was switched on to initiate the reaction. During irra-iation, agitation was maintained to keep the suspension forniform reaction and was sampled after an appropriate illumi-ation time. The effluent was allowed into photo reactor first andlectrochemical reactor next. The efficiency of degradation wastudied by varying the amount of TiO2 in suspension, pH andnitial dye concentration. The experiment was conducted withour different amounts of catalyst concentrations in suspension,iz., 20, 30, 40, 50, 60 mg/l and pH from 2 to 12. The sameffluent was recirculated for further degradation. The experi-ents were carried out under the conditions given in Table 1.
urther adsorption experiments were also conducted to know thedsorption of dye on TiO2 catalysts by the increasing the con-entration of dye from 5 to 50 mg/l by measuring the absorbancet each concentration.m
V
dous Materials 149 (2007) 371–378
.5. Theoretical approach
Because of batch recirculation system, the concentration ofeactants or products in the reservoir varies with respect time.t is due to photochemical and electrochemical reaction tak-ng place in the respective reactors. In the photo reactor theffluent is allowed to flow as thin film along the walls ofhe reactor, which is assumed to behave as plug flow reactorhereas the electrochemical reactor is assumed to behave asixed reactor. Both the reactors can be considered to in steady
tate.If k′ is the heterogeneous rate coefficient for the degradation
f organic matter in solution by formation of an electron–holeair in the photo reactor and because the intensity of light and asell as the film thickness are constant, then the rate of degrada-
ion of dye depends only on the concentration of dye which cane assumed to be pseudo-first order kinetics. Treating the photoeactor unidimensionally, by the mass balance in the direction ofow along the y-axis and assuming heterogeneous pseudo-firstrder kinetics, the concentration of dye the degradation wheneaving the photo reactor active volume, AL is given as (Fig. 2)
′ = C exp
[−k′aAL
q
](2)
here q is the volumetric flow rate, A the cross-section areacross the flow, a the specific reaction surface area of the photoeactor (a = πdL/AL), C the concentration of the dye at the inletf the reactor and C′ is the concentration at the outlet of theeactor.
As the same effluent was being passed to the electrochemicaleactor, assuming heterogeneous pseudo-first order kinetic theoncentration of dye the degradation when leaving the electro-hemical reactor, is given as
′′ = C′[
1
1 + k′′a′(Vc/q)
](3a)
′′ = C exp
[k′aAL
q
] [1
1 + k′′a′(Vc/q)
](3b)
here Vc is the volume of electrolytic cell, A′ the anodic areaf electrochemical reactor and a′ the specific electrode surfacerea of the electrochemical reactor (A′/Vc), C′ the concentra-ion of the dye at the inlet of the electro chemical reactor, C′′he concentration at the outlet of the electro chemical reactornd k′′ is the rate coefficient for electrooxidation of dye in pres-nce of chloride and which has been proposed and that occurshrough the cycle chloride–chlorine–hypochlorite–chloride [12]n electrochemical reactor.
In a batch recirculation, if the reactors volumes are insignif-cant compared with reservoir inventory solution volume V, the
ass balance can be written asdC
dt= qC′′ − qC (4)

M.G. Neelavannan et al. / Journal of Hazardous Materials 149 (2007) 371–378 375
Table 2K values for various photo-treatment processes
Schemes K × 104+ (min−1)
Initial End
Photo 25 60Electrochemical 20 4P 20 8P 20 6
Sa
C
a
K
t
C
wvwffii
4
scwp
4pp
tspec
U9gepa
eatdh
aefpie
COD, the current was varied from 0.5 to 2.0 A/dm . The increaseof flow rate reduces the power consumption of the process. Thisis attributable to the preferential oxidation of easily oxidizablematerials. The reduction of COD was directly proportional to
hoto and electrochemicalhotocatalytic and electrochemical
ubstituting for C′′ from the above and the solution is obtaineds
= C0 exp
[−
(qt
V
) {1
1 + k′′a′(Vc/q)
}exp
(−k′aAL
q
)]
(5)
nd defining
= q
V
{1
1 + k′′a′(Vc/q)
}exp
[−k′aAL
q
](6)
hen the expression reduces to
= C0 exp{−Kt} (7)
here C0 is the initial concentration of dye, V the reservoirolume and the plot log[COD] versus time for procion blueas linear assuming that the degradation reaction approximately
ollows the first order kinetics. The constant K was estimatedrom the slope of the log[COD] versus time plot and presentedn Table 2. It is to be noted that K is an implicit value. Thendividual values of rate constants can be computed.
. Results and discussion
The effect of the parameter such as flow rate, current density,upporting electrolyte concentration, pH and weight fraction ofatalysts TiO2, etc., on rate of removal COD from the effluentas investigated depending upon the processes such as photo,hoto-electrochemical and photocatalytic electrochemical.
.1. Performance of photo, electrochemical,hoto-electrochemical, photocatalytic electrochemicalrocesses
In laboratory scale results of experiments conducted underhe conditions given in Table 1 are presented in Figs. 3 and 4 tohow the performance of various treatment processes such ashoto, electrochemical, photo-electrochemical, photocatalyticlectrochemical with respect to percentage removal of COD andolour.
It can be seen from Fig. 3 the presence of both TiO2 andV irradiation, the electrochemical treatment process indicates8% degradation of dye at the irradiation of time of 7 h. The
oal of this comparison is not to show which process is morefficient since they are different process and yields are not com-arable. However, it is useful to show that when both treatmentsre simultaneously applied the resulting dye degradation is moreFig. 3. Performance of various treatment processes.
ffective than a single process. The synergic aspect observed byssisting electrolysis with photocatalysis or vice versa is impor-ant when one considers the need for degradation of some organicye pollutants that usually are recalcitrant to electrochemical oreterogeneous photocatalytic treatments.
In the combined system of degradation, the effluent wasllowed for treatment first into the photo reactor then the sameffluent was sent to the electrochemical reactor to augment forurther treatment. The results on effect of various experimentalarameters such as current densities, concentration of support-ng electrolyte and flow rate on the degradation efficiency of theffluent have been presented in Figs. 5 and 6.
To enumerate the effect of current density on reduction of2
Fig. 4. Comparison of % removal of colour.

376 M.G. Neelavannan et al. / Journal of Hazar
trtttpmfcp
oedimspsppeIbdui
gttcpiwtw
4
tsidiTbau
4
ppfi
ictTwof higher quantities of TiO2 would have no effect on the degra-dation process. Another reason for this may be an increasedopacity of the suspension, brought about as a result of excess of
Fig. 5. Effect of current density on the % removal of COD.
he applied current. Murphy et al. [13] reported that pollutantemoval efficiency at same charge loading was independent uponhe value of current density in a direct electrochemical oxidationreatment process. Fig. 5 shows the effect of current density onhe percentage degradation of procion blue dye along with theercentage decrease in COD after photo-electrochemical treat-ent. An optimum point must be carefully determined giving a
aster removal of COD hence the current density 2 A/dm2 washosen as the optimal current density for the degradation ofrocion blue.
As mass flux depends on the time of operation, the effectf residence time plays an important role in the process. Theasily oxidizable parts present in the effluent contribute to theecrease in the COD at low flow rate. The flow rate of effluentn to the reactor is significantly affected by the reactor perfor-
ance. The decrease in flow rate and increase in current densityignificantly increase the reduction of COD. Experiments wereerformed with various flow rates, i.e. 15–90 ml/min. Fig. 6hows the effect of flow rate on the percentage degradation ofrocion blue along with the percentage decrease in COD afterhoto-electrochemical treatment. It is evident from the figure thextent of degradation of procion blue is maximum at 30 ml/min.t is evident from Fig. 5 that the extent of degradation of procion
lue increases with time and higher increase in applied currentensity of 2 A/dm2 as compared to the other values. NaCl wassed as supporting electrolyte for the electrolysis. The dye isndirectly oxidized by hydroxyl or other oxidant reagent electroFig. 6. Effect of flow rate on the % removal of COD.
T
Fc
dous Materials 149 (2007) 371–378
enerated from the electrolyte (mainly ClO– ions in NaCl), reac-ive species in the background electrolyte. Among all the results,he redox behavior of procion blue in NaCl was good whenompared to other supporting electrolytes. Experiments wereerformed with the different concentrations of NaCl 1–5 g/l andt was found that the photo-electrochemical efficiency increasesith an increase in NaCl concentration up to 4 g/l. Among all
he results, the redox behavior of procion blue in NaCl was goodhen compared to other supporting electrolytes.
.2. UV–vis spectra changes
The changes in the absorption spectra of procion blue solu-ion during the photo-electrochemical process at initial and finaltage are shown in Fig. 7. The spectrum of procion blue in the vis-ble region exhibits a main band with a maximum at 605 nm. Theecrease of adsorption peaks of procion blue at λmax = 605 nmn this figure indicates a rapid degradation of procion blue dye.he decrease is also meaningful with respect to nitrogen doubleond of procion blue dye, as the most active site for oxidativettack. Complete discolouration of dye was observed after 7 hnder the optimized conditions.
.3. Photocatalytic electrochemical processes
In the photocatalytic and electrochemical oxidation the sus-ension of TiO2 was added in the effluent, which acts ashotocatalyst when the effluent was allowed into photo reactorrst and electrochemical reactor next.
The photodegradation efficiency increases with an increasen the amount of photocatalyst, reaches the highest value at aatalyst amount of 40 mg/l and then decreases. The most effec-ive decomposition of procion blue was observed with 40 mg/l ofiO2. The reason of this observation may be due to the fact thathen TiO2 adsorbs all procion blue dye molecules, the addition
iO2 particles [14].
ig. 7. Spectra of procion blue solution during the photo-electrochemical pro-ess at: (a) initial and (b) final stage of treatment.

Hazar
4p
utisImitstcBoa
ptisittmbtmtd
4
atsIo
ectt[
id
deotec
ip
T
O
•
2
•
•
aIr
tdbOomipt(
h
h
h
irrt
5
epsntaTwresults reduction that was found to be 96% and colour removalwas nearly 100% at the current density 2.0 A/dm2 for flow rate
M.G. Neelavannan et al. / Journal of
.4. Effect of pH and initial concentration of dye onhotodegradation
The photodegradation of procion blue dye at different pH val-es ranges from 2 to 12 was studied and it clearly indicated thathe best results were obtained in acidic solution. The pH values one of the major factors influencing the rate of degradation ofome organic compounds in the photocatalytic process [15,16].t is an important operational variable in actual wastewater treat-ent. According to the zero point of charge of TiO2, its surface
s presumably positively charged in acidic solution and nega-ively charged in alkaline solution [17,18]. Since the dye has aulfonic acid group in its structure, which is negatively charged,he acidic solution favours adsorption of dye onto the photo-atalyst surface, thus the photodegradation efficiency increases.ecause the difference between the degree of photodegradationf procion blue, in acidic solution (pH 2) COD removal is 100%nd in neutral (pH 7) it is only 20%.
From the effect of initial procion blue concentration onhotodegradation efficiency, it was observed that the pho-odegradation conversion of procion blue decreases with anncrease in the initial concentration of procion blue. The pre-umed reason is that when the initial concentration of dyes increased, more and more dye molecules are adsorbed onhe surface of TiO2. The large amount of adsorbed dye ishought to have an inhibitive effect on the reaction of dyeolecules with photo-generated holes or hydroxyl radicals,
ecause of the lack of any direct contact between them. Oncehe concentration of dye is increased, it also causes the dye
olecules to adsorb light and therefore the photons never reachhe photocatalyst surface, thus the photodegradation efficiencyecreases.
.5. Kinetics of various photo-treatment processes
The plot log[COD] versus time for procion blue was linearssuming that the degradation reaction approximately followshe first order kinetics. The constant K was estimated from thelope of the log[COD] versus time plot and presented in Table 2.t is to be noted that K is an implicit value. The individual valuesf rate constants can be computed.
The reaction mechanism underlying the oxidation of dye bylectrochemical method has been investigated in presence ofhloride and several schemes have been proposed and reportedhat electrooxidation of dye in presence of chloride ions occurhrough the cycle chloride–chlorine–hypochlorite–chloride12].
Both UV light and a photocatalyst (a semiconductor) asmmobilized thin film or to be in slurry were needed for theegradation of dye.
It has been established that semiconductor initiates theegradation of organic matter in solution by formation of anlectron–hole pair. When TiO2 is illuminated with the light
f λ < 365 nm, electrons are promoted from the valence bando the conduction band of the semiconducting oxide to givelectron–hole pairs [19–22]. Electron in conduction band of theatalyst surface reduces oxygen to superoxide anion. This rad-owsb
dous Materials 149 (2007) 371–378 377
cal, in the presence of organic scavengers, may form organiceroxides or hydrogen peroxide.
iO2 + hν(λ < 365 nm) → TiO2(eCB− + hVB
+) (8)
2(ads) + eCB− → •O2
−(ads) (9)
O2−(ads) + H2O → HO2
• (10)
HO2• → O2 + H2O2 (11)
O2−(ads) + H2O2 → O2 + OH− + •OH(ads) (12)
OH(ads) + dye → Co2 + H2O(degradation of dye) (13)
The hydroxyl radical is a powerful oxidizing agent andttacks organic pollutants present at or near the surface of TiO2.t causes photooxidation of pollutants according to the aboveeactions (7)–(12).
The high oxidative potential of the hole in the catalyst permitshe direct oxidation of organic matter (dye) to reactive interme-iates. Very reactive hydroxyl radicals can also be formed eithery the decomposition of water or by the reaction of the hole withH−. The hydroxyl radical is an extremely strong, non-selectivexidant (Eo = + 3.06 V), which leads to the partial or completeineralization of several organic chemicals. The hydroxyl rad-
cal is a powerful oxidizing agent and attacks organic pollutantsresent at or near the surface of TiO2. It causes photooxida-ion of pollutants according to the following reactions (13)–16)
VB+ + H2O(ads) → H+ + •OH(ads) (14)
VB+ + HO−(ads) → H+ + •OH(ads) (15)
VB+ + dye → dye•+ → oxidation of dye (16)
One of the main purposes of combining electro with photos not only to increase overall efficiency of organic contaminantemoval but also for enhancing discolouration initially by chlo-ination so that photo process can dominate remaining part ofhe process.
. Conclusion
The results of the present studies showed that photocatalyticlectrochemical process could be efficiently used to degrade therocion blue. Photodegradation efficiency of procion dye wasmall when photolysis was carried out in the absence of TiO2 andegligible in the absence of the UV light. The results indicatedhat the degree of degradation of procion blue was obviouslyffected by the initial dye concentration, pH and the amount ofiO2. It is also evident that the optimal amount of photocatalystas 40 mg/l, with dye concentration of 20 mg/l. From the COD
f 30 ml/m respectively. From the inhibitive effect of dye, itas concluded that hydroxyl radicals were the main reactive
pecies, and also it is believed that the positive holes have alsoeen involved.

3 Hazar
A
R
R
[
[
[
[
[
[
[
[
[
[
[
[
78 M.G. Neelavannan et al. / Journal of
cknowledgement
Prof. A.K. Shukla, Director, Central Electrochemicalesearch Institute, Karaikudi, is gratefully acknowledged.
eferences
[1] M.B. Pierre, Applied electrochemistry for a better environment, Chemistry89 (1995).
[2] K. Scott, Electrochemical Process for Clean Technology, The Royal Societyof Chemistry, UK, 1995.
[3] K. Rajeshwar, J.G. Ibanez, Environmental Electrochemistry—Funda-mentals and Applications in Pollution Abatement, Academic Press Inc.,1997.
[4] P. Cooper, Removing colour from dye house wastewater—a criticalreview of technology available, J. Soc. Dyers Colour 109 (1993) 97–100.
[5] S. Balaji, S.J. Chung, R. Thiruvenkatachari, Il.S. Moon, Mediated electro-chemical oxidation process: electro-oxidation of cerium(III) to cerium(IV)in nitric acid medium and a study on phenol degradation by cerium(IV)oxidant, Chem. Eng. J. 125 (2006) 51–57.
[6] O. Tunay, I. Kabdasli, G. Eremektar, D. Orhon, Color removal from textilewastewaters, Water Sci. Tech. 34 (1996) 9–16.
[7] M. Muruganandham, N. Sobana, M. Swaminathan, Solar assisted photo-catalytic and photochemical degradation of Reactive Black 5, J. Hazard.Mater. 137 (2006) 1371–1376.
[8] F. Javier Benitez, J.R. Francisco, L.A. Juan, G. Carolina, Photochemicaloxidation processes for the elimination of phenyl-urea herbicides in waters,J. Hazard. Mater. 138 (2006) 278–287.
[9] M.R. Hoffmann, S.T. Martin, W. Choi, D.W. Bahnemannt, Environmentalapplications of semiconductor photocatalysis, Chem. Rev. 95 (1995) 69–96.
10] A. Fajishima, T.N. Rao, D.A. Tryk, Titanium dioxide photocatalysis, J.Photochem. Photobiol. C: Photochem. Rev. 1 (2000) 1–21.
[
dous Materials 149 (2007) 371–378
11] G. Catherine, J. Patrice, K. Andre, Photo degradation of the amino azobenzene acid orange 52 by three advanced oxidation processes: UV/H2O2,UV/TiO2 and VIS/TiO2. Comparative mechanistic and kinetic investiga-tions, J. Photochem. Photobiol. A 130 (2000) 35–47.
12] S. Raghu, C. Ahmed Basha, Electrochemical treatment of procion Black5B using cylindrical reactor—a pilot plant study, J. Hazard. Mater. 139(2007) 381–390.
13] O.J. Murphy, G.D. Hitchens, L. Kaba, C.E. Verostko, Direct electrochem-ical oxidation of organics for wastewater treatment, Water Res. 26 (1992)443–451.
14] M.S.T. Goncalves, A.M.F. Oliveira-Campos, E.M.M.S. Pinto, P.M.S.Plasencia, M.J.R.P. Queiroz, Photochemical treatment of solutions of azodyes containing TiO2, Chemosphere 39 (1999) 781–786.
15] H.H. Mohammad, H. Ali, M. Shahla, The effect of operational parameterson the photocatalytic degradation of three textile azo dyes in aqueous TiO2
suspensions, J. Photochem. Photobiol. A: Chem. 172 (2005) 89–96.16] C. Wu, X. Liu, D. Wei, J. Fan, L. Wang, Photosonochemical degradation
of phenol in water, Water Res. 35 (2001) 3927–3933.17] O.E. Kartal, M. Erol, H. Oguz, Photocatalytic destruction of phenol by
TiO2 powders, Chem. Eng. Technol. 24 (2001) 645–649.18] J. Fernandez, J. Kiwi, C. Lizama, J. Freer, J. Baeza, H.D. Mansilla, Fac-
torial experimental design of Orange II photocatalytic discolouration, J.Photochem. Photobiol. A 151 (2002) 213–219.
19] N. Daneshvar, D. Salari, A.R. Khataee, Photocatalytic degradation of azodye acid red 14 in water: investigation of the effect of operational parame-ters, J. Photochem. Photobiol. A: Chem. 157 (2003) 111–116.
20] N. Daneshvar, D. Salari, A.R. Khataee, Photocatalytic degradation of azodye acid red 14 in water on ZnO as an alternative catalyst to TiO2, J.Photochem. Photobiol. A: Chem. 162 (2004) 317–322.
21] C. Yingxu, S. Zhenshi, Y. Ye, K. Qiang, Heterogeneous photocatalytic
oxidation of polyvinyl alcohol in water, J. Photochem. Photobiol. A: Chem.142 (2001) 85–89.22] T. Sauer, G. Cesconeto Neto, H.J. Jose, R.F.P.M. Moreira, Kinetics of photo-catalytic degradation of reactive dyes in a TiO2 slurry reactor, J. Photochem.Photobiol. A: 149 (2002) 147–154.

A
poosp©
K
1
tfiaofhd
mvonfIt
toT
1d
Available online at www.sciencedirect.com
Separation and Purification Technology 61 (2008) 168–174
Electrochemical-assisted photocatalytic degradationof textile washwater
M.G. Neelavannan ∗, C. Ahmed BashaCentral Electrochemical Research Institute, Karaikudi, India
Received 13 June 2007; received in revised form 5 October 2007; accepted 5 October 2007
bstract
Photocatalytic methods with TiO2 catalyst were successfully applied to the decomposition of many organic contaminants. In this paper theerformance of an electrochemical-assisted photocatalytic degradation of textile washwater containing procion blue dye was investigated. Severalperational parameters to achieve optimum efficiency of this electrochemical-assisted photocatalytic degradation system have been done. The main
bjective was to determine the chemical oxygen demand (COD) and colour removal of the organic pollutant. The effects of pH, current density,upporting electrolyte, the irradiation time and photocatalyst on treatment efficiency were studied. The results showed that electrochemical-assistedhotocatalytic process was used efficiently with 90% COD removal and complete colour removal after 7 h treatment. 2007 Elsevier B.V. All rights reserved.wate
tcms1antsItrf[
tsor
eywords: Photocatalytic oxidation; Electrooxidation; Dye; TiO2; Textile wash
. Introduction
Application of electrochemical techniques in wastewaterreatment has been acquiring importance in recent years. Therst detailed account has been given in [1]. The 1990s photo-ssisted reactions have been widely utilized in the degradation ofrganic pollutants in textile effluents. Their effectiveness resultsrom the fact that the generated hydroxyl radicals (•OH) areighly reactive and non-selective such that they are able toegrade many organic pollutants [2–4].
In this field, electrochemical and photochemical technologiesay offer an efficient means of controlling pollution as they pro-
ide the degradation of organic pollutants without the drawbacksbserved in conventional treatments. Electrolysis, heteroge-eous photocatalysis, or photo-assisted electrolysis may be usedor organics abatement as a main or supplementary treatment.ndeed, electrons and photons are the only reactants added tohe treatment process that generates no byproducts at all.
Literature summarizes the principles and mechanisms for
he electrochemical treatment of aqueous solutions containingrganic compounds with simultaneous oxygen evolution [5,6].he key for efficient electrolytic treatments strongly based on∗ Corresponding author. Tel.: +91 4565 227550; fax: +91 4565 227779.E-mail address: [email protected] (M.G. Neelavannan).
p
itttA
383-5866/$ – see front matter © 2007 Elsevier B.V. All rights reserved.oi:10.1016/j.seppur.2007.10.009
r
he anode material choice. High corrosion resistances, physi-al and chemical stability under high positive potentials are theain requests. When properties as above are required, dimen-
ionally stable anodes (DSA), as those discovered by Beer in the970s are the natural candidates [7]. This designation denotesclass of thermally prepared oxide electrodes where a tita-
ium substrate is covered by metallic oxides. Coatings ontoitanium include TiO2, IrO2, RuO2, and Ta2O5. Combinations,uch as TiO2/RuO2, are indicated for alkaline medium, whilerO2/Ta2O5 usually shows longer service life in acidic elec-rolytes. On the other hand, some DSA type oxide electrodes mayeceive additions of SnO2 and Sb2O5 in concentrations rangingrom minor to main components which increase the service life3].
Heterogeneous photocatalysis as a tool for aqueous effluentreatment is based on the oxidation of an organic pollutant on theurface of a semiconductor catalyst, especially the anatase formf TiO2 particles. Ioannis et al. and Triantafyllos [8] reviewedecent works in this area and listed the compounds degraded byhotocatalysis by various researchers.
Electrochemically assisted photocatalytic process for organ-cs oxidation has been described in the literature demonstrating
he dependence of organics mineralization rate on TiO2 concen-ration; illumination intensity; organic pollutant concentration;emperature; and pH and type of anions in the solution [9–12].s the TiO2 catalyst is kept in suspension during illumination,
ation
smtc[
hbecSt[rtaeSfnoiFi
auitpfvdpwbsim
teIwEpwt
2
2
acc6aF
2
Fcvoiatmiao
M.G. Neelavannan, C. Ahmed Basha / Separ
eparation of the solid phase must be carried out after treat-ent. Although, many studies have been reported in an effort
o find the most efficient technique, coagulation with aluminumhloride allows the separation and reuse of the TiO2 catalyst13].
Immobilization of TiO2 catalyst on a conductive substrateas been tried. By cycling potential, anatase has been immo-ilized onto an optically transparent SnO2 conducting glasslectrode for mechanistic studies of oxidation of selected organicompounds and for the determination of oxidation potentials.puttering has also been used for the immobilization of TiO2,
hus obtaining different stoichiometries and crystal structures14]. Although somewhat delayed, it has been noted that theutile form of TiO2 may also present photocatalytic proper-ies and, when immobilized on a conductive substrate undern applied bias potential, may have improved its oxidativefficiency due to the electron–hole recombination reduction.imilar photo-assisted processes of electrolysis have been usedor the degradation of reactive dyes and for the oxidation ofitride ion and of phenol [15]. This property of the rutile structuref TiO2 allows the use of some types of DSA oxide electrodesn which this allotropic form of TiO2 is the major component.ig. 1 shows the TiO2-photosensitisation pathway under UV
rradiation.The main objective of this study is the electrochemical-
ssisted photocatalytic degradation of textile washwater bysing TiO2 as a photocatalyst. This is the new approach ofntegrating two techniques in which the process consists of elec-rochemical oxidation and photocatalytic degradation. The tworocesses concurrently operate to remove the organic pollutantsrom the textile washwater. The influences of some importantariables on the degradation of procion blue are discussed inetail. In this paper the synthetic effluent was prepared fromrocion blue dye (a commercial reactive blue dye) and NaClas used as supporting electrolyte. UV irradiation was provided
y 6 W pencil type immersion lamp. During the electroly-is on a batch process, COD reduction, colour removal werenvestigated on TiO2 as semiconductor at selected electrolyteedium, current densities and pH. Also a study of the poten-
Fig. 1. TiO2-photosensitisation pathway under UV irradiation.
arfoipwaetci
and Purification Technology 61 (2008) 168–174 169
iality of a titanium anode, coated with 70TiO2/30RuO2, for thelectrochemical-assisted photocatalytic process is investigated.n experiments, a synthetic solution containing procion blue dyeas used in order to follow the performance of this electrode.fficiency of electrochemical, photo, electrochemical-assistedhoto, and electrochemical-assisted photocatalytic treatmentsere compared for the procion blue abatement and COD reduc-
ion.
. Materials and methods
.1. Materials
Procion blue dye, TiO2 (Anatase form), H2SO4, NaOH, NaClnd Na2CO3 (laboratory grade) were used without further purifi-ation. Synthetic effluent was prepared from procion blue (aommercial reactive blue dye). The colour index of the dye was1211 reactive blue which contains one chromogenic systemnd λmax is 605 nm. The structure of procion blue is given inig. 2.
.2. Apparatus
The schematic diagram of experimental setup is shown inig. 3. This setup consists of four parts. The effluent part whichonsists of stainless steel cylindrical vessel was used as a reser-oir and cathode. The effluent was stored in the cathode withr without the suspension of photocatalyst and it was broughtnto effect by batch system. The electrical circuit part consists ofmulti output dc regulated power supply together with amme-
er and voltmeter connected to electrolytic batch reactor. Theain component of the experimental setup is photoelectrochem-
cal reactor, whose design was based on cylindrical cell typerrangement. The photoelectrochemical reactor consists of cath-de made up of stainless steel cylinder of size 7 cm diameternd 20 cm length and the bottom was closed by a PVC disc withubber gaskets. In the top of the cathode there is a provisionor holding the UV lamp. Anode which is cylindrical in shapef 3.5 cm in diameter and 15 cm long made up of RuO2/TiO2mmobilized layer of about 10 �m thickness by thermal decom-osition method. Anode is placed inside a cathode and the sameas fixed rigidly on a PVC lid with the help of eraldite. This part
lso consists of a magnetic stirrer to mix the catalyst with the
ffluent properly. Necessary provisions were made for samplinghe effluent during the investigation. The UV irradiation partonsists of a pencil type 6 W medium pressure, mercury vapourmmersion lamp (λ = 365 nm) of size 2.5 cm diameter and 27 cmFig. 2. Structure of procion blue.

170 M.G. Neelavannan, C. Ahmed Basha / Separation an
Fp
hptv
2
cWsokt1l
tTdpts7Ctc
2
wstisrd
2
ptipwpT1
2
scdrspetT
TC
S
PEEE
ig. 3. Experimental setup of electrochemical-assisted photocatalytic treatmentrocess.
eight is placed inside the reactor. Dispersion of photocatalystart consists of a magnetic stirrer and the photocatalytic reac-or which contains the effluent along with photocatalysts. Theolume of the batch reactor was 700 ml.
.3. Methods
The experimental setup of electrochemical-assisted photo-atalytic treatment of textile wastewater is shown in Fig. 3.ith the aid of experimental setup the following four different
chemes of experiments were conducted. For each experimentf the degradation of procion blue dye, a solution containing
nown concentration of dye 0.1 g/l with the supporting elec-rolyte, usually with the mixture containing 3 g/l of NaCl and.5 g/l of Na2CO3, was prepared and it was allowed to equi-ibrate for 30 min in the darkness. The prepared sample wascdtf
able 1onditions of experiment in each treatment processes
chemes Dye (mg/l) pH
hoto 100 –lectrochemical 100 3.5lectrochemical-assisted photo 100 3.5lectrochemical-assisted Photocatalytic 100 3.5
d Purification Technology 61 (2008) 168–174
ransferred to a photoelectrochemical reactor of volume 700 ml.he pH of the effluent was adjusted to a desired level usingilute NaOH and HCl. The pH values were measured by usingH meter (Dot 491) and it was set at pH 4. The effluent was con-inuously stirred during the treatment process using a magnetictirrer. Experiments were carried out under batch conditions forh. The above conditions were fixed unless otherwise stated.OD and colour removal were determined periodically to know
he extent of degradation of the effluent. The experiment wasonducted as per the conditions shown in Table 1.
.3.1. Electrochemical oxidationIn this system, the effluent was treated electrochemically
ithout UV lamp and photocatalyst (TiO2). Anode, cathode andupporting electrolyte initiate the degradation as per the condi-ions stated in Table 1. In this system, the effluent was allowednto the reactor for the degradation of pollutants by electroly-is at different current densities. Reduction of COD and colouremoval were determined periodically to know the extent ofegradation of the effluent in the reservoir.
.3.2. Electrochemical-assisted photooxidationThis is the combined system of both electrochemical and
hotodegradation. In this scheme, the effluent was allowed tohe reactor for electrolysis. In addition to this the effluent wasrradiated by a 6 W UV lamp emitting 365 nm wavelength forhotooxidation. In the present system the effluent was treatedithout any suspensions of semiconductor. In this case bothhoto and electrochemical oxidation takes place simultaneously.he effluent was treated at four different current densities 0.5,.0, 1.5, 2.0 A/dm2 under the conditions given in Table 1.
.3.3. Electrochemical assisted photocatalytic oxidationIn this electrochemical-assisted photocatalytic oxidation, the
uspension of TiO2 was added in the effluent at differentoncentration. TiO2 acted as photocatalyst and improves theegradation efficiency. The lamp was switched on to initiate theeaction. During irradiation, agitation was given by magnetictirrer to keep the suspension for uniform reaction and sam-les were collected after an appropriate illumination time. Thefficiency of degradation was studied by varying the concentra-ion of catalyst in suspension, pH and initial dye concentration.he experiment was conducted with four different amounts of
atalyst concentrations in suspension viz., 35–85 mg/l and threeifferent pH, i.e., 3.5, 6.9 and 9.8. The same effluent was allowedo carryout electrochemical-assisted photocatalytic oxidation forurther degradation as per the conditions given in Table 1.Supporting electrolyte CD (A/dm2) TiO2 (mg/l)
NaCl g/l Na2CO3 (g/l)
– – – –3 1.5 2.0 –3 1.5 2.0 –3 1.5 2.0 65

ation
2
oddT
2
mtaoaaS
(sa
%
wmv
2
ectt[
id
deotelto
T
O
•
2
•
•
aIr
tdbOomipo
h
h
h
obt
ppsgfdeu
C
wsefr
The plot log[COD] versus time for procion blue was linearassuming that the degradation reaction approximately followsthe first order kinetics. The constant k was estimated from theslope of the log[COD] versus time plot and presented in Table 2.
Table 2K-values for various treatment processes
Schemes K × 104 min−1
Initial Final
M.G. Neelavannan, C. Ahmed Basha / Separ
.4. Analysis of COD
To know the extent of degradation of the effluent chemicalxygen demand (COD) was measured according to the stan-ard methods. The COD of all samples were determined by theichromate closed reflux method using Merck ThemoreactorR620.
.5. Determination of colour
The selection of suitable wavelength in the spectrum can beade during the course of preparing of the calibration curve for
he unknown samples. The particular wavelength which providesmaximum absorbance value will be considered as a best choicef wavelength. Procion blue standard solutions show maximumbsorbance at a wavelength of 605 nm. The UV–vis spectra ofll the effluent were measured by using a spectrophotometerpectroquant NOVA 60 at λmax = 605 nm.
A series of standard solutions of procion blue dye100–500 mg/l) was prepared along with blanks. Using theelected wavelength filter at a time, calibration curves are plottednd the concentration of actual samples calculated directly.
Colour removal was calculated by following formula:
color removal = 100 [ABSM0 − ABSM]
ABSM0
here ABSM is the average of absorbance values as it is maxi-um absorbency value of wavelength: ABSM
0 the value ABSM
alue before and after the degradation process.
.6. Kinetics of various treatment processes
The reaction mechanism underlying the oxidation of dye bylectrochemical method has been investigated in presence ofhloride and several schemes have been proposed and reportedhat electrooxidation of dye in presence of chloride ions occurhrough the cycle chloride–chlorine–hypochlorite–chloride16].
Both UV light and a photocatalyst (a semiconductor) asmmobilized thin film or to be in slurry were needed for theegradation of dye.
It has been established that semiconductor initiates theegradation of organic matter in solution by formation of anlectron–hole pair. When TiO2 is illuminated with the lightf λ < 365 nm, electrons are promoted from the valance bando the conduction band of the semiconducting oxide to givelectron–hole pairs [17]. Electron in conduction band of the cata-yst surface reduces oxygen to super oxide anion. This radical, inhe presence of organic scavengers, may form organic peroxidesr hydrogen peroxide
iO2 + hυ (λ < 365 nm) → TiO2(e−CB + h+
VB) (1)
2(ads) + e−CB → •O−
2 (ads) (2)
O2− (ads) + H2O → HO2
• (3)
HO2• → O2 + H2O2 (4)
PEEE
and Purification Technology 61 (2008) 168–174 171
O2− (ads) + H2O2 → O2 + OH− + •OH (ads) (5)
OH (ads) + dye → CO2 + H2O (degradation of dye) (6)
The hydroxyl radical is a powerful oxidizing agent andttacks organic pollutants present at or near the surface of TiO2.t causes photooxidation of pollutants according to the aboveeactions (1)–(6).
The high oxidative potential of the hole in the catalyst permitshe direct oxidation of organic matter (dye) to reactive interme-iates. Very reactive hydroxyl radicals can also be formed eithery the decomposition of water or by the reaction of the hole withH−. The hydroxyl radical is an extremely strong, non-selectivexidant (Eo = + 3.06 V), which leads to the partial or completeineralization of several organic chemicals. The hydroxyl rad-
cal is a powerful oxidizing agent and attacks organic pollutantsresent at or near the surface of TiO2. It causes photooxidationf pollutants according to the following reactions (7)–(9)
+VB + H2O (ads) → H+ + •OH (ads) (7)
+VB + HO−(ads) → H+ + •OH (ads) (8)
+VB + dye → dye•+ → oxidation of dye (9)
The objective of electro-assisted photocatalytic is that notnly to increase overall efficiency of organic pollutant removalut also for enhancing discolouration initially by chlorination sohat photoprocess can dominate remaining part of the process.
Because of batch system, the concentration of reactants orroducts in the reactor varies with respect time. It is due tohotochemical and electrochemical reaction taking place in theame reactor. In this reactor the effluent was allowed undero degradation due photo as well as electrochemical reactionollowing heterogeneous pseudo first order kinetics. The dyeegradation the reactor active volume due to photochemical andlectrochemical reaction simultaneously, the concentration ofnreacted dye can be obtained from the following equation
= C0 exp [−kpapt] + C0 exp [−keaet] (10)
here ae is the specific electrode reaction area, [Ae/Vr], ap is thepecific surface area of the UV lamp, [Ap/Vr], ke is the rate co-fficient for electrochemical l reaction, kp is the rate co-efficientor photoreaction and C is the concentration of the dye in theeactor.
hoto 13.2 1.8lectrochemical 44.4 9.6lectrochemical-assisted Photo 6 12.6lectrochemical-assisted Photocatalytic 12.6 22.8
1 on and Purification Technology 61 (2008) 168–174
Io
3
prce
3
sarT
tasdiotiwdh
3
f‘i
Fpo
Fpo
tcmmtT
spaFpilp
72 M.G. Neelavannan, C. Ahmed Basha / Separati
t is to be noted that k is an implicit value. The individual valuesf rate constants can be computed.
. Results and discussion
The effect of the parameters such as pH, current density, theresence of TiO2 in the effluent on rate of COD removal andemoval of colour were investigated depending upon, electro-hemical, photo, electrochemical-assisted photodegradation andlectrochemical-assisted photocatalytic degradation processes.
.1. Comparison among various process.
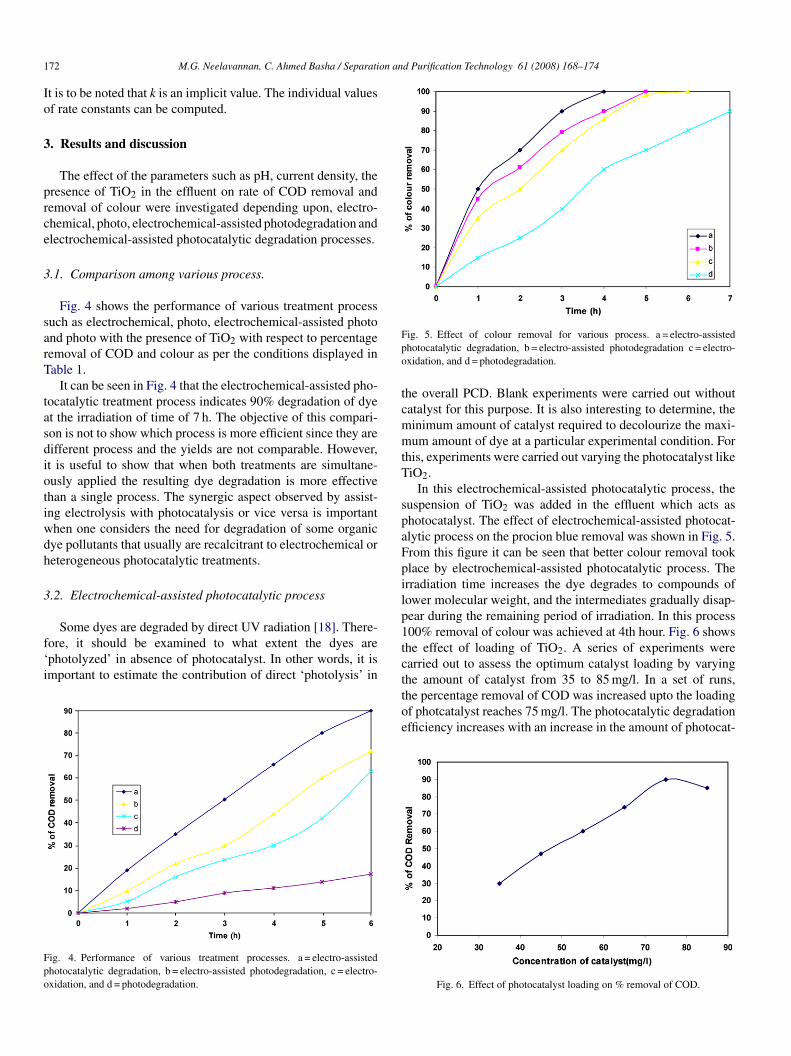
Fig. 4 shows the performance of various treatment processuch as electrochemical, photo, electrochemical-assisted photond photo with the presence of TiO2 with respect to percentageemoval of COD and colour as per the conditions displayed inable 1.
It can be seen in Fig. 4 that the electrochemical-assisted pho-ocatalytic treatment process indicates 90% degradation of dyet the irradiation of time of 7 h. The objective of this compari-on is not to show which process is more efficient since they areifferent process and the yields are not comparable. However,t is useful to show that when both treatments are simultane-usly applied the resulting dye degradation is more effectivehan a single process. The synergic aspect observed by assist-ng electrolysis with photocatalysis or vice versa is importanthen one considers the need for degradation of some organicye pollutants that usually are recalcitrant to electrochemical oreterogeneous photocatalytic treatments.
.2. Electrochemical-assisted photocatalytic process
Some dyes are degraded by direct UV radiation [18]. There-ore, it should be examined to what extent the dyes arephotolyzed’ in absence of photocatalyst. In other words, it ismportant to estimate the contribution of direct ‘photolysis’ in
ig. 4. Performance of various treatment processes. a = electro-assistedhotocatalytic degradation, b = electro-assisted photodegradation, c = electro-xidation, and d = photodegradation.
1tcttoe
ig. 5. Effect of colour removal for various process. a = electro-assistedhotocatalytic degradation, b = electro-assisted photodegradation c = electro-xidation, and d = photodegradation.
he overall PCD. Blank experiments were carried out withoutatalyst for this purpose. It is also interesting to determine, theinimum amount of catalyst required to decolourize the maxi-um amount of dye at a particular experimental condition. For
his, experiments were carried out varying the photocatalyst likeiO2.
In this electrochemical-assisted photocatalytic process, theuspension of TiO2 was added in the effluent which acts ashotocatalyst. The effect of electrochemical-assisted photocat-lytic process on the procion blue removal was shown in Fig. 5.rom this figure it can be seen that better colour removal tooklace by electrochemical-assisted photocatalytic process. Therradiation time increases the dye degrades to compounds ofower molecular weight, and the intermediates gradually disap-ear during the remaining period of irradiation. In this process00% removal of colour was achieved at 4th hour. Fig. 6 showshe effect of loading of TiO2. A series of experiments werearried out to assess the optimum catalyst loading by varying
he amount of catalyst from 35 to 85 mg/l. In a set of runs,he percentage removal of COD was increased upto the loadingf photcatalyst reaches 75 mg/l. The photocatalytic degradationfficiency increases with an increase in the amount of photocat-Fig. 6. Effect of photocatalyst loading on % removal of COD.

M.G. Neelavannan, C. Ahmed Basha / Separation and Purification Technology 61 (2008) 168–174 173
aacocTrb
3
otdtnnusspeccofodsw
3
CtMa
cpadtiwp
oeditac
sriagmAN
3
bctsr
Fig. 7. Effect of pH on the % removal of COD.
lyst, reaches the highest value at a catalyst amount of 75 mg/lnd then decreases. The most effective decomposition of pro-ion blue was observed at 75 mg/l of TiO2. The reason of thisbservation may due to the fact that when TiO2 adsorbs all pro-ion blue dye molecules, the addition of higher quantities ofiO2 would have no effect on the degradation process. Anothereason for this may be an increased opacity of the suspension,rought about as a result of excess of TiO2 particles [19].
.3. Effect of pH
Because of the amphoteric behaviour of most semiconductorxides, an important parameter governing the rate of reactionaking place on semiconductor particle surfaces is the pH of theispersions, since; it influences the surface-charge-properties ofhe photocatalyst [20]. Further, industrial effluents may not beeutral. Therefore, the effect of pH on the rate of degradationeeds to be considered. Experiments were carried out at pH val-es of 3.5, 6.9, and 9.8, using 0.1 g/l procion blue solutions. Fig. 7hows the effect of pH on removal of COD. As it can be seen,trong acid conditions favor dye degradation by photocatalyticrocess. Thus, the highest decolourization and mineralizationxtents were obtained at pH 3.5. According to the zero pointharge of semiconductors its surface is presumably positivelyharged in acidic and negatively in basic medium. When therganic dye as a contaminant contains negatively charged sul-onate groups in the structure, acidic solution favors adsorptionf the dye on to the semiconductor surface, thus increasingegradation efficiency of photocatalytic process. Change in pHhifts the redox-potentials of valance and conduction bands,hich may affect interfacial charge-transfer [15,21–23].
.4. Effect of current densities and supporting electrolyte
To enumerate the effect of current density on reduction of
OD, the current was varied from 0.5 to 2.0 A/dm2. The reduc-ion of COD was directly proportional to the applied current.urphy et al. [24] reported that pollutant removal efficiency
t same charge loading was independent upon the value of
diTb
Fig. 8. Effect of current density on the % removal of COD.
urrent density in a direct electrochemical oxidation treatmentrocess. Fig. 8 shows the effect of current density on the percent-ge degradation of procion blue dye along with the percentageecrease in COD after electrochemically assisted photocatalyticreatment. An optimum point must be carefully determined giv-ng a faster removal of COD. Hence the current density 2 A/dm2
as chosen as the optimal current density for the degradation ofrocion blue.
As mass flux depends on the time of operation, the effectf residence time plays an important role in the process. Theasily oxidizable parts present in the effluent contribute to theecrease in the COD under batch condition. In this study exper-ments were performed under batch conditions. It is evident thathe extent of degradation of procion blue increases with timend higher increase in applied current density of 2 A/dm2 asompared to the other values.
NaCl was used as supporting electrolyte for the electroly-is. The dye is indirectly oxidized by hydroxyl or other oxidanteagent electro generated from the electrolyte (mainly ClO− ionsn NaCl), reactive species in the background electrolyte. Amongll the results, the redox behavior of procion blue in NaCl wasood when compared to other supporting electrolytes. Experi-ents were performed with the concentration of 3 g/l of NaCl.mong all the results, the redox behaviour of procion blue inaCl was good when compared to other supporting electrolytes.
.5. UV–vis spectra changes
Typical UV spectra and of untreated and treated effluent haseen done for the effluent used in the present investigation. Thehanges in the absorption spectra of procion blue solution duringhe photoelectrochemical process at initial and final stage arehown in Fig. 9. The spectrum of procion blue in the visibleegion exhibits a main band with a maximum at 605 nm. The
ecrease of adsorption peaks of procion blue at λmax = 605 nmn this figure indicates a rapid degradation of procion blue dye.he decrease is also meaningful with respect to nitrogen doubleond of procion blue dye, as the most active site for oxidative
174 M.G. Neelavannan, C. Ahmed Basha / Separation an
Fp
au
4
pppoSbhrsebtrtep
A
c
R
[
[
[
[
[
[
[
[
[
[
[
[
[
[
ig. 9. Spectra of procion blue solution during the electrochemical-assistedhotocatalytic process.
ttack. Complete discolouration of dye was observed after 7 hnder the optimized conditions.
. Conclusions
The results indicate the importance of the operationalarameters towards obtaining high electrochemical-assistedhotocatalytic degradation rate. It has been found that type ofrocess used was the main factor that has strong influencesn degradation of textile washwater containing procion blue.tirring of the effluent acts to promote the degradation rate byringing more dye molecules closer to the electrode surface andydroxyl radical produced at the interface can also react moreandomly with the dye in the washwater. The additives such asodium carbonate and sodium chloride are hindering the rate oflectrochemical-assisted photocatalytic degradation but it cane removed by diluting the dye solution to appropriate concen-ration. The percentage removal of COD 90% and 100% colouremoval were found to be the presence of TiO2. It is evidenthat TiO2 catalyzed photodegradation using UV irradiation withlectrochemical treatment is a better technique for removal oforcion blue dye in waste water from textile industries.
cknowledgement
We gratefully acknowledge the Director, Central Electro-hemical Research Institute, Karaikudi.
eferences
[1] E.A. Clesceri, A. Greenberg, Standard Methods for Examinations of Waterand Waste Water, 19th ed., APHA, AWWA and WEF, Washington, DC,1995.
[2] M.B. Pierre, Applied electrochemistry for a better environment, Chemistry89 (1995) 742.
[
d Purification Technology 61 (2008) 168–174
[3] K. Scott, Electrochemical Process for Clean Technology, The Royal Societyof Chemistry, UK, 1995.
[4] K. Rajeshwar, J.G. Ibanez, Environmental Electrochemistry—Fundamental and Applications in pollution abatement, AcademicPress, Inc., 1997.
[5] J.O.M. Bockris, Environmental Chemistry, Plenum Press, 1989.[6] P. Cooper, Removing color from dye house wastewater—a critical review
of technology available, J. Soc. Dyers Color. 109 (1993) 97.[7] C. Comninellis, in: C.A.C. Sequeira (Ed.), Electrochemical Oxidation of
Organic Pollutants for Wastewater Treatment in Environmental OrientedElectrochemistry, Elsevier, Amsterdam, 1994, p. 77.
[8] K.K. Ioannis, A.A. Triantafyllos, TiO2-assisted photocatalytic degradationof azo dyes in aqueous solution: kinetic and mechanistic investigations: areview, Appl. Catal. B: Environ. 49 (2004) 1.
[9] J. Fernandez, J. Kiwi, C. Lizama, J. Freer, J. Baeza, H.D. Mansilla, Fac-torial experimental design of Orange II photocatalytic discoloration, J.Photochem. Photobiol. A 151 (2002) 213.
10] Z. Zainal, C.Y. Lee, M.Z. Hussein, A. Kassim, N.A. Yusof,Electrochemical-assisted photodegradation of dye on TiO2 thin films:investigation on the effect of operational parameters, J. Hazard. Mater.118 (2005) 197.
11] O. Tunay, I. Kabdasli, G. Eremektar, D. Orhon, Color removal from textilewaste waters, Water Sci. Technol. 34 (1996) 9.
12] W.S. Kuo, P.H. Ho, Solar photocatalytic decolorization of methylene bluein water, Chemosphere 45 (2001) 77.
13] O. Legrini, E. Oliveros, A.M. Braun, Photochemical processes for watertreatment, Chem. Rev. 93 (1993) 671.
14] R. Hoffmann, S.T. Martin, W. Choi, D.W. Bahnemann, Environmen-tal applications of semiconductor photocatalysis, Chem. Rev. 95 (1995)69.
15] O.E. Kartal, M. Erol, H. Oguz, Photocatalytic destruction of phenol byTiO2 powders, Chem. Eng. Technol. 24 (2001) 645.
16] S. Raghu, C. Ahmed Basha, Electrochemical treatment of procion Black5B using cylindrical reactor—a pilot plant study, J. Hazard. Mater. B 139(2007) 381.
17] N. Daneshvar, D. Salari, A.R. Khataee, Photocatalytic degradation of azodye acid red 14 in water: investigation of the effect of operational parame-ters, J. Photochem. Photobiol. A: Chem. 157 (2003) 111.
18] S. Chakrabarti, B.K. Dutta, Photocatalytic degradation of model textiledyes in wastewater using ZnO as semiconductor catalyst, J. Hazard. Mater.B 112 (2004) 269.
19] S. Sakthivel, B. Neppolian, M.V. Shankar, B. Arabindoo, M. Palanichamy,V. Murugesan, Solar photocatalytic degradation of azo dye: comparison ofphotocatalytic efficiency of ZnO and TiO2, Sol. Energy Mater. Sol. Cells77 (2003) 65.
20] N. Daneshvar, D. Salari, A.R. Khataee, Photocatalytic degradation of azodye acid red 14 in water on ZnO as an alternative catalyst to TiO2, J.Photochem. Photobiol. A: Chem. 162 (2004) 317.
21] C. Lizama, J. Freer, J. Baeza, H.D. Mansilla, Optimized photodegradationof reactive blue 19 on TiO2 and ZnO suspensions, Catal. Today 76 (2002)235.
22] C. Galindo, P. Jacques, A. Kalt, Photo oxidation of the phenylazonaptholAO20 on TiO2: kinetic and mechanistic investigations, Chemosphere 45(2001) 997.
23] C. Galindo, P. Jacques, A. Kalt, Photo degradation of the amino azo ben-zene acid orange 52 by three advanced oxidation processes: UV/H2O2,
UV/TiO2 and VIS/TiO2. Comparative mechanistic and kinetic investiga-tions, J. Photochem. Photobiol. A 130 (2000) 35.24] O.J. Murphy, G.D. Hitchens, L. Kaba, C.E. Verostko, Direct electrochem-ical oxidation of organics for wastewater treatment, Water Res. 26 (1992)443.

XML Template (2010) [9.2.2010–2:49pm] [1–12] Copyedited by: RA QA by: RA Collated by: BV{TANDF_FPP}GTEC/GTEC_A_459674.3d (GTEC) [PREPRINTER stage]
Toxicological & Environmental ChemistryVol. ??, No. ?, Month?? 2010, 1–12
Ag–TiO2 doped photo catalytic degradation of Procion blue
H-B dye in textile washwater
M.G. Neelavannan* and C. Ahmed Basha
Pollution Control Section, Central Electrochemical Research Institute,
5 Karaikudi 630006, Tamil Nadu, India
(Received 2 July 2009; final version received 2 January 2010)
The photocatalytic degradation of Procion blue H-B dye in biodegradedtextile washwater has been investigated for the complete removal of colorand maximum reduction of chemical oxygen demand (COD). Pseudomonas
10 putida was utilized for obtaining biodegraded textile washwater. In thisprocess, silver-doped TiO2 photocatalyst was prepared and experimentswere carried out to study the effects of UV and mercury lamp irradiationson COD reduction and removal of color. The thus prepared silver-dopedTiO2 catalyst was characterized by thermogravimetric and differential
15 thermal analysis, UV-visible spectrometer, X-ray diffraction, scanningelectron microscope, energy dispersive X-ray microanalysis, and BETsurface area techniques. Adsorption studies were also carried out toevaluate the fitness of isotherm models. The results show that thesilver-doped TiO2 has enhanced the photodegradation of Procion blue
20 H-B dye under UV and mercury lamp irradiations. The enhanced activityof silver-doped TiO2 is due to the enrichment of electron–hole separationby electron trapping of silver particles.
Keywords: Procion blue H-B dye; photocatalysis; silver doping; TiO2;washwater; COD
25 Introduction
Discharge of dyehouse effluents with biocalcitrant organic pollutants has led to thedevelopment of new technologies for the treatment of wastewater. Dye effluentscan be treated by biological methods, flocculation, adsorption on activated carbon,chemical oxidation methods, reverse osmosis, and advanced oxidation processes
30 (Slokar and Marechal 1998). Biological methods alone have been proved to beunsuccessful for the treatment of textile wastewater (Pearce, Lloyd, and Guthrie2003). Flocculation, reverse osmosis, and adsorption methods transfer thepollutants to other media, thus causing secondary pollution (Goutley, Buckley,and Groves 1983). Moreover, chemical oxidation methods are not cost effective
35 (Baban et al. 2003).In this effort, heterogeneous photocatalysis has been identified as one of the most
potential pollution remedial technologies in recent decades (Corma and Garcia2004; Oller et al. 2006). Semiconductor photocatalyst generates electron and hole
*Corresponding author. Email: [email protected]
ISSN 0277–2248 print/ISSN 1029–0486 online
� 2010 Taylor & Francis
DOI: 10.1080/02772241003591650
http://www.informaworld.com

XML Template (2010) [9.2.2010–2:49pm] [1–12] Copyedited by: RA QA by: RA Collated by: BV{TANDF_FPP}GTEC/GTEC_A_459674.3d (GTEC) [PREPRINTER stage]
pair (e�/hþ) upon irradiation of light energy that could be utilized in initiating40 oxidation and reduction reactions, respectively. Low electron transfer rate to oxygen
and high electron–hole pairs’ recombination rate limit the rate of photo-oxidationof organic compounds on the catalyst surface significantly (Linsebiger, Lu, andYates 1995). The effects of various factors influencing photocatalytic degradation,such as pH, concentration of dye, dosage of photocatalyst on the photodegradation
45 of Procion blue by electro-assisted photocatalytic degradation have been studied(Neelavannan, Revathi, and Basha 2007).
Considerable investigations have been focused on improving photocatalyticactivity of titania using dopants and surface deposition of noble metals to broadenthe absorption of UV by TiO2 and reduce recombination odds of photoexcited
50 carriers. Emerging techniques, such as ozonation treatment using Fenton’s reagent,electrochemical destruction, and photocatalysis may have considerable potentialfor discoloration. However, such technologies either usually involve complicatedprocedures or are economically unfeasible (Chang and Lin 2000). Biological and/orcombination treatment systems that can effectively remove dyes from large volumes
55 of wastewater at a low cost are considered to offer a preferable alternative (Robinsonet al. 2001). Several researchers have studied the degradation of different textile dyesusing silver-doped titanium dioxide by photocatalytic methods (Arabatzis et al. 2003;Ozkan et al. 2004; Sahoo, Gupta, and Pal 2005; Rupa et al. 2007).
The photocatalytic activity with silver deposit was less augmented than with60 platinum deposit and at times is even detrimental (Vamathevan et al. 2002). It is also
found that the presence of nanosized silver particles on the TiO2 surface couldaugment the activity of TiO2 by a factor of 4.0 for the mineralization of sucrose.For the treatment of dye wastewater, TiO2 modified with silver loading enables thecatalyst to be more effective and shortens the illumination period (Sokmen and
65 Ozkan 2002). Separation of TiO2 from the effluent after dye degradation, however,is difficult due to its fine size. Therefore, it needs a costly filtration process beforedisposal. To combat this difficulty, TiO2 is sometimes immobilized on transparentsupports (Naskar, Pillay, and Chanda 1998), or it is doped with either metal or metalions (Arabatzis et al. 2003).
70 The enhancement of photocatalytic activity of TiO2 in the oxidative degradationprocion by silver deposition may be achieved through the following mechanisms:
(1) Silver particles deposited on TiO2 act as electron traps, enhancing theelectron–hole separation and the subsequent transfer of the trapped electronto the adsorbed O2 acting as an electron acceptor (Herrmann 1986).
75 (2) More dye molecules were adsorbed on the surface of silver-doped TiO2 thanon the TiO2 surface, enhancing the photo-excited electron transfer from thevisible light sensitized dye molecule to the conduction band of TiO2, therebysubsequently increasing the electron transfer to the adsorbed O2.
In this work, biodegradation of Procion blue H-B dye in textile washwater80 is carried out to obtain biodegraded textile washwater, which is amenable for
photocatalytic oxidation. For the first time, we report Ag–TiO2 doped photo-catalytic degradation of Procion blue H-B dye in biodegraded textile washwater.All the intermediates and unreacted compounds formed during biodegradation willbe oxidized by photocatalytic oxidation and the bacteria presented in the effluent
85 will also be killed. Prepared silver-doped TiO2 catalyst was characterized bythermo gravimetric and differential thermal analysis (TG and DTA), UV-Visible
2 M.G. Neelavannan and C.A. Basha

XML Template (2010) [9.2.2010–2:49pm] [1–12] Copyedited by: RA QA by: RA Collated by: BV{TANDF_FPP}GTEC/GTEC_A_459674.3d (GTEC) [PREPRINTER stage]
spectrometer, X-ray diffraction (XRD), scanning electron microscope (SEM), energydispersive X-ray microanalysis (EDX), and Brunauer–Emmett–Teller (BET) surfacearea techniques.
90 Experimental
Materials
The biodegraded textile washwater containing Procion blue H-B dye (reactive blue 2,C.I. no., 61211 and �max of Procion blue dye of 605 nm) was used in this study.Titanium dioxide (anatase 98.0%) and silver nitrate (99.5wt%) analytical grade
95 from Merck were used for the preparation of silver-doped TiO2 photocatalysts.
Photocatalytic degradation studies
In this study, the washwater after biodegradation was subjected to photocatalyticdegradation by two types of irradiation.
Mercury lamp irradiation method
100 The experimental setup consists of a 500mL glass beaker that contains washwaterwith photocatalysts, placed on a magnetic stirrer. This setup is kept inside areflecting mirror box. A 125W mercury lamp is provided on top of the mirror box,which serves as the light source. The length, breadth, and height of the reflectingmirror box are 40, 25, and 25 cm, respectively. A volume of 400mL of the washwater
105 is taken in the beaker and the TiO2 or silver-doped TiO2 is added to it. Washwaterwith a photocatalyst is continuously stirred by a magnetic stirrer for completemixing of reaction mixture. The volume of washwater taken in the beaker is 400mL.Figure 1(a) shows the mercury lamp irradiation setup.
UV lamp irradiation method
110 For this work, washwater containing Procion blue H-B dye is obtained afterbiodegradation. The experimental setup of pencil-type UV lamp irradiation is shownin Figure 1(b). This setup consists of a 700mL cylindrical stainless steel reactorplaced on a magnetic stirrer. An immersion type 6W UV lamp of size 2.5 cmdiameter and 27 cm height (emitting UV light, �¼ 365 nm) is placed inside the
115 reactor and the same serves as the light source. The height and diameter of thereactor are 21 and 8 cm, respectively. A volume of 700mL of the washwater is takenin the reactor and to it is added TiO2 or Agþ doped TiO2. The washwater witha photocatalyst is continuously stirred by a magnetic stirrer for complete mixingof reaction mixture. The height of the dye solution in the reactor is 20 cm.
120 Chemical oxygen demand analysis
In order to determine the extent of degradation of the effluent, chemical oxygendemand (COD) was measured. The COD, as the name implies, is the oxygenrequirement of a sample for oxidation of organic and inorganic matter. COD isgenerally considered as the oxygen equivalent of the amount of organic matter
Toxicological & Environmental Chemistry 3

XML Template (2010) [9.2.2010–2:49pm] [1–12] Copyedited by: RA QA by: RA Collated by: BV{TANDF_FPP}GTEC/GTEC_A_459674.3d (GTEC) [PREPRINTER stage]
125 oxidizable by potassium dichromate. The organic matter of the sample is oxidized
with a known excess of potassium dichromate in a 50% sulfuric acid solution.
The excess dichromate is titrated with a standard solution of ferrous ammonium
sulfate. The COD of all samples were determined by the dichromate closed reflux
method using Thermoreactor TR 620 (Merck). The reaction time was 2 h at 148�C.130 The experiments are repeated until the difference observed is less than 3%.
Biodegradation
Biodegradation of textile washwater was carried out for 5 days to study the partial
removal of color and COD reduction. Bacillus cereus and Pseudomonas putida
was inoculated on the nutrient agar slant and incubated at 37 �C for 24 h. and it was135 maintained in refrigeration condition and it has been subcultured routinely for
15 days.Nutrient broth culture of 100mL (P. putida) was taken in a 250mL Erlenmeyer
flask and incubated at 37 �C for 24 h. Then, textile washwater of 100mL was taken
and added to a flask that contains nutrient broth culture at a pH of 9.0 and shaken140 at 120 rpm at a temperature of 28�C. The flask was kept in a shaker for 5 days.
Discoloration and degradation of washwater in biological treatment based on
bacterial activities thus require aerobic condition. For the sequential treatment,
aerobic environment can be provided in a rotating biological conductor (orbitary
shaker). After completion of 24 h, 1mL of sample was collected every day from the145 flask for COD analysis, and 5mL sample was collected for absorbance with the
Figure 1. (a) Experimental setup of mercury lamp irradiation process. (b) Experimental setupof UV irradiation treatment process.
4 M.G. Neelavannan and C.A. Basha

XML Template (2010) [9.2.2010–2:49pm] [1–12] Copyedited by: RA QA by: RA Collated by: BV{TANDF_FPP}GTEC/GTEC_A_459674.3d (GTEC) [PREPRINTER stage]
help of NOVA 60 (Merck). The results thus obtained in a batch setup are shown
in Table 1.
Instrumentation
A Varian Cary 500 UV–VIS–NIR spectrophotometer equipped with an integrated150 sphere was used to record the diffuse reflectance spectra (DRS) and to measure
the absorbance data of the solution samples. The baseline correction was performed
using a calibrated reference sample of barium sulfate. The reflectance spectra of TiO2
and silver-doped TiO2 catalysts were analyzed under ambient conditions in the range
�¼ 200–800 nm.155 Powder XRD patterns of TiO2 and Ag-doped TiO2 catalysts were obtained using
a Philips PAN analytical X’pert PRO diffractometer equipped with a copper tube
for generating a Cu-Ka radiation (�¼ 1.5406 A) at 40 kV, 25mA. The particles
were spread on a glass slide specimen holder and the scattered intensity was
measured between 20� and 85� at a scanning rate of 2�¼ 1.2�min�1. Peak positions160 were compared with the standard files to identify the crystalline phases.
SEM analysis was performed on samples using a Hitachi, Model S-3000H,
equipped with an INCA EDX probe for the EDX microanalysis.TG and DTA analyser, TA Instruments Model SDT Q600 Model, was used
to measure weight changes in Ag–TiO2 as a function of temperature (or time) under165 a controlled nitrogen atmosphere. Its principal uses include measurement of thermal
stability and composition of Ag–TiO2. Data were collected during cooling also.The specific surface areas of TiO2 and silver-doped TiO2 were determined
according to the BET method through nitrogen adsorption at liquid nitrogen
temperature (77K) using a NOVA 1000 series instrument.
170
Preparation of photocatalyst
The Ag-doped TiO2 catalysts were prepared by photo reducing Agþ ions to Ag
metal on the TiO2 surface as per the following procedure. First, 0.2 g of AgNO3
was dissolved in 100mL of water in a glass beaker. Then 10 g of TiO2 was added
to the solution and the solution was stirred well and allowed to stand for 24 h.175 The system was then irradiated under a 6W UV lamp with a maximum emission
at 365 nm for 2 h. After irradiation, the powder was filtered and washed to remove
residual ions and finally dried in vacuum oven at 95�C for 16 h (Liu et al. 2004).
Table 1. Biodegradation using P. putida.
Time (hrs) COD (mgL�1) % of COD removal
24 3280 548 2960 1472 2640 2396 2480 28120 2320 33
Toxicological & Environmental Chemistry 5

XML Template (2010) [9.2.2010–2:49pm] [1–12] Copyedited by: RA QA by: RA Collated by: BV{TANDF_FPP}GTEC/GTEC_A_459674.3d (GTEC) [PREPRINTER stage]
Results and discussion
XRD and EDX analysis
180 Figure 2 shows the XRD patterns of TiO2 and Ag–TiO2. From the figure, we found
that the XRD patterns of silver-doped TiO2 samples almost coincide with that of
pure TiO2 and show no diffraction peaks due to silver species, thus suggesting
that the metal particles are well dispersed on the TiO2 surface. Anatase-type
structure is kept in all silver-doped TiO2 catalysts, indicating that the metal dopants
185 are merely placed on the surface of the crystals without being covalently anchored
into the crystal lattice. There are no diffraction patterns characteristics of the doped
metals in the XRD patterns. Hence these metal sites are expected to be below the
visibility limit of X-ray analysis (Sclafani and Herrmann 1998). The crystallite size
was determined from the diffraction peak broadening by employing the following190 equation:
D ¼K�
ð�c � �sÞ cos �
where D is the crystallite size of the catalyst, � the X-ray wavelength, and �c and �sthe FWHM of the catalyst and the standard, respectively; K¼ 0.89 is a coefficient
and � the diffraction angle. It is noted that all the catalysts are in the form of
nanoparticulates with sizes ranging from 20 to 40 nm. The TiO2 used in this study195 was pure anatase phase. There was no change in the structure of TiO2 after the
photocatalytic reaction.We observed maximum photocatalytic degradation of Procion blue by 2% of
Ag-doped TiO2. We have performed EDX analysis on the Ag-doped TiO2 catalyst
and from the analysis, we notice that in Ag–TiO2, the Ag content of 0.42wt%200 was present in the selected region. This confirms that the deposition of silver on TiO2
is non-uniform.
Figure 2. XRD patterns of TiO2 and Ag–TiO2.
6 M.G. Neelavannan and C.A. Basha

XML Template (2010) [9.2.2010–2:49pm] [1–12] Copyedited by: RA QA by: RA Collated by: BV{TANDF_FPP}GTEC/GTEC_A_459674.3d (GTEC) [PREPRINTER stage]
UV-visible DRS
The spectrum of TiO2 consists of a single absorption around 350 nm, usuallyascribed to charge-transfer from the valence band (mainly formed by 2p orbitals of
205 the oxide anions) to the conduction band (mainly formed by 3dt2g orbital of the Ti4þ
cations) (Gerischer and Heller 1991). The addition of silver ions and subsequent UVirradiation cause significant changes to the absorption spectrum of TiO2 resultingin high absorbance from 370 nm to the entire visible region, a characteristic ofsurface plasmon absorption where a band usually appears at 400 nm. As this band is
210 not as strong as reported in literature (Herrmann et al. 1997; Stathatos et al. 2000),the red shift may not be due to surface plasmon absorption. Hence the extendedabsorption must be from band gap absorption. This band gap absorption of allsilver-doped TiO2 catalysts slightly shifts to higher wavelength. The absorbancein the visible region for the metallized system shows that lower energy transitions
215 are possible. This is due to the metal clusters giving rise to localized energy levelsin the band gap of TiO2 into which valence band electrons of TiO2 are excited atwavelength longer than 350 nm. If equal-sized metal clusters are formed, constantabsorption in the visible region corresponding to the excitation from the valenceband of TiO2 to the unoccupied level of metal cluster will occur. Since there is a small
220 gradual decrease in absorption from 400 to 800 nm in the DRS of silver-doped TiO2
catalyst, the metal clusters in the catalyst are not of equal size. The spectrareveal that silver doping has a marked effect on the absorption properties of TiO2
and that the absorption of light in the visible region by TiO2 increases with anincrease in the silver content.
225BET surface area analysis
In general, the surface area of the catalyst is the most important factor in influencingthe catalytic activity. The surface area of TiO2 particles before and after surfacemodification was determined. It was observed that the surface area decreases withincrease in the silver content of the silver-doped TiO2 catalyst. The surface area of
230 the titanium dioxide and silver-doped TiO2 were 22.19 and 17.52m2/g, respectively.The decrease in the surface area of silver-doped TiO2 may be due to blocking of finecapillaries of parent TiO2 surface by metal film islands (Sakthivel et al. 2004).
Thermo gravimetric and differential thermal analysis
Thermal stability is critically important for silver-based multilayered structures such235 as silver/TiO2. In this work, it has been proved that silver deposition can effectively
improve the thermal stability of TiO2 but does not adversely affect the opticaltransmission through the multilayer from the near ultraviolet to near infraredspectral region. The TG and DTA patterns were obtained on TiO2 and silver-dopedTiO2. An endothermic peak is observed around 35�C with a corresponding weight
240 loss of about 0.5%. This is attributed to the dehydration of the catalyst. No weightloss was observed beyond 1000�C. A similar observation has been reported byNagaveni et al. (2004) on the photocatalytic degradation of nano TiO2. Althoughthe silver-doped TiO2 gave a similar trend in the latter case, an irreversibledecomposition takes place at 1200�C. In both cases, the weight losses observed
Toxicological & Environmental Chemistry 7

XML Template (2010) [9.2.2010–2:49pm] [1–12] Copyedited by: RA QA by: RA Collated by: BV{TANDF_FPP}GTEC/GTEC_A_459674.3d (GTEC) [PREPRINTER stage]
245 between 150 and 500�C are attributed to the strongly bonded water or surfacehydroxyl groups (Nagaveni et al. 2004).
Adsorption of Procion blue on TiO2 and Ag-doped TiO2 catalysts
Adsorption is usually described through isotherms, that is, the amount of adsorbateon the adsorbent as a function of its concentration at constant temperature. For the
250 photodegradation of Procion blue dye on silver-doped TiO2 under UV irradiation,silver metals act as electron traps, thereby enhancing the charge separation. To findout the mechanism, an adsorption study was carried out with 20–100mgL�1 of theaqueous solution of Procion blue H-B dye in darkness for 12 h. It was found thatthere was no measurable decrease in the dye concentration. This indicates that the
255 adsorption of dye is not significant over silver-doped TiO2.An adsorption isotherm of TiO2 is shown in Figure 3(a) and (b). From the
figures, a substantial increase in the relative amount adsorption was observedas the dosage was increased from 60 to 100mgL�1. Linear plots of Ce/qe versusCe (Langmuir) and ln(qe) versus ln(Ce; Freundlich) show that the adsorption obeys
260 both Langmuir and Freundlich isotherm models. The high values of coefficientof regression (R2) for both the models indicate good agreement between experimental
0
0.01
0.02
0.03
0.04(a)
(b)
1/Ce
1/q
e
0.02 g
0.04 g
0.06 g
0.08 g
0.1 g
1.4
1.8
2.2
2.6
3
0 0.05 0.1 0.15
0.8 1 1.2 1.4 1.6 1.8
log Ce
log
qe
0.02 g 0.04 g 0.06 g 0.08 g 0.10 g
Figure 3. An adsorption isotherm of TiO2. (a) Longmuir isotherm. (b) Freundlich isotherm.
8 M.G. Neelavannan and C.A. Basha

XML Template (2010) [9.2.2010–2:49pm] [1–12] Copyedited by: RA QA by: RA Collated by: BV{TANDF_FPP}GTEC/GTEC_A_459674.3d (GTEC) [PREPRINTER stage]
and predicted data. The applicability of both the isotherm models to TiO2 andsilver-doped TiO2 system implies that both monolayer sorption and heterogeneoussurface conditions exist under the experimental conditions used. The sorption of dye
265 on the TiO2 and silver-doped TiO2 is thus complex, involving more than onemechanism. From the measurement, we found that the values of Langmuir constant‘Q0’ (Q0 is the maximum amount of the Procion blue dye adsorbed per unit weightof catalysts to form a complete monolayer, a practical limiting adsorption capacitywhen the surface is fully covered with Procion blue dye) increases with the increase
270 of dosage of TiO2 from 8.56 to 47.3, whereas the constant related to the affinity ofthe binding sites ‘b’ decreases from 0.041 to 0.039. In Freundlich isotherm, the valuesof Kf and n (Kf and n are the Freundlich constants characteristic on the system.Kf and n are indicators of adsorption capacity and adsorption intensity, respectively)increase with the increase of dosage of Procion blue dye from 2.9 to 5.5 and 1.42
275 to 1.83.
Photocatalytic activities of TiO2 and Ag-doped TiO2 catalysts onProcion blue degradation
The degradation profile of Procion blue under various catalysts loading underirradiation is shown in Figure 4. Compared to pure TiO2, the silver-doped TiO2
280 catalysts with both irradiations exhibited a significant increase in the Procion blueH-B dye degradation. As there is no significant difference in the adsorption of dyesbetween TiO2 and the silver-doped TiO2 catalysts, mechanism (2) is ruled out.Hence the increase in efficiency by Ag deposition is due to mechanism (1).
It is observed that the photonic efficiency increases with an increase in the silver285 loading up to 600mgL�1 of Ag–TiO2 (optimum metal loading) and then decreases.
There is no considerable change in further loading of catalyst because further additionof catalyst made the effluent dense, and penetration of UV into the effluent waspoor.It is also observed that the photonic efficiency increases with an increase in the silverloading up to 600mgL�1. More silver contents could be detrimental to the photonic
0
10
20
30
40
50
60
70
80
90
100
0
Catalyst loading (mg L–1)
% o
f CO
D r
emov
al
M+TiO2M+AgTiO2UV+TiO2UV+AgTiO2
200 400 600 800 1000
Figure 4. Effect of catalysts loading on COD removal.
Toxicological & Environmental Chemistry 9

XML Template (2010) [9.2.2010–2:49pm] [1–12] Copyedited by: RA QA by: RA Collated by: BV{TANDF_FPP}GTEC/GTEC_A_459674.3d (GTEC) [PREPRINTER stage]
290 efficiency. It may be explained that up to maximum metal loading, the silver particlesdeposited on the TiO2 surface can act as electron–hole separation centers. Theelectron transfer from the TiO2 conduction band to metallic silver particles at theinterface is thermodynamically possible because the Fermi level of TiO2 is higher thanthat of silver metals (Sclafani and Herrmann 1998). This results in the formation of
295 Schottky barrier at the metal–semiconductor contact region, which improves thecharge separation and thus enhances the photocatalytic activity of TiO2. In contrast,at the silver content above its maximum, the silver particles can also act asrecombination centers thereby decreasing the photocatalytic activity of TiO2. It hasbeen reported that the probability for the hole capture is increased by the large
300 number of negatively charged silver particles on TiO2 at high silver content, whichreduces the efficiency of charge separation (Zhao et al. 1996; Stathatos and Lianos2002). The photodegradation of Procion blue H-B Dye against the irradiation time isshown in Figure 5. From this figure, it was found that the rate of photodegradationincreased linearly with time of irradiation and mercury lamp with silver-doped TiO2
305 irradition shows maximum Procion blue H-B dye degradation. It is due to theemission area in mercury lamp setup and attained temperature is more that that ofUV lamp setup. The source (mercury lamp) was surrounded by mirrors and thereflections influence the photodegradation. The total energy absorbed per unit areaduring a given exposure time is also more in mercury lamp irradiation setup.
310 Because of the high wattage of the mercury lamp, heat is generated in the reactionchamber, which leads to more photolytic yields. Also the plot reveals that thereis no significant difference at each sampling points. During photocatalytic oxida-tion, all the pollutants (organic contaminants, dyes, and intermediates) wereconverted to CO2.
315Conclusion
In this article, silver-doped TiO2 photocatalyst was prepared and used for thetreatment of textile washwater with UV and mercury lamp irradiations. The
0
10
20
30
40
50
60
70
80
90
100
0
Time (h)
% o
f CO
D r
emov
al
MercuryUV
1 2 3 4 5 6
Figure 5. Effect of irradiations on COD removal.
10 M.G. Neelavannan and C.A. Basha

XML Template (2010) [9.2.2010–2:49pm] [1–12] Copyedited by: RA QA by: RA Collated by: BV{TANDF_FPP}GTEC/GTEC_A_459674.3d (GTEC) [PREPRINTER stage]
characterization of TiO2 and silver-doped TiO2 using diffuse reflectance spectros-copy, XRD, SEM, EDX, TG and DTA, and BET surface area techniques revealed
320 the dispersion of silver metal on the surface of TiO2. The photonic efficiencyincreases with increase in the metal loading up to 600mgL�1 due to the effect ofdecreasing recombination of electron and hole. From this study, we found that themercury lamp irradiation with silver-doped TiO2 results in maximum discoloration(86%) and COD removal (69%). Both Langmuir and Freundlich isotherms are
325 fitted well for the degradation of Procion blue H-B dye. An integrated biological–photocatalytic system for the discoloration and COD reduction seems a logicalchoice for the treatment of textile washwater. The presence of bacteria was checkedby plate method and there was no colony found in the photodegraded washwaterand can be recycled and used for the rinsing purpose.
330Acknowledgment
The authors thank the Director, Central Electrochemical Research Institute, Karaikudi,for his kind encouragement.
References
Arabatzis, I.M., T. Stergiopoulos, M.C. Bernard, D. Labou, S.G. Neophytides, and
335 P. Falaras. 2003. Silver-modified titanium dioxide thin films for efficient photodegradation
of methyl orange. Applied Catalysis B: Environmental 42: 187–201.Baban, A., A. Yedilar, D. Lienert, N. Kemerder, and A. Kettrup. 2003. Ozonation of high
strength segregated effluents from a woollen textile dyeing and finishing plant. Dyes and
Pigments 58: 93–8.
340 Chang, J.S., and Y.C. Lin. 2000. Fed-batch bioreactor strategies for microbial decolorization
of azo dye using a Pseudomonas luteola strain. Biotechnology Progress 16: 979–85.Corma, A., and H. Garcia. 2004. Zeolite-based photocatalysts. Chemical Communications 13:
1443–59.Gerischer, H., and A. Heller. 1991. The role of oxygen in photooxidation of organic molecules
345 on semiconductor particles. Journal of Physical Chemistry 95: 5261–7.
Goutley, K.T., C.A. Buckley, and G.R. Groves. 1983. Reverse osmosis treatment and reuse
of textile dye house effluents. Desalination 47: 313–20.Herrmann, J.M. 1986. Strong metal-support interactions. ACS Symposium Series: American
Chemical Society 298:200–211.
350 Herrmann, J.M., H. Tahiri, Y. Ait-Ichou, G. Lassaletta, A.R.G. Elipe, and A. Fernandez.
1997. Characterization and photocatalytic activity in aqueous medium of TiO2 and
Ag–TiO2 coatings on quartz. Applied Catalysis B: Environmental 13: 219–28.Linsebiger, A.L., G.Q. Lu, and J.T. Yates. 1995. Interfacial photochemistry, fundamentals
and applications. Chemical Reviews 95: 735–58.
355 Liu, S.X., Z.P. Qu, X.W. Han, and C.L. Sun. 2004. A mechanism for enhanced photocatalytic
activity of silver-loaded titanium dioxide. Catalysis Today 93–95: 877–84.
Nagaveni, K., G. Sivalingam, M.S. Hegde, and G. Madras. 2004. Solar photocatalytic
degradation of dyes: High activity of combustion synthesized nano TiO2. Applied Catalysis
B: Environmental 48: 83–3.
360 Naskar, S., S.A. Pillay, and M. Chanda. 1998. Photocatalytic degradation of organic dyes
in aqueous solution with TiO2 nanoparticles immobilized on foamed polyethylene sheet.
Journal of Photochemistry and Photobiology A 113: 257–64.
Toxicological & Environmental Chemistry 11

XML Template (2010) [9.2.2010–2:49pm] [1–12] Copyedited by: RA QA by: RA Collated by: BV{TANDF_FPP}GTEC/GTEC_A_459674.3d (GTEC) [PREPRINTER stage]
Neelavannan, M.G., M. Revathi, and C.A. Basha. 2007. Photocatalytic and electrochemicalcombined treatment of textile washwater. Journal of Hazardous Materials 149: 371–8.
365 Oller, I., W. Gernjak, M.I. Maldonado, L.A. Perez-Estrada, J.A. Sanchez-Perez, andS. Malato. 2006. Solar photocatalytic degradation of some hazardous water-soluble
pesticides at pilot-plant scale. Journal of Hazardous Materials 138: 507–17.Ozkan, A., M.H. Ozkan, R. Gurkan, M. Akcay, and M. Sokmen. 2004. Photocatalyticdegradation of a textile azo dye, Sirius Gelb GC on TiO2 or Ag-TiO2 particles in the absence
370 and presence of UV irradiation: The effects of some inorganic anions on the photocatalysis.Journal of Photochemistry and Photobiology A: Chemistry 163: 29–35.
Pearce, C.I., J.R. Lloyd, and J.T. Guthrie. 2003. The removal of color from textile wastewater
using whole bacterial cells: A review. Dyes and Pigments 58: 179–96.Robinson, T., G. McMullan, R. Marchant, and P. Nigam. 2001. Remediation of dyes in
375 textile effluent: A critical review on current treatment technologies with a proposed
alternative. Bioresource Technology 77: 247–55.Rupa, A.V., D. Manikandan, D. Divakar, and T. Sivakumar. 2007. Effect of depositionof Ag on TiO2 nanoparticles on the photodegradation of Reactive Yellow-17. Journal ofHazardous Materials 147: 906–13.
380 Sahoo, C., A.K. Gupta, and A. Pal. 2005. Photocatalytic degradation of Methyl Reddye in aqueous solutions under UV irradiation using Agþ doped TiO2. Desalination 181:91–100.
Sakthivel, S., M.V. Shankar, M. Palanichamy, B. Arabindoo, D.W. Bahnemann, andV. Murugesan. 2004. Enhancement of photocatalytic activity by metal deposition:
385 Characterization and photonic efficiency of Pt, Au and Pd deposited on TiO2 catalyst.
Water Research 38: 3001–8.Sclafani, A., and J.M. Herrmann. 1998. Influence of metallic silver and of platinum-silverbimetallic deposits on the photocatalytic activity of titania (anatase and rutile) in organicand aqueous media. Journal of Photochemistry and Photobiology A 113: 181–8.
390 Slokar, Y.M., and A.M.L. Marechal. 1998. Methods of decoloration of textile wastewaters.Dyes and Pigments 37: 335–56.
Sokmen, M., and A. Ozkan. 2002. Decolourising textile wastewater with modified titania:
The effects of inorganic anions on the photocatalysis. Journal of Photochemistry andPhotobiology A 147: 77–81.
395 Stathatos, E., and P. Lianos. 2002. Organic/inorganic nano composite gels employed as
electrolyte supports in dye-sensitized photoelectrochemical cells. International Journal ofPhotoenergy 4: 11–16.
Stathatos, E., P. Lianos, P. Falaras, and A. Siokou. 2000. Photocatalytically deposited silver
nanoparticles on mesoporous TiO2 films. Langmuir 16: 2398–400.
400 Vamathevan, V., R. Amal, D. Beydoun, G. Low, and S. McEvoy. 2002. Photocatalyticoxidation of organics in water using pure and silver-modified titanium dioxide particles.Journal of Photochemistry and Photobiology A 148: 233–45.
Zhao, G., H. Kozuka, and T. Yoko. 1996. Sol-gel preparation and photoelectrochemicalproperties of TiO2 films containing Au and Ag metal particles. Thin Solid Films 277: 147–54.
405
12 M.G. Neelavannan and C.A. Basha