phosphorus toxicity in tomato plants: when and how does it occur?
TRANSCRIPT

This article was downloaded by: [Monash University Library]On: 02 September 2013, At: 07:46Publisher: Taylor & FrancisInforma Ltd Registered in England and Wales Registered Number:1072954 Registered office: Mortimer House, 37-41 Mortimer Street,London W1T 3JH, UK
Communications in SoilScience and Plant AnalysisPublication details, including instructions forauthors and subscription information:http://www.tandfonline.com/loi/lcss20
Phosphorus toxicity intomato plants: when andhow does it occur?J.Benton Jones Jr. aa Micro‐Macro International, Inc., 183Paradise Blvd., Suite 108, Athens, GA, 30607Published online: 11 Nov 2008.
To cite this article: J.Benton Jones Jr. (1998) Phosphorus toxicity in tomatoplants: when and how does it occur?, Communications in Soil Science and PlantAnalysis, 29:11-14, 1779-1784, DOI: 10.1080/00103629809370068
To link to this article: http://dx.doi.org/10.1080/00103629809370068
PLEASE SCROLL DOWN FOR ARTICLE
Taylor & Francis makes every effort to ensure the accuracy of allthe information (the “Content”) contained in the publications on ourplatform. However, Taylor & Francis, our agents, and our licensorsmake no representations or warranties whatsoever as to the accuracy,completeness, or suitability for any purpose of the Content. Anyopinions and views expressed in this publication are the opinions andviews of the authors, and are not the views of or endorsed by Taylor& Francis. The accuracy of the Content should not be relied upon andshould be independently verified with primary sources of information.Taylor and Francis shall not be liable for any losses, actions, claims,proceedings, demands, costs, expenses, damages, and other liabilitieswhatsoever or howsoever caused arising directly or indirectly inconnection with, in relation to or arising out of the use of the Content.

This article may be used for research, teaching, and private studypurposes. Any substantial or systematic reproduction, redistribution,reselling, loan, sub-licensing, systematic supply, or distribution in anyform to anyone is expressly forbidden. Terms & Conditions of accessand use can be found at http://www.tandfonline.com/page/terms-and-conditions
Dow
nloa
ded
by [
Mon
ash
Uni
vers
ity L
ibra
ry]
at 0
7:46
02
Sept
embe
r 20
13

COMMUN. SOIL SCI. PLANT ANAL., 29(11-14), 1779-1784 (1998)
PHOSPHORUS TOXICITY IN TOMATO PLANTS: WHEN AND HOWDOES IT OCCUR?
J. Benton Jones, Jr.
Micro-Macro International, Inc., 183 Paradise Blvd., Suite 108, Athens, GA 30607
ABSTRACT
For many years and in most agricultural production systems, phosphorus (P) hasbeen identified as the most frequently occurring essential element deficiency limitingcrop yields, and it is still an element that continues to receive considerable researchattention. However, little has been researched or written about the effects of high Pon plants other than that associated mainly with zinc (Zn) nutrition, and iron (Fe) tosome degree, as high P levels are known to interfere with their normal metabolism.Also, P is known to promote manganese (Mn) uptake. At what levels P would beconsidered toxic has not been clearly defined for most crops. The author hasobserved the occurrence of nutritional stress in tomato plants when the P level inleaves exceeds 1.00% of its dry matter, mainly occurring for container-grown plantsand those being grown hydroponically. This and other data will be presented thatsuggests that 1.00% P may indeed be the critical level between sufficiency andtoxicity for tomato plants. Visual symptoms of P toxicity will also be described.
INTRODUCTION
Phosphorus (P) is an essential major element, considered to be the limitingnutrient element in many types of growing systems, therefore, its recommendedaddition in rather substantial quantities to the growing medium. Although much hasbeen researched on P deficiency, little by comparsion has been studied as to thepotential for P toxicity. Normally, P when in excess in a growing medium results inan imbalance that affects the availability, uptake, and utilization of other essentialelements. For example, P enhances the availability and uptake of manganese (Mn),but significantly reduces the uptake and utilization of zinc (Zn), and to a limiteddegree iron (Fe) also.
Plant analysis is the technique for evaluating the nutrient element status of plants,although the technique is considerably under-utilized since most growers do not assaytheir plants as a routine—assaying primarily when a suspected nutrient element in-sufficiency appears as visual symptoms. Plant analysis interpretation tables fre-quently do not include toxic concentrations since such levels have not be studied toany great extent. What level would be considered as being 'high' in plants, andtherefore potentially excessive, has not been commonly observed nor has that P levelconsidered 'toxic' clearly defined.
1779
Copyright © 1998 by Marcel Dekker, Inc. www.dekker.com
Dow
nloa
ded
by [
Mon
ash
Uni
vers
ity L
ibra
ry]
at 0
7:46
02
Sept
embe
r 20
13

1780 JONES
In general, one would not expect P to be excessive under field-growingconditions unless a substantial quantity of P fertilizer has been applied over time.However, the numbers of soils being tested today that are 'high' in P is considerableand continues to increase. Even though a soil test for P may be interpreted as being'high', most growers will still apply some P fertilizer, either as a row application, oras a part of a maintenance fertilizer program. For those growing in containers, ineither a soilless or hydroponic growing system, the danger of high P supply isincreased considerably. Without routine testing and monitoring, the effects of high Plevels in the rooting media will go undetected, resulting in lower plant/fruit yield andreduced product quality.
The symptoms of P toxicity have not been well defined for most crops. Inter-veinal death of leaf tissue, reddening of the leaf margins, and the 'firing' of themargins of the leaves are symptoms that have been identified as due to toxic P leafcontent levels. Interveinal death is also a symptom of Mn toxicity, and 'firing' of theleaves occurs with potassium (K) and magnesium (Mg) deficiency, symptoms thatoccur on the older leaves, while P toxicity occurs on all leaves. At what leaf (plant) Plevel toxicity occurs also has not been well established. In general, P leaf levels inexcess of 1.00% of the dry matter has been suggested as being potentially toxic.Excessive P levels have been identified as low as 0.50% and as high as 1.50%. Intwo recent instances, P toxicity has been observed in two hydroponic greenhousetomato crops with leaf P levels of 0.82 and 2.00%, respectively, in the two crops. Inthe former crop, only some leaves on the new growth exhibited interveinal dying,while in the latter crop, interveinal death and the 'firing' of all leaves occurred.
In a recent survey of plant analysis results of container- and hydroponically-grown plants revealed that P leaf contents of 1.00% or higher are being obtained, andthat P leaf contents within the 0.50 to 1.00% range were common.
Since most commonly used mixed-grade nitrogen-phosphorus-potassium (NPK)fertilizers contain substantial quanities of P, it should not be unexpected that highplant P levels commonly occur. In general, NPK-type fertilizer application rates arebased on obtaining a certain level of applied N or K without consideration of theamount of P also being applied. The demand for rapid plant growth, high yields, andquality factors frequently demand repeated heavy applications of fertilizer. Inaddition, much of the work on P, both in terms of deficiency and excess, have beendone with young plants or in short-term nutritional studies. Frequently, P excess isdue to an accumulation effect based on time or an occurrence in mature plants.Therefore the requirement to study P excess and toxicity using mature plants at fairlylong exposure times.
The question that needs to be answered is: (i) at what level(s) does P becomeexcessive in the plant, thereby affecting plant growth, yield, and quality, (ii) at whatP level in the plant does toxicity occur, and (iii) what are the visual symptoms of Ptoxicity?
PREVIOUS WORK AND PRESENT OUTLOOK
Visual P toxicity symptoms are shown in the book by Weir and Cresswell (1993)for tomato (interveinal chlorotic spotting) and cucumber (chlorosis and necroticspotting of interveinal areas), the P level in the affected leaves was 1.50%. In a colorplate in the book edited by Bennett (1993), excess P symptoms in sorghum leaveslook very similar to those of K deficiency, a 'firing' of the margins of the leaves.Foote and Howell (1964) described P toxicity in soybeans as a "reddish brownmarginal discoloration, and reddening of the leaf veins and interveinal areas followedby necrosis."
Dow
nloa
ded
by [
Mon
ash
Uni
vers
ity L
ibra
ry]
at 0
7:46
02
Sept
embe
r 20
13

PHOSPHORUS TOXICITY 1781
The P levels considered to be excessive are listed in tables for various vegetablecrops by Weir and Cresswell (1993), the excessive levels ranging between 0.45 to1.0% of the dry weight.
The interaction between P and the micronutrients Mn (Aleilo and Graves, 1996),Fe (Watanabe et al., 1965), and Zn (Watanabe et al., 1965; Khan and Soltanpour,1978; Menser and Sidle, 1985) have been extensively studied, although the focus hasbeen primarily on the micronutrient rather than P itself. For example, Khan andSoltanpour (1978) found that 0.60% P in pinto bean leaves resulted in P-induced Zndeficiency, while Menser and Sidle (1985) found that high Zn availability signi-ficantly reduced soybean plant growth but did not affect P uptake. For Mn, thereverse occurrs as P enhances Mn uptake and can result in a possible Mn toxicitycondition.
Penlosa et al. (1989) using a sand-culture hydroponic growing system for tomatofound that 2.0 mmol P L"1 in the nutrient solution gave the highest dry matter andfruit yields, while higher (4.0 mmol P L"1) and lower (0.2 and 0.5 mmol P L'1)levels resulted in significant lower dry matter and fruit yields. At the highest P levelin the nutrient solution, leaf dry matter P was 0.65%, while at the 2.0 mmol P L'1
level, the leaf dry matter P level after three months was at about 0.60%, suggestingthat the upper limit for leaf P in tomato is 0.60%.
Fontes and Wilcox (1984a) observed in three field-grown tomato cultivars avarying integrated control of P uptake and utilization that affected plant growth andfruit yield. Leaf P content in all three cultivars ranged from 0.41 to 0.49% 25 daysafter emergence, and ranged from 0.29 to 0.33% when the plants began producingharvestable fruit. The same authors (Fontes and Wilcox, 1984b) growing tomatoplants under both soil and hydroponic growing conditions established the critical Plevel for deficiency at 0.16% and adequacy at 0.38%. Halbrooks and Wilcox (1980)studied the development of the tomato plant, monitoring its elemental content withtime. The P content of various plant parts with time ranged between a low of 0.20%to a high of 0.54%. Besford (1979ab) in his tomato plant experiments set P defici-ency at 0.13% in the leaf, with maximum fruit yield occurring when the P leaf contentwas 0.40%, although with increasing N levels, the P level for maximum yield mayalso increase.
In a short-term hydroponic experiment with tomato plants grown at varying roottemperatures, Klock et al. (1996) obtained tomato shoot P contents which rangedbetween 0.34 to 0.77%, the optimum temperature in terms of growth occurringbetween 25 and 30°C which gave P levels of 0.73 to 0.77%, respectively. Similarly,Tindall et al. (1990) found the optimum root temperature to be between 20 to 30°Cwith P uptake not signifcantly affected by rooting temperature and with plant Pcontents ranging between 0.44 to 0.58%.
Studying P uptake by eight different grass species using a rapid-flow nutrientsolution technique, Asher and Loneragan (1963) observed P toxicity when the P levelin the plants ranged between 0.90 to 1.80%, and they suggested that 0.80% was thecritical P concentration between sufficiency and toxicity.
Some plant species may not be able to regulate P uptake, an observation made byAleilo and Graves (1996) for Amur Maackia, for as the P content in the nutrientsolution increased so did the P plant content which exceeded 2.00%. Maximumgrowth occurred when the P content was 0.50% and began decreasing significantlywith increasing plant P content. The Mn content also increased from 100 mg k g 1 toover 350 mg kg"' which was closely correlated with the increasing P content.
A suspected severe P toxicity in a greenhouse tomato crop occurred in December1996 in Aiken, South Carolina. The plants were being grown in perlite-filled bagsusing a drip irrigation system for nutrient solution delivery. The leaf P content was
Dow
nloa
ded
by [
Mon
ash
Uni
vers
ity L
ibra
ry]
at 0
7:46
02
Sept
embe
r 20
13

1782 JONES
Table 1. Plant tissue analysis results for plants with normal and burned leaves.
Element
PKCaMg
BCuFeMnZn
Plants with BurnedNew Growth
1.752.632.630.53
7121
204321
26
LeavesOlder New
or
1.582.873.300.53
— m o t o ~ IHlg K-g
8218
189325
11
NormalGrowth
1.713.412.290.53
6721
185320
45
PlantsOlder
1.523.211.860.55
6021
273241
46
found to be over 2.00% and the Zn leaf content less than 15 mg kg 1 . The initialsymptoms was a dying of the interveinal tissue on recently mature leaves, and withtime, the margins of the leaves died giving a 'firing' appearance to the entire plant.Phosphorus was removed from the nutrient solution and the Zn concentrationincreased by 25%. As new growth appeared, a set of plant samples were collectedfrom affected plants showing symptoms and those occassional plants in thegreenhouse without symptoms. The assay results are given in Table 1. Although theP levels in both sets of plants, whether new or old leaves, were still 1.52% or higher,those plants which appeared 'normal' had Zn plant tissue levels of 45 and 46 mgkg"1, while the symptom plants had Zn levels at 11 mg kg-1 (<15 mg Zn kg-1
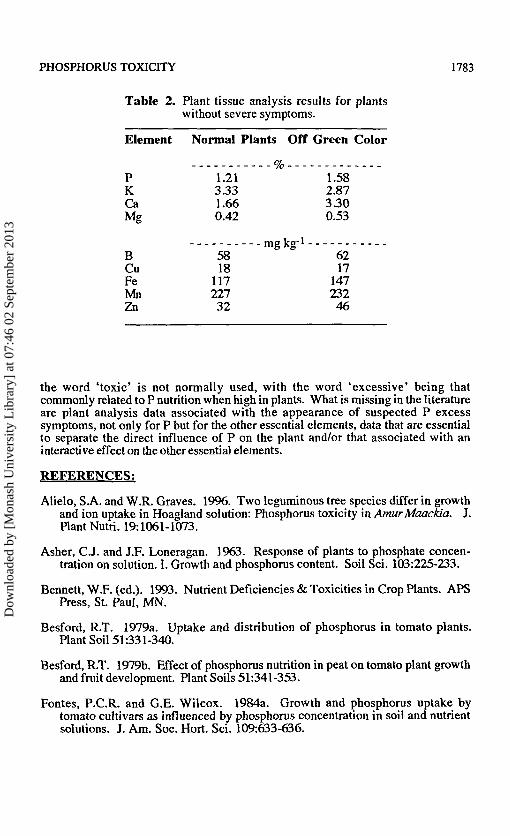
considered deficient) in the older leaves and 26 mg kg"1 (>20 mg Zn kg"1 consideredsufficient) in the new growth. As the P content declined in the symptom plants, aslight yellowing of newly emerging leaves was associated with P concentrations at1.58% (Table 2), while the P level in the 'normal' plants was 1.21%. These resultsseem to suggest that the visual symptoms was due to a severe Zn deficiency inducedby the high P content and as the P plant level declined and the Zn level increased, thevisual symptoms disappeared. Therefore, these tomato plants could tolerate a high Pcontent (greater than 1.00% but not more than 1.50%) if the Zn level were over 40mg kg 1 , but if the Zn level were less than 40 mg kg 1 , visual symptoms (initially anoff-green color followed by severe 'firing' of the leaves) would occur.
When the grower returned to his original nutrient solution formula, the severesymptoms reappeared. The nutrient solution was then significantly changed, cuttingthe P concentration to 15 mg L 1 and increasing the Zn concentration by 25%. Withthat nutrient solution formula, no further symptoms appeared.
SUMMARY
There is substantial data in the literature that would suggest that greater than1.00% P in the dry matter of the tomto plant can be considered as 'toxic', although
Dow
nloa
ded
by [
Mon
ash
Uni
vers
ity L
ibra
ry]
at 0
7:46
02
Sept
embe
r 20
13
PHOSPHORUS TOXICITY 1783
Table 2. Plant tissue analysis results for plantswithout severe symptoms.
Element
PKCaMg
BCuFeMnZn
Normal Plants Off
1.213.331.660.42
mg Kg5818
11722732
Green Color
1.582.873.300.53
6217
14723246
the word 'toxic' is not normally used, with the word 'excessive' being thatcommonly related to P nutrition when high in plants. What is missing in the literatureare plant analysis data associated with the appearance of suspected P excesssymptoms, not only for P but for the other essential elements, data that are essentialto separate the direct influence of P on the plant and/or that associated with aninteractive effect on the other essential elements.
REFERENCES;
Alielo, S.A. and W.R. Graves. 1996. Two leguminous tree species differ in growthand ion uptake in Hoagland solution: Phosphorus toxicity in Amur Maackia. J.Plant Nutri. 19:1061-1073.
Asher, C.J. and J.F. Loneragan. 1963. Response of plants to phosphate concen-tration on solution. I. Growth and phosphorus content. Soil Sci. 103:225-233.
Bennett, W.F. (ed.). 1993. Nutrient Deficiencies & Toxicities in Crop Plants. APSPress, St. Paul, MN.
Besford, R.T. 1979a. Uptake and distribution of phosphorus in tomato plants.Plant Soil 51:331-340.
Besford, R.T. 1979b. Effect of phosphorus nutrition in peat on tomato plant growthand fruit development. Plant Soils 51:341-353.
Fontes, P.C.R. and G.E. Wilcox. 1984a. Growth and phosphorus uptake bytomato cultivars as influenced by phosphorus concentration in soil and nutrientsolutions. J. Am. Soc. Hort. Sci. 109:633-636.
Dow
nloa
ded
by [
Mon
ash
Uni
vers
ity L
ibra
ry]
at 0
7:46
02
Sept
embe
r 20
13

1784 JONES
Fontes, P.C.R. and G.E. Wilcox. 1984b. Growth and phosphorus accumulation intomato cultivars. J. Plant Nutri. 7:1651-1669.
Foote, B.D. and R.W. Howell. 1964. Phosphorus tolerance and sensitivity of soy-beans as related to uptake and translocation. Plant Physiol. 39:610-613.
Halbrooks, M.C. and G.E. Wilcox. 1980. Tomato plant development and elementalaccumulation. J. Am. Soc. Hort. Sci. 105:826-827.
Khan, A. and P.N. Soltanpour. 1978. Factors associated with Zn chlorosis in dry-land beans. Agron. J. 70:1022-1026.
Klock, K.A., W.R. Graves, and H.G. Tabor. 1996. Growth and phosphorus, zinc,and manganese content of tomato, muskmelon, and honey locust at high root-zone temperatures. J. Plant Nutri. 795-806.
Menser, H.A. and R.C. Sidle. 1985. Effect of zinc levels on phosphorus and zinccontent in sand-cultivated soybeans. J. Plant Nutri. 8:89-97.
Peñalosa, J.M., M.J. Sarro, E. Revilla, R. Carpena, and C. Cadahía. 1989. Influ-ence of phosphorus supply on tomato plant nutrition. J. Plant Nutr. 12:647-657.
Tindall, J.A., H.A. Mills, and D.E. Radcliffe. 1990. The effect of root temperatureon nutrient uptake of tomato. J. Plant Nutri. 13:939-956.
Watanabe, F.S., W.L. Lindsay, and S.R. Olsen. 1965. Nutrient balance involvingphosphorus, iron, and zinc. Soil Sci. Soc. Am. Proc. 29:562-565.
Weir, R.G. and G.C. Cresswell. 1993. Plant Nutrient Disorders 3: VegetableCrops. Inkata Press, Melbourne, Australia.
Dow
nloa
ded
by [
Mon
ash
Uni
vers
ity L
ibra
ry]
at 0
7:46
02
Sept
embe
r 20
13