phosphorus removal by using fluidized bed reactor...
TRANSCRIPT
Phosphorus Removal from Synthetic
Anaerobic-Digested Manure Wastewater
Using an Upflow Fluidized Bed Reactor System
ENE 806
Laboratory Feasibility Studies in Environmental Engineering
Spring 2006
Instructor: Dr. Syed A. Hashsham
Report by
Ruifang Xu
PID: A36432706
April, 30th, 2006

Acknowledgment
First of all, I would like to thank Professor Syed A. Hashsham who
instructed this course and gave me so many useful advices for my project.
The Laboratory Feasibility Studies in Environmental Engineering course
was wonderful because it provided me a lot of chances to think about goal-
oriented experiment set-up instead of simply copying experiment techniques.
Professor Hashsham has given me plenty of guidance, advices and patience,
which was greatly helpful for the final successful running of the FBR system.
And, I am very thankful to Joseph Nguyen for his help and advices
during this lab course. He showed me the measurement schemes involved in
this project.
Last but not the least, I would like to thank all the classmates for their
suggestions, encourage and interest in my project.
Ruifang Xu
May, 2006
ii
TABLE OF CONTENTS Title Page i Acknowledgement ii Table of Content iii 1. Introduction 1 1.1. Phosphorus Contents in Anaerobic-digested Manure Wastewater 1 1.2. Accumulation of Struvite 1 1.3. Objectives of the present study 2 2. Materials, Equipments and Methods 2 2.1. Synthetic Anaerobic-digested Manure Wastewater 2 2.2. FBR System Set-up 3 2.2.1. FBR System Installation 3 2.2.2. FBR Specification 4 2.2.3. FBR Operation Conditions 5 2.3. Experiment Methods 6 2.3.1. Beaker batch experiment 6 2.3.2. pH Control 6 2.3.3. FBR operation 10 2.3.4. Measurement Methods 10 2.3.4.1. pH measurement 10 2.3.4.2. PO4
3- measurement 11 2.3.4.3. Mg2+ measurement 13 2.3.4.4. Ammonia and Ammonium ions measurement 16 3. Results and Discussion 18 References 22
iii
1. Introduction
1.1. Phosphorus contents in anaerobic-digested manure wastewater
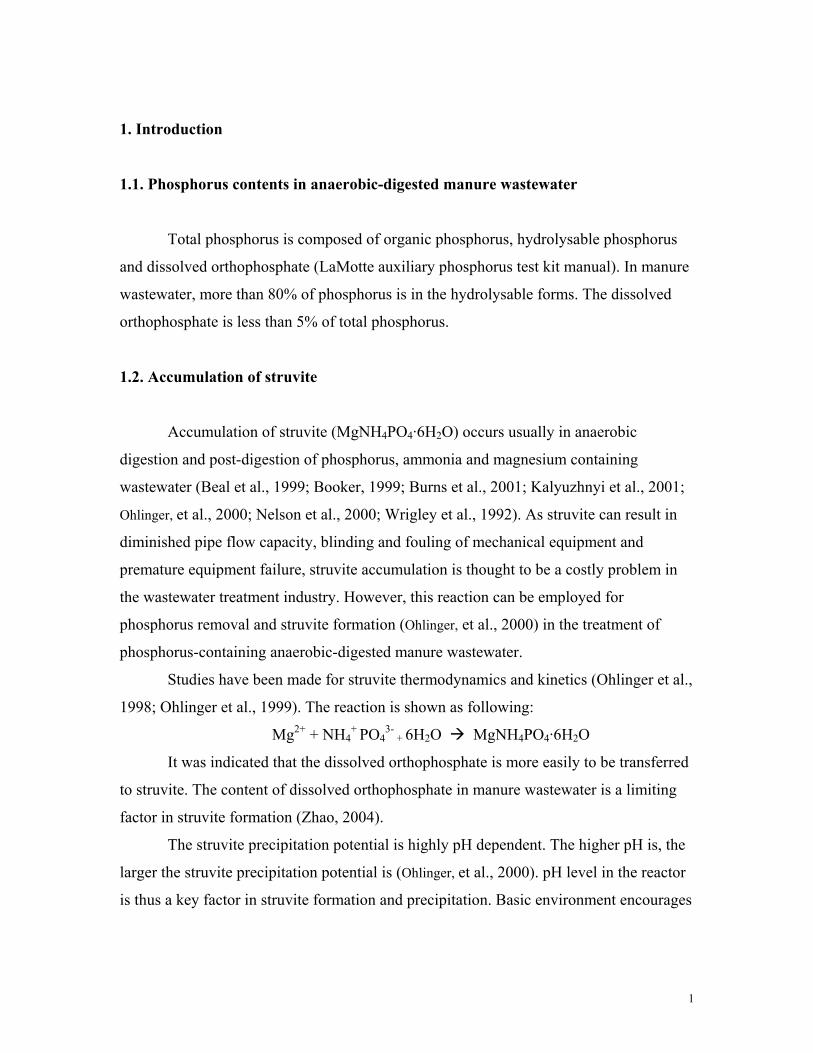
Total phosphorus is composed of organic phosphorus, hydrolysable phosphorus
and dissolved orthophosphate (LaMotte auxiliary phosphorus test kit manual). In manure
wastewater, more than 80% of phosphorus is in the hydrolysable forms. The dissolved
orthophosphate is less than 5% of total phosphorus.
1.2. Accumulation of struvite
Accumulation of struvite (MgNH4PO4·6H2O) occurs usually in anaerobic
digestion and post-digestion of phosphorus, ammonia and magnesium containing
wastewater (Beal et al., 1999; Booker, 1999; Burns et al., 2001; Kalyuzhnyi et al., 2001;
Ohlinger, et al., 2000; Nelson et al., 2000; Wrigley et al., 1992). As struvite can result in
diminished pipe flow capacity, blinding and fouling of mechanical equipment and
premature equipment failure, struvite accumulation is thought to be a costly problem in
the wastewater treatment industry. However, this reaction can be employed for
phosphorus removal and struvite formation (Ohlinger, et al., 2000) in the treatment of
phosphorus-containing anaerobic-digested manure wastewater.
Studies have been made for struvite thermodynamics and kinetics (Ohlinger et al.,
1998; Ohlinger et al., 1999). The reaction is shown as following:
Mg2+ + NH4+
PO43-
+ 6H2O MgNH4PO4·6H2O
It was indicated that the dissolved orthophosphate is more easily to be transferred
to struvite. The content of dissolved orthophosphate in manure wastewater is a limiting
factor in struvite formation (Zhao, 2004).
The struvite precipitation potential is highly pH dependent. The higher pH is, the
larger the struvite precipitation potential is (Ohlinger, et al., 2000). pH level in the reactor
is thus a key factor in struvite formation and precipitation. Basic environment encourages
1
struvite formation. However, an increase of dissolved orthophosphate content in the
wastewater facilitates the struvite formation in a great extent. Because dissolved
orthophosphate is more stable in acidic environment, the manure wastewater should be
maintained at pH below 6.50 before being treated in the reactor. pH increase of the
influent wastewater should occur in the reactor to encourage struvite formation on the
carrier media (Zhao, 2004).
The struvite kinetics showed that struvite accumulation preferentially occurs in
locations with high mixing energy (Ohlinger, et al., 2000). Because fluidized bed reactor
(FBR) presents apparent advantage in mixing energy, it has been applied to struvite
precipitation reaction (Ohlinger, et al., 2000; Hashsham and Zhao, 2004; Zhao, 2004).
Besides, FBR is capable of achieving treatment in low hydraulic retention time (HRT)
because distinct mechanical advantages and high contact area between media and the
wastewater can be attained in the FBR. And, for comparable treatment efficiency, the
required reactor volume is greatly reduced (Shieh et al., 1986; Sokol, 2003). A further
advantage is the possible elimination of the secondary clarifier in the presence of
sedimentation portion downstream the fluidization reaction portion (Sokol, 2003).
1.3. Objectives of the present study
The objectives of this study were to set up an upflow FBR system to remove the
phosphorus and ammonia in the synthetic anaerobic-digested manure wastewater by
virtue of struvite formation, and to study the influence of pH level inside the FBR on
phosphorus/ammonium removal efficiency.
2. Materials, Equipments and Methods
2.1. Synthetic Anaerobic-digested Manure Wastewater
2
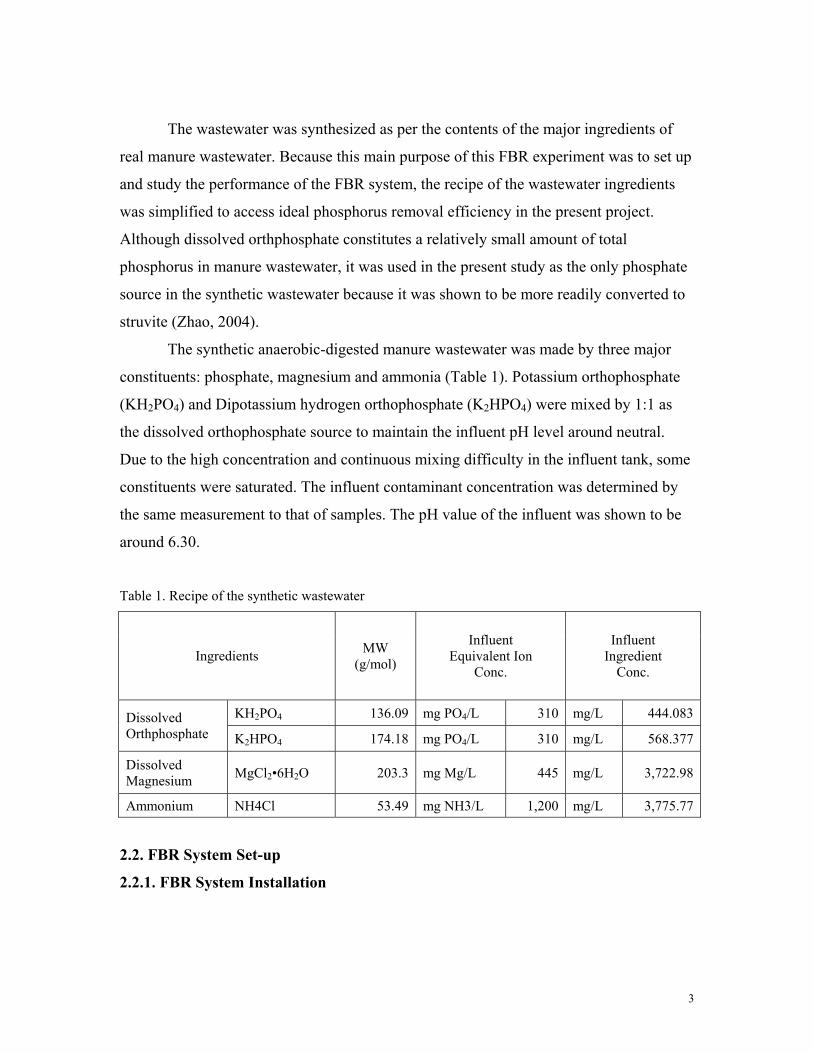
The wastewater was synthesized as per the contents of the major ingredients of
real manure wastewater. Because this main purpose of this FBR experiment was to set up
and study the performance of the FBR system, the recipe of the wastewater ingredients
was simplified to access ideal phosphorus removal efficiency in the present project.
Although dissolved orthphosphate constitutes a relatively small amount of total
phosphorus in manure wastewater, it was used in the present study as the only phosphate
source in the synthetic wastewater because it was shown to be more readily converted to
struvite (Zhao, 2004).
The synthetic anaerobic-digested manure wastewater was made by three major
constituents: phosphate, magnesium and ammonia (Table 1). Potassium orthophosphate
(KH2PO4) and Dipotassium hydrogen orthophosphate (K2HPO4) were mixed by 1:1 as
the dissolved orthophosphate source to maintain the influent pH level around neutral.
Due to the high concentration and continuous mixing difficulty in the influent tank, some
constituents were saturated. The influent contaminant concentration was determined by
the same measurement to that of samples. The pH value of the influent was shown to be
around 6.30.
Table 1. Recipe of the synthetic wastewater
Ingredients MW (g/mol)
Influent Equivalent Ion
Conc.
Influent Ingredient
Conc.
KH2PO4 136.09 mg PO4/L 310 mg/L 444.083Dissolved Orthphosphate K2HPO4 174.18 mg PO4/L 310 mg/L 568.377
Dissolved Magnesium MgCl2•6H2O 203.3 mg Mg/L 445 mg/L 3,722.98
Ammonium NH4Cl 53.49 mg NH3/L 1,200 mg/L 3,775.77
2.2. FBR System Set-up
2.2.1. FBR System Installation
3
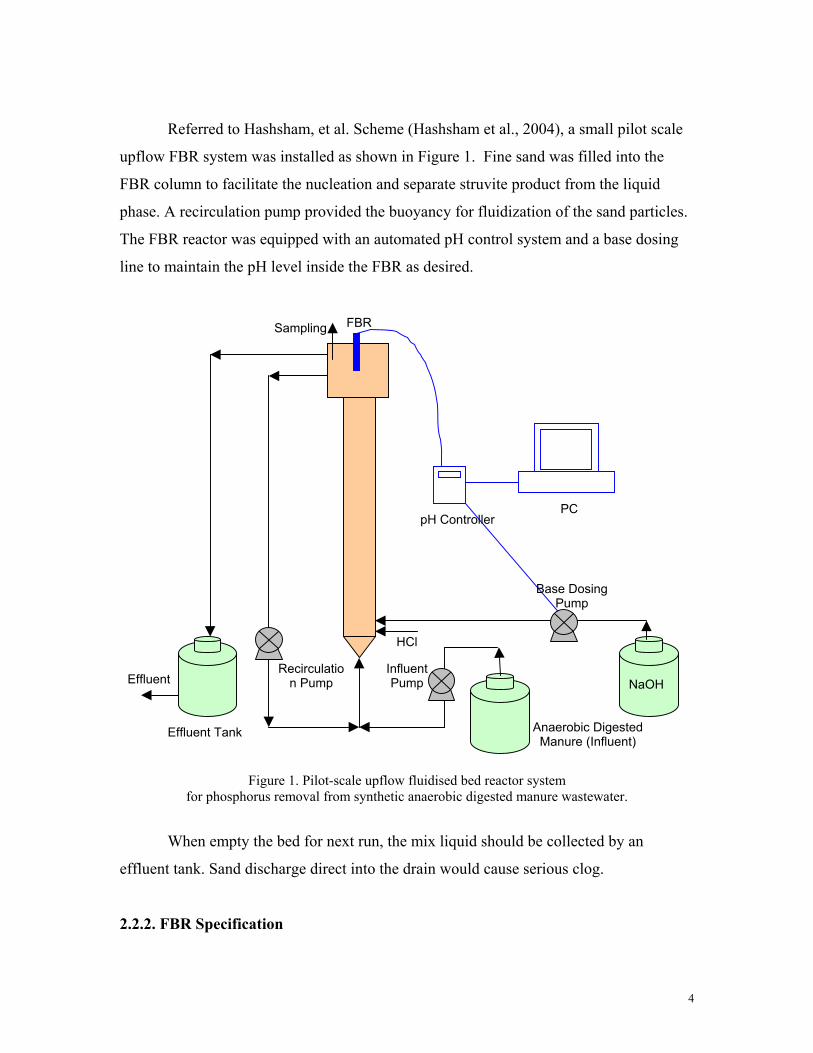
Referred to Hashsham, et al. Scheme (Hashsham et al., 2004), a small pilot scale
upflow FBR system was installed as shown in Figure 1. Fine sand was filled into the
FBR column to facilitate the nucleation and separate struvite product from the liquid
phase. A recirculation pump provided the buoyancy for fluidization of the sand particles.
The FBR reactor was equipped with an automated pH control system and a base dosing
line to maintain the pH level inside the FBR as desired.
FBR Sampling
PC pH Controller
Base Dosing Pump
HCl
Influent Pump
Recirculation Pump Effluent NaOH
Anaerobic Digested Manure (Influent)
Effluent Tank
Figure 1. Pilot-scale upflow fluidised bed reactor system
for phosphorus removal from synthetic anaerobic digested manure wastewater.
When empty the bed for next run, the mix liquid should be collected by an
effluent tank. Sand discharge direct into the drain would cause serious clog.
2.2.2. FBR Specification
4
Diameter:
Fluidization volume (Low portion): 1.5 inch (3.8 cm)
Sedimentation volume (Top portion): 3 inch (7.6 cm)
Height:
Fluidization volume (Low portion): 5 ft (152 cm)
Sedimentation volume (Top portion): 9 inch (23 cm)
Volume:
Fluidization volume (Low portion): 3.14×(3.8/2)2 × 152 = 1722.98 mL
Sedimentation volume (Top portion): 3.14×(7.6/2)2 × 23 = 1042.86 mL
Carrier Media:
Fine Sand (play ground sand) was used as the media for the struvite attachment. The
sand media filled the FBR column up to 96 cm.
By neglecting the void in the sand, the minimum effective working volume of the
FBR: 1677.64 mL
Fluidization volume (Low portion): 1722.98 mL × (152-96) ÷ 152 = 634.78 mL
Sedimentation volume (Top portion): 1042.86 mL
2.2.3. FBR Operation Conditions
Fluidization Rate: 1060.0 mL/min (tested in the empty bed when the pump was set at
120 RPM, the maximum flow rate).
Feeding Rate: 30.0 mL/min (tested when the reaction was in progress, the pump set
at 3.0 rpm)
Up-flow speed
Low portion: (1060.0 + 30.0) / [3.14×(3.8/2)2] = 96.16 cm/min = 1.60 cm/s
Top portion: (1060.0 + 30.0) / [3.14×(7.6/2)2] = 24.04 cm/min = 0.40 cm/s
When the fluidization rate and the feeding rate were set as above, the bed height was
expanded from 96 cm to 148 cm, which provides a bed expansion as 54.17%. A 4 cm gap
5
between the expansion bed and the top sedimentation portion was used to better avoid the
loss of sand media through the up-flow.
Expected minimum HRT:
1677.64 mL ÷ 30.0 mL/min = 55.92 min.
Experiment HRT:
Assuming the safety factor as 2, a HRT of 112 min was used in the experiments.
2.3. Experiment Methods
A series of beaker batch experiments was made to optimize the pH levels to be
applied in the FBR system. Then, phosphorus in synthetic manure wastewater was
removed by FBR system at two optimized pH levels to study the influence of pH level on
FBR-based phosphorus removal.
2.3.1. Beaker Batch Experiment
Each 1000 mL beaker was filled with 350 mL of fine sand, then with the synthetic
wastewater up to 700 mL. Six beaker batch reactors were set as pH levels of 7.5, 8.0, 8.5,
9.0, 9.5, 10.0 by base addition, respectively. 120 rpm mixing was applied in the reaction
for 30 min. Then the six batch reactors were stayed for 30 min for sand and struvite
precipitation. The supernatant was filtered by 0.45 µm filter for contaminant
concentration measurement. The pH levels at which the contaminants are removed at
greatest extent would be assumed as optimized and applied in FBR system.
2.3.2. pH Control
The pH level should be maintained as basic to access a good phosphorus removal
(Ohlinger, et al., 2000; Zhao, 2004). ). The manure wastewater should be maintained at pH
below 6.50 before being treated in the reactor in order for more stable presence of
6
dissolved orthophosphate in the influent. The pH increase was fulfilled in the FBR
reactor by a base dosing line. And, during struvite formation, the pH level in the reactor
generally drops. Base dosing was controlled by an automatic pH control system to
increase the pH back up. An additional acid dosing line was also prepared to offset high
pH in the case of lagging pH response.
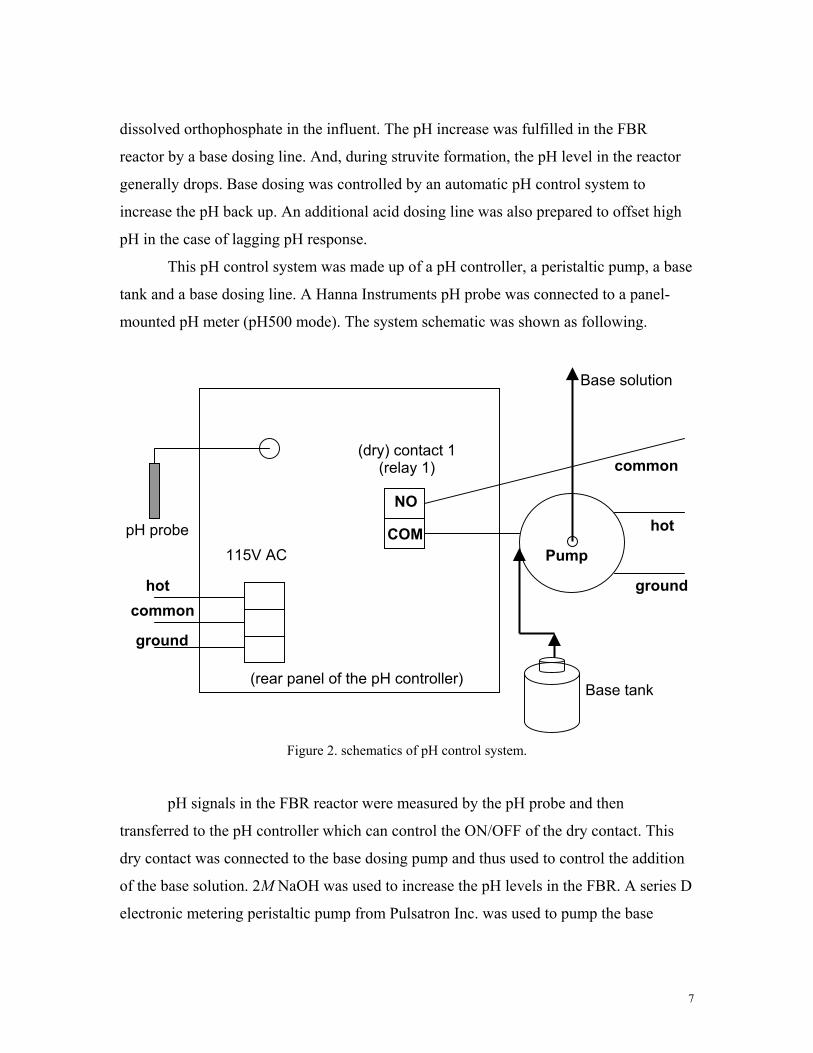
This pH control system was made up of a pH controller, a peristaltic pump, a base
tank and a base dosing line. A Hanna Instruments pH probe was connected to a panel-
mounted pH meter (pH500 mode). The system schematic was shown as following.
Base solution
(dry) contact 1(relay 1) common
NO hot pH probe COM
115V AC Pump
hot groundcommon
ground
(rear panel of the pH controller)Base tank
Figure 2. schematics of pH control system.
pH signals in the FBR reactor were measured by the pH probe and then
transferred to the pH controller which can control the ON/OFF of the dry contact. This
dry contact was connected to the base dosing pump and thus used to control the addition
of the base solution. 2M NaOH was used to increase the pH levels in the FBR. A series D
electronic metering peristaltic pump from Pulsatron Inc. was used to pump the base
7
solution. The power switch ON/OFF status can be changed under the control of the signal
transferred from the pH control system.
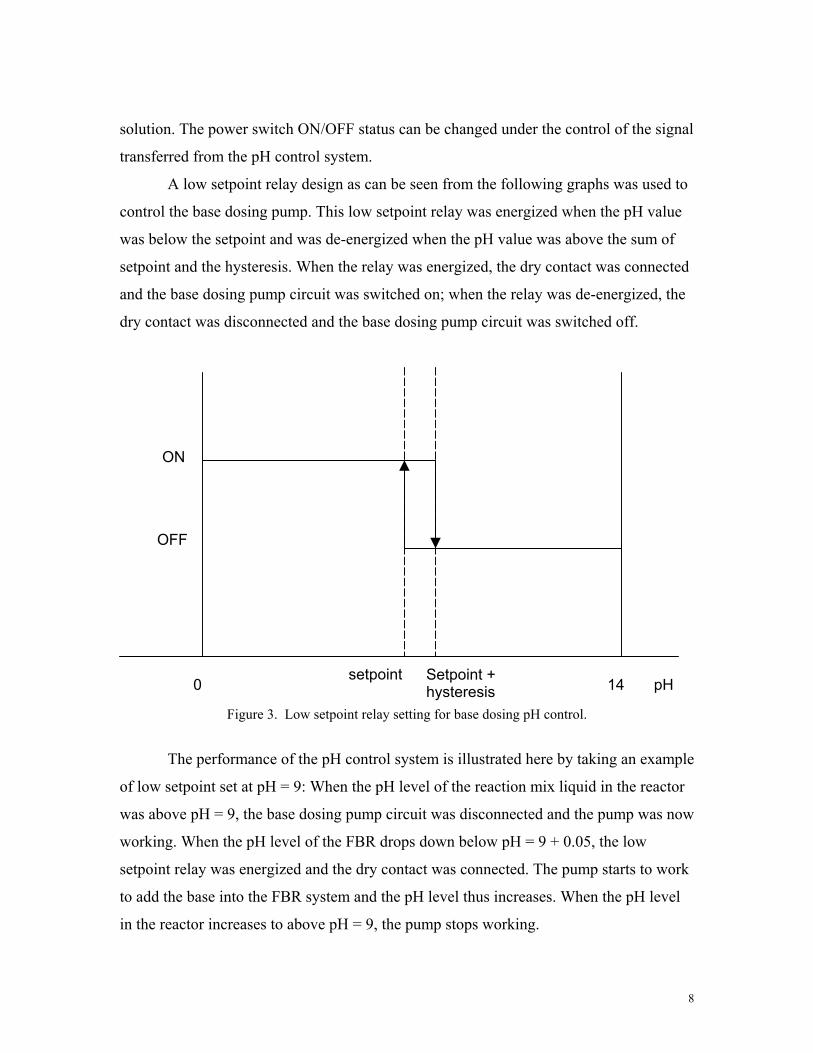
A low setpoint relay design as can be seen from the following graphs was used to
control the base dosing pump. This low setpoint relay was energized when the pH value
was below the setpoint and was de-energized when the pH value was above the sum of
setpoint and the hysteresis. When the relay was energized, the dry contact was connected
and the base dosing pump circuit was switched on; when the relay was de-energized, the
dry contact was disconnected and the base dosing pump circuit was switched off.
ON
OFF
setpoint Setpoint + hysteresis 0 14 pH
Figure 3. Low setpoint relay setting for base dosing pH control.
The performance of the pH control system is illustrated here by taking an example
of low setpoint set at pH = 9: When the pH level of the reaction mix liquid in the reactor
was above pH = 9, the base dosing pump circuit was disconnected and the pump was now
working. When the pH level of the FBR drops down below pH = 9 + 0.05, the low
setpoint relay was energized and the dry contact was connected. The pump starts to work
to add the base into the FBR system and the pH level thus increases. When the pH level
in the reactor increases to above pH = 9, the pump stops working.
8

Protocol of pH control system:
Prepare 2M (80g/L) base solution NaOH.
Assemble the suck tubing and effluent tubing to the base dosing peristaltic pump;
dip the suck tubing into the 2M NaOH.
Connect the pH probe to the pH controller; conduct the three-point calibration: pH
= 7.01, 4.01, 10.01.
Connect the signal input wire of the base dosing pump to the dry contact 1 of the
pH controller.
Prime the pump:
Air must be purged from the pump head before the pump will operate against
pressure. Priming removes the air. It should be performed when the pump was first
installed and whenever the fluid supply was changed. Pump priming was conducted by:
While pressing START/STOP button, apply the pump power until the
congratulations information shows on the pump display.
The pump was then primed at the maximum fixed rate (100%) for 5 min. If the
base solution was not transported to the connector converging into the influent tubing,
restart the pump for another time of priming till the base dosing tubing was filled with the
base solution.
After pump priming, re-applying the pump power while holding the
START/STOP button to enter the mode setting. Set the pump mode at fixed rate mode,
and change the fixed rate to 15%. Now the pH control system was ready to control the
base dosing for the FBR system.
Although theoretically only base dosing line was necessary for the struvite
formation reaction, an acid dosing line was still needed in case that the pH level drops
down below the setpoint too much. This might happen when the signaling was lagging
behind of the real pH change inside the FBR reactor because a peristaltic pump se the pH
signals were detected by the pH 500 probe set downstream (on the top of) the FBR. For
9

simplification, 2M HCl was injected into the joint of influent line and base dosing line by
using a syringe, when needed.
2.3.3. FBR Operation
Assemble the FBR system according to the schematics (Figure 1).
Load the FBR with fine sand up to the half of the bed height, 96 cm; make a maker.
Set the pH probe near the overflow port of the FBR column (on the top of the FBR).
Turn on the influent pump at a flow rate of 30 mL/min (pump set as 3.0 RPM). The
flow rate was double checked during the experiment.
When the liquid level in the FBR reaches the overflow port for the recirculation
circuit, turn on the recirculation pump to the maximum rate, 120 rpm, to initiate the
fluidization in the FBR; the recirculation flow rate was supposed to be around 1060.0
mL/min; make sure the expansion height was around 148 cm.
After the pH level in the FBR reached and maintained around the target values under
the control of the pH control system, the experiment was assumed as initiated. An
experiment run time was set as 60 min, referred to the empty bed HRT of 54.41 min.
After one run of experiment at a specific pH level, do sampling:
The effluent was sampled from the top of (downstream) the FBR; the influent sample was
directly obtained from the influent tank. Then, the samples was filtered by using 0.45 µm
liquid filters to remove the solids so that the samples can be measured by Ion
Chromatography and Flame Atomic Absorption in the subsequent steps. The samples
were diluted to the test range of standard curves before measurement.
2.3.4. Measurement Methods
2.3.4.1. pH measurement
10
The pH 500 probe was set at the overflow port on the top of (downstream) the
FBR column. The pH values were read by the pH controller.
2.3.4.2. PO43- measurement
The concentration of the anion PO43- was measured by Ion Chromatography (IC).
Protocol of Ion Chromatography:
make Eluent Solution, sodium bicarbonate-sodium carbonate, 0.0017M NaHCO3-
0.0018M Na2CO3: Dissolve 0.5712 g NaHCO3 and 0.7632 g Na2CO3 in water and dilute
to 4 L.
make Regenerant Solution, H2SO4, 0.025N: Dilute 2.8 mL conc H2SO4 to 4L.
add the eluent solution into the eluent solution carboy and the regenerant solution
into the regenerant solution carboy; close the caps.
Make sure the waste outlets go to the waste carboy.
Turn on the power for IC.
Turn on the air; make sure the air pressure is between 70 to 80 psi.
Set the inlet pressure to the IC at 10 psi.
Switch on <Cell>.
Wait for 10~30 min till the conductivity goes down to 10 µs.
During the waiting, program the software Turbochrom:
go to TC4>TCNav navigator.
go to Methods and then the menu Instruments>Data channels, set the run time as 7 min
(Notes: the effluent time of PO43- is about 4~6 min).
go to Setup and then the menu File>open, open the file with default setting
C:\TC\ene806\spr2006\ic.mth, set the name of starting file for saving the IC result
information.
Turn on Auto Offset.
Turn off <Inject> on the control box.
11

Rinse the sample syringe by DI water and then take 500~1,000 µL of sample by a
syringe and inject the sample into the IC equipment.
Turn on < Inject >.
Go to the data collection box and push <start> on the panel to start IC reading.
After the run is done, open Graphic and then return, open the “New Data File”,
open the new file, open Peak Report, write down the peak area value (uV·sec)at the target
peak position (referred to standard curve peak position).
Repeat from the inject step for next sample.
PO43- Concentration Standard Curve:
A standard curve was made before the measurement of samples. The standard
solution series was prepared as per the following recipe (Table 2).
Table 2. Concentration series recipe for PO4
3+ standard curve. Dilution # #0 #1 #2 #3 Blank
Total Eqivalent PO43-
(mg/L) 100.0 75.0 50.0 25.0 0
Eqivalent PO43-
(mg/L) 50.0 37.5 25.0 12.5 0
KH2PO4 (mg/L) 71.626 53.720 35.813 17.907 0 Eqivalent PO4
3- (mg/L) 50.0 37.5 25.0 12.5 0
K2HPO4 (mg/L) 91.674 68.756 45.837 22.919 0
The PO43- standard curve (Figure 4) was obtained from the IC peak area values of
the PO43- standard solutions (Table 3). The effluent peak was at about 2.5 min after
injection.
Table 3. Results for PO4
3+ standard curve.
PO43+ Dilution Blank #1 #2 #3 #4
Total Eqivalent PO43-
(mg/L) 0 25 50 75 100
IC Peak Area (uV·sec) 0 929,974.83 1,688,730.02 2,523,192.16 3,618,088.96
12
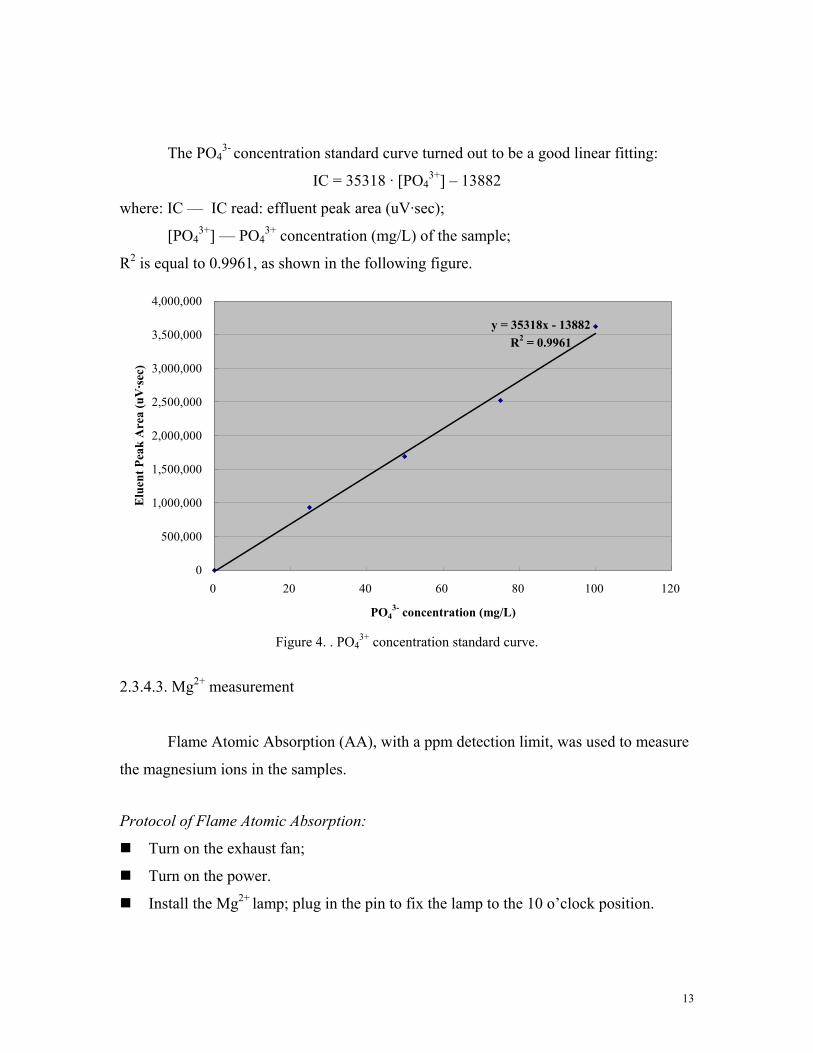
The PO43- concentration standard curve turned out to be a good linear fitting:
IC = 35318 · [PO43+] – 13882
where: IC — IC read: effluent peak area (uV·sec);
[PO43+] — PO4
3+ concentration (mg/L) of the sample;
R2 is equal to 0.9961, as shown in the following figure.
y = 35318x - 13882R2 = 0.9961
0
500,000
1,000,000
1,500,000
2,000,000
2,500,000
3,000,000
3,500,000
4,000,000
0 20 40 60 80 100 1
PO43- concentration (mg/L)
Elu
ent P
eak
Are
a (u
V·se
c)
20
Figure 4. . PO4
3+ concentration standard curve.
2.3.4.3. Mg2+ measurement
Flame Atomic Absorption (AA), with a ppm detection limit, was used to measure
the magnesium ions in the samples.
Protocol of Flame Atomic Absorption:
Turn on the exhaust fan;
Turn on the power.
Install the Mg2+ lamp; plug in the pin to fix the lamp to the 10 o’clock position.
13

Open acetylene cylinder and turn on the set the pressure at 14~15 psi.
Turn on the AA power.
Check the manual book Analytical Methods for Atomic Absorption Spectroscopy for the
parameter setting for Mg2+; set the standard conditions accordingly:
λ: 285.2 nm;
SBW (Windows): 0.7;
program the Flame AA:
Press <Param. Entry>:
lamp current: 6~15 mA; choose a medium value: 10 mA.
INT Time: 0.10.
Replicates: 3.
Calibration: NONLIN (non-linear)
Press <En> (Energy): to make energy at the maximum level.
Adjust the coarse knob and the fine knob to adjust <CTS> to around 109.
Press <GAIN> to relate <CTS> to <EN> (Energy): 67 (key energy setting).
Press <Cont> and <A/Z> to check the deviation of the signal baseline.
Measure the standard solutions or the samples:
Turn on the Air-Acetylene in <Oxidant>; hold <ignite> for about 5 seconds to ignite
the flame.
Dip the sample tubing into the DI water to check the baseline signal; press <A/Z> to
set the blank value.
(Notes: the blank sample, i.e., DI water, should not change the blue flame color too much.
Too yellow flame indicates the contamination of the DI water).
Dip the sample tubing into the sample; press <Data> and then <Read> to get the
mean value of the three sample replicates, write down the number.
Go to next sample.
Turn off air in <Oxidant>.
Turn off acetylene cylinder (general switch).
Turn on air in <Oxidant> again to burn out the residual gas.
14

Turn off air in <Oxidant” till air meter comes down to 0.
Turn off power for the AA.
Turn off the exhaust fan.
Mg2+ Concentration Standard Curve:
A standard curve was made before the measurement of samples. The standard
solution series was prepared as per the following recipe (Table 4).
Table 4. Concentration series recipe for Mg2+ standard curve.
Mg2+ Dilution Blank #1 #2 #3 #4 #5 #6 #7 #8
Eqivalent Mg2+ (mg/L) 0 5 10 15 20 25 50 75 100
MgCl2•6H2O (mg/L) 0 41.83 83.66 125.49 167.33 209.16 418.32 627.47 836.63
The Mg2+ standard curve (Figure 5) was made from the Flame AA reads of the
Mg2+ standard solutions (Table 5).
Table 5. Results for Mg2+ standard curve.
Mg2+ Dilution Blank #1 #2 #3 #4 #5 #6 #7 #8 Eqivalent Mg2+
(mg/L) 0 5 10 15 20 25 50 75 100
Flame AA Reads 0 0.378 0.618 0.786 0.863 0.929 1.140 1.238 1.290
The standard curve is in a non-linear fitting with the Mg2+ concentration, but it
appeared to be a good exponential fitting with the Mg2+ concentration over the test range:
AA = 0.3053·ln[Mg2+] - 0.0744
where: AA — Flame AA read;
[Mg2+] — Mg2+ concentration (mg/L) of the sample;
with R2 equal to 0.9915, as shown in the following figure.
15
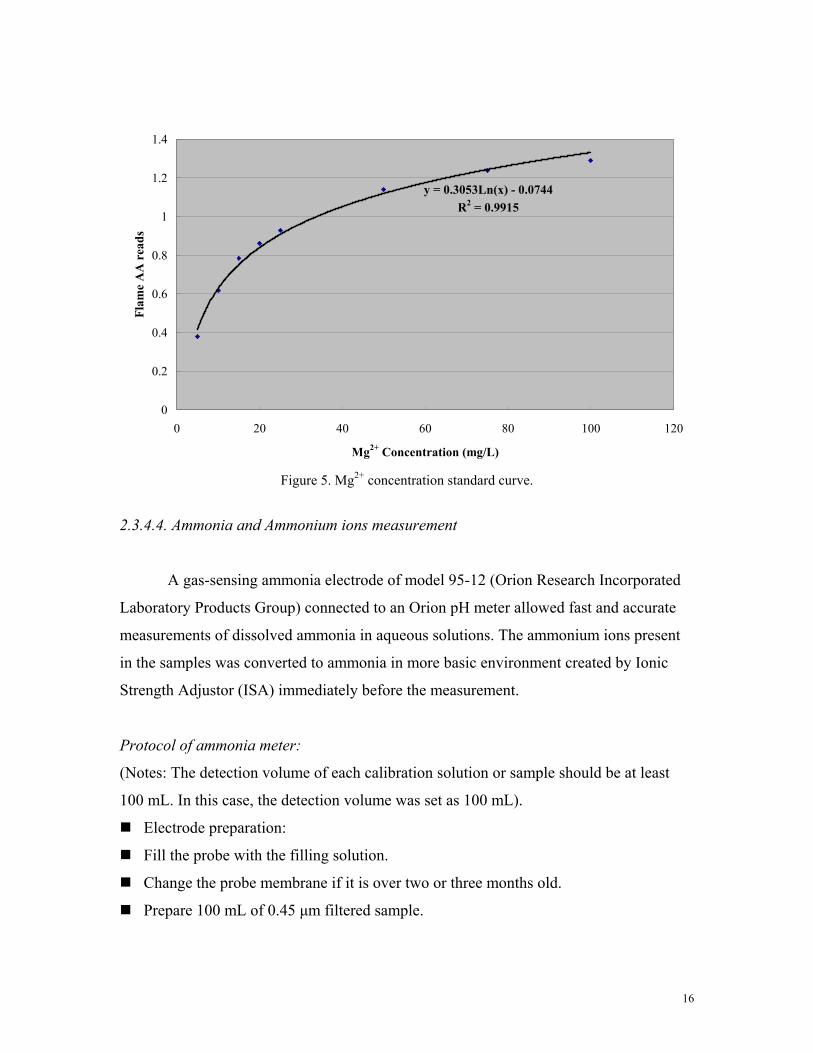
y = 0.3053Ln(x) - 0.0744R2 = 0.9915
0
0.2
0.4
0.6
0.8
1
1.2
1.4
0 20 40 60 80 100 120
Mg2+ Concentration (mg/L)
Flam
e A
A r
eads
Figure 5. Mg2+ concentration standard curve.
2.3.4.4. Ammonia and Ammonium ions measurement
A gas-sensing ammonia electrode of model 95-12 (Orion Research Incorporated
Laboratory Products Group) connected to an Orion pH meter allowed fast and accurate
measurements of dissolved ammonia in aqueous solutions. The ammonium ions present
in the samples was converted to ammonia in more basic environment created by Ionic
Strength Adjustor (ISA) immediately before the measurement.
Protocol of ammonia meter:
(Notes: The detection volume of each calibration solution or sample should be at least
100 mL. In this case, the detection volume was set as 100 mL).
Electrode preparation:
Fill the probe with the filling solution.
Change the probe membrane if it is over two or three months old.
Prepare 100 mL of 0.45 µm filtered sample.
16
A two-point calibration was conducted before the use of ammonia meter:
Prepare 100 mL fresh standard calibration solution right before measuring the
samples (Notes: the ammonium samples are not stable in aqueous solutions. It would be
better if the calibration can be made immediately before the sample measurement). Table 6. Recipe for ammonium calibration solutions.
Calibration solution 1 Calibration solution 2
Eqivalent NH4+ (mg/L) 100 1,000
NH4Cl (mg/L ) 314.647 3,146.47
Turn on the power switch of the ammonia meter;
Turn on the magnetic stirrer;
Put a magnetic stirrer stick into the 100 mL Calibration solution 1.
Add 2 mL of pH-adjusting ISA solution into the sample.
When the reads on the display of the ammonia meter becomes steady, press <Cal>
and <Enter>, press the up and down arrows to select the concentration of the calibration
solution under measurement, then press <Enter>, the LED of the Calibration 1 would be
lighted up. When this first calibration is done the LED would be automatically turned off
and the LED for Calibration 2 would be lighted up, which indicates that the Calibration 2
is ready to be conducted.
Take the ammonia probe out of the Calibration solution 1 and rinse it by DI water;
put it into the 100 mL Calibration solution 2.
Repeat the above steps for Calibration 2, and the LED of Calibration 2 would be
turned off automatically when the Calibration 2 is done. At the same time, the LED of
Sample would be on, which indicates that the sample measurement is ready.
Check if the electrode operation slope is normal as shown in the Table 4 in Orion
Model 95-12 ammonia electrode instruction manual (Orion research incorporated
laboratory products group).
Sample measurement:
Take the ammonia probe out of the Calibration solution 2 and rinse it by DI water;
put it into the 100 mL sample.
17
Add 2 mL ISA solution and wait for about 30~60 seconds until the read on display
becomes steady and the LED “ready” is on. Write down the read as the ammonium
concentration of the sample.
(Notes: If the sample concentration is way above 1,000 mg NH4+/L, the sample has to be
diluted to fit the range of 0 ~ 1,000 NH4+/L before measurement).
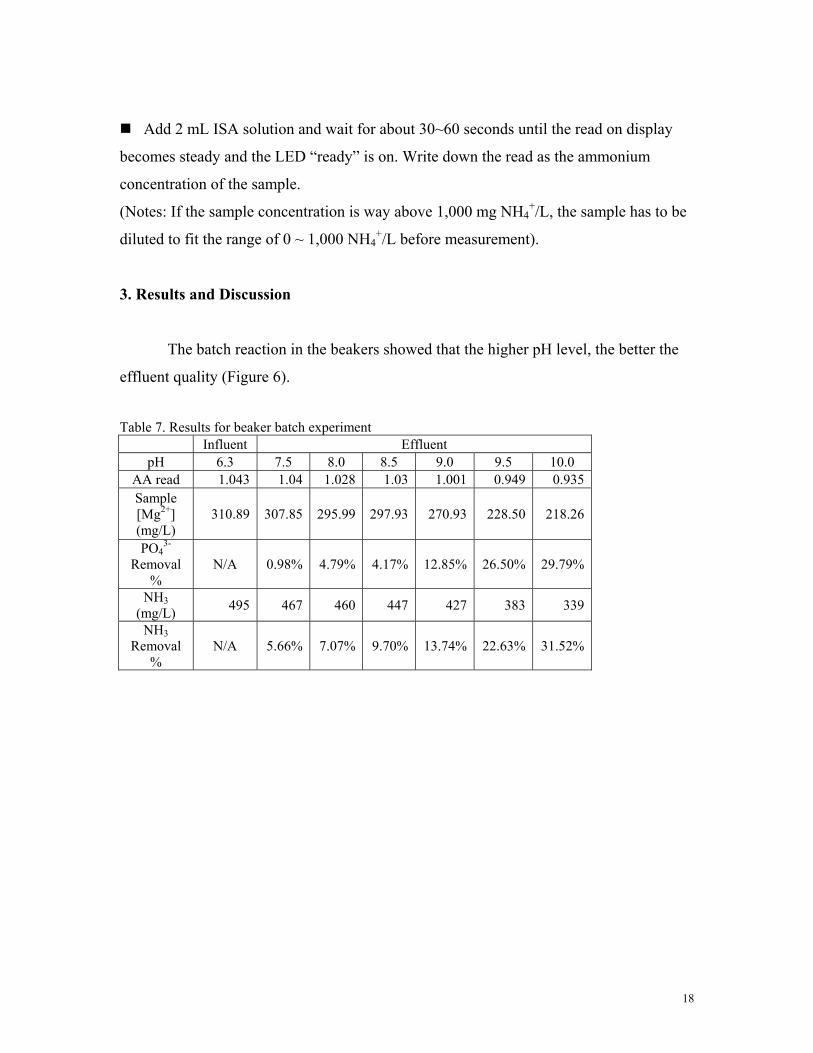
3. Results and Discussion
The batch reaction in the beakers showed that the higher pH level, the better the
effluent quality (Figure 6).
Table 7. Results for beaker batch experiment Influent Effluent
pH 6.3 7.5 8.0 8.5 9.0 9.5 10.0 AA read 1.043 1.04 1.028 1.03 1.001 0.949 0.935 Sample [Mg2+] (mg/L)
310.89 307.85 295.99 297.93 270.93 228.50 218.26
PO43-
Removal %
N/A 0.98% 4.79% 4.17% 12.85% 26.50% 29.79%
NH3 (mg/L) 495 467 460 447 427 383 339
NH3 Removal
% N/A 5.66% 7.07% 9.70% 13.74% 22.63% 31.52%
18
0
50
100
150
200
250
300
350
400
450
500
7.0 7.5 8.0 8.5 9.0 9.5 10.0 10.5pH
Con
cent
ratio
n (m
g/L
)
Mg2+NH3
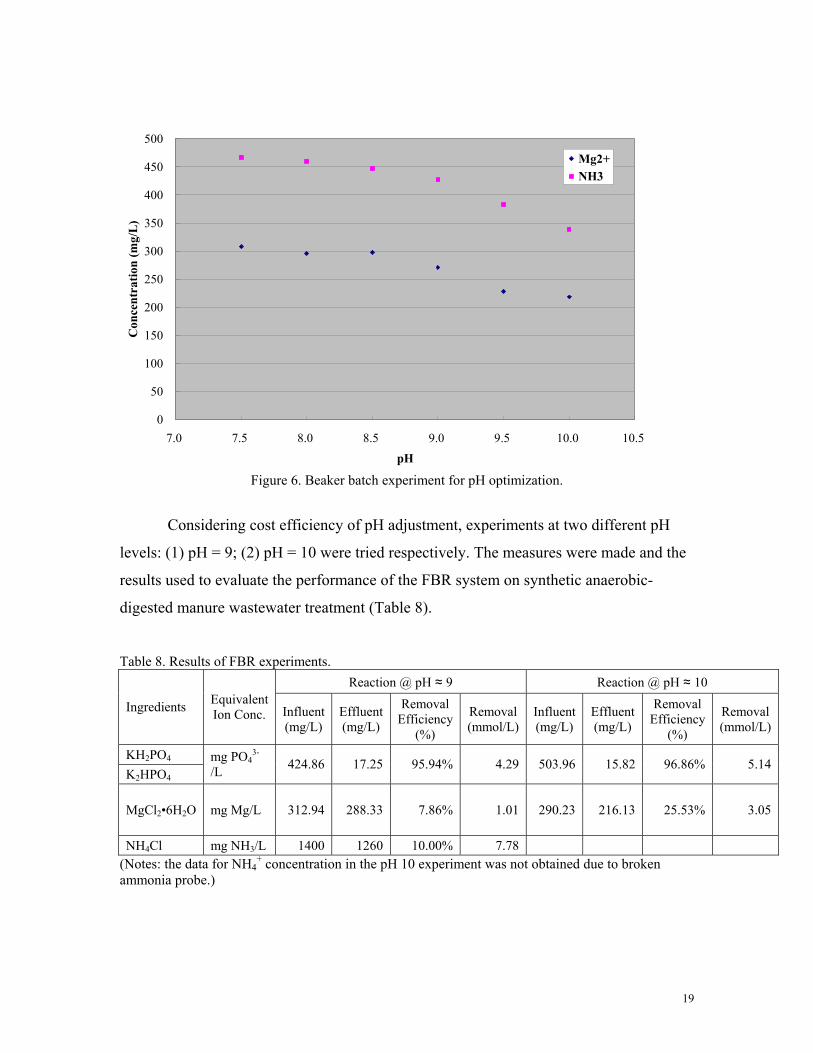
Figure 6. Beaker batch experiment for pH optimization.
Considering cost efficiency of pH adjustment, experiments at two different pH
levels: (1) pH = 9; (2) pH = 10 were tried respectively. The measures were made and the
results used to evaluate the performance of the FBR system on synthetic anaerobic-
digested manure wastewater treatment (Table 8).
Table 8. Results of FBR experiments.
Reaction @ pH ≈ 9 Reaction @ pH ≈ 10
Ingredients Equivalent Ion Conc. Influent
(mg/L) Effluent(mg/L)
RemovalEfficiency
(%)
Removal(mmol/L)
Influent (mg/L)
Effluent (mg/L)
RemovalEfficiency
(%)
Removal(mmol/L)
KH2PO4 K2HPO4
mg PO43-
/L 424.86 17.25 95.94% 4.29 503.96 15.82 96.86% 5.14
MgCl2•6H2O mg Mg/L 312.94 288.33 7.86% 1.01 290.23 216.13 25.53% 3.05
NH4Cl mg NH3/L 1400 1260 10.00% 7.78 (Notes: the data for NH4
+ concentration in the pH 10 experiment was not obtained due to broken ammonia probe.)
19
Both of the experiments in basic environments (pH = 9, 10) showed very good
FBR performance in phosphorus removal. More than 95% of dissolved phosphate was
removed. The pH 10 reaction presented a better phosphorus treatment performance than
the pH 9 level reaction, but the difference was not significant.
The removed amounts of the contaminants were compared to study the
mechanism of this treatment process. If the phosphorus in the wastewater had been
effectively transferred to struvite, the removed amounts of the three major constituents of
struvite (MgNH4PO4·6H2O), PO43-, Mg2+ and NH3, should constitute a molar ratio of 1:
1 :1. However, it was not fully proved by the results. Compared to phosphate removal,
the removed amount of magnesium was below the expected level, whereas the removed
amount of ammonia was higher than expected (Table 8). Further analysis needs to be
made to explain the product chemistry. The recommendation method is to take out the
final aggregate product attached on the surface of sand media and the aggregate in the
reactor mix liquid for air drying. The dry product is re-dissolved by water or acid for the
measurement of the concentration of the three ions. This further study would need to be
conducted at different pH levels. In the meanwhile, the struvite precipitate on the surface
of sand media would need to be studied for pH optimization. Optimal pH environment is
assumed to facilitate greater struvite precipitation instead of small struvite suspended
particles in the mix liquid. All these would help to explain the mechanism causing the
difference in removal efficiency in different pH environments.
Further work would be attempted to treat real anaerobic-digested manure
wastewater with phosphorus mainly from hydrolysable phosphorus by using this FBR
system. First, increase in the content of dissolved orthophosphate in anaerobic digestion
process would be a great help for the post-digestion FBR treatment for phosphorus
removal. Second, parameter setting of FBR system would have to be adjusted to treat
different make-up manure wastewater.
And, the abundance of ammonium in the wastewater after phosphorus removing
is a problem. Ammonia removal has to be done for the manure wastewater before the
final discharge.
20
The major operation problem in this struvite formation study was pH adjustment.
Because the pH probe was sitting on the top of the FBR reactor, downstream the whole
system, a large delay of pH detection was determined due to the small overall flow rate.
Even with low concentration and slow dosing rate of the base and the acid, it was
difficult to automatically control the pH level at the target ones using the pH control
system. In this study, a 10~15% fixed rate of 2M NaOH dose pumping appeared to
optimally balance the pH drop along the reaction progress, but the tubing connection and
the influent concentration would highly influence the optimal base pumping rates.
21

References
Beal L.J., R.T. Burns, Stalder K.J. 1999. Effect of anaerobic digestion on struvite production for
nutrient removal from swine waste prior to land application. Presented at the 1999 ASAE International
Meeting in Toronto, Canada. Paper No. 994042. ASAE St. Joseph, MI.
Booker, N.A., A.J. Priestley and Fraser I.H. 1999. Struvite formation in wastewater treatment plants:
opportunities for nutrient recovery. Environmental Technology. 20: 777-782.
Burns R.T., L.B. Moody, F.R. Walker, D.R. Raman. 2001. Laboratory and in-situ reductions of
soluble phosphorus in liquid swine waste slurries. Environmental Technology. 22(11): 1273-1278.
Hashsham, Syed and Zhao, Xianda. 2004. Sustainable Manure Management in Michigan by
Phosphorus and Ammonium Recovery as Struvite (MgNH4PO4.6H2O) (proposal).
Kalyuzhnyi S., V. Skylar, A Epov, I. Arkhipchenko, I. Barboulina, O. Orlova, A. Klapwijk. 2001.
Phosphate recovery via precipitation from anerobically treated pig manure wastewater. Proceedings o
the 2nd International Conference on Phosphorus Recovery for Recycling from Sewage and Animal
wastes Noordwijkerhout, Holland. March 12-14.
LaMotte auxiliary phosphorus test kit manual.
http://72.14.203.104/search?q=cache:6d4M4AX1RDkJ:www.lamotte.com/pages/common/pdf/instruct
/7884.pdf+hydrolyzable+phosphorus&hl=en&gl=us&ct=clnk&cd=2.
Nelson N.O., R.L. Mikkelsen, D.L. Hesterberg. 2000. Struvite formation to remove phosphorus from
anaerobic swine lagoon effluent. Proceedings of the 8th International Symposium on Animal,
Agricultural and Food Processing Wastes October. Des Moines, Iowa. J.A. Moore (ed), ASAE
Publications. St. Joseph, MI.
Ohlinger, K.N., Young, T.M. and Schroeder, E.D. 1998. Predicting struvite formation in digestion.
Water Res., 32(12): 3607-3614.
22
23
Ohlinger, K.N., Young, T.M. and Schroeder, E.D. 1999. Kinetics effects on perferential struvite
accumulation in wastewater. J. Envir. Engrg., ASCE. 125(8): 730-737.
Ohlinger, K.N., P.E. Member, ASCE, T.M.Y., Associate Member, ASCE and E.D. Schroeder,
Member, ASCE. 2000. Postdigestion struvite precipitation using a fluidized bed reactor. J. Envir.
Engrg., ASCE. 126(4): 361-368.
Orion research incorporated laboratory products group. Model 95-12 ammonia electrode instruction
manual.
Shieh W.K., D.K. Keenan. 1986. Fluidized bed biofilm reactor for wastewater treatment, in: A.
Fiechter (Ed.), Advances in Biochemical Engineering/Biotechnology, vol. 33, Springer, Berlin, pp.
132-168.
Sokol, W. 2003. Treatment of refinery wastewater in a three-phase fluidized bed bioreactor with a low
density biomass support. Biochem. Eng. J. 15: 1-10.
Wrigley T.J., K.M. Webb, H. Venkitachalm. 1992. A laboratory study of struvite precipitation after
digestion of piggery wastes. Bioresource Technology. 41:117-121.
Zhao, Xianda. 2004. Remove Phosphorus from cow manure mixture in fluidized bed reactor
(presentation).