phosphorus management tool - maryland...
TRANSCRIPT

1 For more information on this and other topics visit the University of Maryland Extension website at www.extension.umd.edu
i
University of Maryland Phosphorus
Management Tool: Technical Users Guide
The Phosphorus Index Concept
In 1990, a national cooperative workgroup of scientists from numerous universities and the United States Department of Agriculture (USDA) was organized to develop a procedure that could identify soils, farm management practices, and specific locations within a farm where phosphorus (P) losses in field drainage water may pose the potential for negative environmental impacts on nearby surface waters. The goals of this national work group were:
To develop an easily used field rating system that rates farm fields according to the potential for P loss to surface water (the Phosphorus Index).
To relate the P Index to the sensitivity of receiving surface waters to eutrophication and degradation resulting from nonpoint source P enrichment.
To facilitate adaptation and modification of the P Index to regional and site-specific conditions.
To develop agricultural management practices that will minimize the buildup of soil P to excessive levels and the transport of P from soils to sensitive water bodies.
The Objective of the University of Maryland Phosphorus Management Tool
Our objective was to develop a phosphorus site index (PSI) that uses readily available information to
evaluate the relative risk of P transport from agricultural fields, including vegetable and row crop production and
pasture based systems where P may be applied either as inorganic or organic fertilizer. Furthermore, the PSI
should be applicable within all physiographic provinces present in Maryland. Phosphorus transport is controlled
by site characteristics (e.g. hydrology and slope), climate, and P sources (e.g. manure, inorganic fertilizer, and
soil P). The revised PSI, or the University of Maryland – Phosphorus Management Tool (UM-PMT), seeks to
include new science relative to site and source factors and highlight management decisions so that the learning
opportunities associated with performing a P index are more pronounced. The overall objective is to identify
critical areas where there is a high P loss potential due to both a high transport potential and a large source of P,
and also to encourage the use of management practices in those critical source areas that protect water quality.
Development of the University of Maryland – Phosphorus Management Tool
In 1994, we began the development of a P Index tool specifically tailored to Maryland’s soils, agricultural
management practices, climate, topography, hydrology, and surface water characteristics. The Maryland PSI
Extension Bulletin EB-405
2013
2 For more information on this and other topics visit the University of Maryland Extension website at www.extension.umd.edu
was originally based on the generalized national model published in 1993 by the USDA’s Natural Resources
Conservation Service, but it has undergone many substantive changes and modifications during its development
to more accurately reflect Maryland conditions.
An Overview of How the University of Maryland – Phosphorus Management Tool Works
Equation 1 presents the generalized equation for the new University of Maryland Phosphorus
Management Tool (UM-PMT), which replaces the 2005 Maryland PSI. The UM-PMT calculates the risk of P
transport through surface runoff (RUNOFF), subsurface discharge (SUBSURFACE), and particulate bound P
(PARTICULATE). In Eq. 1, DBF represents the combined distance and buffer factors; DPRr and DPRsub are the
dissolved P source risk factors for runoff and subsurface losses, respectively; SD is the subsurface drainage
transport factor; SR is the surface runoff transport factor; and SED is the sediment transport factor derived from
RUSLE or RUSLE2. The construction of each of these factors is discussed in detail below. In general, the new
arithmetic construction captures the intent of the original P index. It still identifies the areas where high
transport potential and high source are present, but it does so separately for each of the three major P transport
pathways.
Equation 1. General equation for the University of Maryland – Phosphorus Management Tool.
FIVSEDDBFEPARTICULAT
DPRSRDBFRUNOFF
DPRSDSUBSURFACE
Where
EPARTICULATRUNOFFSUBSURFACEUMPMT
r
sub
**
**
*
)(*1.0
Interpretation of the Final Scores
The final P loss ratings are divided into three interpretative categories: low, medium, and high. Fields that score
less than or equal to 50 are considered to present a low potential for P movement from the site. However, since
according to current Maryland state regulations, all fields evaluated by the UM-PMT have soil test P greater than
150 FIV, which is considered excessive by agronomic standards, some risk exists relative to potential build-up of
soil P concentrations due to application of P in excess of crop needs. Therefore, it is recommended that total P
applied in a three year period not exceed the anticipated three year crop removal rate for P based on realistic
yield goals and published crop removal rates. The intent is to prevent further buildup of soil P and therefore
increase risk.
Fields that score from 51 – 100 present a medium potential for P movement from the site. They likely
have intermediate soil P concentrations and soil P saturation, combined with moderate transport potential in
one or more transport categories. Therefore, the recommendation is to limit P application within a single year to
a one year crop removal rate of P based on realistic yield goals and published crop removal rates. The intent is to
prevent further buildup of soil P and also protect against incidental transfer of organic or inorganic nutrients
associated with higher application rates.
3 For more information on this and other topics visit the University of Maryland Extension website at www.extension.umd.edu
Finally, fields scoring greater than 100 are considered to have a high potential for P movement. They
likely have high soil P concentrations and soil P saturation combined with high transport potential. No P should
be applied to these sites and active remediation techniques (e.g. crop drawdown of soil P, dissolved P filters, or
drainage management) should be implemented in order to reduce the potential for P movement from the site.
Gathering All Appropriate Information
The following is a list of information needed to determine the UM-PMT, as well as the source from which to obtain the information.
Information Source #1: Farm Operator
Soil-test P converted to Maryland Fertility Index Value (FIV) units from soil-test report
Degree of P saturation (DPSM3) predicted by Mehlich 3 from soil test report
Amount, analysis and type of P fertilizer applied
Application method and timing of P fertilizer application
Amount and type of manure, compost or biosolids applied
Application method and timing for manure, compost, or biosolids application
Manure, compost, or biosolids analysis
Type and width of vegetated field buffers
Crop rotation sequence
Tillage rotation sequence
Conservation practices such as strip or contour cropping, buffer strips, etc.
Artificial drainage areas (drainage ditches, tile drains, or mole drains) Information Source #2: Web Soil Survey
Predominant soil mapping unit in the field
Soil permeability class
Soil drainage class
Hydrology soil group Information Source #3: Field Visit
Distance from edge of the field to the nearest down gradient surface water (feet)
Slope of field (length and steepness) Information Source #4: RUSLE or RUSLE2 Calculation Capability
RUSLE “P” practices: ridge height, furrow grade, cover management condition, number of crop strips across RUSLE slope, width of crop and/or buffer strips
Supplies Necessary for Data Collection
The following is a list of supplies and equipment that are necessary for collecting P Site Index data:
UM-PMT Technical Users Guide
Maryland Nutrient Management Training Manual
Web Soil Survey
Clinometer or similar slope measuring device
Measuring wheel or measuring tape
Calculating the UM-PMT
On the following pages are detailed instructions on how to calculate the three components of the UM-
PMT and determine the final score.

4 For more information on this and other topics visit the University of Maryland Extension website at www.extension.umd.edu
Calculating the University of Maryland Phosphorus Management Tool
Combined Distance and Buffer Factor
Equation 2. Combined distance buffer factor calculation.
BFDFDBF *
Equation 2 presents the calculation for the combined Distance-Buffer Factor (DBF). The DBF accounts for
management and land cover of the intervening area between the managed field and surface water receiving
runoff. The user should select the Distance Factor (DF) from Table 1 based on the distance from the edge of the
field to the nearest body of surface water that receives surface discharge from the field. The user should also
select the appropriate Buffer Factor (BF) from Table 2. The Distance-Buffer Factor (DBF) is applied to the
transport components for dissolved P and particulate P in runoff, presented as RUNOFF and PARTICULATE in Eq.
1, respectively. The DBF will NOT be applied to subsurface transport (SUBSURFACE, Eq. 1), since subsurface
transport of P is not controlled to the same extent by distance from water or intervening land cover as surface
transported P.
Table 2. Types of buffers† and resulting buffer factors that will modify the Distance Risk Factor to yield the combined Distance Buffer Factor.
Type of Buffer Buffer Factor (BF)
>50 feet Permanent Vegetated Buffer Meeting USDA-NRCS Standards
0.8
>35 feet Permanent Vegetated Buffer 0.9
<35 feet Vegetated Buffer or No Buffer 1.0
†Permanent vegetated buffers do not receive any phosphorus applications.
Table 1. Distance from edge of field to surface water† and resulting distance factor.
Distance from Surface Water Distance Factor (DF)
>500 feet 0.2
350 to 500 feet 0.4
200 to 349 feet 0.6
100 to 199 feet 0.8
<100 feet 1.0
†Surface water includes any permanent, continuous, physical conduit for transporting surface water, including permanent streams and ditches even if they only flow intermittently during the course of the year.

5 For more information on this and other topics visit the University of Maryland Extension website at www.extension.umd.edu
Source Risk Factors for Dissolved Phosphorus
The RUNOFF and SUBSURFACE components from Eq. 1 describe the transport of dissolved P, which can originate
from desorbable soil P or soluble P in organic or inorganic amendments. The UM-PMT includes separate
dissolved P risk factors for the surface runoff (DPRr) and subsurface discharge components (DPRsub). The
generalized form for both is presented in Equation 3.
Equation 3. Subsurface and runoff dissolved P source risk factor calculation.
)*2( 3Mapp DPSWSPDPR
The subsurface and runoff dissolved P source risk factor (DPRsub & DPRr represent the combination of
soluble P applied, the method it is applied by, and the amount of soluble P already in the soil (Eq. 5). DPRr and
DPRsub are calculated by summing the water soluble P application factor (WSPapp) and two times the degree of P
saturation (DPSM3) predicted by Mehlich 3 extractable P, Fe, and Al as per Sims et al. (2002). The same value for
DPSM3 should be used for both DPRr and DPRsub; however, WSPapp will be different for DPRr and DPRsub. Equation
4 describes the water soluble P application factor (WSPapp) that is used to represent the risk posed by the total
amount of soluble P applied and the method used to apply it.
Equation 4. Water soluble phosphorus application factor for subsurface and runoff dissolved P source risk factor.
r
nn
rapp
sub
nn
subapp
AMTPPSCWSP
AMTPPSCWSP
**
**
00
00
The WSPapp is calculated by multiplying the P source coefficient (PSC) for each source by the planned
total P application rate (TP) for that source and the application method factor (AMsub or AMr). The AM
represents the risk posed by the application method and is taken from Table 3 for DPRsub and Table 4 for DPRr.
The WSPapp should be calculated separately for each planned P application (e.g. starter fertilizer, biosolids,
manure) and then the separate WSPapp factors should be summed. This will account for the cumulative risk
posed by the application of P at multiple times to both surface and subsurface discharge. The PSC’s account for
the varying solubility of different sources of P and are provided in Table 5 or the PSC can be determined
individually by analyzing the amendment for WEP100 and using Eq. 5. If laboratory data is not available and an
amendment is not listed in Table 5 then a standard PSC of 0.6 should be used. If calculating the actual PSC of an
amendment using Eq. 5, the method described by Elliott et al. (2006) should be used, where WEP100 is the water-
extractable P in the amendment (g kg-1) determined in the laboratory using the method of Kleinman et al.
(2007).
Equation 5. Phosphorus source coefficient calculation using water-extractable phosphorus concentration (Elliott et al., 2006).
100*117.0 WEPPSC

6 For more information on this and other topics visit the University of Maryland Extension website at www.extension.umd.edu
Table 4. Phosphorus application method factor for surface transport component (AMr).
Application Method Value
None Applied 0
Subsurface placement or immediate full incorporation (>90% residue) 0.2
Incorporated within 5 days of application (≥50% residue) 0.4
Surface applied March - Nov. OR incorporated after 5 days OR <50% residue 0.6
Surface applied or incorporated after 5 days Dec. - Feb. 0.8
Table 5. Standard phosphorus source coefficients for organic and inorganic amendments.
Organic P Source PSC
Default 0.6 Inorganic P fertilizer 0.6 Swine manure 0.6 Other manures (beef, dairy, poultry, horse, etc.) 0.5 BPR & BNR biosolids 0.5 Alum-treated manures 0.3 Biosolids (all except BPR & BNR biosolids) 0.2
Table 3. Phosphorus application method factor for subsurface transport component (AMsub).
Application Method Value
None Applied 0
Incorporated within 5 days with soil mixing (precludes straight aerator) March - Nov.
0.32
Incorporated within 5 days with soil mixing (precludes straight aerator) Dec. - Feb.
0.4
Surface applied and subsurface placement without soil mixing (includes banded fertilizer and injection without soil mixing) March - Nov.
0.64
Surface applied and subsurface placement without soil mixing (includes banded fertilizer) Dec. - Feb.
0.8
7 For more information on this and other topics visit the University of Maryland Extension website at www.extension.umd.edu
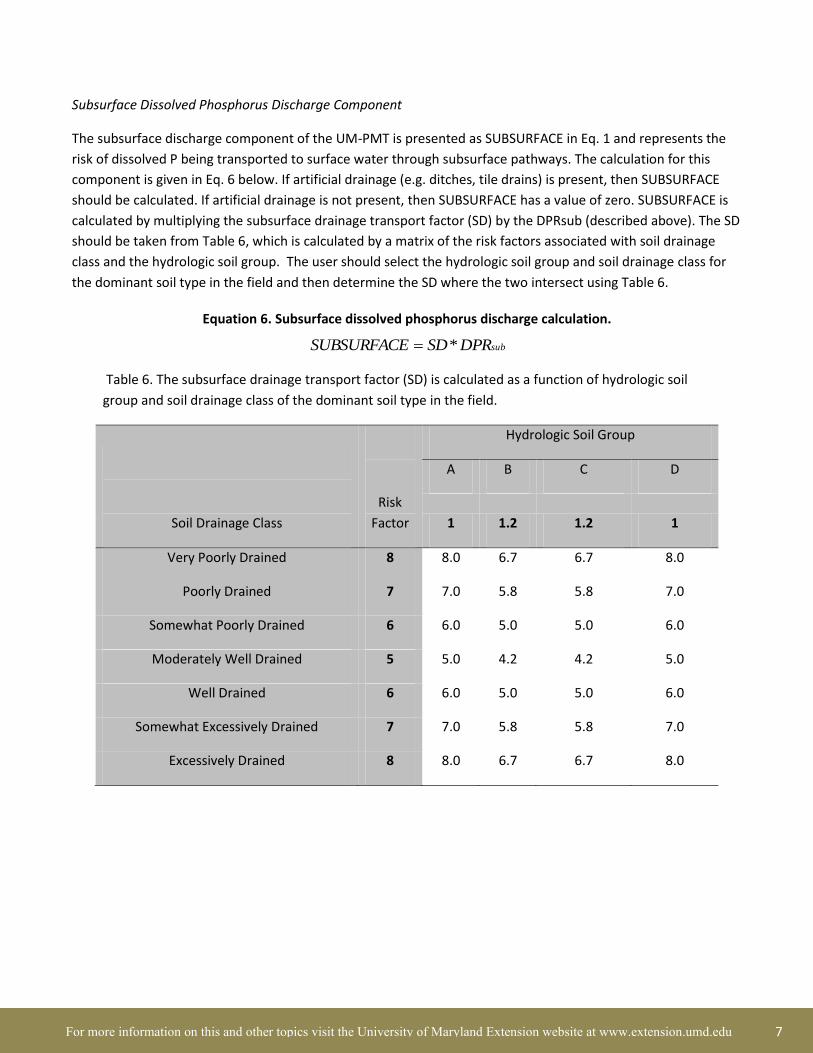
Subsurface Dissolved Phosphorus Discharge Component
The subsurface discharge component of the UM-PMT is presented as SUBSURFACE in Eq. 1 and represents the
risk of dissolved P being transported to surface water through subsurface pathways. The calculation for this
component is given in Eq. 6 below. If artificial drainage (e.g. ditches, tile drains) is present, then SUBSURFACE
should be calculated. If artificial drainage is not present, then SUBSURFACE has a value of zero. SUBSURFACE is
calculated by multiplying the subsurface drainage transport factor (SD) by the DPRsub (described above). The SD
should be taken from Table 6, which is calculated by a matrix of the risk factors associated with soil drainage
class and the hydrologic soil group. The user should select the hydrologic soil group and soil drainage class for
the dominant soil type in the field and then determine the SD where the two intersect using Table 6.
Equation 6. Subsurface dissolved phosphorus discharge calculation.
subDPRSDSUBSURFACE *
Table 6. The subsurface drainage transport factor (SD) is calculated as a function of hydrologic soil
group and soil drainage class of the dominant soil type in the field.
Soil Drainage Class
Risk
Factor
Hydrologic Soil Group
A B C D
1 1.2 1.2 1
Very Poorly Drained 8 8.0 6.7 6.7 8.0
Poorly Drained 7 7.0 5.8 5.8 7.0
Somewhat Poorly Drained 6 6.0 5.0 5.0 6.0
Moderately Well Drained 5 5.0 4.2 4.2 5.0
Well Drained 6 6.0 5.0 5.0 6.0
Somewhat Excessively Drained 7 7.0 5.8 5.8 7.0
Excessively Drained 8 8.0 6.7 6.7 8.0
8 For more information on this and other topics visit the University of Maryland Extension website at www.extension.umd.edu
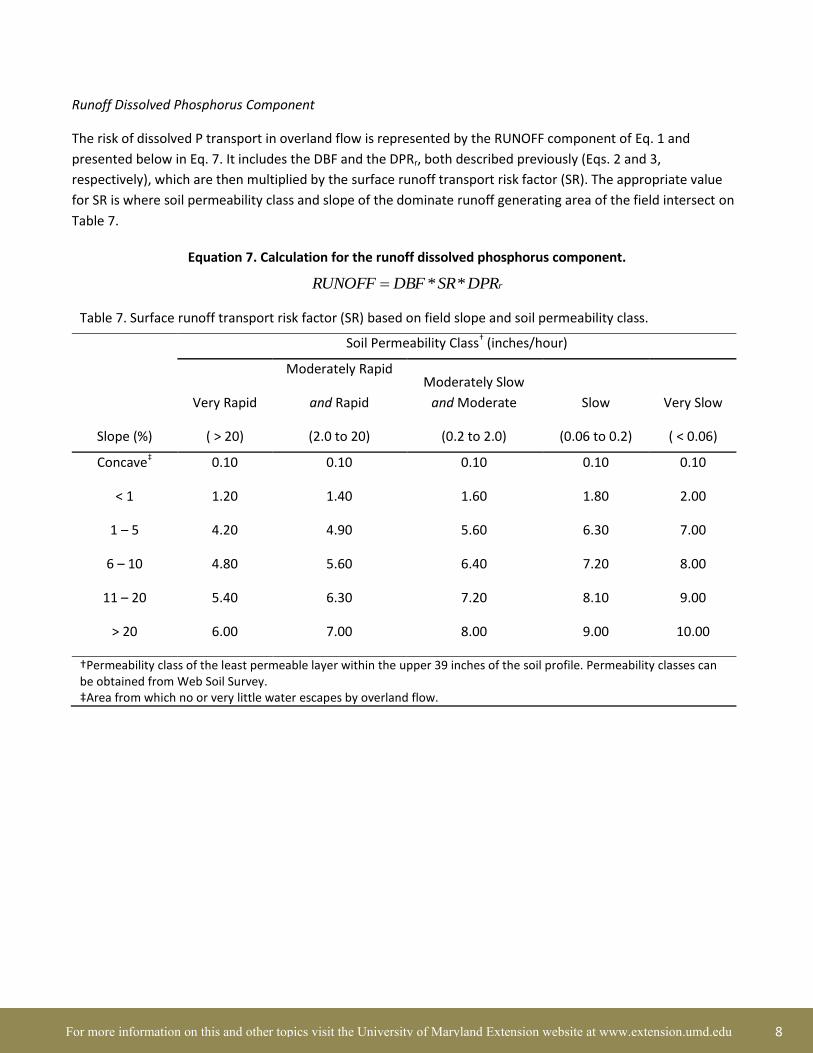
Runoff Dissolved Phosphorus Component
The risk of dissolved P transport in overland flow is represented by the RUNOFF component of Eq. 1 and
presented below in Eq. 7. It includes the DBF and the DPRr, both described previously (Eqs. 2 and 3,
respectively), which are then multiplied by the surface runoff transport risk factor (SR). The appropriate value
for SR is where soil permeability class and slope of the dominate runoff generating area of the field intersect on
Table 7.
Equation 7. Calculation for the runoff dissolved phosphorus component.
rDPRSRDBFRUNOFF **
Table 7. Surface runoff transport risk factor (SR) based on field slope and soil permeability class.
Slope (%)
Soil Permeability Class† (inches/hour)
Very Rapid
( > 20)
Moderately Rapid
and Rapid
(2.0 to 20)
Moderately Slow
and Moderate
(0.2 to 2.0)
Slow
(0.06 to 0.2)
Very Slow
( < 0.06)
Concave‡ 0.10 0.10 0.10 0.10 0.10
< 1 1.20 1.40 1.60 1.80 2.00
1 – 5 4.20 4.90 5.60 6.30 7.00
6 – 10 4.80 5.60 6.40 7.20 8.00
11 – 20 5.40 6.30 7.20 8.10 9.00
> 20 6.00 7.00 8.00 9.00 10.00
†Permeability class of the least permeable layer within the upper 39 inches of the soil profile. Permeability classes can be obtained from Web Soil Survey. ‡Area from which no or very little water escapes by overland flow.

9 For more information on this and other topics visit the University of Maryland Extension website at www.extension.umd.edu
Particulate Phosphorus Component
Equation 8 presents the calculation for the particulate P component (PARTICULATE) of the UM-PMT. It is
calculated as the product of the University of Maryland soil P Fertility Index Value (FIV), the combined distance-
buffer factor (DBF, Eq. 2), and the Sediment Transport Factor (SED) value.
Equation 8. Particulate phosphorus transport component calculation.
FIVSEDDBFEPARTICULAT **
The Sediment Transport Factor (SED) value is determined by risk categories assigned to RUSLE or
RUSLE2 scores and presented in Table 8. NRCS has moved to the use of RUSLE2 as their supported tool for
predicting potential sediment loss from fields. However, in the interim as users learn RUSLE2, either RUSLE
calculated within NuMan Pro software or the annual soil loss calculated by RUSLE2 for a field may be used in
calculating UM-PMT.
Table 8. Distribution of RUSLE scores into risk based categories.
RUSLE or RUSLE2† “A” Value SED Value
<1 2
1 – 2 4
2 – 3 6
3 – 4 8
>4 10
†Either RUSLE or RUSLE2 annual soil loss value in tons acre-1 may be used.
10 For more information on this and other topics visit the University of Maryland Extension website at www.extension.umd.edu
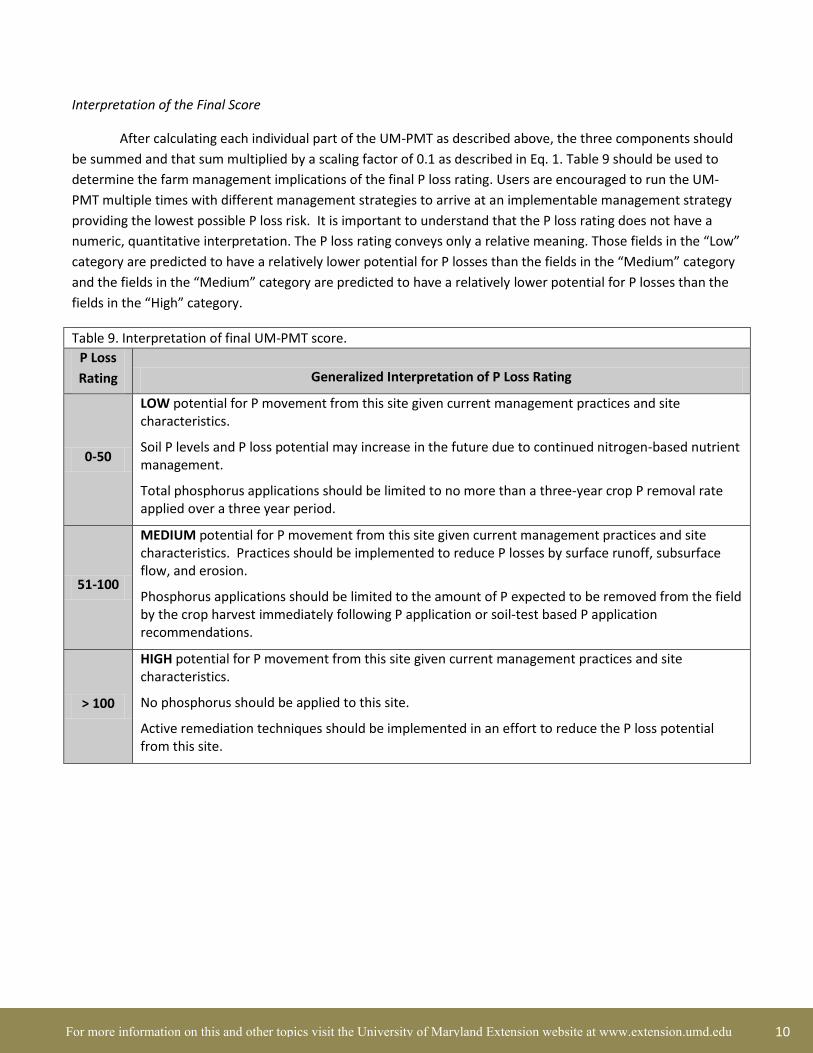
Interpretation of the Final Score
After calculating each individual part of the UM-PMT as described above, the three components should
be summed and that sum multiplied by a scaling factor of 0.1 as described in Eq. 1. Table 9 should be used to
determine the farm management implications of the final P loss rating. Users are encouraged to run the UM-
PMT multiple times with different management strategies to arrive at an implementable management strategy
providing the lowest possible P loss risk. It is important to understand that the P loss rating does not have a
numeric, quantitative interpretation. The P loss rating conveys only a relative meaning. Those fields in the “Low”
category are predicted to have a relatively lower potential for P losses than the fields in the “Medium” category
and the fields in the “Medium” category are predicted to have a relatively lower potential for P losses than the
fields in the “High” category.
Table 9. Interpretation of final UM-PMT score.
P Loss
Rating Generalized Interpretation of P Loss Rating
0-50
LOW potential for P movement from this site given current management practices and site characteristics.
Soil P levels and P loss potential may increase in the future due to continued nitrogen-based nutrient management.
Total phosphorus applications should be limited to no more than a three-year crop P removal rate applied over a three year period.
51-100
MEDIUM potential for P movement from this site given current management practices and site characteristics. Practices should be implemented to reduce P losses by surface runoff, subsurface flow, and erosion.
Phosphorus applications should be limited to the amount of P expected to be removed from the field by the crop harvest immediately following P application or soil-test based P application recommendations.
> 100
HIGH potential for P movement from this site given current management practices and site characteristics.
No phosphorus should be applied to this site.
Active remediation techniques should be implemented in an effort to reduce the P loss potential from this site.
11 For more information on this and other topics visit the University of Maryland Extension website at www.extension.umd.edu
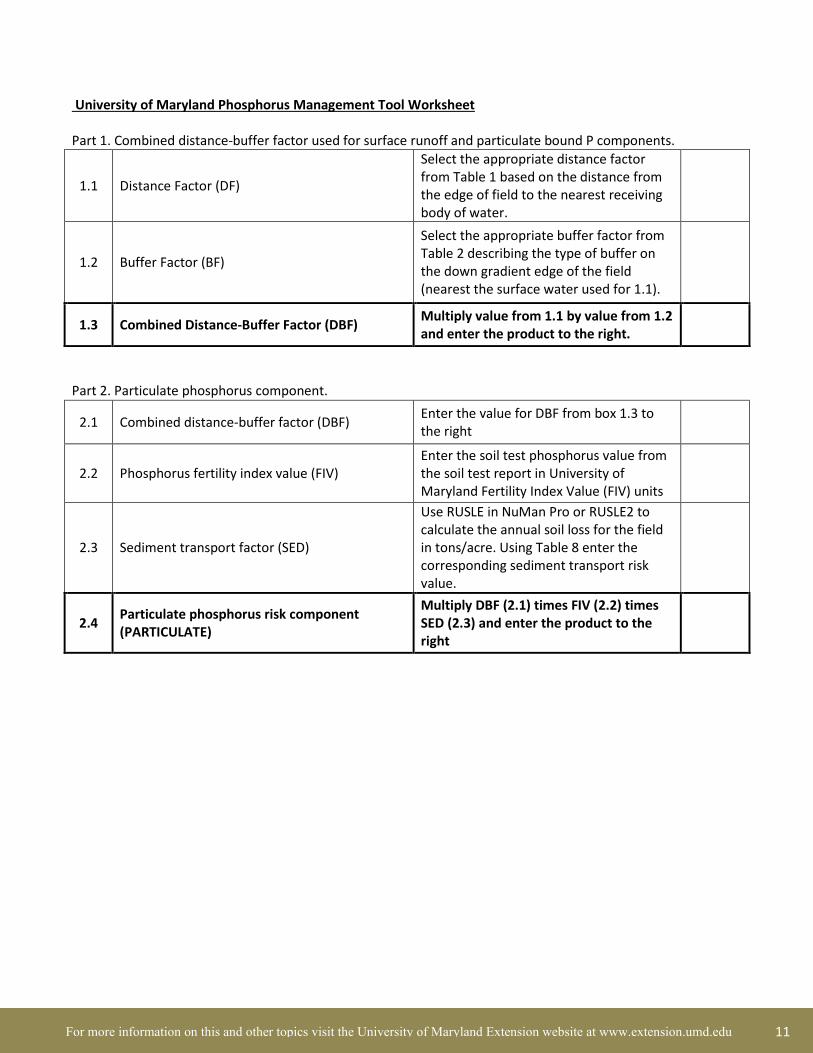
University of Maryland Phosphorus Management Tool Worksheet
Part 1. Combined distance-buffer factor used for surface runoff and particulate bound P components.
1.1 Distance Factor (DF)
Select the appropriate distance factor from Table 1 based on the distance from the edge of field to the nearest receiving body of water.
1.2 Buffer Factor (BF)
Select the appropriate buffer factor from Table 2 describing the type of buffer on the down gradient edge of the field (nearest the surface water used for 1.1).
1.3 Combined Distance-Buffer Factor (DBF) Multiply value from 1.1 by value from 1.2 and enter the product to the right.
Part 2. Particulate phosphorus component.
2.1 Combined distance-buffer factor (DBF) Enter the value for DBF from box 1.3 to the right
2.2 Phosphorus fertility index value (FIV) Enter the soil test phosphorus value from the soil test report in University of Maryland Fertility Index Value (FIV) units
2.3 Sediment transport factor (SED)
Use RUSLE in NuMan Pro or RUSLE2 to calculate the annual soil loss for the field in tons/acre. Using Table 8 enter the corresponding sediment transport risk value.
2.4 Particulate phosphorus risk component (PARTICULATE)
Multiply DBF (2.1) times FIV (2.2) times SED (2.3) and enter the product to the right

12 For more information on this and other topics visit the University of Maryland Extension website at www.extension.umd.edu
Part 3. Surface dissolved phosphorus source factor. Complete for each planned application and then sum. Add additional applications as needed. All P applications for the upcoming crop year should be included in the total.
3.1.a PSC - First application Enter the PSC from the Table 5 or calculate the PSC as described in Eq. 5
3.1.b Total P application - First application Enter the total P application rate in lbs-P2O5/acre.
3.1.c Runoff application method (AMr) Enter the value from Table 4 that corresponds to the application method for this P application.
3.1 First P application factor Multiply 3.1.a times 3.1.b times 3.1.c and enter the result
3.2.a PSC - Second application Enter the PSC from the Table 5 or calculate the PSC as described in Eq. 5
3.2.b Total P application - Second application Enter the total P application rate in lbs-P2O5/acre.
3.2.c Runoff application method (AMr) Enter the value from Table 4 that corresponds to the application method for this P application.
3.2 Second P application factor Multiply 3.2.a times 3.2.b times 3.2.c and enter the result
3.3 Total P application factor (WSPapp-r)
Sum 3.1 and 3.2 and any other application factors that were completed on separate sheets and enter the value in the space to the right
3.4 Degree of P saturation (DPSM3) Enter the DPSM3 value from your soil test report.
3.5 Surface dissolved P source risk factor (DPRr) Multiply the DPSM3 value from box 3.4 by 2 and add the product to the WSPapp-r value in box 3.3

13 For more information on this and other topics visit the University of Maryland Extension website at www.extension.umd.edu
Part 4. Surface runoff dissolved phosphorus transport component.
4.1 Combined distance-buffer factor (DBF) Enter the value for DBF from box 1.3 to the right
4.2 Surface dissolved P source risk factor (DPRr) Enter the value from box 3.5 to the right
4.3.a Soil permeability class Using Web Soil Survey, enter the soil permeability class of the dominant soil type in the field
4.3.b Slope
Enter the percent slope of the dominate runoff generating area of the field in the box to the right. The slope should have been measured during the site visit.
4.3 Surface runoff transport risk factor (SR)
Using the matrix in Table 7, enter the value that corresponds to the soil permeability class (4.3.a) and slope (4.3.b) for the dominate runoff generating area of the field
4.4 Runoff dissolved phosphorus risk component (RUNOFF)
Multiply the DBF (4.1) times the DPRr (4.2) times the SR (4.3) and enter the product to the right

14 For more information on this and other topics visit the University of Maryland Extension website at www.extension.umd.edu
Part 5. Subsurface dissolved phosphorus source factor. Complete for each planned application and then sum. Add additional applications as needed. All P applications for the upcoming crop year should be included in the total.
5.1.a PSC - First application Enter the PSC from the Table 5 or calculate the PSC as described in Eq. 5
5.1.b Total P application - First application Enter the total P application rate in lbs-P2O5/acre.
5.1.c Subsurface transport application method - First application (AMsub)
Enter the value from Table 3 that corresponds to the application method for this P application.
5.1 First P application factor Multiply 5.1.a times 5.1.b times 5.1.c and enter the result
5.2.a PSC - Second application Enter the PSC from the Table 5 or calculate the PSC as described in Eq. 5
5.2.b Total P application - Second application Enter the total P application rate in lbs-P2O5/acre.
5.2.c Subsurface transport application method - Second application (AMsub)
Enter the value from Table 3 that corresponds to the application method for this P application.
5.2 Second P application factor Multiply 5.2.a times 5.2.b times 5.2.c and enter the result
5.3 Total P application factor (WSPapp-sub)
Sum 5.1 and 5.2 and any other application factors that were completed on separate sheets and enter the value in the space to the right
5.4 Degree of P saturation (DPSM3) Enter the DPSM3 value from your soil test report.
5.5 Subsurface dissolved P source risk factor (DPRsub)
Multiply the DPSM3 value from box 5.4 by 2 and add the product to the WSPapp-sub value in box 5.3

15 For more information on this and other topics visit the University of Maryland Extension website at www.extension.umd.edu
Part 6: Subsurface dissolved phosphorus transport component.
6.1.a Soil Drainage Class
Select the soil drainage class from the dominant map unit from Web Soil Survey and enter the appropriate risk factor from Table 6.
6.1.b Hydrologic Soil Group
Select the hydrologic soil group from the dominant map unit from Web Soil Survey and enter the appropriate risk Factor from Table 6.
6.1 Subsurface drainage transport factor (SD)
Use the Soil Drainage Class (4.1.a) and Hydrologic Soil Group (4.1.b) risk factors entered above to find the appropriate Subsurface Drainage Transport Factor from Table 6.
6.2 Subsurface dissolved P source risk factor (DPRsub)
Enter the value from box 5.5 to the right.
6.3 Subsurface dissolved P transport risk component (SUBSURFACE)
Multiply the value in box 6.1 (SD) times the value in box 6.2 (DPRsub) and enter the product to the right
16 For more information on this and other topics visit the University of Maryland Extension website at www.extension.umd.edu
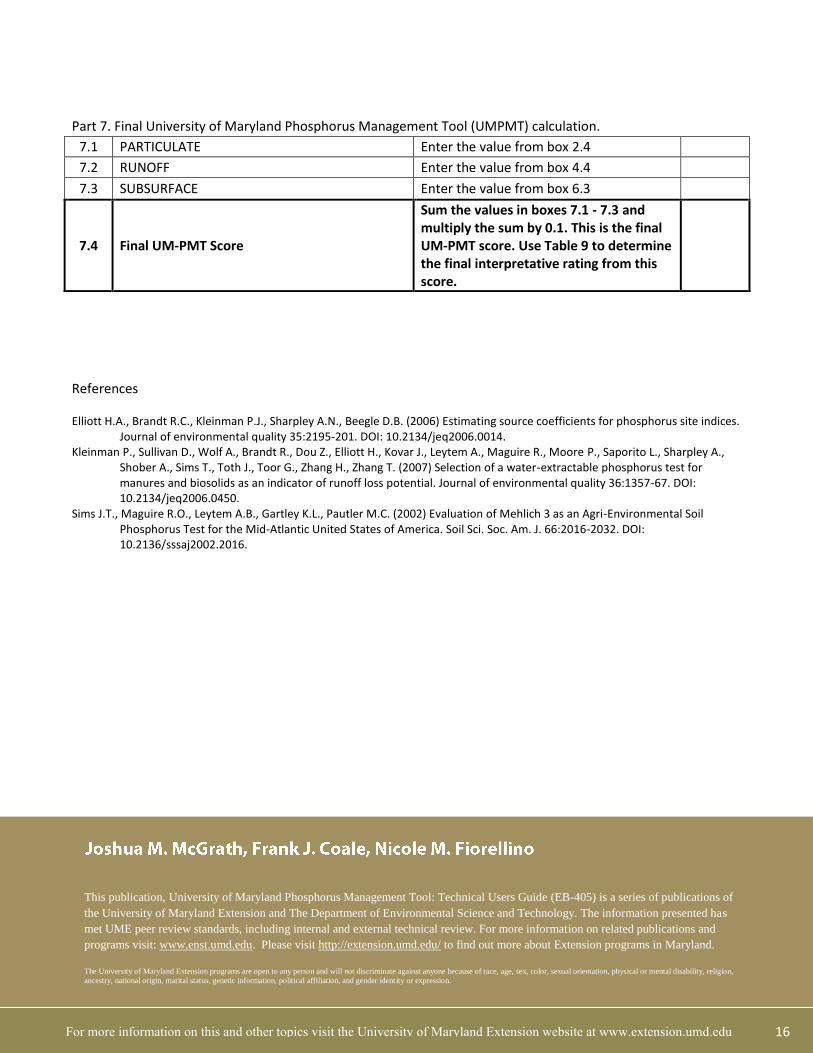
Part 7. Final University of Maryland Phosphorus Management Tool (UMPMT) calculation.
7.1 PARTICULATE Enter the value from box 2.4
7.2 RUNOFF Enter the value from box 4.4
7.3 SUBSURFACE Enter the value from box 6.3
7.4 Final UM-PMT Score
Sum the values in boxes 7.1 - 7.3 and multiply the sum by 0.1. This is the final UM-PMT score. Use Table 9 to determine the final interpretative rating from this score.
References
Elliott H.A., Brandt R.C., Kleinman P.J., Sharpley A.N., Beegle D.B. (2006) Estimating source coefficients for phosphorus site indices. Journal of environmental quality 35:2195-201. DOI: 10.2134/jeq2006.0014.
Kleinman P., Sullivan D., Wolf A., Brandt R., Dou Z., Elliott H., Kovar J., Leytem A., Maguire R., Moore P., Saporito L., Sharpley A., Shober A., Sims T., Toth J., Toor G., Zhang H., Zhang T. (2007) Selection of a water-extractable phosphorus test for manures and biosolids as an indicator of runoff loss potential. Journal of environmental quality 36:1357-67. DOI: 10.2134/jeq2006.0450.
Sims J.T., Maguire R.O., Leytem A.B., Gartley K.L., Pautler M.C. (2002) Evaluation of Mehlich 3 as an Agri-Environmental Soil Phosphorus Test for the Mid-Atlantic United States of America. Soil Sci. Soc. Am. J. 66:2016-2032. DOI: 10.2136/sssaj2002.2016.
This publication, University of Maryland Phosphorus Management Tool: Technical Users Guide (EB-405) is a series of publications of
the University of Maryland Extension and The Department of Environmental Science and Technology. The information presented has
met UME peer review standards, including internal and external technical review. For more information on related publications and
programs visit: www.enst.umd.edu. Please visit http://extension.umd.edu/ to find out more about Extension programs in Maryland.
The University of Maryland Extension programs are open to any person and will not discriminate against anyone because of race, age, sex, color, sexual orientation, physical or mental disability, religion,
ancestry, national origin, marital status, genetic information, political affiliation, and gender identity or expression.