philips technical revie bound... · philips technical review ... it is intended to publish from...
TRANSCRIPT
.. __ .. - ._~._~~~~---~~~----...,....,..---------------~----~-------VOLUME 21, 1959/60, No. 12 pp. 349-376 Published 24th October 1960
Philips Technical ReviewDEALING WITH TECHNICAL PROBLEMS
RELATING TO THE PRODUCTS, PROCESSES AND INVESTIGATIONS OFTHE PHILIPS INDUSTRIES
AN ACOUSTIC SPECTRUM ANALYSER WITH ELECTRONIC SCANNING
by D. J. H. ADMIRAAL *). 534.441.2
In 1957 the Instiuue for Perception Research was founded at Eindhoven. Here, under thedirection of Professor J. F. Schouten, members of the Eindhoven Technische Hogeschool andPhilips are carrying out joint investigations in the fields of human perception and reactionsand information processing.It is intended to publish from time to time in this Review articles dealing with the work
of this Instiuue. The first of these articles describes the way in which an acoustic spectrumanalyser, originally developed in Philips Research Laboratories many years ago, has beenmodernized by means of semiconductor diodes and transistors.
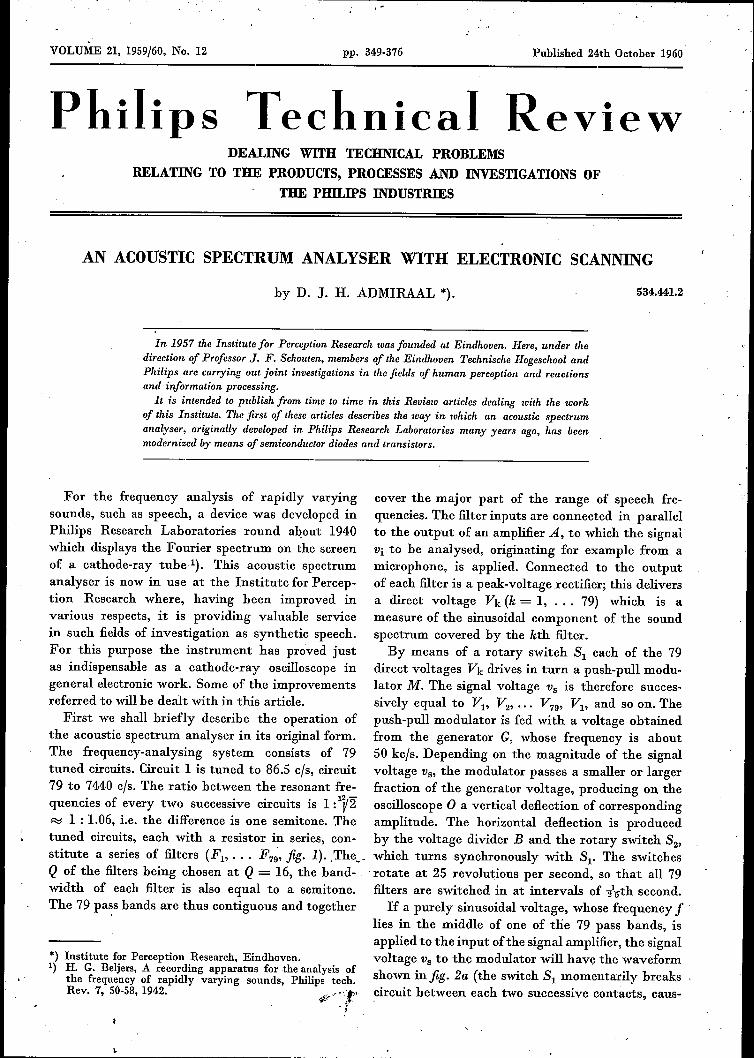
For the frequency analysis of rapidly varying cover the major part of the range of speech fre-sounds, such as speech, a device was developed in quencies. The filter inputs are connected in parallelPhilips Research Laboratories round about 1940 to the output of an amplifier A, to which the signalwhich displays the Fourier spectrum on the screen Vi to be analysed, originating for example from aof a cathode-ray tube-'}, This acoustic spectrum microphone, is applied. Connected to the outputanalyser is now in use at the Institute for Percep- of each filter is a peak-voltage .rectifier; this deliverstion Research where, having been improved in a direct voltage Vk (k = 1, ... 79) which is avarious respects, it is providing valuable service measure of the sinusoidal component of the soundin such fields of investigation as synthetic speech. spectrum covered by the kth filter.For this purpose the instrument has proved just By means of a rotary switch SI each of the 79as indispensable as a cathode-ray oscilloscope in direct voltages Vk drives in turn a push-pull modu-general electronic work. Some of the improvements lator M. The signal voltage Vs is therefore succes-referred to will be dealt with in this article. sively equal to VI' V2,... V79, VI' and so on. The
First we shall briefly describe the operation of push-pull modulator is fed with a voltage obtainedthe acoustic spectrum analyser in its original form. from the generator G, whose frequency is aboutThe frequency-analysing system consists of 79 50 kc/s. Depending on the magnitude of the signaltuned circuits. Circuit 1 is tuned to 86.5 cIs, circuit voltage Vs, the modulator passes a smaller or larger79 to 7440 cIs. The ratio between the resonant fre- fraction of the generator voltage, producing on thequencies of every two successive circuits is 1: 1V2 oscilloscope 0 a vertical deflection of corresponding~ 1 : 1.06, i.e. the difference is one semitone. The amplitude. The horizontal deflection is producedtuned circuits, each with a resistor in series, con- by the voltage divider B and the rotary switch S2'stitute a series of filters (FI" .. F7~' fig. 1).. The~_ which turns synchronously with SI' The switchesQ of the filters being chosen at Q = 16, the band- . rotate at 25 revolutions per second, so that all 79width of each filter is also equal to a semitone. filters are switched in at intervals of ,loth second.The 79 pa~s bands are thus contiguous and together If a purely sinusoidal voltage, whose frequency f
lies in the middle of one of the 79 pass bands, isapplied to the input ofthe signal amplifier, the signalvoltage Vs to the modulator will have the waveformshown in fig. 2a (the switch SI momentarily breakscircuit between each two successive contacts, eaus-
*) Institute for Perception Research, Eindhoven.1) H. G. Beljers, A recording apparatus for the analysis of
the frequency of rapidly varying sounds, Philips tech.Rev. 7, 50-58,1942. . ", /iJ.,'
<P !r. i

,.' I ..
350
Fig. 1. Basic circuit -diagramof Beljers' acoustic spectrumanalyser 1). A signal amplifier.Fl' ... F7D filters which dividethe frequency range from 86.5to 7440 cis into 79 consecutivefrequency bands, each a semi-tone in width, and each pro-vided.with a peak-voltage rec-tifier. G' generator (frequencyapprox. 50 kc/s). M push-pullmodulator, which passes moreof the generator' voltage the.higher is the signal voltageVs; this signal voltage is therectified output of the filters,which are consecutively con-nected to M -via the rotaryswitch SI' The. output voltageVv of M causes the verticaldeflection on the oscilloscopeO.The horizontal deflection isproduced by a pulsed voltageVh (see fig. 2c) derived fromthe voltage divider B via therotary switch S2' Both switches,SI and S2' are mounted on thesame shaft, driven by the motorMot.
'. - ~',.
PHILIPS TECHNICAL REVIEW' VOLUME 21
ing Vs to drop momentarily to zero). It can beseen that, in addition to the filter in whose pass-band the signal frequency f lies, the neighbouringfilters also deliver a voltage. The resultant verticaldeflection voltage Vv from the modulator is thusas shown in fig. 2b. The horizontal deflection voltageVh is shown in fig. 2c (switch 82 also breaks circuitbetween successive contacts; for simplicity it is
}I .","'IIIHllllllllllm~;
)! =onnnDnnJJn~n~~~~-t
d ----+--1-+-+-1--11 +-I-11_f---i-1 If -.3S?
~Mot1351
assumed here that there are only 17 filters). Theoscillogram (spectrogram) takes the shape shownin fig. 2f[, which recalls the deflection patternproduced by a vibrating-reed frequency meter.
The fact that a sinusoidal signal does not produce a single-line spectrum, but a spectrum as shown in fig. 2d, limits theresolving power of this spectrum analyser. A discussion of thissubject, and its relation to the Q of the filter circuits and thetime constant of the smoothing circuits, will be found in thearticle mentioned under 1).
The principal modification of the original appa-ratus is the replacement of the rotary switches byelectronic switches. These have the advantage ofbeing entirely free from mechanical noise, a pointof particular importance in acoustic experiments.Furthermore, they preclude troubles due to badcontacts, which are always a drawback of rotaryswitches in the long run.A photograph of the acoustic spectrum analyser
in its present form is shown infig. 3.
Fig. 2. a) Form of the signal voltage Vs in fig. 1, for a sinusoidalinput signal. _ t
b) Corresponding form ofthe output voltage vvfrom the modu-lator. .c) Pulsed sweep voltage Vh (for simplicity shown here for 17filters instead of 79).d) Form of the oscillogram. At the peak of each pulse (c), Vhis constant for a moment, during which time a vertical line istraced, the length of which corresponds to Vv in (b).
"

1959/60, No. 12 ACOUSTIC SPECTRUM ANALYSER 351
".". ".'~ .~.
"""
Fig. 3. The Beljers acoustic spectrum analyser in its present form at the Institute forPerception Research at Eindhoven.
Replacement of the rotary switch SI
Each contact of the rotary switch SI is replacedby a diode switch, driven by a transistor circuit.The principle of the diode switch is illustrated infig.4a. In the state represented, the cathode of thediode D is at a positive potential in relation to theanode, and therefore the diode passes no current.The output voltage Vo of the circuit is thenRo/(Ro + R) times the input voltage Vi. If, on theother hand, the cathode is earthed (for the presentwe assume this to be done by the switch Q), thediode then constitutes a virtual short-circuit acrossthe resistor Ro, so that Vo R:j O.
In principle, 79 of these electronic switchescan replace the rotary switch SI in fig.1.Vi is therectified voltage Vk of one of the 79 filters, and theoutput Vo represents the voltage Vs that drivesthe modulator. (In this case, since R = Ro, Vs isnot equal to Vk but to tVk.) This means thatmeasures must be taken to. raise the cathodepotential successively to a positive value in eachof the 79 diode circuits.
Before discussing these measures, we must el-aborate somewhat on the circuit of fig. 4a. In thestate when the cathode is earthed the diode is not acomplete short-circuit across Ro, and therefore Vs
is not entirely zero. The result of this would be aspurious background in the spectrogram. Theresidual value of Vs can be reduced to zero, however,
by instead of merely earthing the cathode of D,giving it a small negative bias - large enough toachieve the object, but not too large since that wouldmake the residual value of Vs negative and again
1353
Fig.4. a) When the cathodc of diode D is positively biased at apotential higher than the potential drop across Ro, the diodeis cut off. The output voltage Vo is then Ro/(Ro + R) times theinput voltage Vi. If the cathode is earthed, D constitutes avirtual short-circuit across Ro, and Vo drops almost to zero.b) By adding the diode D' the voltage Vo - when D is con-ducting - can be made exactly zero with the aid of a negativebias on the cathode of D, the value ofwhich is not critical.

352. PHILIPS TECHNICAL REVIEW VOLUME 21
give rise to unwanted deflections. Unfortunately theappropriate bias is not identical for all diodes of thesame type. Nevertheless, it is possible to make dowith a single bias-voltage source for all 79 electronicswitches by connecting a diode D' in series with Ro(fig. 4b). This prevents current flowing through Roin the Wrong direction, and as a result the residualvalue of Vs can no longer go negative. This allowsus to raise the common negative bias to a pointwhere the voltage Vs drops to zero in that electronicswitch where it ,has the highest positive residualvalue; in the other switches the negative bias ishigher' than is necessary, but this can do no harmbecause of the presence of the diodes D'.
Fig. 5 shows a three-fold arrangement of thecircuit in fig. 4b, provided with one common resist-ance Ro. The negative bias is applied to points QI'Q2 and Qa' If these points are given successively acertain positive potential, then Vs becomes succes-sively about tVI' tV2 and tVa'
R
0'0' 0'
1354
Fig. 5. The circuit of fig. 4b, now with three inputs and onecommon output resistor Ro. The diodes are semiconductordiodes.
To produce this circuit with 79 inputs we need2 X 79 diodes. This makes the use of semiconductordiodes, as in fig. 5, highly desirable because of theirmuch smaller heat development and because theydispense with the need for heater-current leads.
In order to produce the ,various sinusoidal com-ponents in their correct ratios in the spectrogram wemust ensure that the ratio Vs : Vk is independent ofthe applied voltage Vk. If the diodes D' were ideal(resistance Ri in the forward direction = 0, resist-ance Rinv in the inverse direction infinite), thiscondition would be fulfilled, because in that caseVs/Vk = Ro/(Ro + R) = éonstant.]n practice, how-ever, we must replace R in this expression byR +Ri, and Ro by the parallel arrangement of Roand Rinv/78. The resistance Ri depends on the cur-rent through the diode (and hence on R), and Rinvdepends on the voltage across the diode. To mini-
mize the effect 'OfRi we must make R much largerthan the value of u; i.e. R > 100 kO for a germa-nium diode, type OA 74, and R > 220 kO for asilicon diode, type OA 202. To prevent Vs becomingmuch smaller .than Vk, we make, as mentionedabove, Ro = R, that is to say Vs Rj 0.5 Vk.
To neutralize the influence of Rinv we must ensure'that * Rinv is much larger than Ro. With Vk =10V the inverse voltage. across 78 diodes D' is approx.5 V. At this voltage, 78 germanium diodes of typeOA 74 in parallel have a resistance of only about50 kO. This is appreciably less th~n Ro, which mustbe at least 100 kO. In this respect silicon diodes,type OA 202, are much better: 78 of these in parallelat 5 V have a resistance of approx. 70 MO, which isvery much larger than Ro = 0.22 MO. For thisreason we decided to use silicon diodes, withR = Ro = 220 kO.
Fig. 6 shows the relation Vs = f(Vk) measuredfor the above-mentioned arrangement. The relationis virtually linear for values of Vk larger than0.3 V. The required proportionality between Vs andVk is adequately approached if a bias of 0.3 V isadded to Vk.
In order that the diode circuits of fig. 5 - pro-vided with 79 inputs - shall each in turn pass therectified filter voltages Vk to the output (with areduction factor of approx. t), the points QI' Q2' .••Q79 must receive successively a specific positive volt-age, and during the rest of the time remain at thenegative potential mentioned above. This is doneautomatically by means of a flip-flop circuit con-
2,OV
1l1r!220k.f),
1,6
-5 -4 -3 -2 -1
1355
Fig. 6. Output voltage Vs as a function of the input voltage Vkfor the circuit on the left, using a silicon diode OA 202. Inthe forward direction the relation is linear for Vk > 0.3 V.(Note the different scales of the positive and negative Vs axes.)
nected to each diode D; this arrangement is illus-trated in jig. 7. The 79 flip-flop circuits are iden-tical and are coupled one with the other to form aring circuit. They are supplied with a direct voltageof approx. 12 V.
'.
1959/60, No. 12 ACOUSTIC SPECTRUM ANALYSER 353
r12V
Q.] I1.3V
~V~ ~L~'_----~~--~ -+ -+ 4- ___5VITt
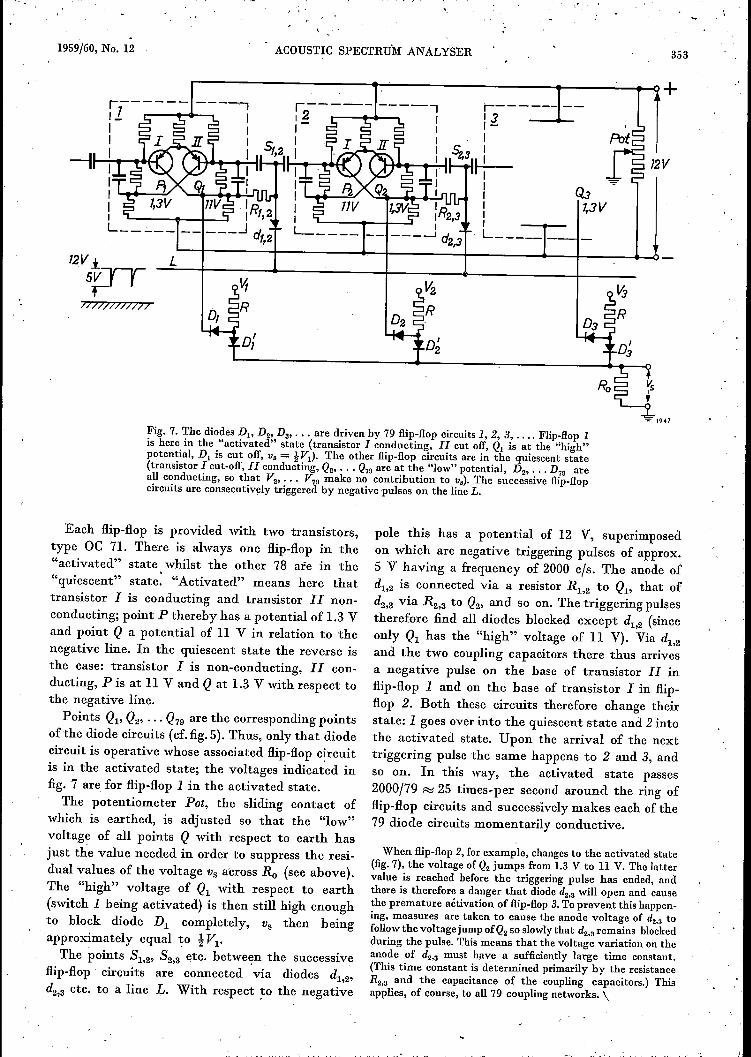
Fig. 7. The diodes Dl>D2, Da, .•. are driven by 79 flip-flop circuits 1, 2, 3, . '" Flip-flop 1is here in the "activated" state (transistor 1 conducting, 11 cut off, Ql is at the "high"potential, Dl is cut off, Vs = tV1)' The other flip-flop circuits are in the quiescent state(transistor 1 cut-off, 11conducting, Q2' ••• Q7D are at the "low" potential, D2, ••• D7D areall conducting, so that V2,... V7D make no contribution to vs). The successive flip-flopcircuits are consecutively triggered by negative pulses on the line L.
17)/)7)/)//)
Df
Each flip-flop is provided with two transistors,type OC 71. There is always one flip-flop in the"activated" state whilst the other 78 are in the"quiescent" state. "Activated" means here thattransistor I is conducting and transistor 11 non-conducting; point P thereby has a potential of 1.3 Vand point Q a potentialof 11 V in relation to thenegative line. In the quiescent state the reverse isthe case: transistor I is non-conducting, 11 con-ducting, P is at 11 V and Q at 1.3 V with respect tothe negative line.
Points Ql' Q2' •.• Q79 are the corresponding pointsof the diode circuits (cf. fig. 5). Thus, only that diodecircuit is operative whose associated flip-flop circuitis in the activated state; the voltages indicated infig. 7 are for flip-flop 1 in the activated state.The potentiometer Pot, the sliding contact of
which is earthed, is adjusted so that the "low"voltage of all points Q with respect to earth hasjust the value needed in order to suppress the resi-dual values of the voltage Vs across Ro (see above).The "high" voltage of Ql with respect to earth(switch 1 being activated) is then still high enoughto block diode Dl completely, Vs then beingapproximately equal to tv1,The points 81,2' 82,3 etc. hetween the successive
flip-flop : circuits are connected via diodes d1,2'd2,3 etc. to a line L. With respect ~o the negative
D~
pole this has a potentialof 12 V, superimposedon which are negative triggering pulses of approx.5 V having a frequency of 2000 el«. The anode ofd1,2 is connected via a resistor R1,2 to Q1' that ofd2,3 via R2,3 to Q2' and so on. The triggering pulsestherefore find all diodes blocked except d1,2 (sinceonly Q1 has the "high" voltage of 11 V). Via d1,2and the two coupling capacitors there thus arrivesa negative pulse on the base of transistor 11 inflip-flop 1 and on the base of transistor I in flip-flop 2. Both these circuits therefore change theirstate: 1 goes over into the quiescent state and 2 intothe activated state. Upon the arrival of the nexttriggering pulse the same happens to 2 and 3, andso on. In this way, the activated state passes2000/79 ~ 25 times-per second around the ring offlip-flop circuits and successively makes each of the79 diode circuits momentarily conductive.
When flip-flop 2, for example, changes to the activated state(fig.7), the voltage of Q2 jumps from 1.3 V to 11 V. The lattervalue is reached before the triggering pulse has ended, andthere is therefore a danger that diode d2•a will open and causethe premature aêtivation of flip-flop 3.To prevent this happen-ing, measures are taken to cause the anode voltage of d2,3 tofollowthe voltage jump of Q2 so slowlythat d2,aremains blockedduring the pulse. This means that the voltage variation on theanode of d2,3 must have a sufficiently large time constant.(This time constant is determined primarily by the resistanceR2,3 and the capacitance of the coupling capacitors.) Thisapplies, of course, to all 79 coupling networks. \

354 . PHILlPS TECHNICAL REVIEW VOLUME 21
, ' The triggering puls~~ are derived by ,differenti-ation from a square-wave voltage generated by amultivibrator, using a double triode, type E 88 CC.Between the multivibrator and the line L a tran-sistor type OC 77 is connected as an emitter-follower for \nátching between the impedances.
Replacement of the rotary switch 82
A pulsed sweep voltage, like that obtained fromthe rotary switch 82 (fig. 1) for the horizontal de-flection (fig. 2c), is not easy to produce by electronicmeans. Other waveforms can be used, however,such as a staircase or a sawtooth waveform. Astaircase voltage is again difficult to produce elec-tronically 2), whereas a sawtooth voltage is fairlysimple to generate. Fig. Ba shows the appearance of
g """111111111111111111111111111111111111111111111111-t
'" III III 111111"111111 III III__._.f 1357
Fig. 8. a) Form of the spectrum of a sinusoidal voltage whenthe horizontal deflection is produced by a sawtooth voltage.b) The same, but now with the electron beam of the C.R.T.periodically suppressedfor! ms each tmsby means ofa square-wave voltage of 2000cis applied to the control grid of the oscil-loscope. Each "bar" is in fact a sine wave train of about12 cycles of the 50 kcls voltage, but appears to the eye as asingle vertical line.
a spectrogram of a sinusoidal signal when a saw-tooth voltage is used for the horizontal deflection.A spectrogram of this kind is just as useful as theline spectrum obtained with the original apparatus(fig.2d), but it is somewhat less suggestive. For thisreason an attempt has been made to approximateto the' latter spectrum in the following way. Theoscilloscope tube is kept just below cut-off by anegative bias on the control grid, but the beamsuppression is lifted once in every half cycle by asquare-wave strobe voltage of 2000 cis applied tothe same electrode; this strobe voltage is derivedfrom the multivibrator mentioned above. Duringevery half millisecond, therefore, the electron beam
2) See e.g. Philips tech. Rev. 12, 288, 1950/51.
is present for only i millisecond. The effect of thison the spectrogram of a sinusoidal signal is shownin fig. 8b. The individual "bars" are not sharplines as in fig. 2d, but sinusoidal wave trains ofabout 12 cycles of the voltage from generator G(fig. l);which has a frequency of about 50 kc/s; thedifference, however, is scarcely perceptible inpractice.
The sawtooth voltage is generated by a Millerintegrator based on a transitron-connected pentode(EF 8P) 3). Free-running the circuit has a frequencyof approx. 20 cis: When the 79th flip-flop circuitreturns from the activated to the quiescent state,it produces pulses with a repetition frequency of2000/79 R:i 25 per second; these pulses are used tosynchronize the transitron.
It is necessary to make the flyback time as shortas possible since the information delivered by the,filter circuits that come into operation during theflyback is lost. With this in view the capacitor inthe sawtooth generator is made, to charge up ex-tremely rapidly through a cathode follower (one halfof a double triode E 88 CC), which is driven by thetransitron-Miller. In this way the flyback time hasbeen reduced to less than 0.25 ms, i.e. less than0.6% ofthe sawtooth period. (In a normal sawtoothgenerator the flyback time is generally about 10%.)
The short flyback time gave rise to a difficulty which, how-ever, it proved possible to overcome completely. The difficultyis most evident if the input signal is a sinusoidal voltage witha frequency of 7440 cis (the resonance frequency of the 79thfilter network). The spectrogram then appears as illustratedinfig. 9. The deflections on the left of the spectrum create thefalse impression that the input signal also contains low-fre-quency components. This is particularly troublesome if theinput signal really possesses a complicated spectrum.
-f 1358
Fig. 9. Spectrogram of a sinusoidal voltage of frequency 7440cis. The deflections on the left suggest the presence of low-frequency components. They are due to' the stray capacitancein parallel with Ro being unable to discharge rapidly enough(cf. fig. 10).
3) A transitron circuit is one of the pentode circuits withwhich a negative resistance is obtained; see for exampleF. E. Terman , Radio Engineer's Handbook, McGráw-Hill,London 1950, p. 318. A Miller integrator based on a tran-sitron (see e.g. F. Kerkhof and W. Werner, Television,Philips Technical Library, 1952, p. 138 et seq.) producesa sawtooth generator that gives a very linear sawtoothwave-form.
I
i

1959/60, No. 12 ACOUSTIC SPECTRUM ANALYSER 355
Fig. 12. The two sides of a printed-wiring board (42 X 76 mm), containing a diode switchcircuit (D, D' and R), the associated flip-flop circuit and the components for couplingto the next stage. The board is held by spring contact clips, which serve as electricalconnections to the rest of the circuit.
The effect is due to the presence of an appreciable straycapacitance Cp in parallel with the resistor R; across which thesignal voltage Vs for the modulator appears. (This stray capaci-tance consists mainly of wiring capacitance and the totalcapacitance of the diodes connected to Ro.) The measured val ueof Cp was about 1500 pF, and with Ro = 220 kf2 this gives atime constant RoCp of 0.33 ms. In the flyback time of about0.25 ms the voltage across Cp therefore drops only in the ratioof 1: e-O.25jO.33 = 1: 0.47, and the deflection at the extremeleft will consequently still be almost half as large as the de-flection at the extreme right.
In principle the unwanted deflection on the left can bereduced in the following ways:1) By reducing Cp; this, however, proved to be impracticable.2) By reducing Ro, though at the expense of sensitivity.3) By lengthening the flyhack time, which would mean losing
part of the spectrum; to remedy this, the ring would haveto be extended by some additional flip-flop circuits.
4) By making Cp discharge rapidly during the flyback withthe aid of some kind of switch.
The latter method proved to be a satisfactory solution. Theswitch used is a transistor (fig. 10) which is normally in the cut-off state but is made to conduct momentarily by the synchro-
Fig. 10. The stray capacitance Cp (approx. 1500 pF) in parallelwith the resistor Ro (220 kO) is rapidly discharged, during theflyback, through the transistor T (N-P-N transistor, type DC139) which is periodically made to conduct by synchronizingpulses applied to its base. The synchronizing pulses are takenfrom the 79th flip-flop circuit. This arrangement suppressesthe effect shown in fig. 9. (The diodes should be markedD77', D7s', D7/')
1315
Fig. 11. Examples of spectrograms recorded on the acousticspectrum analyser described in tills article.a) Fourier spectrum of a pulse.b) Idem, with suppressed fundamental component.c) As (a), with second harmonic suppressed.
nizing pulse to the sawtooth generator during every flyback;this pulse originates from the 79th flip-flop circuit. The polarityof the voltages makes it necessary to use an N-P-N transistor,type DC 139.
1314

356 PHILIPS TECHNICAL REVIEW VOLUME 21
Photographs of a number of spectrograms areshown in jig. lla, band c. It will be noticed that(cf. fig. 2d) the negative deflections are now sup-pressed. This has the advantage of allowing thehorizontal axis to be lower on the oscilloscope screen,enabling the positive deflections to be made larger.
yser use is made of printed wiring 4). For example,the 79 diode circuits with their flip-flop circuitsare each assembled on a printed-wiring board42 X 76 mm (jig. 12). The boards are held in placeby spring clips which also constitute the electricalcontacts. In this way the individual circuits are
v ,[;E ol
Fig. 13. Rear view of the intcrior of the acoustic spectrum analyser, showing the printed-wiring boards, one of which appears in fog. 12.
It should bc mentioned in conclusion that thefull width of the spectrum need not always extendfrom 86.5 to 7440 cis; a smaller frequency band canbe covered, which can then be displayed over thefull width of the screen.
Constructional features
In many circuits of the acoustic spectrum anal-
easily removable for testing and change wherenecessary. Fig. 13 shows the boards in position inthe apparatus, showing the neat, compact andaccessible assembly.Various pilot lamps are fitted to facilitate the
localization of faults.
4) See e.g. Philips tech. Rev. 20, 113, 1958/59.
Summary. Beljers's acoustic spectrum analyser contains 79filters whose pass bands, each a semi-tone in width, conse-cutively cover a frequency range from 86.5 to 7440 el«. In theoriginal apparatus (of 1942) a rotary switch was used for caus-ing each of the filter voltages to produce successive verticaldeflections on an oscilloscope, and a second rotary switch wasused to make the horizontal deflection increase stepwise
logarithmically with the frequency. In the Institute for Per-ception Research at Eindhoven the apparatus has been modern-ized, one of the improvements being the replacement of bothswitches by silently-operating electronic switches using semi-conductor diodes and transistors. Use is also made of printedwiring.