philippa wilding and pat webb how to demonstrate the impact of pupil premium funding with sims
TRANSCRIPT
Philippa Wilding and Pat Webb
How to demonstrate the impact of pupil premium funding with SIMS
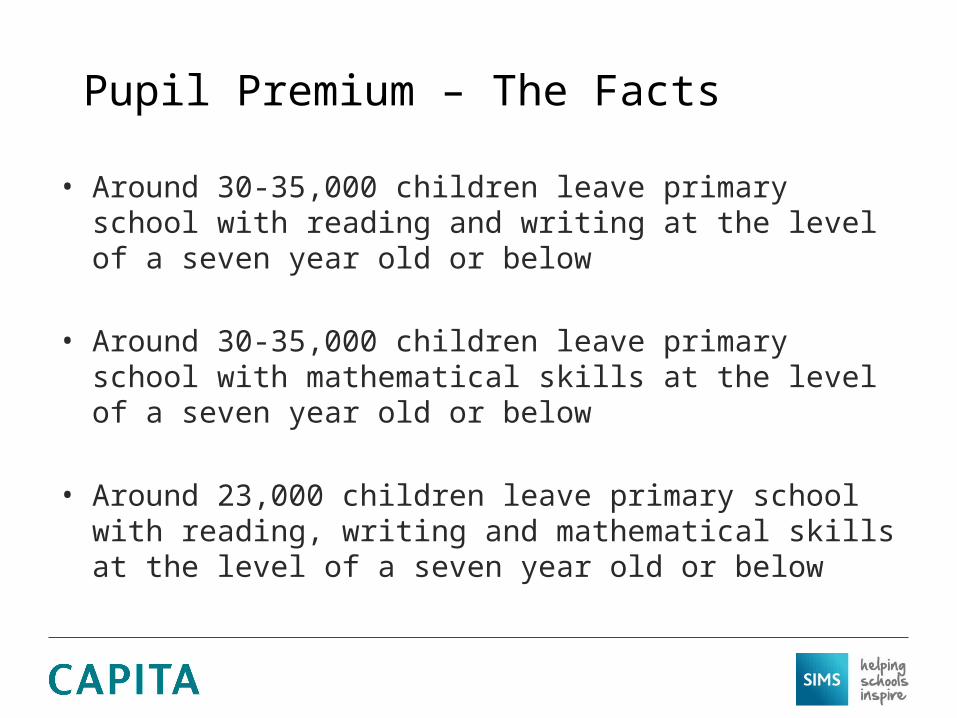
Pupil Premium – The Facts
• Around 30-35,000 children leave primary school with reading and writing at the level of a seven year old or below
• Around 30-35,000 children leave primary school with mathematical skills at the level of a seven year old or below
• Around 23,000 children leave primary school with reading, writing and mathematical skills at the level of a seven year old or below

Pupil Premium Eligibility
• Reception to Year 11 Pupils
• Pupils registered as FSM in last 6 years - FSM 6
(1.77 million pupils)
• Children in Care – CLA
(40,566 pupils)
• Children in service families (45,070 pupils)

Characteristics of Pupil Premium Students

John Hattie, Director, Melbourne Education Research Institute
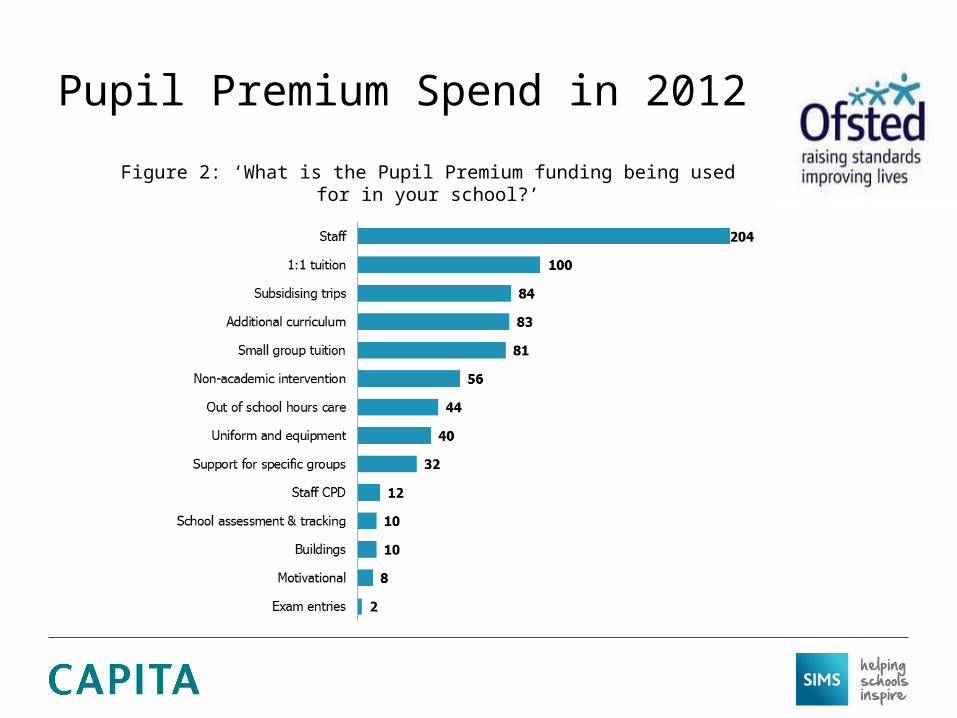
Pupil Premium Spend in 2012
Figure 2: ‘What is the Pupil Premium funding being used for in your school?’
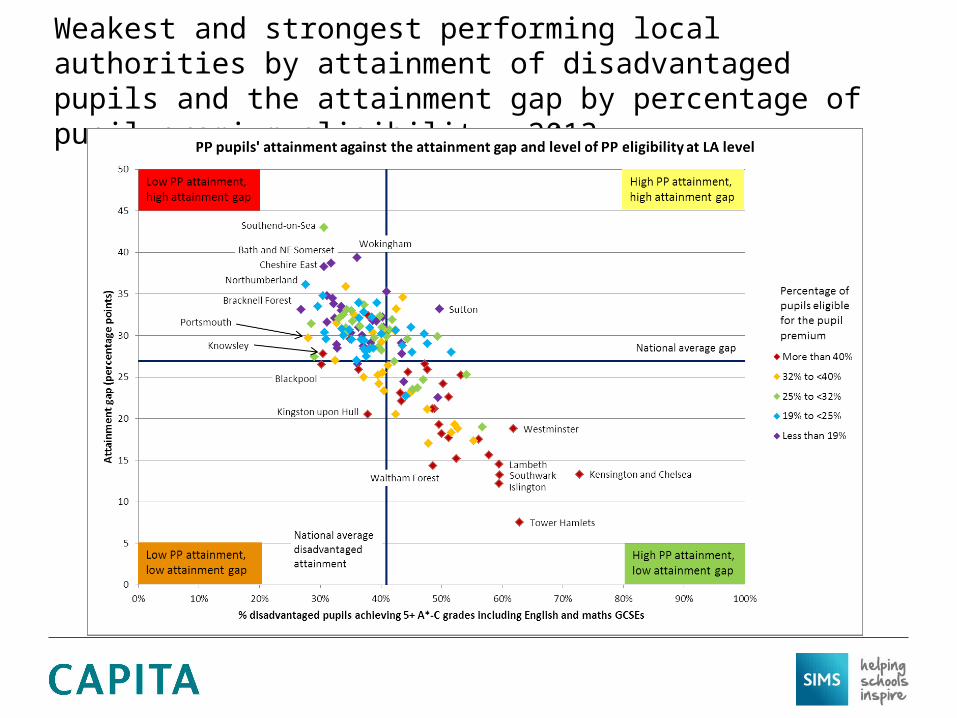
Weakest and strongest performing local authorities by attainment of disadvantaged pupils and the attainment gap by percentage of pupil premium eligibility, 2013

Challenges
• Accurate identification of Pupil Premium students
• Identifying the gaps in progress and attainment
• Evidencing the impact of interventions and spend
• What single functionality would you want added to SIMS?
Demonstrating Improved Outcomes
“Many schools still lack good enough systems for tracking the spending of the additional funding or for evaluating the effectiveness of measures they have put in place in terms of improving outcomes”
Ofsted 2013

School Improvement Programme
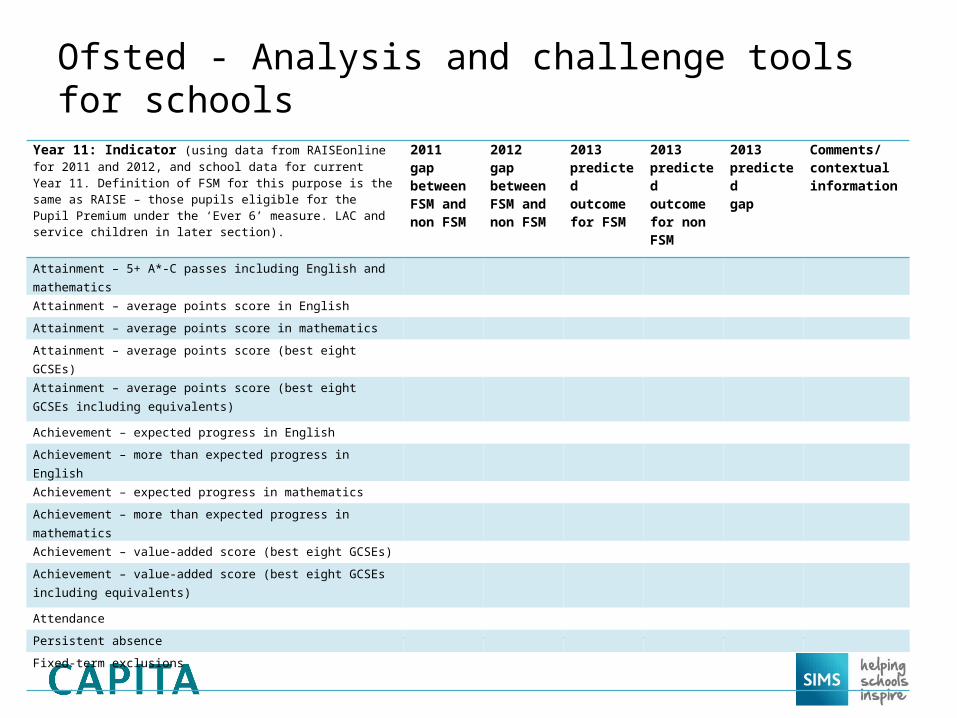
Ofsted - Analysis and challenge tools for schools
Year 11: Indicator (using data from RAISEonline for 2011 and 2012, and school data for current Year 11. Definition of FSM for this purpose is the same as RAISE – those pupils eligible for the Pupil Premium under the ‘Ever 6’ measure. LAC and service children in later section).
2011 gap between FSM and non FSM
2012 gap between FSM and non FSM
2013predicted outcome for FSM
2013predicted outcome for non FSM
2013predicted gap
Comments/contextual information
Attainment – 5+ A*-C passes including English and mathematics
Attainment – average points score in English
Attainment – average points score in mathematics
Attainment – average points score (best eight GCSEs)
Attainment – average points score (best eight GCSEs including equivalents)
Achievement – expected progress in English
Achievement – more than expected progress in English
Achievement – expected progress in mathematics
Achievement – more than expected progress in mathematics
Achievement – value-added score (best eight GCSEs)
Achievement – value-added score (best eight GCSEs including equivalents)
Attendance
Persistent absence
Fixed-term exclusions
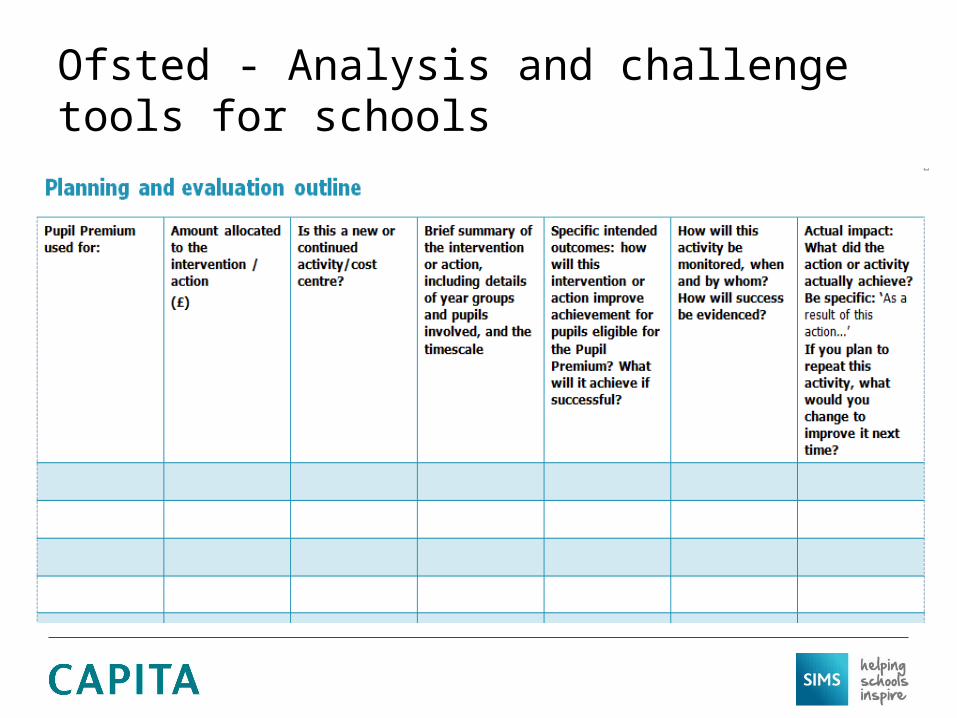
Ofsted - Analysis and challenge tools for schools

Preparing for Inspection
• % improvement in performance national/teacher assessments
• Increases in reading/number age or standardised test scores
• % improvement in attendance/punctuality
• % reduction in behaviour incidents recorded
• % increase in parents participating in school events

Contact
Pat Webb, Education Strategy Manager
07703 396501
Philippa Wilding, Head of School Improvement